
Rapport sur le marché mondial des batteries pour véhicules électriques, taille et prévision 2026-2033
Aperçu de la prévision du marché mondial des batteries pour véhicules électriques 2026-2033
| Indicateur | Valeur |
|---|---|
| Année de base | 2025 |
| Taille du marché en année de base | 91,7 milliards de dollars US |
| Période de prévision | 2026 – 2033 |
| Direction du marché | Fortement positive |
| Taux de croissance annuel moyen de base | 19.03% |
| Point final de base (2033) | 369,5 milliards de dollars US |
| Taux de croissance annuel moyen optimiste | 21.53% |
| Taux de croissance annuel moyen conservateur | 16.53% |
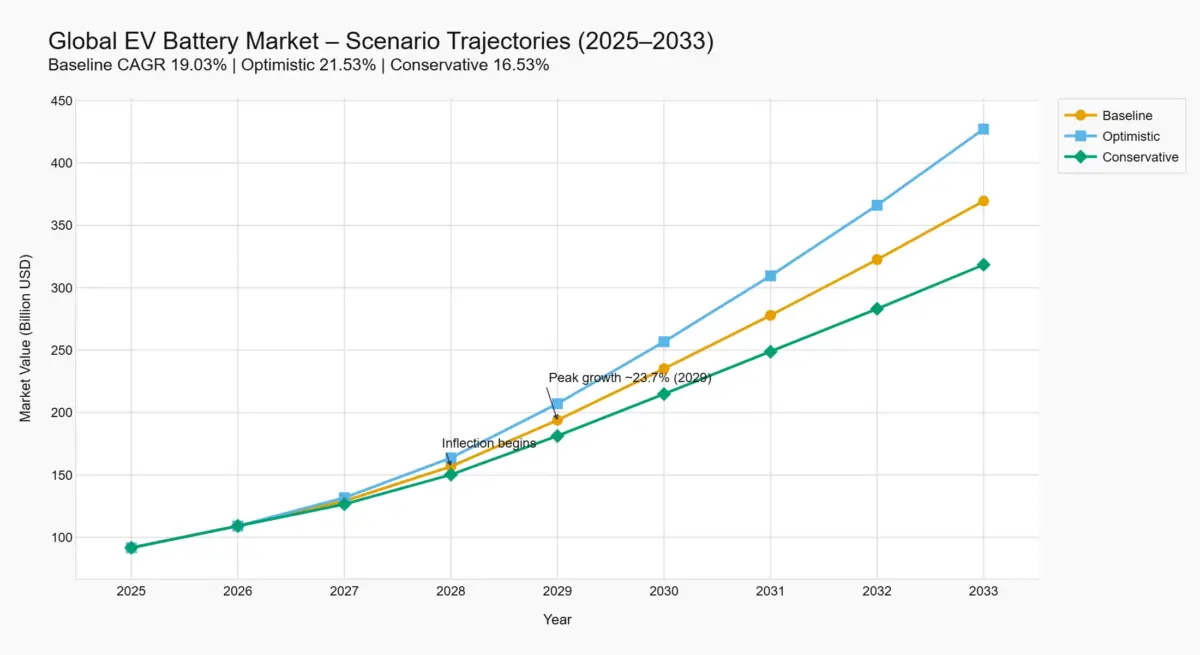
| Forme de croissance | Croissance frontale ; croissance annuelle maximale d'environ 23,7 % en 2029 (scénario de base) |
| Région la plus importante (indicative) | Asie-Pacifique (la Chine, le Japon et la Corée du Sud dominent la fabrication de cellules) |
| Région la plus dynamique (indicative) | Amérique du Nord et Europe (localisation de la capacité par les politiques) |
| Segment principal par part de marché (indicative) | Cellules de batterie lithium-ion (niveau de valeur le plus important) |
| Tendances clés | Investissements de capacité frontaux, intégration verticale par les OEM, déplacement vers la chimie LFP, coûts de conformité réglementaire |
| Axes d'avenir | Localisation de la chaîne d'approvisionnement, conformité aux passeports de batterie, diversification des chimies de nouvelle génération |
Aperçu du marché et cadre des scénarios
Le marché mondial des batteries pour véhicules électriques est défini comme les cellules, modules et packs de batterie lithium-ion utilisés dans les véhicules électriques, y compris les voitures, les deux-roues, les trois-roues, les bus et les camions, pour la période 2026–2033. Le marché était estimé à une taille de marché de 91,7 milliards de dollars US en 2025.Trajectoire prévue du marché des batteries pour véhicules électriques
1 : Scénario de base (Taux de croissance annuel moyen de 19,03 %) : le marché atteint 369,5 milliards de dollars US d'ici 2033, tiré par les investissements de capacité frontaux, les réglementations favorables et la maturité technologique. 2 : Scénario optimiste (Taux de croissance annuel moyen de 21,53 %) : suppose une adoption plus rapide des technologies et un soutien politique accéléré sans retards matériels. 3 : Scénario conservateur (Taux de croissance annuel moyen de 16,53 %) : reflète les risques liés à la concentration de l'offre en amont, à la dépendance aux équipements chinois et aux obstacles réglementaires qui pourraient retarder les ramp-ups et compresser les marges. Les trois scénarios partagent une forme de croissance frontale : la croissance annuelle accélère de 18,27 % en 2027 à un pic de 23,67 % en 2029 dans le scénario de base, puis décélère à mesure que le marché mûrit et que les facteurs de risque exercent un frein négatif croissant.Points clés
-
- Le marché est projeté pour passer de 91,7 milliards de dollars US en 2025 à 369,5 milliards de dollars US d'ici 2033 dans le scénario de base, avec un pic de croissance frontale proche de 24 % en 2029.
-
- Les extensions de capacité annoncées par Samsung SDI, Volkswagen, LG-Honda, Umicore et Albemarle soutiennent collectivement l'accélération initiale ; la plupart des installations commencent à produire entre 2024 et 2027, correspondant à l'accélération modélisée en 2027–2029.
-
- Les risques en amont représentent le plus grand facteur de baisse non modélisé : le DRC fournit environ 70 % du cobalt, la Chine contrôle plus de 90 % du traitement du graphite et 60 à 70 % de l'affinage du lithium, et les fournisseurs chinois dominent l'équipement de production de cellules.
-
- Le calendrier de conformité à la réglementation sur les batteries de l'UE – passeport de batterie d'ici février 2027, objectifs de contenu recyclé à partir de 2031 – ajoute des coûts fixes non pris en compte dans les taux de croissance.
Prévisions de croissance du marché année par année
| Année | Valeur du marché (milliards de dollars US) | Taux de croissance annuel (%) |
|---|---|---|
| 2025 | 91.7 | — |
| 2026 | 109.15 | 19.03 |
| 2027 | 129.09 | 18.27 |
| 2028 | 156.80 | 21.46 |
| 2029 | 193.91 | 23.67 |
| 2030 | 235.19 | 21.29 |
| 2031 | 277.95 | 18.18 |
| 2032 | 322.56 | 16.05 |
| 2033 | 369.50 | 14.55 |
Élargissement de la capacité et alignement des moteurs
pour la prévision du marché des batteries pour véhicules électriques, l'accélération précoce est soutenue par une vague d'engagements de capital annoncés par les fabricants de batteries et les constructeurs automobiles. Le tableau suivant résume les principaux projets du côté de l'offre tirés des annonces des entreprises et des actualités de l'industrie.| Entreprise / JV | Emplacement | Capacité | Investissement | Démarrage de la production | Année de prévision affectée le plus directement |
|---|---|---|---|---|---|
| Samsung SDI | Seremban, Malaisie | Non divulgué (cellules 21700) | 1,7 trillion de won (~1,3 milliard de USD) | 2024 | 2027–2028 (accélération) |
| Volkswagen (PowerCo) | Salzgitter, Allemagne | 20 GWh (expandable à 40 GWh) | ~2 milliard d'euros | Fin 2025 | 2027–2029 |
| LG-Honda JV (L-H Battery) | Ohio, États-Unis | 40 GWh | 3,5–4,4 milliards de USD | Fin 2025 | 2027–2029 |
| Umicore | Loyalist, Ontario, Canada | 35 GWh équivalent (CAM) | 1,27 milliard d'euros (0,69 milliard après subventions) | Fin 2025 (mise en service) | 2027–2029 |
| GM–LG Ultium Cells (maintenant propriété de LG) | Lansing, Michigan, États-Unis | 50 GWh | ~2,6 milliard de USD | En construction depuis 2022 | 2027–2029 |
| Mitsubishi Chemical | Kagawa, Japon | 11 000 tonnes/an de matériau d'anode | Non divulgué | Octobre 2026 | 2027–2030 |
| Albemarle | Comté de Chester, Caroline du Sud, États-Unis | 50 000–100 000 mt/an de LiOH | Au moins 1,3 milliard de dollars américains | Objectif 2024–2025 | 2027–2030 |
Risques, Hypothèses et Limites
Bien que les preuves soutiennent une perspective positive forte, la trajectoire de la prévision dépend de plusieurs risques structurels et d'hypothèses non résolues.Concentration en amont
Le Congo Démocratique fournit environ 70 % du cobalt mondial ; un dysfonctionnement d'une plateforme de douane en juillet 2026 a menacé de bloquer jusqu'à 20 000 tonnes métriques de cobalt, soit 1,1 milliard de dollars américains. La Chine contrôle plus de 90 % de la production de graphite sphérique et 60 à 70 % de la raffinerie chimique de lithium. La part de traitement du nickel en Indonésie a bondi à environ 60 % en 2024. Ces risques de points de défaillance uniques ne sont pas entièrement modélisés dans les taux de croissance.Dépendance aux équipements en provenance de Chine
Les fournisseurs chinois dominent l'équipement de production de cellules de batterie – machines de revêtement, calandrage, découpage et bobinage. Selon le Carnegie Endowment for International Peace, la capacité de fabrication de cellules chinoise pourrait atteindre au moins 5 862 GWh d'ici 2030, plus du triple de la capacité combinée de l'OCDE. Toute escalade des restrictions commerciales pourrait bloquer les délais des usines gigafactory occidentales.Coûts de conformité aux réglementations de l'UE
La réglementation sur les batteries de l'UE exige un passeport numérique du produit d'ici le 18 février 2027, des objectifs de contenus recyclés pour le cobalt (16 %), le lithium (6 %) et le nickel (6 %) à partir de 2031, ainsi que des obligations de récupération des matières. Les frais de conseil pour la conformité s'élèvent à 80 000 à 120 000 euros par fabricant, avec des coûts internes de personnel de 60 000 à 80 000 euros. Ces coûts ne sont pas explicitement pris en compte dans la prévision.Table des matières
- 1. Résumé exécutif
- 1.1 Aperçu du marché (2025–2033)
- 1.2 Points clés de croissance
- 1.3 Cadre de scénario du marché
- 1.4 Principaux enseignements de la prévision
- 1.5 Point de vue de l'analyste
- 2. Aperçu du marché
- 2.1 Introduction au marché mondial des batteries pour véhicules électriques
- 2.2 Définition du marché et périmètre
- 2.3 Écosystème du marché
- 2.4 Analyse de la chaîne de valeur industrielle
- 2.5 Évolution du marché et tendances historiques
- 2.6 Cadre de scénario du marché (2025–2033)
- 3. Aperçu de la prévision du marché mondial des batteries pour véhicules électriques (en milliards de dollars), 2025–2033
- 3.1 Taille du marché pour l'année de base (2025)
- 3.2 Prévision de base du marché (2033)
- 3.3 Taux de croissance annuel composé (CAGR) de la prévision (2026–2033)
- 3.4 Plus grande région
- 3.5 Région en croissance la plus rapide
- 3.6 Plus grand segment de marché
- 3.7 Principales tendances du marché
- 3.8 Axe de développement du marché futur
- 4. Analyse du scénario du marché mondial des batteries pour véhicules électriques
- 4.1 Scénario de base
- 4.2 Scénario optimiste
- 4.3 Scénario conservateur
- 4.4 Prévision du marché année par année (2025–2033)
- 4.5 Analyse des points d'inflexion de la croissance (2027–2029)
- 4.6 Méthodologie de prévision
- 5. Dynamiques du marché
- 5.1 Facteurs moteurs du marché
- 5.2 Freins du marché
- 5.3 Opportunités du marché
- 5.4 Défis du marché
- 5.5 Tendances émergentes du marché
- 6. Pipeline d'expansion de capacité et investissements de l'industrie
- 6.1 Pipeline mondial d'expansion de capacité
- 6.2 Principaux investissements dans les gigafactory
- 6.3 Incitations gouvernementales et politiques de localisation
- 6.4 Paysage des investissements technologiques
- 6.5 Développement de la capacité concurrentielle
- 7. Analyse de la segmentation du marché approfondie
- 7.1 Segmentation de la hiérarchie des produits
- 7.1.1 Cellules de batterie
- 7.1.2 Modules de batterie
- 7.1.3 Pack de batterie
- 7.1.4 Stratégie d'intégration verticale
- 7.1.5 Systèmes de batteries à deuxième vie
- 7.2 Analyse de la chimie et des matériaux des batteries
- 7.2.1 Batteries NMC
- 7.2.2 Batteries LFP
- 7.2.3 Batteries NCA
- 7.2.4 Batteries LMO
- 7.2.5 Chimies de batteries émergentes
- 7.3 Chaîne d'approvisionnement en matières premières
- 7.3.1 Lithium
- 7.3.2 Cobalt
- 7.3.3 Nickel
- 7.3.4 Graphite
- 7.3.5 Manganèse
- 7.3.6 Matériaux actifs du cathode
- 7.3.7 Matériaux actifs de l'anode
- 7.3.8 Électrolytes et séparateurs
- 7.4 Analyse de la chaîne d'approvisionnement régionale
- 7.4.1 Centre de fabrication de l'Asie-Pacifique
- 7.4.2 Localisation en Amérique du Nord
- 7.4.3 Écosystème des batteries en Europe
- 7.1 Segmentation de la hiérarchie des produits
- 8. Segmentation du marché par type de batterie (en milliards de dollars), 2026–2033
- 8.1 Batteries au lithium-ion
- 8.2 Batteries à état solide
- 8.3 Batteries au nickel-métal hydride (NiMH)
- 8.4 Technologies de batteries émergentes
- 9. Segmentation du marché par type de véhicule (en milliards de dollars), 2026–2033
- 9.1 Véhicules électriques (VE)
- 9.2 Véhicules hybrides rechargeables (PHEV)
- 9.3 Véhicules hybrides (HEV)
- 9.4 Deux et trois roues électriques
- 10. Segmentation du marché par capacité de batterie (en milliards de dollars), 2026–2033
- 10.1 En dessous de 30 kWh
- 10.2 30–60 kWh
- 10.3 60–100 kWh
- 10.4 Plus de 100 kWh
- 11. Segmentations du marché par utilisateur final (en milliards de dollars), 2026–2033
- 11.1 Constructeurs automobiles
- 11.2 Fabricants de batteries
- 11.3 Opérateurs de flottes
- 11.4 Stockage d'énergie et applications de deuxième vie
- 12. Segmentations du marché par région (en milliards de dollars), 2026–2033
- 12.1 Amérique du Nord
- 12.2 Europe
- 12.3 Asie-Pacifique
- 12.4 Amérique latine
- 12.5 Moyen-Orient et Afrique
- 13. Analyse du marché régional
- 13.1 Asie-Pacifique
- 13.2 Amérique du Nord
- 13.3 Europe
- 13.4 Amérique latine
- 13.5 Moyen-Orient et Afrique
- 14. Environnement réglementaire
- 14.1 Réglementation européenne des batteries
- 14.2 Conformité au passeport des batteries
- 14.3 Règlements de l'US EPA et du DOT
- 14.4 Normes et politiques chinoises GB/T et MIIT
- 14.5 Cadre de diligence raisonnable de l'OCDE
- 15. Paysage concurrentiel
- 15.1 Structure du marché
- 15.2 Analyse de la part de marché
- 15.3 Positionnement concurrentiel
- 15.4 Développements stratégiques
- 15.5 Benchmarking de l'innovation
- 16. Profils des entreprises
- 16.1 CATL
- 16.2 BYD
- 16.3 LG Energy Solution
- 16.4 Panasonic Holdings Corporation
- 16.5 Samsung SDI
- 16.6 SK On
- 16.7 Tesla, Inc.
- 16.8 Volkswagen PowerCo
- 16.9 Umicore
- 16.10 Albemarle Corporation
- 17. Paysage technologique
- 17.1 Technologies des cellules de batterie
- 17.2 Systèmes de gestion de batterie (BMS)
- 17.3 Technologies de gestion thermique
- 17.4 Technologies de fabrication
- 17.5 Technologies de batterie de nouvelle génération
- 18. Évaluation des risques et opportunités stratégiques
- 18.1 Risques liés à l'approvisionnement en matières premières
- 18.2 Risques liés à la dépendance aux équipements
- 18.3 Risques liés à la conformité réglementaire
- 18.4 Opportunités d'investissement
- 18.5 Opportunités de croissance future
- 19. Annexe
- 20. À propos de Pheonix Research
- 21. Avertissement
Paysage concurrentiel
Marché mondial des batteries pour véhicules électriques : paysage concurrentiel
Points clés
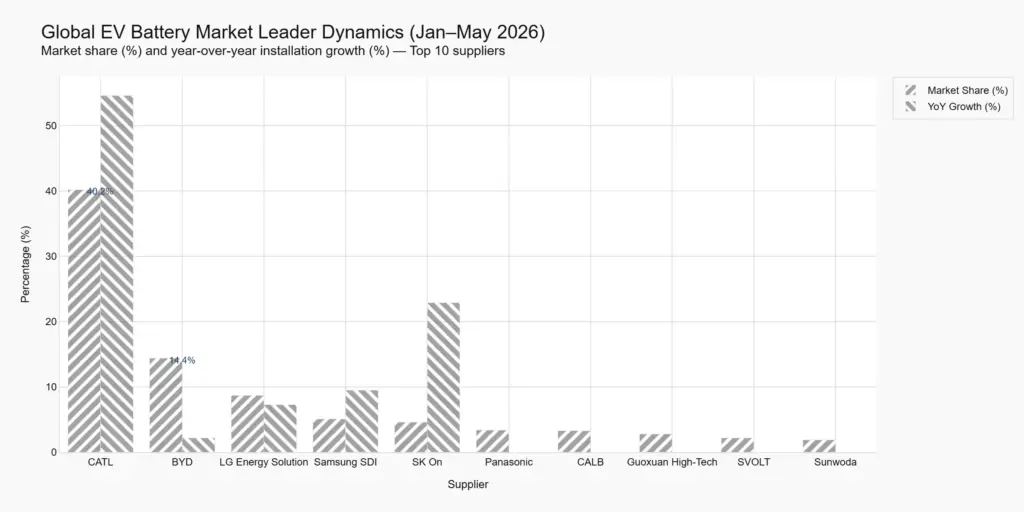
- CATL détient une part dominante de 40,2 % sur le marché mondial, consolidant sa position grâce à une croissance des installations de 22,9 % par rapport à l'année précédente.
- Sept fournisseurs chinois contrôlent désormais collectivement 72,6 % des installations mondiales, soit une augmentation de 2,1 point de pourcentage par rapport à l'année précédente.
- Les fournisseurs coréens et japonais ont perdu de la part malgré une performance mixte en termes de volume absolu ; SK On et Panasonic ont enregistré une diminution absolue des installations.
- Les entreprises chinoises de deuxième niveau (CALB, Gotion, Eve Energy, Svolt) ont toutes connu une croissance rapide : CALB +36,3 %, Gotion +37,0 %, Eve Energy +35,2 %, Svolt
- Les fournisseurs coréens montent une réponse stratégique par le biais de partenariats à grande échelle avec les constructeurs automobiles dans les marchés occidentaux, notamment l'accord LG Energy Solution–Tesla LFP en Michigan et le contrat de cellules unifiées Samsung SDI–Volkswagen en Hongrie.
Consolidation chinoise en tête
Les données sectorielles pour janvier-mai 2026 montrent que CATL a poursuivi l'affirmation de sa position de leader sur le marché des batteries pour véhicules électriques. L'entreprise a enregistré 188,4 GWh d'installations de batteries, soit une augmentation de 22,9 % par rapport à l'année précédente. Cela était significativement supérieur à la croissance globale du marché de 16,3 %, qui a atteint 469,2 GWh durant la même période. En conséquence, la part de marché de CATL est passée à 40,2 %, contre 38,0 % durant la période correspondante de l'année précédente.
BYD est resté en deuxième position, avec 67,6 GWh d'installations. Toutefois, ses installations ont augmenté de seulement 0,4 %, bien en dessous du taux de croissance global du marché. Cela a entraîné une baisse de sa part de marché, passant de 16,7 % à 14,4 %.
Collectivement, CATL et BYD représentaient 54,6 % des installations mondiales de batteries pour véhicules électriques durant janvier-mai 2026, soulignant la forte concentration parmi les principaux fournisseurs. L'écart concurrentiel devient encore plus marqué lorsqu'on inclut les cinq autres entreprises chinoises figurant dans le top dix mondial. Les fabricants de batteries chinois contrôlaient collectivement 72,6 % des installations mondiales de batteries pour véhicules électriques, exerçant ainsi une pression continue sur les producteurs de batteries hors de Chine.| Classement | Société | Pays | Part de marché (%) | Installations (GWh) | Changement annuel (%) |
|---|---|---|---|---|---|
| 1 | CATL | Chine | 40.2% | 188.4 | +22.9% |
| 2 | BYD | Chine | 14.4% | 67.6 | +0.4% |
| 3 | LG Energy Solution | Corée du Sud | 8.7% | 41.0 | +7.3% |
| 4 | CALB | Chine | 5.1% | 23.8 | +36.3% |
| 5 | Gotion High-tech | Chine | 4.6% | 21.7 | +37.0% |
| 6 | SK On | Corée du Sud | 3.4% | 15.8 | -5.8% |
| 7 | Eve Energy | Chine | 3.3% | 15.4 | +35.2% |
| 8 | Panasonic | Japon | 3.2% | 15.1 | -8.5% |
| 9 | Svolt | Chine | 2.6% | 12.1 | +35.3% |
| 10 | Sunwoda | Chine | 2.4% | 11.4 | +13.8% |
| — | Autres | — | 12.1% | 56.8 | — |
| Total | 469.2 | +16.3% |
Érosion des entreprises coréennes et japonaises établies
Les fournisseurs chinois exercent une pression croissante sur les fabricants de batteries établis, ce qui se reflète clairement dans les positions de marché déclinantes de LG Energy Solution, SK On et Panasonic. LG Energy Solution est resté en troisième position avec 41,0 GWh d'installations, représentant une augmentation de 7,3 % par rapport à l'année précédente. Toutefois, cette croissance était beaucoup plus lente que la croissance globale du marché de 16,3 %, ce qui a entraîné une baisse de sa part de marché, passant de 9,5 % à 8,7 %. Les sources du secteur attribuent la croissance limitée de la part de marché de LGES à l'expansion rapide des concurrents chinois, ainsi qu'aux fluctuations de la demande de ses principaux clients automobiles, notamment Tesla, le groupe Hyundai Motor, GM et Volkswagen.
SK On a connu une baisse plus importante, avec une diminution de 5,8 % des installations par rapport à l'année précédente, passant à 15,8 GWh. En conséquence, sa part de marché a chuté de 4,1 % à 3,4 %. Panasonic a également vu sa position s'affaiblir, avec une diminution de 8,5 % des installations, passant à 15,1 GWh, et une baisse de sa part de marché de 4,1 % à 3,2 %. La baisse des installations de Panasonic était directement liée à une croissance plus lente des ventes de l'un de ses principaux clients.
La baisse des parts de marché de LG Energy Solution, SK On et Panasonic souligne le changement compétitif plus large en cours sur le marché des batteries pour véhicules électriques, alors que les fournisseurs chinois continuent d'acquérir du terrain face aux fabricants coréens et japonais établis.La Deuxième Vague Chinoise
Au-delà de CATL et BYD, un groupe de fournisseurs chinois croît à des taux bien supérieurs à la moyenne du marché, ce qui exerce une pression supplémentaire sur les acteurs établis. Durant la période janvier-mai 2026, CALB (23,8 GWh, +36,3 %), Gotion High-tech (21,7 GWh, +37,0 %), Eve Energy (15,4 GWh, +35,2 %) et Svolt (12,1 GWh, +35,3 %) ont chacun démontré une dynamique solide. Ces quatre entreprises ne sont pas des acteurs marginaux ; elles ont sécurisé des relations avec de grands fabricants d'équipements originaux. CALB fournit XPeng, Nio et Leapmotor, tandis que Gotion est soutenue par Volkswagen en tant que partenaire stratégique. Le volume d'installation combiné de CALB, Gotion, Eve et Svolt a atteint 84,4 GWh, ce qui dépasse le total de 56,8 GWh livré par LG Energy Solution et SK On combinés. Cela indique que la concurrence pour la part de marché non chinoise restante s'intensifie de plusieurs côtés plutôt qu'exclusivement de la part du leader du marché.Partenariats Stratégiques et Réajustement de la Chaîne d'Approvisionnement
Alors que les fournisseurs chinois continuent de mener le marché grâce à une production à grande échelle, les fabricants de batteries coréens adoptent une approche plus ciblée. Au lieu de se concentrer uniquement sur le volume, ils se tournent vers des partenariats de haute valeur qui peuvent garantir une demande à long terme sur les marchés occidentaux tout en profitant du soutien des politiques locales.
LG Energy Solution a signé un accord de fourniture de 4,3 milliards de dollars avec Tesla en mars 2026, confirmé par le gouvernement américain. Selon cet accord, LG Energy Solution produira des cellules prismatiques au phosphate de fer lithium (LFP) dans son usine de Lansing, au Michigan. L'usine avait initialement été développée en partenariat avec General Motors, mais GM a plus tard retiré son soutien du projet. Les cellules seront fournies pour les systèmes de stockage d'énergie Megapack 3 de Tesla, produits à Houston. La production devrait commencer en 2027. Cette transaction a été annoncée dans le cadre de 56 milliards de dollars de engagements du secteur privé mis en évidence par l'administration américaine lors du Sommet sur la Sécurité Énergétique de l'Indo-Pacifique.
Samsung SDI adopte une approche similaire en Europe après avoir sécurisé un contrat pour fournir la « cellule standardisée » du groupe Volkswagen. La production viendra de l'usine de Göd, en Hongrie, où l'entreprise convertit deux lignes existantes de l'usine 1 de Hongrie pour répondre aux spécifications des cellules prismatiques de Volkswagen. L'équipement nécessaire a déjà été installé.
La production en masse est prévue pour commencer en 2027, avec une capacité estimée dans la gamme des dizaines de gigawattheures. Samsung SDI sera le troisième fournisseur pour la plateforme de cellules unifiées de Volkswagen, aux côtés de Gotion High-tech et de PowerCo. L'entreprise anticipe une croissance de plus de 10 % de la demande en batteries pour véhicules électriques en Europe en 2026 et a également indiqué des plans pour augmenter l'utilisation de son usine hongroise au-delà de 70 % au cours du deuxième semestre 2026.
Pris ensemble, ces accords montrent un changement clair de stratégie chez les fabricants de batteries coréens. Au lieu de chercher à rivaliser avec les fournisseurs chinois uniquement par l'échelle de production, les entreprises coréennes sécurisent des capacités de production locales liées à des clients spécifiques, des plateformes et des chimies de batterie. Cette approche leur permet de construire une demande plus stable tout en renforçant leur position sur les marchés occidentaux clés.Chaîne de valeur
Chaine de valeur : Marché mondial des batteries EV
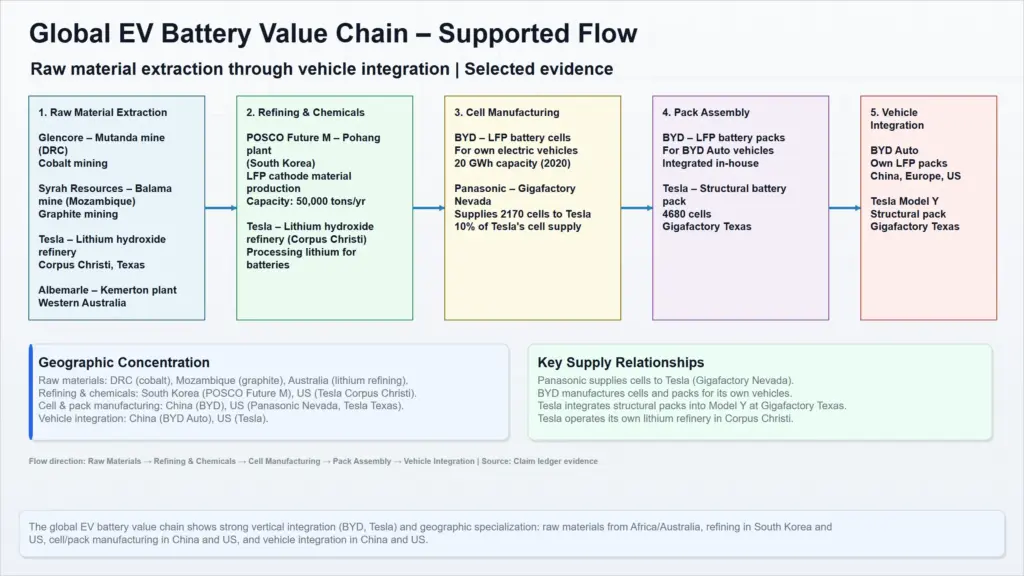
La chaîne de valeur du marché mondial des batteries EV couvre l'extraction et le raffinage des matières premières, la fabrication des composants, l'assemblage des cellules et des packs de batterie, ainsi que leur intégration dans les véhicules électriques ou les systèmes de stockage stationnaires. Selon les preuves disponibles, la partie soutenue de la chaîne s'étend de l'exploitation minière du lithium et du cobalt au raffinage de l'hydroxyde de lithium et à la production des cathodes LFP, suivie de la fabrication de cellules et de l'intégration structurelle des packs, puis enfin à l'assemblage des véhicules électriques. Les relations clés incluent la production verticalement intégrée de batteries LFP par BYD pour ses propres véhicules, le raffinage interne de lithium et l'assemblage structurel des packs par Tesla, ainsi que la relation à long terme entre Panasonic et Tesla en tant que fournisseur de cellules.
La chaîne de valeur montre également une concentration géographique claire, avec l'extraction de cobalt au Congo民主共和国, l'exploitation de graphite en Mozambique et le raffinage de lithium au Texas et en Australie occidentale. Plusieurs mines et raffineries en amont alimentent ces fabricants de batteries et de véhicules en aval, mais les informations disponibles ne couvrent pas toute la chaîne de valeur. Des activités telles que le traitement du nickel et du manganèse, la production d'électrolyte et de séparateurs, le logiciel de gestion de batterie et la recyclage des batteries en fin de vie ne sont pas soutenues par les preuves disponibles.Implications appuyées par des preuves
Intégration verticale dans la production de cellules et de packs. BYD fabrique des cellules et des packs de batteries lithium-fer-phosphate (LFP) pour ses propres véhicules électriques, dont le Han EV lancé en 2020. L'usine de Chongqing de l'entreprise, qui a commencé à être construite en 2019 et qui a atteint une capacité annuelle de 20 GWh avec un investissement de 10 milliards de yuans chinois, produit des cellules longues et plates à forme de lame qui sont directement emballées dans une structure à alvéoles sans modules intermédiaires. Ce design réduit le nombre de pièces et s'intègre à une architecture Cell-to-Body où la batterie devient partie du châssis du véhicule. Tesla intègre également son pack de batterie structurel dans le Model Y à la Gigafactory Texas, en utilisant des cellules au format 4680 qui servent de plancher du véhicule. Le pack est fixé aux gigacastings avant et arrière avec seulement 38 vis, simplifiant l'assemblage et améliorant la rigidité structurelle. Les deux approches raccourcissent la chaîne de la cellule au véhicule et réduisent la complexité de l'assemblage. Dépendance aux fournisseurs de cellules et capacité des raffineries. Panasonic fournit des cellules de batteries lithium-ion à Tesla depuis la Gigafactory Nevada, gérée conjointement, selon un accord de prix de 2020 qui couvre les engagements de capacité et les plans technologiques. En 2023, Panasonic a annoncé une augmentation de production de 10 % en ajoutant une 15e ligne, visant à terminer d'ici mars 2026. En parallèle, Tesla opère sa propre raffinerie d'hydroxyde de lithium à Corpus Christi, Texas — la première raffinerie de spodumène vers hydroxyde de lithium en Amérique du Nord — en utilisant un processus sans acide qui a commencé la production en 2025. Cette usine donne à Tesla un contrôle direct sur un ingrédient essentiel en amont, réduisant ainsi la dépendance aux raffineries externes. En revanche, Albemarle a mis hors service sa raffinerie de hydroxyde de lithium Kemerton en Australie occidentale en 2026, plaçant le reste du train en maintenance après une période de faibles prix du lithium. Kemerton avait traité le spodumène provenant de la mine de Greenbushes et était initialement conçu pour produire jusqu'à 100 000 tonnes par an sur quatre trains. Les destins contrastés de ces deux raffineries illustrent comment les structures de coûts et les conditions du marché façonnent la capture de valeur en amont. Concentration des matières premières et risques d'approvisionnement. Glencore exploite la mine de cuivre-cobalt de Mutanda au Congo民主共和国, qui avec KCC a produit 36 100 tonnes de cobalt en 2025. Le Congo a introduit un système de quotas d'exportation en fin d'année 2025 qui a limité les exportations ; Glencore a priorisé le cuivre par rapport au cobalt, stockant ainsi des stocks de cobalt fini. Pour 2026-2027, les quotas d'exportation de cobalt de Mutanda sont fixés à des niveaux réduits. Cette dépendance à un seul pays introduit un risque politique et des éventuels goulets d'étranglement d'approvisionnement. De même, Syrah Resources exploite la mine de graphite de Balama en Mozambique, qui a reprendre la production en juin 2025 après une année de fermeture. Balama a atteint un taux moyen de production quotidienne de 23 kt après la reprise, et Syrah construit une usine de matériau d'anode active en aval aux États-Unis (Vidalia). Le cobalt et le graphite sont essentiels pour la plupart des chimies de batterie EV, et les preuves montrent que leurs chaînes d'approvisionnement sont concentrées dans des régions politiquement sensibles. Élargissement de la production de cathodes LFP. POSCO Future M a entamé la construction d'une usine dédiée à la production de matériau de cathode LFP à Pohang, en Corée du Sud, avec une production en masse ciblée pour 2027 et une capacité annuelle potentielle de jusqu'à 50 000 tonnes. Cette usine, en partenariat avec Pino et C&G Al, vise les marchés de stockage d'énergie et de batterie EV d'entrée de gamme. Elle ajoute un nouveau nœud dans la chaîne de valeur pour les chimies LFP, qui sont appréciées pour leur compétitivité de coût et leur longue durée de cycle. L'expansion signale que la production de cathodes LFP se déplace au-delà de la Chine, bien que les preuves ne lient pas cette usine à des clients en aval spécifiques.| Étape | Participant | Activité | Géographie | Statut |
|---|---|---|---|---|
| Extraction et raffinage du lithium | Tesla | Opère une raffinerie de spodumène vers hydroxyde de lithium | Corpus Christi, Texas, États-Unis | En exploitation (2025) |
| Raffinage du lithium | Albemarle | A opéré la raffinerie de hydroxyde de lithium Kemerton (maintenant arrêtée) | Kemerton, Australie occidentale | Placée en maintenance (2026) |
| Extraction du cobalt | Glencore | Opère la mine de cuivre-cobalt de Mutanda | République démocratique du Congo | Active, avec des quotas d'exportation jusqu'en 2027 |
| Extraction du graphite | Syrah Resources | Opère la mine de graphite de Balama | Mozambique | Active (reprise en juin 2025) |
| Matériau actif de cathode | POSCO Future M | Construction d'une usine de matériau d'électrode LFP | Pohang, Corée du Sud | En cours de construction ; production cible en 2027 |
| Fabrication de cellules | Panasonic | Fournit des cellules lithium-ion à Tesla | Gigafactory Nevada, États-Unis | En cours ; augmentation de capacité de +10 % d'ici mars 2026 |
| Fabrication de cellules et de packs | BYD | Fabrique des cellules et packs LFP pour ses propres véhicules électriques (Blade Battery) | Chongqing, Chine (et d'autres) | Production en masse depuis 2020 |
| Intégration de packs | Tesla | Intègre le pack de batterie structurel dans le Model Y | Gigafactory Texas, États-Unis | En cours |
Activité d'investissement
Points clés
- Les programmes de financement gouvernementaux aux États-Unis, au Royaume-Uni, en Espagne et en Argentine apportent un capital substantiel pour la fabrication de batteries, le recyclage et le traitement du lithium, signalant un fort soutien politique aux chaînes d'approvisionnement nationales.
- Les investissements corporatifs s'étendent également au-delà de la fabrication conventionnelle de cellules de batterie. Les entreprises investissent de plus en plus dans des domaines tels que la gestion thermique et l'infrastructure de recyclage. Par exemple, Hyundai WIA s'est engagé à investir 334,5 millions de dollars dans une gestion thermique intégrée, tandis que Gotion High-Tech investit dans le recyclage et la production de cathodes en Espagne.
- L'acquisition de Stryten-C&D Trojan créera un réseau de fabrication américain comprenant 15 usines, soulignant que la concentration est une stratégie pour atteindre l'échelle et la sécurité d'approvisionnement.
- La nouvelle usine d'assemblage de batteries haute tension de BMW en Bavière et l'installation de recherche publique de Fraunhofer FFB mettent en évidence l'ambition allemande de maintenir la production de batteries en Europe.
- L'approbation par l'Argentine d'une expansion de 709 millions de dollars par Zijin Mining, filiale chinoise, illustre le rôle croissant des pays riches en ressources et des investissements étrangers dans le développement de la chaîne d'approvisionnement en amont.
Financement public et catalyseurs politiques
Les programmes de financement gouvernementaux en 2026 orientent un capital substantiel vers la chaîne de valeur des batteries pour véhicules électriques. L'accent ne se limite pas à la production de cellules de batterie. Le financement s'oriente de plus en plus vers l'indépendance des chaînes d'approvisionnement régionales, le traitement des matières critiques nationales, le recyclage des batteries, la fabrication de composants et la recherche et l'innovation en phase initiale.
Les États-Unis, le Royaume-Uni, l'Espagne, l'Argentine et l'Allemagne ont tous annoncé ou avancé des mécanismes de financement ciblant différentes parties de la chaîne d'approvisionnement des batteries pour véhicules électriques. Ensemble, ces initiatives démontrent le rôle croissant des politiques gouvernementales dans la formation des décisions de fabrication et d'investissement en matière de batteries.États-Unis – 500 millions de dollars pour les matières critiques et la fabrication de batteries
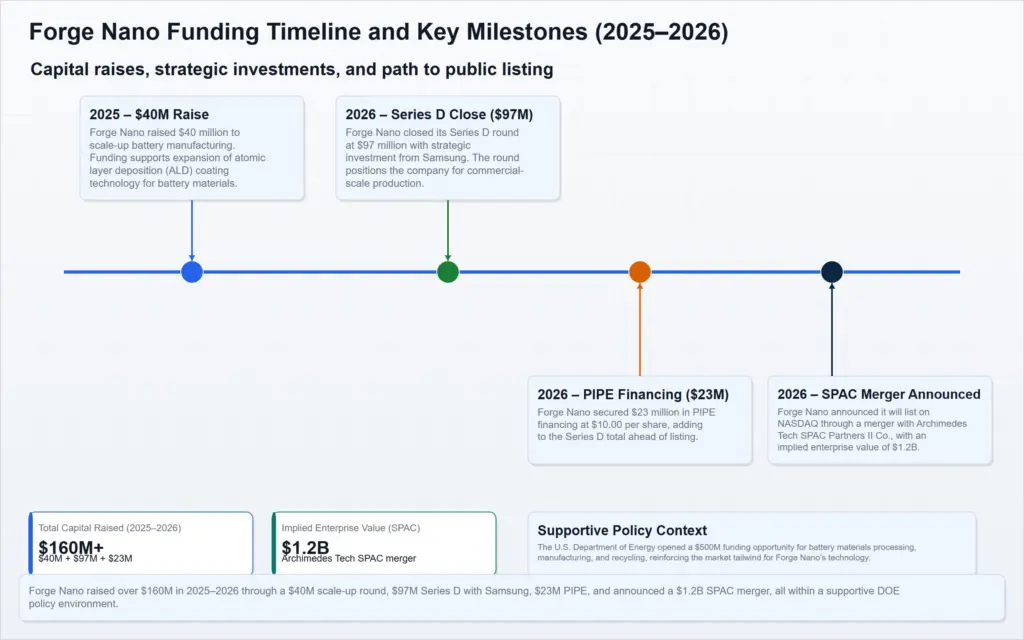
En mars 2026, le Bureau des minéraux critiques et de l'innovation énergétique du Département de l'Énergie a publié un avis d'appel à projets pour un financement pouvant atteindre 500 millions de dollars afin d'étendre le traitement des minéraux critiques et des matériaux nationaux, la fabrication dérivée de batteries et le recyclage.
La troisième ronde des programmes de traitement des matériaux de batterie et de fabrication et recyclage de batteries soutiendra des installations de démonstration et commerciales couvrant des matériaux tels que le lithium, le graphite, le nickel et le cuivre. Le programme soutient également le recyclage des déchets de fabrication et des batteries en fin de vie.
Le financement est ouvert aux projets dans trois domaines thématiques :
- Traitement des minéraux critiques nationaux à partir de matières premières brutes
- Recyclage des matériaux critiques nationaux
- Fabrication nationale de matériaux et composants de batteries
Royaume-Uni – Programme d'innovation des batteries de 25 millions de livres sterling
Innovate UK, au nom du Département du Commerce et du Commerce, a lancé en avril 2026 la deuxième compétition du tour de développement de concepts du programme d'innovation des batteries.
Jusqu'à 25 millions de livres sterling de subventions sont disponibles pour les entreprises inscrites au Royaume-Uni menant des recherches et développement collaboratifs sur les technologies de matériaux pour batteries destinées à l'électrification.
Les projets doivent demander entre 500 000 et 4 millions de livres sterling, durer entre 12 et 36 mois et ne pas commencer avant octobre 2026.
Le programme est conçu pour soutenir le développement et la mise à l'échelle de la capacité de fabrication de batteries au Royaume-Uni. Un exigement de consortium s'applique également, avec au moins une PME inscrite au Royaume-Uni qui doit demander un financement de subvention pour participer.Espagne – Investissement de Gotion soutenu par le PERTE
Le gouvernement espagnol a approuvé un investissement stratégique d'environ 1 milliard d'euros par la chinoise Gotion High-Tech à Valladolid pour une usine de cathodes de batterie et une installation de recyclage.
Le projet est estimé à 950 millions d'euros (1,09 milliard de dollars) et est soutenu par une subvention publique de 138 millions d'euros dans le cadre du programme de projets stratégiques pour la relance et la transformation économique (PERTE) pour les véhicules électriques.
Le projet sera développé en deux phases :
- Phase Un : Budgétisé à 411,5 millions d'euros, cette phase visera une usine de recyclage capable de traiter jusqu'à 200 000 tonnes de matériaux de batterie annuellement.
- Phase Deux : Budgétisé à 539,1 millions d'euros, cette phase produira 200 000 tonnes de matériaux de cathode par an.
Argentine – Expansion de lithium de 709 millions de dollars sous le RIGI
En juillet 2026, le Comité du régime d'incitation pour les grands investissements (RIGI) de l'Argentine a approuvé un investissement de 709 millions de dollars par Liex, la filiale argentine de Zijin Mining de Chine, pour étendre le projet Tres Quebradas de lithium dans la province de Catamarca.
Dans le cadre de la deuxième phase, le projet ajoutera une nouvelle usine de traitement capable de produire annuellement 40 000 tonnes de carbonate de lithium. L'expansion s'appuiera sur la première phase, qui a commencé la production en septembre 2025 avec une capacité de 20 000 tonnes par an.
Une fois l'expansion terminée, la capacité totale planifiée du projet est prévue pour atteindre entre 60 000 et 80 000 tonnes par an, renforçant ainsi sa position en tant que projet important de production de lithium en Argentine.
Le projet est également prévu pour avoir un impact économique plus large. Il est estimé que cela générera 4 406 emplois pendant la construction et l'exploitation, tandis que les exportations annuelles sont prévues pour atteindre environ 400 millions de dollars.Allemagne – Installation de recherche de Fraunhofer FFB
L'Institut Fraunhofer pour la recherche et la production de cellules de batterie a atteint une étape importante de construction en juillet 2026 avec la cérémonie de pose du toit pour l'usine de production de cellules de batterie FFB Fab à Münster, en Rhénanie-du-Nord-Westphalie.
Le gouvernement fédéral fournit jusqu'à 750 millions d'euros, tandis que l'État investit environ 320 millions d'euros, portant ainsi l'investissement combiné à environ 1 milliard d'euros.
Le site de 39 000 mètres carrés abritera une infrastructure de recherche à l'échelle du gigawatt.
La première phase, FFB PreFab, a ouvert en 2024 en tant qu'usine de recherche ouverte. La deuxième phase, FFB Fab, inclura des installations de production couvrant plus de 20 000 mètres carrés et devrait devenir le noyau d'une forte industrie européenne de batteries.| Pays / Programme | Montant du financement | Domaine d'intérêt | Statut |
|---|---|---|---|
| Subventions du DOE des États-Unis pour la fabrication et le recyclage de batteries | $500 million | Traitement des minéraux critiques, fabrication de batteries, recyclage | Annoncé (NOFO) |
| Ronde 2 du développement de concepts de l'innovation des batteries au Royaume-Uni | £25 million | Technologies des matériaux de grade batterie, recherche et développement | Ouvert aux candidatures (fermeture en mai 2026) |
| Espagne – subvention PERTE VEC pour Gotion Valladolid | €138 million | Production de cathodes, recyclage de batteries | Approuvé, construction prévue en 2027 |
| Argentine – incitation RIGI pour Zijin Tres Quebradas | $709 million (investissement privé avec avantages RIGI) | Élargissement de la production de carbonate de lithium | Approuvé, phase 2 prévue |
| Allemagne – Fab de Fraunhofer FFB (fédéral + étatique) | €750 million (fédéral) + €320 million (étatique) | Recherche sur les cellules de batterie et infrastructures à l'échelle de gigafactory | En cours de construction (topping-out juillet 2026) |
Élargissement de la capacité des entreprises et investissement stratégique
Les programmes gouvernementaux ne constituent qu'une partie de l'ensemble des investissements. Les investissements directs des entreprises et les acquisitions en 2026 redéfinissent également le paysage concurrentiel. Ces initiatives montrent que la concurrence s'étend au-delà de la chimie des cellules de batterie et de la capacité de fabrication. Les entreprises investissent de plus en plus dans la gestion thermique, le recyclage, l'intégration verticale et la consolidation de la fabrication à mesure qu'elles cherchent à atteindre une plus grande échelle et une plus grande sécurité d'approvisionnement.
Hyundai WIA – 500 milliards de won dans la gestion thermique intégrée
Hyundai WIA a dévoilé un plan d'investir 500 milliards de won, soit environ 334,5 millions de dollars, afin d'étendre son activité de gestion thermique intégrée. Cet investissement soutiendra le développement et la production de systèmes de chauffage et de refroidissement avancés pour les véhicules électriques. Il couvrira également les technologies de gestion thermique des batteries.
Sur l'investissement total, 200 milliards de won (133,8 millions de dollars) seront alloués à la usine de Changwon. Ce financement sera utilisé pour étendre les lignes de production de gestion thermique d'ici 2030.
Un autre 180 milliards de won (120,4 millions de dollars) seront alloués à la recherche et au développement écologique. Le reste, soit 120 milliards de won, sera utilisé pour établir et renforcer les bases internationales de Hyundai WIA.
Hyundai WIA fournit déjà le système de climatisation de cabine et de chauffage pour le véhicule PV5 spécialement conçu par Kia. L'entreprise opère également un centre d'essai de gestion thermique à Uiwang, dans la province de Gyeonggi. Ce centre a été achevé en 2023.
Cet investissement reflète la vision de Hyundai WIA selon laquelle la gestion thermique devient une partie de plus en plus importante de la technologie des véhicules électriques. À mesure que l'adoption des véhicules électriques augmente, les systèmes de chauffage et de refroidissement efficaces deviennent de plus en plus importants pour les performances des véhicules et la gestion des batteries.Achat de C&D Trojan par Stryten Energy
En juillet 2026, Stryten Energy a annoncé l'acquisition de C&D Technologies et Trojan Battery Company (C&D Trojan) dans le cadre de sa stratégie visant à élargir ses capacités de fabrication de batteries mondiales et à renforcer la sécurité énergétique américaine. La transaction devrait être finalisée au cours du troisième trimestre de 2026, sous réserve des autorisations réglementaires, et créera une entreprise combinée opérant 15 usines de fabrication de batteries et de composants aux États-Unis, avec un effectif d'environ 3 700 employés.
Après l'acquisition, le réseau étendu inclura également des opérations au Mexique et en Chine, ainsi que des bureaux à travers l'Europe et l'Asie, donnant à Stryten une empreinte internationale plus large en matière de fabrication et d'opérations. Les termes financiers n'ont pas été divulgués, tout en prévoyant que l'entreprise augmentera sa capacité de fabrication de batteries à base de verre à mousse (AGM), utilisées dans les véhicules à démarrage-stop et hybrides, les télécommunications et les centres de données.
L'acquisition reflète une stratégie plus large de consolidation, permettant à Stryten Energy d'augmenter l'échelle de fabrication tout en renforçant l'intégration verticale de ses opérations de batterie et en améliorant sa capacité à servir plusieurs marchés finaux.BMW – usine d'assemblage de batteries haute tension en Bavière
Le groupe BMW construit une usine dédiée d'assemblage de batteries haute tension à Irlbach-Strasskirchen, en Basse-Bavière, pour soutenir le lancement de ses véhicules électriques Neue Klasse. Le projet avance rapidement, et d'ici la mi-2026, tous les 1 066 piliers du bâtiment de production central avaient été érigés, seulement 16 semaines après le début officiel des travaux en juin 2024.
Une fois en service, l'usine fournira des packs de batteries aux usines d'assemblage de véhicules BMW à Dingolfing, Regensburg et Munich, soutenant la transition de l'entreprise vers un portefeuille entièrement électrique. Le projet fait également partie de la stratégie plus large de BMW pour préserver environ 30 000 emplois dans la région tout en préparant son réseau de production à la transition vers la mobilité électrique.
Le projet a traversé le processus d'approbation rapidement, avec le processus de permis de construction terminé en avril 2024, ce qui en fait l'un des processus les plus rapides en Allemagne. Bien que le montant de l'investissement ne soit pas divulgué, l'échelle de la construction et le rôle prévu de l'installation indiquent un engagement significatif envers l'assemblage de batteries à haute tension et la production future d'véhicules électriques de BMW.Gotion – Projet Espagne de 950 millions d'euros (mené par l'entreprise)
Le projet de Gotion High-Tech à Valladolid, rendu possible par le financement PERTE, représente un investissement corporatif de 950 millions d'euros dans une usine de cathodes et une installation de recyclage. L'entreprise, dont le plus grand actionnaire est le groupe Volkswagen, vise à commencer les travaux en 2027. L'usine de recyclage (phase 1, 411,5 millions d'euros) aura une capacité de traitement de jusqu'à 200 000 tonnes de matériau de batterie par an. L'usine de cathodes (phase 2, 539,1 millions d'euros) produira annuellement 200 000 tonnes de matériau de cathode. Le projet est décrit par le ministre des Transports espagnol comme présentant une technologie unique au sein de l'Union européenne. Ces initiatives corporatives, associées aux financements publics, indiquent que le paysage des investissements s'élargit des simples fabrications de cellules pour inclure la gestion thermique, le recyclage et la consolidation. Cependant, des lacunes notables persistent : aucun investissement des principaux fabricants chinois de cellules (CATL, BYD) au-delà de Gotion n'est capturé, et aucun engagement envers la production de batteries à état solide ou à ion sodium n'a été divulgué dans ce paquet. Le paysage des investissements en batteries pour véhicules électriques en 2026 couvre les financements gouvernementaux, les investissements corporatifs, les acquisitions, les nouvelles installations et l'expansion de la capacité à travers la chaîne de valeur mondiale des batteries. L'analyse inclut la taille des investissements, le statut des projets, l'emplacement, les partenaires et l'impact sur la capacité à travers les matières premières, les composants, la fabrication de cellules, l'assemblage des packs, le recyclage et la gestion thermique.Technologie et innovation
Technologie et innovation : marché mondial des batteries pour véhicules électriques
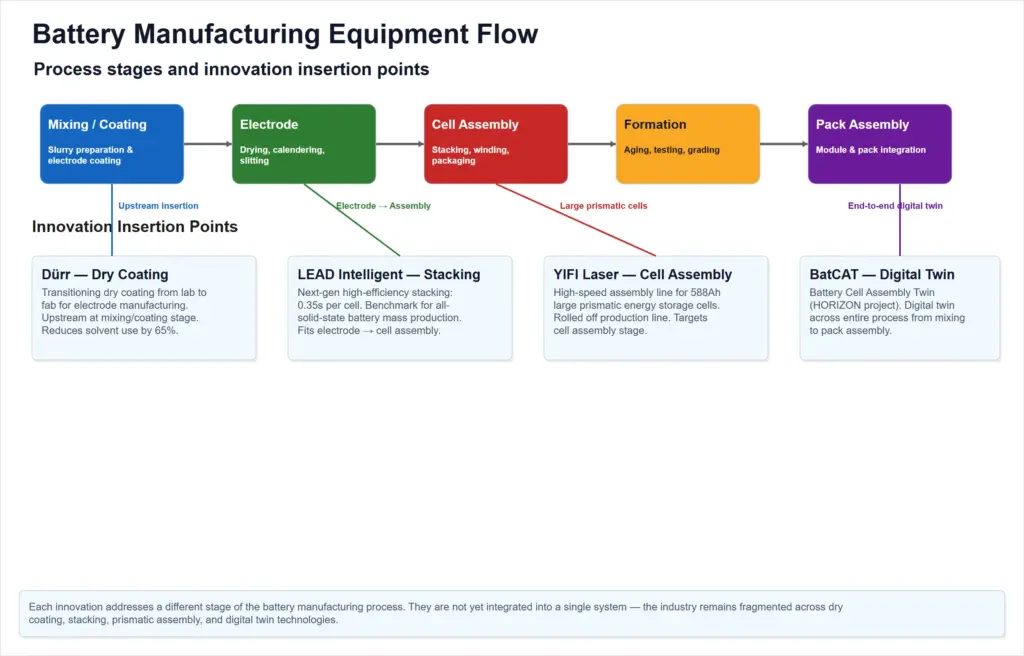
Infrastructure de fabrication de cellules de batterie
L'installation Fraunhofer FFB à Münster, en Allemagne, illustre un investissement public à grande échelle dans l'infrastructure de recherche et développement des cellules de batterie en Europe. En juillet 2026, une cérémonie de « topping-out » a marqué le milieu du projet FFB Fab, la deuxième phase de construction. Le site global couvre 39 000 mètres carrés, avec plus de 20 000 mètres carrés dédiés à la recherche sur la production à l'échelle de gigafactory. Le gouvernement fédéral et l'État du Rhin supérieur ont investi ensemble environ 1 milliard d'euros (750 millions d'euros fédéraux et 320 millions d'euros de l'État) dans cette initiative. La première phase, FFB PreFab, a été mise en service depuis 2024. Le FFB Fab offrira une infrastructure de recherche unique en Europe pour les cellules de batterie jusqu'à l'échelle du gigawatt, permettant à l'industrie de passer du laboratoire à la production à grande échelle.Technologies de gestion thermique
Le licencié coréen de JIOS Aerogel a sécurisé un contrat pour fournir des barrières de surchauffe Thermal Blade pour les modèles Hyundai et Kia dans le cadre de leur modèle de licence Hub & Spoke introduit en 2025. Ce modèle centralise la production de poudre d'aérogel dans un centre en Corée, fournissant des licences mondiales pour la production à grande échelle de barrières. La production en masse est prévue pour commencer en juin 2027, avec une durée de contrat de 12 ans. Ce premier contrat sous le modèle de licence valide la réduction des barrières de capital pour l'adoption par les constructeurs automobiles. Aisin a lancé une ligne de production avancée de plaques de refroidissement en aluminium à son usine de Seymour, en Indiana, en juillet 2026. La ligne produit des plaques de refroidissement en aluminium pour la gestion thermique des batteries dans les véhicules électriques, renforçant les chaînes d'approvisionnement nord-américaines et consolidant la stratégie d'électrification d'Aisin.Évolution des semi-conducteurs des systèmes de gestion de batterie (BMS)
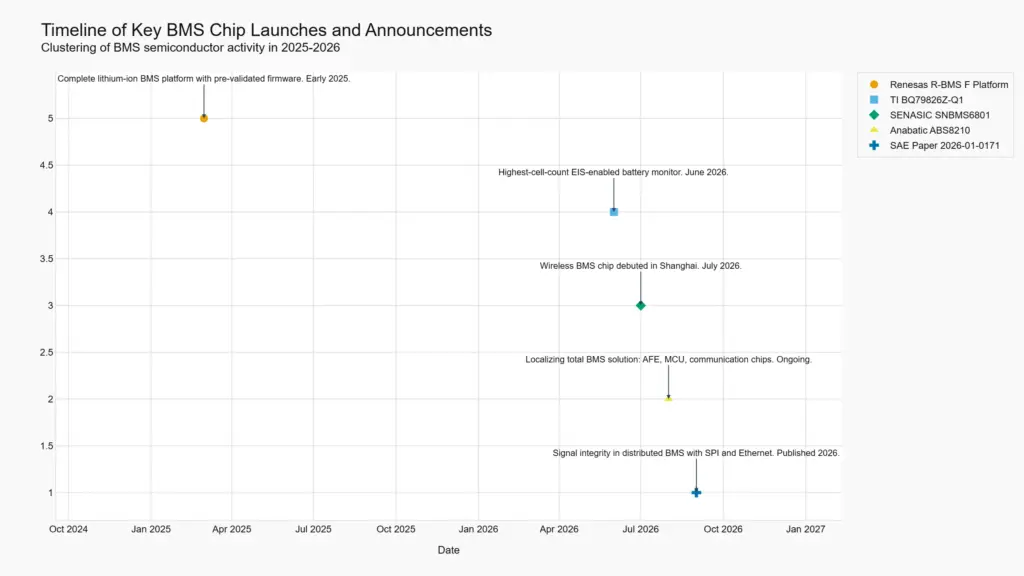
Les fonctionnalités des puces BMS évoluent rapidement avec une surveillance de plus grandes quantités de cellules, une spectroscopie d'impédance électrochimique (EIS) intégrée pour la détection précoce de la surchauffe, une communication sans fil et des chaînes d'approvisionnement locales. Texas Instruments a lancé le BQ79826Z-Q1 en juin 2026, le moniteur de batterie à la plus grande capacité de cellules EIS du marché. Il surveille jusqu'à 26 cellules en série (44 % de canaux supplémentaires par rapport aux générations précédentes), avec un moteur EIS intelligent intégré qui atteint une précision d'impédance de 1 % sur une plage de fréquence de 0,01 Hz à 3,5 kHz. L'appareil permet des véhicules électriques et des systèmes de stockage d'énergie plus sûrs. SENASIC a dévoilé la puce BMS sans fil SNBMS6801 à la foire électronique de Munich à Shanghai en juillet 2026. La puce intègre une détection multi-dimensionnelle (tension, température, EIS), une communication sans fil et une intelligence artificielle au bord, éliminant les câbles traditionnels. Anabatic Semiconductor localise une solution BMS complète en Corée du Sud, regroupant AFE, MCU et puces de communication. Son premier produit, ABS8210, mesure jusqu'à 20 cellules et intègre l'EIS sur puce, permettant une détection d'anomalies 20 à 30 minutes plus tôt que les méthodes conventionnelles. L'entreprise vise à défier le duopole américain de Analog Devices et Texas Instruments. Renesas a annoncé la plateforme R-BMS F en début de 2025, une solution complète de gestion de batterie lithium-ion avec un firmware prévalidé. Ciblant les applications de 2 à 4 et 3 à 10 cellules en série (véhicules électriques, nettoyeurs à vapeur, robots, drones), elle inclut des IC de mesure de carburant, des MCU, une entrée analogique frontale et un logiciel, réduisant les barrières de conception pour les appareils grand public et légers. SAE a publié le document technique 2026-01-0171 sur l'intégrité des signaux dans les systèmes BMS distribués avec des communications SPI et Ethernet pour les prochaines générations de véhicules électriques. En utilisant une plateforme de test de 192 cellules, l'article quantifie que la conception d'intégrité des signaux insuffisante peut réduire les marges de signal de 18 dB, et démontre que les stratégies de co-conception réduisent jusqu'à 30 % de jitter et la latence d'Ethernet en dessous de 120 ns, avec un BER ≤ 1×10⁻¹².| Technologie | Participant | Indicateur fourni | Période | Application | Implication basée sur des preuves |
|---|---|---|---|---|---|
| Surveilleur EIS à 26 cellules | Texas Instruments | 26 cellules, 44 % de canaux supplémentaires, 1 % de précision d'impédance, EIS de 0,01 Hz à 3,5 kHz | Lancé en juin 2026 | Véhicule passager, stockage d'énergie | Le plus grand nombre de cellules par appareil réduit le BOM ; l'EIS intégré permet la détection précoce de la surchauffe. |
| Puce BMS sans fil à cellule unique | SENASIC | Cellule unique sans fil, EIS, IA au bord, élimine le câblage | Débuté en juillet 2026 | Véhicule passager, grand système de stockage d'énergie | Architecture sans fil réduit les coûts matériels et d'assemblage ; l'IA au bord améliore la prédiction des anomalies. |
| AFE à 20 cellules avec puces regroupées | Anabatic Semiconductor | 20 cellules, EIS intégré, AFE + fil + sans fil + MCU regroupés | En cours (chemin d'investissement 2026-2029) | Véhicule passager | Solution totale localisée défie le duopole américain ; potentiel d'indépendance de la chaîne d'approvisionnement coréenne. |
Points clés
- L'investissement public dans l'infrastructure de recherche et développement des cellules de batterie à grande échelle (Fraunhofer FFB, ~1 milliard d'euros) signale une engagement durable de l'Europe à la production nationale à l'échelle de gigafactory.
- Les modèles de licence pour les composants de gestion thermique (JIOS Hub & Spoke) réduisent l'intensité du capital nécessaire à l'adoption par les constructeurs automobiles, comme le prouve un contrat de 12 ans avec Hyundai/Kia.
- L'innovation en matière de semi-conducteurs pour la gestion de la batterie accélère, avec des moniteurs à plus de cellules, une EIS intégrée pour la détection précoce de la défaillance thermique, et une connectivité sans fil, permettant des packs plus sûrs et plus denses.
- La localisation des chaînes d'approvisionnement en puces BMS en Corée du Sud (Anabatic Semi) remet en question le duopole américain (TI, ADI) et pourrait transformer les stratégies d'approvisionnement.
- Les efforts de standardisation (document SAE sur l'intégrité des signaux BMS distribués) traitent des défis de mise à l'échelle pour les packs à forte densité de cellules, cruciaux pour les véhicules électriques de nouvelle génération.
Risque de marché
Analyse des risques et des contraintes : Marché mondial des batteries EV
Points clés :
- La Chine contrôle plus de 90 % du traitement du graphite et 60 à 70 % de la raffinerie du lithium, créant une dépendance aiguë pour les fabricants de batteries non chinois.
- La République démocratique du Congo fournit 70 % du cobalt mondial ; toute interruption — des quotas d'exportation aux échecs logistiques — peut se propager à l'échelle mondiale car l'élasticité de substitution est faible.
- Les fournisseurs chinois dominent la production d'équipements pour les cellules de batterie, ce qui pose un risque de goulet d'étranglement pour les gigafactories occidentales si les contrôles d'exportation ou les tensions commerciales s'aggravent.
- La réglementation européenne sur les batteries imposera des coûts de conformité de 80 000 à 120 000 euros par fabricant uniquement pour les services de conseil, plus des charges internes liées à la collecte de données, avec un passeport numérique obligatoire d'ici février 2027.
- La crise maritime du Moyen-Orient et un dysfonctionnement de la plateforme douanière en République démocratique du Congo illustrent comment les vulnérabilités opérationnelles s'accumulent aux risques de concentration structurelle.
- Cette évaluation couvre les risques à travers la chaîne d'approvisionnement des batteries EV, depuis l'extraction des matières premières jusqu'à la fabrication des cellules, en mettant l'accent sur la concentration géographique et de traitement, la conformité réglementaire, la dépendance à l'équipement de fabrication et les perturbations logistiques. La limite ne comprend pas les risques en aval tels que le recyclage à la fin de vie, la dégradation des performances des batteries ou les facteurs côté demande.
- Les sections suivantes sont basées sur des preuves disponibles au public provenant de sources autorisées, telles qu'indiqué dans le document factuel accompagnant.
Concentration en amont dans le traitement des minéraux critiques
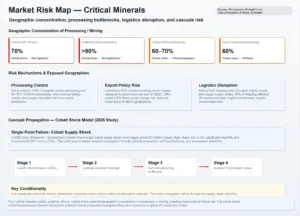
La chaîne d'approvisionnement mondiale des batteries EV fait face à des risques importants de points de défaillance uniques à l'étape du traitement de quatre minéraux critiques : le cobalt, le graphite, le lithium et le nickel. La concentration géographique à cette étape signifie qu'une interruption dans un seul État peut rapidement se propager à travers le réseau de fabrication de batteries. L'extraction de cobalt est particulièrement concentrée en République démocratique du Congo (RDC), qui produit environ 70 % de l'offre mondiale. La RDC a renforcé les contrôles d'exportation via des quotas et des suspensions, tandis qu'une récente échec administratif sur la plateforme douanière a menacé de bloquer jusqu'à 20 000 tonnes métriques d'exportations de cobalt, d'une valeur estimée à 1,1 milliard de dollars. Une étude académique de 2026 utilisant un modèle de propagation de chocs à plusieurs couches a trouvé que la demande en cobalt est inélastique à court terme et que le traitement est hautement concentré, ce qui signifie qu'un choc d'offre localisé peut se propager à travers la chaîne d'approvisionnement plus large et créer des défaillances abruptes et non linéaires. Ce modèle de choc d'offre de cobalt montre comment une interruption en un seul lieu peut se propager à travers la production mondiale de batteries EV.
Le traitement du graphite pour les électrodes de batterie est encore plus concentré, avec la Chine qui contrôle plus de 90 % du graphite sphérique et de la production d'éléments d'électrode synthétiques. En décembre 2023, la Chine a introduit un régime de licence d'exportation qui a considérablement réduit les livraisons de graphite sphérique au début de 2024, forçant les fabricants de batteries à faire face à une chaîne d'approvisionnement dans laquelle les investissements avaient précédemment été limités. D'ici 2025, moins de 1 % du graphite sphérique non revêtu était produit en dehors de la Chine. Le raffinage du lithium présente une dépendance similaire, car la Chine représente environ 60 à 70 % de la capacité de raffinerie chimique de lithium mondiale et de la production, en particulier pour le lithium provenant de roches dures. Cette concentration signifie que même si l'exploitation minière de lithium est répartie en Australie, en Amérique du Sud et en Afrique, l'étape critique de conversion reste fortement contrôlée par la Chine.
Le traitement du nickel est également très concentré en Indonésie, où la part de l'offre mondiale est passée de 31,5 % en 2020 à environ 60 % en 2024 suite à un interdiction d'exportation de minerai brut qui a attiré des investissements de raffinerie soutenus par la Chine. Le gouvernement indonésien renforce désormais le contrôle étatique du secteur, créant une incertitude supplémentaire en matière de politique pour les acheteurs dépendant des intermédiaires en nickel indonésiens. Pris ensemble, la concentration du traitement du cobalt, du graphite, du lithium et du nickel met en évidence la vulnérabilité de la chaîne d'approvisionnement des batteries EV, où des interruptions, des contrôles d'exportation, des échecs administratifs ou des changements de politique dans un petit nombre de juridictions peuvent avoir des effets bien au-delà de l'origine.| Minéral | Étape de traitement | Pays / région dominante | Part du traitement mondial | Mécanisme de risque clé |
|---|---|---|---|---|
| Cobalt | Extraction et concentration initiale | République démocratique du Congo | 70% | Quotas d'exportation, échecs administratifs, instabilité politique |
| Graphite | Production d'électrode sphérique et synthétique | Chine | >90% | Licences d'exportation, restrictions commerciales |
| Lithium | Raffinerie chimique (hydroxyde / carbonate) | Chine | 60–70% | Concentration de la capacité de conversion, dépendance à une seule juridiction |
| Nickel | Traitement en fer allié au nickel / précipité d'hydroxyde mixte | Indonésie | 60% | Changements de politique d'exportation, campagnes environnementales |
Dépendance stratégique aux équipements de fabrication chinois
Au-delà des matières premières, un point de blocage moins visible mais tout aussi conséquent existe dans l'équipement de production utilisé pour fabriquer les cellules de batterie. Les fournisseurs chinois dominent le marché des équipements de production de cellules de batterie — y compris les machines de revêtement, de calandrage, de découpe et de bobinage. Cette vulnérabilité se concentre sur les fournisseurs chinois d'équipements et les équipements de fabrication de batteries qu'ils fournissent. Le Carnegie Endowment for International Peace signale que d'ici 2030, la capacité de production de cellules chinoise pourrait atteindre au moins 5 862 GWh, plus du triple de la capacité combinée des membres de l'OCDE. Cette avantage de taille se reflète également dans l'approvisionnement en équipements, où les entreprises chinoises ont intégré les entrées en amont et en aval. Le Jamestown Foundation a identifié l'équipement spécialisé comme l'un des points d'embouchure les plus critiques de la chaîne de valeur des batteries. Puisque le traitement et les entrées en matières premières contrôlés par la Chine influencent déjà les coûts et la disponibilité, les restrictions sur l'exportation d'équipements entraîneraient des retards, des incertitudes et des coûts de refus sélectif pour les industries de technologies propres et adjacentes à la défense à l'étranger. Pour les usines gigafactory occidentales qui dépendent des lignes de production importées de Chine, toute escalade des tensions commerciales - y compris l'instauration de licences d'exportation similaires à celles imposées en 2023 sur le graphite - retarderait les délais de construction et de mise en service. La vulnérabilité centrale n'est pas une pénurie de cellules finies, mais la dépendance vis-à-vis des entrées de fabrication contrôlées par la Chine qui déterminent si les nouvelles installations peuvent être mises en marche comme prévu.Pression de conformité réglementaire : Règlement sur les batteries de l'Union européenne
Le Règlement sur les batteries de l'Union européenne (2023/1542) impose des exigences contraignantes pour toute batterie industrielle ou de véhicule électrique mise sur le marché européen. Les obligations essentielles comprennent la déclaration de l'empreinte carbone, les quotas de contenu recyclé, la diligence raisonnable dans la chaîne d'approvisionnement et les indicateurs de performance - tous à documenter dans un passeport numérique du produit. La date limite est le 18 février 2027. Selon les spécialistes des technologies de conformité, la plupart des fabricants n'avaient pas encore commencé à se préparer à mi-2026. Pour un fabricant typique mettant 200 unités de stockage sur le marché européen, chaque passeport nécessite environ 90 champs de données couvrant l'électrochimie, les données de la chaîne d'approvisionnement, les calculs de l'empreinte carbone et les chiffres du contenu recyclé. Les données sont dispersées dans les rapports d'essai, les listes de composants, les déclarations des fournisseurs et les résultats de laboratoire. Le coût d'une approche manuelle est considérable : les frais des cabinets de conseil pour l'analyse des écarts et la conception des processus s'élèvent à 80 000 à 120 000 euros par fabricant, avec le temps de personnel interne pour la coordination des fournisseurs et la saisie des données ajoutant 60 000 à 80 000 euros supplémentaires. Ces chiffres couvrent uniquement la mise en conformité initiale ; les mises à jour en cas de modifications réglementaires ou de nouveaux références SKU se répéteraient. Le règlement crée ainsi à la fois un fardeau de coûts fixes pour tout fabricant de batterie vendant sur le marché européen et un risque de gestion des données si les informations de la chaîne d'approvisionnement sont incomplètes ou non vérifiables.Logistique et amplification des chocs géopolitiques
Les perturbations opérationnelles ont déjà démontré la manière dont les risques liés à la concentration en amont s'aggravent en raison des échecs logistiques et des goulots d'étranglement administratifs. La crise maritime du Moyen-Orient qui a débuté en 2026 illustre cette propagation. Le détroit d'Hormoz gère normalement environ la moitié du commerce maritime mondial de soufre. La région du Copperbelt — la République démocratique du Congo et la Zambie — tire approximativement 90 % de son soufre de la région du Golfe. Lorsque le détroit d'Hormoz a été fermé au trafic de marchandises en vrac le 28 février 2026, plus de 600 000 tonnes métriques de soufre se sont accumulées dans les navires du Golfe sans possibilité de sortie. Puisque l'acide sulfurique est essentiel pour l'extraction du cobalt et du cuivre à partir des minerais, la crise des intrants chimiques a directement menacé la production d'éléments métalliques utilisés dans les batteries en Afrique. Ivanhoe Mines a donc révisé à la baisse ses prévisions de production de cuivre pour 2026, même avant que l'impact complet sur le traitement du cobalt ne soit clair. Indépendamment de cela, un bug administratif sur la plateforme douanière de la République démocratique du Congo en juillet 2026 a empêché les principaux producteurs de cobalt — notamment CMOC, Glencore, Eurasian Resources Group et Huayou Cobalt — de déclarer leurs exportations avant le délai du 5 juillet relatif à l'utilisation des quotas du premier semestre. Les responsables de l'industrie minière estimaient que 60 à 75 % des entreprises ne respecteraient pas ce délai, risquant ainsi de perdre jusqu'à 20 000 tonnes métriques d'allocations d'exportation de cobalt, soit une valeur estimée de 1,1 milliard de dollars. Ce fait souligne comment même des échecs non liés aux enjeux géopolitiques — tels qu'un bug logiciel — peuvent bloquer des fournitures critiques lorsque la concentration est élevée. Ces incidents s'ajoutent à des contraintes persistantes de sourcing. La Ligne directrice sur la diligence raisonnable de l'OCDE relative aux chaînes d'approvisionnement responsables aborde les risques fréquents liés à l'approvisionnement en cobalt et cuivre en République démocratique du Congo, notamment le travail des enfants, la corruption et l'implication des forces de sécurité. Le respect des cadres de diligence raisonnable ajoute un autre niveau de coûts et de vérification pour les acheteurs de matières premières pour batteries. Cette séquence met en évidence la manière dont une perturbation sur un grand axe maritime peut rapidement se propager à travers la chaîne d'approvisionnement des batteries, commençant par la fermeture du détroit d'Hormoz, qui bloque une estimation de 600 000 tonnes de soufre, suivie d'une pénurie de soufre qui affecte les opérations de traitement en République démocratique du Congo et en Zambie, où le Copperbelt dépend à environ 90 % du soufre du Golfe. La perturbation du traitement résultante peut réduire la production de cobalt, tandis qu'un incident administratif ARECOMS distinct crée un risque pour jusqu'à 20 000 tonnes de cobalt exporté, représentant une valeur estimée de 1,1 milliard de dollars. La chaîne peut donc être illustrée comme suit : fermeture du détroit d'Hormoz → pénurie de soufre → perturbation du traitement en RDC/Zambie → réduction de la production de cobalt → impact sur l'approvisionnement mondial en batteries. La séquence s'appuie sur Mapshock pour la coupure du soufre au détroit d'Hormoz et sur la révision des prévisions d'Ivanhoe, ainsi que sur Miningweekly et Business Insider Africa pour le bug ARECOMS, le risque d'exportation de 20 000 tonnes et la valeur estimée de 1,1 milliard de dollars, montrant comment la chaîne d'approvisionnement en batteries peut être exposée simultanément à des perturbations logistiques et à des échecs administratifs à travers le même flux de matières premières en amont.Paysage réglementaire
Étendue de ce chapitre
Les politiques gouvernementales, les réglementations et les normes de l'industrie prennent de plus en plus d'importance dans la mise en forme de la croissance et du développement à long terme du marché mondial des batteries pour véhicules électriques. Ce chapitre examine les réglementations obligatoires, les normes volontaires et les mesures financières gouvernementales qui affectent directement les batteries pour véhicules électriques, y compris les cellules de batterie, les pack de batterie et les systèmes de batterie utilisés dans les voitures, les deux-roues, les trois-roues, les bus et les camions.
Ce chapitre ne couvre pas les réglementations liées aux systèmes de stockage d'énergie stationnaires, les lois environnementales qui ne sont pas spécifiquement liées aux batteries, ou les estimations des coûts de conformité au niveau de l'entreprise.
Le marché mondial des batteries pour véhicules électriques était estimé à 91,70 milliards de dollars en 2025. L'analyse est basée sur les réglementations adoptées, les initiatives politiques annoncées et les normes internationalement reconnues en vigueur selon les preuves les plus récentes disponibles.Points clés
- La réglementation européenne sur les batteries impose les exigences les plus complètes en matière de cycle de vie avec des objectifs obligatoires de contenu recyclé (cobalt 16 %, lithium 6 %, nickel 6 % à partir de 2031), des taux de récupération des matières et un passeport de batterie à partir de février 2027, créant un calendrier de conformité pour les participants du marché en Europe.
- Les réglementations de sécurité et de transport (UN/ECE GTR No.20, US DOT HMR, normes SAE/ISO) imposent des protocoles de test et de logistique harmonisés, mais augmentent les coûts de test et exigent une certification dédiée pour l'accès au marché.
- L'impôt sur la consommation des batteries lithium-ion en Chine (2 % à partir de septembre 2026, augmentant à 4 % à partir de septembre 2027) avec des exemptions pour les batteries sodium-ion et solides jusqu'en 2028 fournit un stimulus fiscal vers les chimies de nouvelle génération.
- Le programme PLI en Inde exige une augmentation progressive de la valeur ajoutée domestique (25 % à 60 % en 5 ans) et attire les investissements dans la fabrication de cellules, mais la période de gestation jusqu'à la fin 2024 signifie que les obligations de performance commencent en 2025.
- Le report des obligations de diligence raisonnable de l'UE de 2025 à 2027 indique des défis d'adaptation réglementaire et donne plus de temps aux opérateurs économiques pour établir des politiques d'approvisionnement conformes.
Réglementation du cycle de vie : Contenu recyclé, passeports et diligence raisonnable
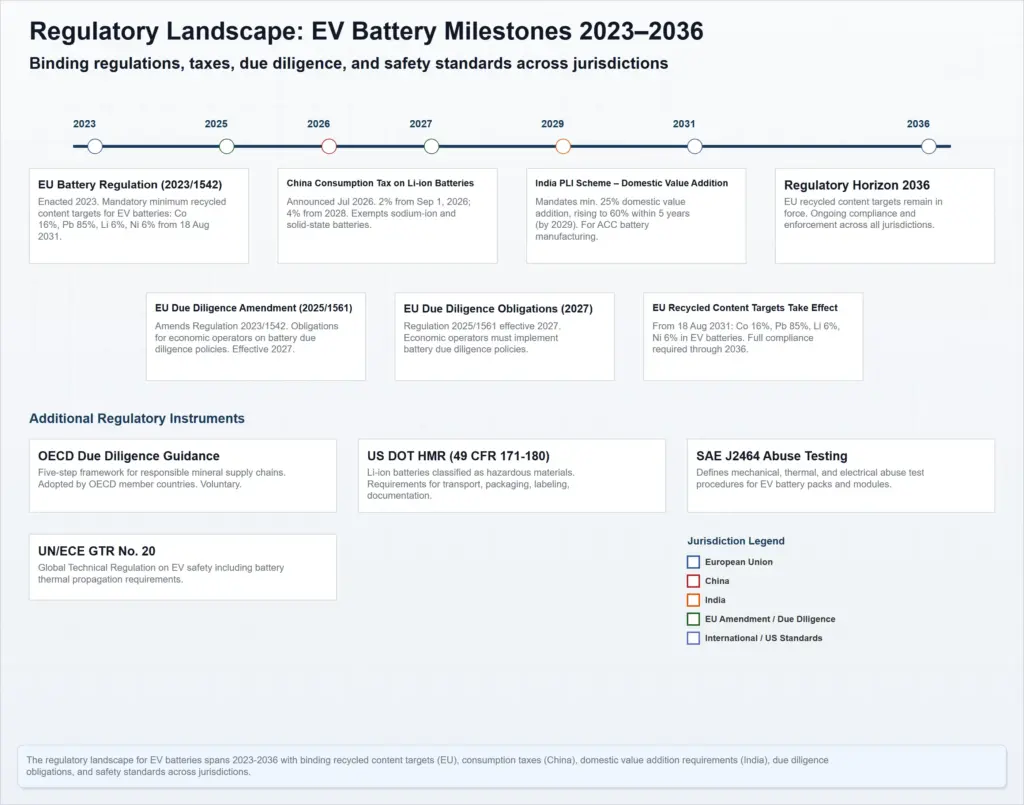
La réglementation européenne sur les batteries (2023/1542) établit les obligations les plus détaillées en matière de cycle de vie pour les batteries mises sur le marché européen. À partir du 18 août 2031, les batteries de véhicules électriques doivent contenir un minimum de contenu recyclé : 16 % de cobalt, 85 % de plomb, 6 % de lithium et 6 % de nickel. Ces cibles augmentent en 2036. Pour les batteries portables en déchets, les objectifs de collecte sont de 63 % à la fin de 2027 et de 73 % à la fin de 2030. Les objectifs de récupération des matières pour le cobalt, le lithium et le nickel sont étalés : 90 % de cobalt d'ici 2027, passant à 95 % d'ici 2031 ; 50 % de lithium d'ici 2027, passant à 80 % d'ici 2031 ; 90 % de nickel d'ici 2027, passant à 95 % d'ici 2031. L'article 77 de la réglementation impose un passeport de batterie pour les batteries de véhicules électriques et les batteries industrielles de plus de 2 kWh à partir du 18 février 2027. Ce registre numérique suit les matériaux, les composants et les données du cycle de vie, affectant les opérateurs économiques (fabricants de cellules, intégrateurs de pack, OEM) et nécessitant une infrastructure importante de gestion des données. Les obligations de diligence raisonnable couvrant l'approvisionnement du cobalt, du graphite naturel, du lithium et du nickel étaient initialement applicables à partir du 18 août 2025. Cependant, la réglementation (UE) 2025/1561 a reporté la date d'application au 18 août 2027, en mentionnant le besoin de temps suffisant pour notifier les organismes d'évaluation de la conformité et permettre aux opérateurs de se préparer. La Directive de diligence raisonnable de l'OCDE pour les chaînes d'approvisionnement responsables des minéraux issus de régions touchées par des conflits ou à risque élevé fournit un cadre à cinq étapes utilisé comme norme internationale volontaire et cité dans la législation européenne. Ces règles affectent directement les fabricants de cellules, les recycleurs de batteries et les OEM de véhicules électriques qui approvisionnent ou vendent en Europe. Le report de deux ans sur la diligence raisonnable montre la complexité de la mise en œuvre et donne un avantage stratégique aux pionniers du recyclage et de la traçabilité.| Exigence | Valeurs cibles | Dates d'application | Participants concernés |
|---|---|---|---|
| Contenu recyclé (cobalt, plomb, lithium, nickel) | Co 16 %, Pb 85 %, Li 6 %, Ni 6 % (augmentation en 2036) | 18 août 2031 (cibles plus élevées en 2036) | Fabricants de cellules, assemblage de pack, OEM |
| Collecte de batteries portables en déchets | 63 % à la fin 2027 ; 73 % à la fin 2030 | 31 décembre 2027 ; 31 décembre 2030 | Recycleurs, schémas de collecte, OEM |
| Récupération des matières (Co, Li, Ni) | Co 90 % / 95 %, Li 50 % / 80 %, Ni 90 % / 95 % | Fin 2027 / Fin 2031 | Recycleurs, traiteurs de déchets |
| Passeport de batterie | Enregistrement électronique selon l'article 77 | 18 février 2027 | Opérateurs économiques mettant sur le marché européen des batteries de véhicules électriques/industrielles de plus de 2 kWh |
| Diligence raisonnable (approvisionnement, traitement, commerce du cobalt, du graphite, du lithium, du nickel) | Vérification par des organismes notifiés | Reporté du 18 août 2025 au 18 août 2027 | Tous les opérateurs économiques de la chaîne d'approvisionnement |
Normes mondiales de sécurité et de transport
Les réglementations sur la sécurité des batteries et les normes de test volontaires créent un environnement de conformité à plusieurs niveaux. La réglementation technique mondiale de l'UN/ECE n° 20 (GTR n° 20) sur la sécurité des véhicules électriques inclut des exigences relatives à la propagation thermique des systèmes de stockage d'énergie rechargeables (REESS). Elle s'applique aux véhicules passagers (catégorie M) et aux camions (catégorie N) dont la vitesse de conception maximale est supérieure à 25 km/h, à l'exception des véhicules connectés à l'électricité de manière permanente. Cette réglementation entraîne des modifications du design des packs pour empêcher la propagation de la défaillance thermique entre les cellules. Aux États-Unis, les Règlements sur les matières dangereuses de la DOT (49 CFR parties 171–180) classent les batteries lithium-ion comme matières dangereuses. Les transporteurs doivent se conformer aux règles de conditionnement, d'étiquetage, de documentation et de manipulation prévues à l'article 49 CFR 173.185. Ces exigences s'appliquent à toutes les expéditions vers, depuis ou au sein des États-Unis et imposent des tests conformes au Manuel des tests et critères de l'ONU, section 38.3. Les normes volontaires complètent ces règles contraignantes. La norme SAE J2464 définit les procédures de test d'abuse pour les packs de batterie des véhicules électriques couvrant les conditions d'abuse mécanique, thermique et électrique. La norme SAE J2929 établit les critères de sécurité minimum pour les systèmes de batterie de propulsion à base de lithium. La série ISO 6469 spécifie les exigences de sécurité pour les véhicules routiers propulsés électriquement, notamment la protection contre les chocs électriques et les événements thermiques. La série ISO 12405 fournit des procédures de test pour les performances, la fiabilité et l'abuse des packs et systèmes de batterie lithium-ion. Ensemble, ces normes augmentent les coûts de test et de certification. Elles créent également un marché pour des services de test et de certification dédiés, car les fabricants doivent démontrer la conformité pour accéder à plusieurs régions.| Juridiction | Norme / Réglementation | Exigences clés | Statut |
|---|---|---|---|
| UN/ECE (pays adoptant) | Réglementation technique mondiale n° 20 | Exigences de propagation thermique pour REESS ; s'applique aux véhicules des catégories M et N | Règlement contraignant dans les pays adoptants |
| États-Unis (DOT) | Règlements sur les matières dangereuses 49 CFR parties 171–180 | Classification des batteries lithium-ion comme matières dangereuses ; conditionnement, étiquetage, documentation | Règlement fédéral contraignant |
| Monde (SAE International) | SAE J2464 | Procédures de test d'abuse : mécanique, thermique, électrique | Norme volontaire (souvent citée) |
| Monde (SAE International) | SAE J2929 | Critères de sécurité minimum pour les systèmes de batterie de propulsion | Norme volontaire |
| Monde (ISO) | Série ISO 6469 | Spécifications de sécurité pour les véhicules routiers propulsés électriquement (choc électrique, événements thermiques) | Norme internationale volontaire |
| Monde (ISO) | Série ISO 12405 | Spécification de test pour les packs et systèmes de batterie lithium-ion (performance, fiabilité, abuse) | Norme internationale volontaire |
Politiques fiscales et incitations à la localisation
Les mesures fiscales en Chine et en Inde orientent les investissements et les choix technologiques. La Chine a annoncé en juillet 2026 une taxe progressive sur les batteries lithium-ion, mettant fin à une exemption de 11 ans. À partir du 1er septembre 2026, les batteries lithium-ion sont soumises à une taxe de 2 %, passant à 4 % à partir du 1er septembre 2027. À l'inverse, les batteries sodium-ion, les batteries à état solide, les piles à combustible et certaines cellules photovoltaïques avancées sont exemptées de cette taxe jusqu'au 31 décembre 2028. Cela crée un désavantage clair en termes de coût pour la chimie lithium-ion par rapport aux alternatives de nouvelle génération, encourageant ainsi le développement et l'adoption des systèmes sodium-ion et à état solide. Le programme d'incitation liée à la production (PLI) en Inde pour la fabrication de batteries de type Advanced Chemistry Cell (ACC) exige aux entreprises bénéficiaires d'atteindre un minimum d'ajout de valeur national de 25 %, augmentant à 60 % au cours des cinq années suivantes. Le programme exige également un investissement de 225 crore de roupies par GWh de capacité engagée, à réaliser dans un délai de deux ans à partir de la date désignée. La période de gestation s'étend du 1er janvier 2023 au 31 décembre 2024, suivie d'une période de performance du 1er janvier 2025 au 31 décembre 2029. Trois entreprises ont été allouées 30 GWh de capacité, avec 20 GWh disponibles pour une nouvelle attribution. Ces exigences affectent directement les fabricants de cellules investissant en Inde, favorisant ceux capables de construire des chaînes d'approvisionnement locales.| Juridiction | Politique | Exigence / Incitation | Dates d'application / Échéance | Exonérations / Notes |
|---|---|---|---|---|
| Chine | Taxe sur les batteries | Taxe de 2 % sur les batteries lithium-ion à partir de septembre 2026 ; 4 % à partir de septembre 2027 | 1er septembre 2026 (première phase) ; 1er septembre 2027 (deuxième phase) | Exonération des batteries sodium-ion, des batteries à état solide, des piles à combustible jusqu'au 31 décembre 2028 |
| Inde | Schéma PLI pour la chimie avancée (ACC) | Valeur ajoutée domestique minimale de 25 %, passant à 60 % en 5 ans ; investissement de 225 crore/GWh en 2 ans | Période de gestation : 1er janvier 2023 – 31 décembre 2024 ; Période de performance : 1er janvier 2025 – 31 décembre 2029 | 30 GWh alloués ; 20 GWh disponibles pour une nouvelle allocation |