Global Animation Market 2025-2033
Global Animation Market Overview
The Global Animation Market is expanding rapidly as streaming platforms, gaming ecosystems, and brand marketers intensify demand for premium animated content across formats. Advances in real-time rendering, virtual production, and AI-assisted pipelines are compressing production cycles and enabling high-quality output at scale for films, episodic series, advertisements, and interactive media.
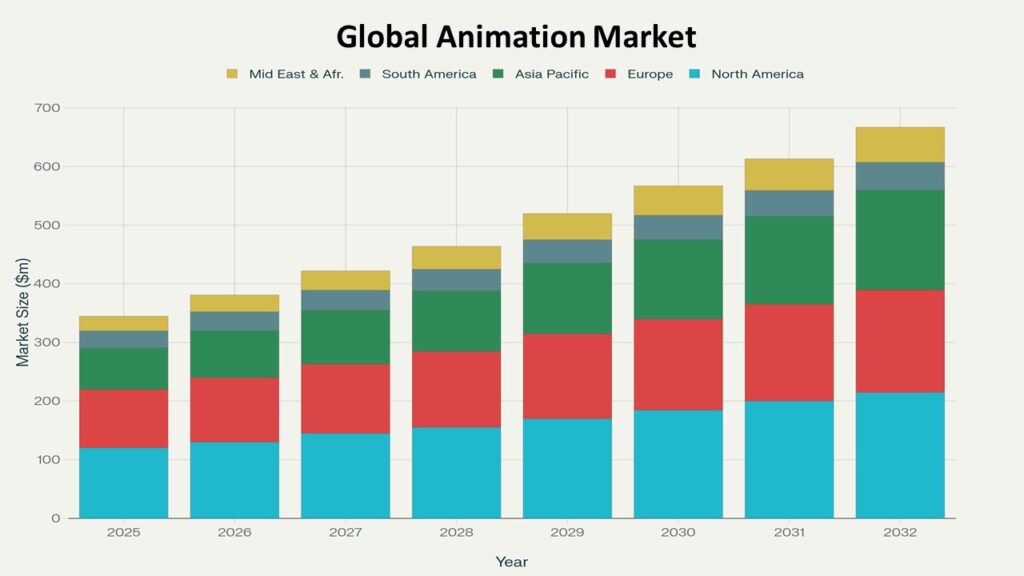
According to Pheonix’s Demand Forecast Engine, the global animation market is projected to grow from USD 410 billion in 2025 to approximately USD 700 billion by 2033, reflecting a CAGR of 6.12%. In 2024, North America accounted for the largest share (38.9%), while Asia Pacific is expected to be the fastest-growing region with a CAGR of 10.8% during the forecast period.
Key Drivers of Market Growth
- Surging Streaming & Global IP Monetization
OTT platforms are scaling investments in original animation to drive subscriber acquisition and international franchising. Pheonix’s Sentiment Analyzer Tool shows sustained audience preference for animated series across family and young-adult segments. - Real-Time Engines & Virtual Production
Adoption of real-time rendering (game engines) and LED volume workflows is reducing iteration time and costs, accelerating time-to-market for series, shorts, and commercials. - Gaming Convergence & Transmedia Storytelling
Cross-pollination between gaming and cinematic pipelines, along with transmedia IP strategies (films, series, games, merchandise), is expanding revenue breadth and lifetime value of franchises.
Market Segmentation
By Format/Technique
- 2D Animation
- 3D CGI Animation
- Visual Effects (VFX)
- Stop-Motion
- Motion Graphics & Mixed Media
By Application
- Film & TV/Episodic
- Gaming & Interactive
- Advertising & Brand Content
- OTT/Streaming Originals
- AR/VR/XR Experiences
- Education & e-Learning
By End User
- Film/TV Studios & Streamers
- Game Publishers/Developers
- Advertising Agencies & Brands
- Educational Content Providers
- Independent/Creator Economy Studios
Region-Level Insights
- North America – CAGR (2025–2033): 13.3% (Largest Market)
Dominant due to major studios, strong streamer commissioning, and mature merchandising/licensing networks. Growth supported by virtual production hubs and tax-incentivized states/provinces. - Europe
Robust co-production ecosystem and public funding frameworks. France, UK, Ireland, Spain, and Nordics lead in TV/feature co-productions and boutique high-end studios; Eastern Europe expanding service work. - Asia Pacific – CAGR (2025–2033): 10.8% (Fastest Growing Region)
Growth driven by India, China, Japan, and South Korea through streamer localization, gaming content, and service-to-original transitions. Pheonix’s Construction Activity Mapping System highlights new studio clusters and training pipelines in Tier 2 cities. - Latin America
Rising share via service studios and culturally distinctive originals. Mexico and Brazil anchor regional growth with supportive incentives and growing OTT demand.
Leading Companies in the Market
- The Walt Disney Company (Walt Disney Animation, Pixar)
- Warner Bros. Discovery (Warner Bros. Animation)
- DreamWorks Animation (NBCUniversal)
- Sony Pictures Animation / Imageworks
- Illumination Entertainment
- Netflix Animation
- Toei Animation Co., Ltd.
- Studio Ghibli, Inc.
- Wētā FX
- DNEG / ReDefine
These players are investing in real-time tools, global production footprints, and creator partnerships to accelerate content pipelines and franchise development.
Strategic Intelligence and AI-Backed Insights
- Pheonix Demand Forecast Engine modeled spend trajectories across OTT commissioning slates, gaming content budgets, and merchandise tie-in revenues.
- Construction Activity Mapping System identified emerging virtual production stages and training academies in APAC and EMEA.
- Sentiment Analyzer Tool indicates a post-2023 uptick in young-adult animation demand and non-English originals.
- Automated Porter’s Five Forces show high competitive rivalry and moderate buyer power; switching costs rise with proprietary tools, assets, and pipeline integrations.
Forecast Snapshot: 2025–2033
| Metric | Value |
| 2025 Market Size | USD 410 Billion |
| 2033 Market Size | ~USD 700 Billion |
| CAGR (2025–2033) | 6.12% |
| Largest Region (2024) | North America (13.3% CAGR) |
| Fastest Growing Region | Asia Pacific (10.8% CAGR) |
| Top Segment | 3D CGI & VFX for OTT/Gaming |
| Key Trend | Real-time/virtual production & AI-assisted workflows |
| Future Growth Focus | Transmedia IP and localized originals in APAC/EMEA |
Why the Global Market Remains Critical
- Animation is a cornerstone of OTT differentiation and global IP export.
- Real-time and AI tools unlock scale, speed, and cost efficiency across formats.
- Gaming convergence expands monetization via live ops, DLC, and crossovers.
- Incentive-backed studio clusters enable distributed, resilient production capacity.
Final Takeaway
The Global Animation Market is entering a high-output, transmedia-driven era, propelled by streaming demand, gaming convergence, and production technology breakthroughs. Companies that combine agile pipelines, global talent networks, and strong IP strategies are best positioned to capture multi-format value across regions.
Table of Contents
1. Overview
1.1 Market Context: The Expanding Role of Animation in OTT, Gaming & Advertising
1.2 Market Snapshot: USD 410B (2025) → ~USD 700B (2033) | CAGR 6.12%
1.3 Regional Distribution: North America Dominant, Asia Pacific Fastest-Growing
1.4 Pheonix Methodology: Demand Forecast Engine, Sentiment Analyzer, Construction Mapping
2. Key Drivers of Market Growth
2.1 Surging Streaming & Global IP Monetization
2.2 Real-Time Rendering, Virtual Production & AI Pipelines
2.3 Gaming Convergence and Transmedia Storytelling
2.4 Expanding Global Talent Networks and Studio Clusters
2.5 Regulatory Incentives & Tax Credits Supporting Virtual Production
3. Market Segmentation
3.1 By Format/Technique
• 2D Animation
• 3D CGI Animation
• Visual Effects (VFX)
• Stop-Motion
• Motion Graphics & Mixed Media
3.2 By Application
• Film & TV/Episodic
• Gaming & Interactive
• Advertising & Brand Content
• OTT/Streaming Originals
• AR/VR/XR Experiences
• Education & e-Learning
3.3 By End User
• Film/TV Studios & Streamers
• Game Publishers/Developers
• Advertising Agencies & Brands
• Educational Content Providers
• Independent/Creator Economy Studios
3.4 By Geography
• North America
• Europe
• Asia Pacific
• Latin America
• Middle East & Africa
4. Region-Level Insights
4.1 North America (13.3% CAGR | Largest Market)
• Major studios, streamer commissioning, strong licensing/merchandising
• Tax-incentivized states and virtual production hubs
4.2 Europe
• Co-production ecosystem, public funding frameworks
• France, UK, Ireland, Spain, Nordics leading; Eastern Europe scaling service work
4.3 Asia Pacific (10.8% CAGR | Fastest Growing Region)
• India, China, Japan, South Korea – gaming/streaming growth
• Studio clusters in Tier 2 cities, training pipelines, localization focus
4.4 Latin America
• Growth anchored by Mexico & Brazil
• Service studios expanding and distinctive cultural originals emerging
4.5 Middle East & Africa
• Nascent but growing with local streaming platforms & education content
5. Competitive Landscape
5.1 Major Global Leaders
• The Walt Disney Company (Pixar, Walt Disney Animation)
• Warner Bros. Discovery (Warner Bros. Animation)
• DreamWorks Animation (NBCUniversal)
• Sony Pictures Animation / Imageworks
• Illumination Entertainment
• Netflix Animation
• Toei Animation, Studio Ghibli, Wētā FX, DNEG/ReDefine
5.2 Competitive Intelligence Grid – Market Reach vs. IP Depth
5.3 Strategic Partnerships: Streamers, Gaming Studios & Global Co-Productions
6. Strategic Intelligence and AI-Backed Insights
6.1 Pheonix Demand Forecast Engine: Spend Projections for OTT, Gaming, IP Merchandising
6.2 Construction Activity Mapping: Virtual Production & Training Hubs in APAC & EMEA
6.3 Sentiment Analyzer: Shifts in Young-Adult & Non-English Animation Demand
6.4 Automated Porter’s Five Forces: Competitive Rivalry & Buyer Dynamics
6.5 AI & Real-Time Production as Pipeline Differentiators
7. Forecast Snapshot (2025–2033)
7.1 Market Size: USD 410B → ~USD 700B
7.2 CAGR: 6.12%
7.3 Largest Region (2024): North America (38.9%)
7.4 Fastest Growing Region: Asia Pacific (10.8% CAGR)
7.5 Top Segment: 3D CGI & VFX for OTT/Gaming
7.6 Key Trend: Real-Time/Virtual Production & AI Workflows
7.7 Future Growth Focus: Transmedia IP & Localized Originals
8. Why the Global Market Remains Critical
8.1 Animation as Cornerstone of OTT Differentiation & IP Export
8.2 Real-Time & AI Tools Unlocking Scale, Speed, Cost Efficiency
8.3 Gaming Convergence Expanding Monetization Lifecycles
8.4 Incentive-Backed Studio Clusters Driving Distributed Production
9. Pheonix Analyst Insights & Final Takeaway
9.1 Market entering a transmedia-driven, high-output era
9.2 Best positioned players: IP owners with agile pipelines & global networks
9.3 Long-term focus: localized content in APAC/EMEA, gaming integration, AI-enhanced pipelines
10. Appendices
10.1 Pheonix Research Methodology
10.2 Glossary (VFX, CGI, Transmedia, Virtual Production, etc.)
10.3 Market Map by Format & Application
10.4 Data Sources & Model Assumptions