Global Japanese Restaurant Market Report Analysis, Size and Forecast 2026-2033
Global Japanese Restaurant Market Forecast Snapshot: 2026–2033
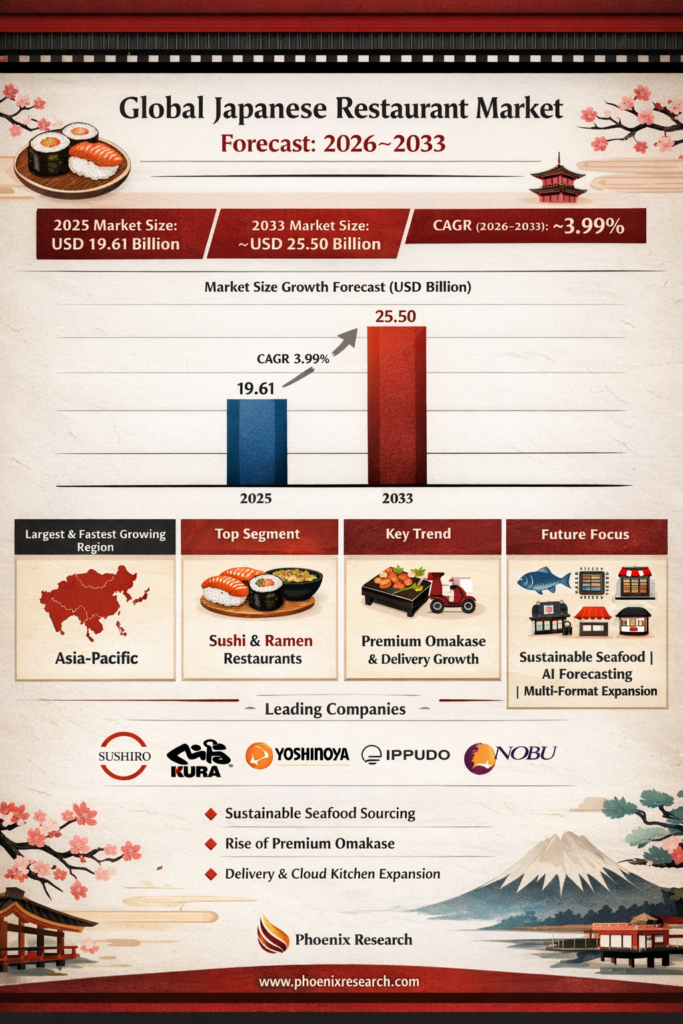
| Metric | Value |
|---|---|
| 2025 Market Size | USD 19.61 Billion |
| 2033 Market Size | ~USD 25.50 Billion |
| CAGR (2026–2033) | ~3.99% |
| Largest Region | Asia-Pacific |
| Fastest Growing Region | Asia-Pacific |
| Top Segment | Sushi & Ramen Restaurants |
| Key Trend | Premium Omakase Expansion & Delivery-Led Growth |
| Future Focus | Sustainable Seafood, AI-Based Demand Forecasting & Multi-Format Expansion |
Global Japanese Restaurant Market Overview
The Global Japanese Restaurant Market encompasses full-service restaurants, quick-service formats, premium omakase concepts, ramen specialty outlets, sushi chains, izakaya dining formats, and delivery-only cloud kitchens specializing in Japanese cuisine.
Japanese food has become super popular. It's because people worldwide love Japanese culture like sushi and ramen, healthy food is trending, fancy dining is in demand, and food delivery apps make it easy to get Japanese food
According to Pheonix Research, the Global Japanese Restaurant Market size is valued at USD 19.61 billion in 2025 and is projected to reach approximately USD 25.50 billion by 2033, reflecting a CAGR of ~3.99% during 2026–2033.
Asia-Pacific holds the largest share due to strong domestic consumption in Japan, China, and Southeast Asia. The region is also expected to register the fastest growth, supported by urban expansion, tourism recovery, and rising middle-class dining expenditure.
The Post-2025 outlook for the Global Japanese Restaurant Market indicates accelerated premiumization, wider adoption of delivery-first and cloud-kitchen formats, strengthened sustainable seafood sourcing practices, and greater integration of AI-powered inventory management and customer personalization systems to enhance operational efficiency and profitability.
Key Drivers of Global Japanese Restaurant Market Growth
1. Rising Global Popularity of Japanese Cuisine
Sushi, ramen, donburi, and teppanyaki are widely perceived as premium yet healthy dining options. The global acceptance of seafood-based diets and umami flavors continues to drive adoption.
2. Expansion of Delivery & Cloud Kitchens
Japanese cuisine is highly compatible with takeaway and delivery formats. Sushi boxes, ramen bowls, and bento meals are scalable across digital platforms, reducing capital-intensive dine-in dependency.
3. Premiumization & Experiential Dining
Omakase, chef-led tasting menus, and kaiseki experiences are gaining traction among high-income urban consumers seeking authenticity and exclusivity.
4. Tourism & Urban Food Culture
International tourism and metropolitan entertainment districts significantly boost Japanese restaurant footfall, especially in luxury and fine-dining segments.
5. Franchise & Chain Expansion
Global brands such as Sushiro, Kura Sushi, Yoshinoya, and Ippudo are expanding internationally through scalable franchise models.
Global Japanese Restaurant Market Segmentation
1.By Restaurant Format
1.1 Full-Service Japanese Restaurants
1.1.1 Sushi-Focused Restaurants
1.1.1.1 Traditional Sushi Bars
1.1.1.2 Conveyor Belt Sushi (Kaiten-Zushi)
1.1.1.3 Premium Sushi Lounges
1.1.2 Ramen Specialty Restaurants
1.1.2.1 Tonkotsu Ramen Shops
1.1.2.2 Regional Ramen Concepts
1.1.2.3 Fast-Casual Ramen Chains
1.1.3 Izakaya & Small-Plate Concepts
1.1.3.1 Traditional Izakaya
1.1.3.2 Modern Fusion Izakaya
1.1.3.3 Bar-Led Japanese Dining
1.1.4 Teppanyaki & Yakiniku Restaurants
1.1.4.1 Live-Grill Teppanyaki
1.1.4.2 Yakiniku BBQ Dining
1.1.4.3 Interactive Chef-Led Formats
1.2 Quick Service Japanese Restaurants
1.2.1 Sushi Express Counters
1.2.1.1 Mall-Based Units
1.2.1.2 Transit Hub Counters
1.2.1.3 Grab-and-Go Sushi Bars
1.2.2 Bento & Donburi Chains
1.2.2.1 Rice Bowl Quick Service
1.2.2.2 Katsu & Tempura Counters
1.2.2.3 Value Meal Chains
1.2.3 Japanese Street-Style Formats
1.2.3.1 Takoyaki Stalls
1.2.3.2 Okonomiyaki Counters
1.2.3.3 Pop-Up Japanese Food Trucks
1.3 Premium & Fine Dining Japanese
1.3.1 Omakase Restaurants
1.3.1.1 Michelin-Star Omakase
1.3.1.2 Chef-Owned Boutique Concepts
1.3.1.3 Reservation-Only Dining
1.3.2 Kaiseki Dining
1.3.2.1 Seasonal Kaiseki
1.3.2.2 Cultural Experience Dining
1.3.3 Luxury Hotel Japanese Restaurants
1.3.3.1 Five-Star Hotel Concepts
1.3.3.2 Resort-Based Japanese Dining
1.4 Cloud Kitchen & Delivery-Only Japanese
1.4.1 Sushi Delivery Brands
1.4.1.1 App-Based Sushi Chains
1.4.1.2 Subscription Sushi Models
1.4.2 Multi-Brand Asian Cloud Kitchens
1.4.2.1 Japanese + Korean Hybrid Kitchens
1.4.2.2 Pan-Asian Delivery Brands
1.4.3 Aggregator-Led Virtual Brands
1.4.3.1 Platform-Owned Concepts
1.4.3.2 Influencer-Led Delivery Brands
2. By Cuisine Type
2.1 Sushi & Sashimi
2.1.1 Nigiri Sushi
2.1.1.1 Traditional Tuna (Maguro)
2.1.1.2 Salmon (Sake)
2.1.1.3 Ebi (Shrimp)
2.1.1.4 Tamago (Egg)
2.1.2 Maki Rolls
2.1.2.1 Hosomaki (Thin Rolls)
2.1.2.2 Uramaki (Inside-Out Rolls)
2.1.2.3 Futomaki (Thick Rolls)
2.1.2.4 Specialty / Fusion Rolls
2.1.3 Sashimi
2.1.3.1 Tuna Sashimi
2.1.3.2 Salmon Sashimi
2.1.3.3 Yellowtail (Hamachi)
2.1.3.4 Premium Seasonal Fish
2.1.4 Premium Sushi Concepts
2.1.4.1 Omakase Sushi
2.1.4.2 Chef’s Signature Platters
2.1.4.3 Luxury Seafood (Uni, Toro, Caviar Fusion)
2.2 Ramen & Noodles
2.2.1 Ramen Varieties
2.2.1.1 Tonkotsu Ramen
2.2.1.2 Shoyu Ramen
2.2.1.3 Miso Ramen
2.2.1.4 Shio Ramen
2.2.2 Regional & Specialty Ramen
2.2.2.1 Hakata Style
2.2.2.2 Sapporo Style
2.2.2.3 Tokyo Style
2.2.3 Other Japanese Noodles
2.2.3.1 Udon
2.2.3.2 Soba
2.2.3.3 Cold Noodle Variants
2.3 Grilled & Hot Plate (Yakiniku, Teppanyaki)
2.3.1 Yakiniku (Japanese BBQ)
2.3.1.1 Beef Yakiniku
2.3.1.2 Wagyu Cuts
2.3.1.3 Mixed Meat Platters
2.3.2 Teppanyaki
2.3.2.1 Seafood Teppanyaki
2.3.2.2 Steak Teppanyaki
2.3.2.3 Interactive Chef-Led Dining
2.3.3 Robatayaki & Grill Variants
2.3.3.1 Skewered Meats
2.3.3.2 Grilled Vegetables
2.3.3.3 Seafood Skewers
2.4 Donburi, Katsu & Bento Meals
2.4.1 Donburi (Rice Bowls)
2.4.1.1 Gyudon (Beef Bowl)
2.4.1.2 Katsudon
2.4.1.3 Unadon (Eel Bowl)
2.4.2 Katsu Variants
2.4.2.1 Chicken Katsu
2.4.2.2 Pork Tonkatsu
2.4.2.3 Curry Katsu
2.4.3 Bento Meals
2.4.3.1 Standard Bento Boxes
2.4.3.2 Premium Executive Bento
2.4.3.3 Healthy / Low-Calorie Bento
2.5 Japanese Desserts & Beverages
2.5.1 Traditional Desserts
2.5.1.1 Mochi
2.5.1.2 Dorayaki
2.5.1.3 Matcha-Based Desserts
2.5.2 Modern Japanese Sweets
2.5.2.1 Japanese Cheesecake
2.5.2.2 Matcha Tiramisu
2.5.2.3 Fusion Pastries
2.5.3 Beverages
2.5.3.1 Matcha & Green Tea
2.5.3.2 Japanese Soft Drinks
2.5.3.3 Sake & Japanese Alcoholic Beverages
3. By Distribution Channel
3.1 Dine-In
3.1.1 Casual Dining
3.1.1.1 Family-Oriented Restaurants
3.1.1.2 Urban Casual Outlets
3.1.2 Premium Dining
3.1.2.1 Omakase Counters
3.1.2.2 Fine Dining Japanese
3.1.3 Mall & Hospitality Dining
3.1.3.1 Shopping Mall Restaurants
3.1.3.2 Hotel-Based Japanese Restaurants
3.2 Takeaway
3.2.1 Counter Pickup
3.2.1.1 Sushi Grab-and-Go
3.2.1.2 Bento Express Counters
3.2.2 Pre-Order Pickup
3.2.2.1 App-Based Pickup
3.2.2.2 Scheduled Meal Pickup
3.3 Online Delivery
3.3.1 Third-Party Aggregators
3.3.1.1 App-Based Delivery
3.3.1.2 Subscription Delivery Models
3.3.2 Brand-Owned Delivery
3.3.2.1 In-House Delivery Fleet
3.3.2.2 Hybrid Delivery Model
3.3.3 Cloud Kitchen Delivery
3.3.3.1 Single-Brand Japanese Kitchens
3.3.3.2 Multi-Brand Asian Kitchens
3.4 Retail Ready-to-Eat
3.4.1 Supermarket Sushi
3.4.1.1 Fresh Sushi Packs
3.4.1.2 Value Sushi Combos
3.4.2 Meal Kits
3.4.2.1 Ramen Kits
3.4.2.2 DIY Sushi Kits
4. By End-User
4.1 Individual Consumers
4.1.1 Millennials
4.1.1.1 Urban Professionals
4.1.1.2 Experience-Oriented Diners
4.1.2 Gen Z
4.1.2.1 Social Media-Driven Consumers
4.1.2.2 Trend-Focused Diners
4.1.3 Working Professionals
4.1.3.1 Lunch Crowd
4.1.3.2 After-Work Dining
4.1.4 Families
4.1.4.1 Weekend Dining
4.1.4.2 Celebration Dining
4.2 Corporate Customers
4.2.1 Corporate Catering
4.2.1.1 Executive Meetings
4.2.1.2 Corporate Events
4.2.2 Office Meal Programs
4.2.2.1 Subscription Lunch Plans
4.2.2.2 Bulk Bento Orders
4.2.3 Event Orders
4.2.3.1 Private Parties
4.2.3.2 Business Conferences
4.3 Institutional Clients
4.3.1 Universities
4.3.1.1 Campus Food Courts
4.3.1.2 Student Meal Contracts
4.3.2 Hospitals
4.3.2.1 Patient Meal Services
4.3.2.2 Staff Cafeterias
4.3.3 Office Complexes
4.3.3.1 IT Parks
4.3.3.2 Business District Cafeterias
Leading Companies in the Global Japanese Restaurant Market
-
Genki Sushi
-
Yoshinoya
-
Ippudo
-
Benihana
-
Nobu Hospitality
-
Zuma Restaurants
-
MOS Burger
The market remains highly fragmented, with a strong presence of independent premium operators alongside global franchise chains.
Table of Contents
1. Market Forecast Snapshot (2026–2033)
1.1 2025 Market Size – USD 19.61 Billion
1.2 2033 Market Size – ~USD 25.50 Billion
1.3 CAGR (2026–2033) – ~3.99%
1.4 Largest Market – Asia-Pacific
1.5 Fastest Growing Region – Asia-Pacific
1.6 Dominant Segment – Sushi & Ramen Restaurants
1.7 Key Trend – Premium Omakase Expansion & Delivery-Led Growth
1.8 Future Focus – Sustainable Seafood, AI-Based Demand Forecasting, Multi-Format Expansion
2. Global Japanese Restaurant Market Overview
2.1 Market Definition & Scope
2.2 Evolution of the Global Japanese Restaurant Industry
2.3 Premiumization & Experiential Dining
2.4 Cloud Kitchen & Delivery Expansion
2.5 Technology Integration & AI Adoption
2.6 Post-2025 Market Outlook
3. Key Drivers of Global Japanese Restaurant Market Growth
3.1 Rising Global Popularity of Japanese Cuisine
3.2 Expansion of Delivery & Cloud Kitchen Formats
3.3 Premiumization & Omakase Experiences
3.4 Tourism & Urban Lifestyle Trends
3.5 Franchise & Chain Expansion
3.6 Sustainability & Ethical Seafood Sourcing
4. Market Segmentation by Restaurant Format
4.1 Full-Service Japanese Restaurants
4.1.1 Sushi-Focused Restaurants
4.1.1.1 Traditional Sushi Bars
4.1.1.2 Conveyor Belt Sushi (Kaiten-Zushi)
4.1.1.2 Premium Sushi Lounges
4.1.2 Ramen Specialty Restaurants
4.1.2.1 Tonkotsu Ramen Shops
4.1.2.2 Regional Ramen Concepts
4.1.2.3 Fast-Casual Ramen Chains
4.1.3 Izakaya & Small-Plate Concepts
4.1.3.1 Traditional Izakaya
4.1.3.2 Modern Fusion Izakaya
4.1.2.3 Bar-Led Japanese Dining
4.1.4 Teppanyaki & Yakiniku Restaurants
4.1.4.1 Live-Grill Teppanyaki
4.1.4.2 Yakiniku BBQ Dining
4.1.4.3 Interactive Chef-Led Formats
4.2 Quick Service Japanese Restaurants
4.2.1 Sushi Express Counters (
4.2.2 Bento & Donburi Chains
4.2.3 Japanese Street-Style Formats
4.3 Premium & Fine Dining Japanese
4.3.1 Omakase Restaurants
4.3.2 Kaiseki Dining
4.3.3 Luxury Hotel Japanese Restaurants
4.4 Cloud Kitchen & Delivery-Only Japanese
4.4.1 Sushi Delivery Brands
4.4.2 Multi-Brand Asian Cloud Kitchens
4.4.3 Aggregator-Led Virtual Brands
5. Market Segmentation by Cuisine Type
5.1 Sushi & Sashimi
5.1.1 Nigiri Sushi (Tuna, Salmon, Shrimp, Egg)
5.1.2 Maki Rolls (Hosomaki, Uramaki, Futomaki, Fusion Rolls)
5.1.3 Sashimi (Tuna, Salmon, Yellowtail, Seasonal Fish)
5.1.4 Premium Sushi Concepts (Omakase, Chef’s Signature, Luxury Seafood)
5.2 Ramen & Noodles
5.2.1 Ramen Varieties (Tonkotsu, Shoyu, Miso, Shio)
5.2.2 Regional & Specialty Ramen (Hakata, Sapporo, Tokyo Styles)
5.2.3 Other Japanese Noodles (Udon, Soba, Cold Noodles)
5.3 Grilled & Hot Plate (Yakiniku, Teppanyaki)
5.3.1 Yakiniku (Beef, Wagyu, Mixed Meat)
5.3.2 Teppanyaki (Seafood, Steak, Chef-Led)
5.3.3 Robatayaki & Grill Variants (Skewers, Vegetables, Seafood)
5.4 Donburi, Katsu & Bento Meals
5.4.1 Donburi (Gyudon, Katsudon, Unadon)
5.4.2 Katsu Variants (Chicken, Pork, Curry Katsu)
5.4.3 Bento Meals (Standard, Premium, Healthy/Low-Calorie)
5.5 Japanese Desserts & Beverages
5.5.1 Traditional Desserts (Mochi, Dorayaki, Matcha-Based)
5.5.2 Modern Japanese Sweets (Japanese Cheesecake, Matcha Tiramisu, Fusion Pastries)
5.5.3 Beverages (Matcha/Green Tea, Japanese Soft Drinks, Sake & Alcoholic Beverages)
6. Market Segmentation by Distribution Channel
6.1 Dine-In
6.1.1 Casual Dining (Family-Oriented, Urban Casual Outlets)
6.1.2 Premium Dining (Omakase Counters, Fine Dining Japanese)
6.1.Mall & Hospitality Dining (Shopping Mall Restaurants, Hotel-Based)
6.2 Takeaway
6.2.1 Counter Pickup (Grab-and-Go Sushi, Bento Express)
6.2.2 Pre-Order Pickup (App-Based, Scheduled Meal Pickup)
6.3 Online Delivery
6.3.1 Third-Party Aggregators (App-Based, Subscription Models)
6.3.2 Brand-Owned Delivery (In-House Fleet, Hybrid Delivery Models)
6.3.3 Cloud Kitchen Delivery (Single-Brand, Multi-Brand Asian Kitchens)
6.4 Retail Ready-to-Eat
6.4.1 Supermarket Sushi (Fresh Packs, Value Combos)
6.4.2 Meal Kits (Ramen Kits, DIY Sushi Kits)
7. Market Segmentation by End-User
7.1 Individual Consumers
7.1.1 Millennials (Urban Professionals, Experience-Oriented)
7.1.2 Gen Z (Social Media-Driven, Trend-Focused)
7.1.3 Working Professionals (Lunch Crowd, After-Work Dining)
7.1.4 Families (Weekend Dining, Celebration Dining)
7.2 Corporate Customers
7.2.1 Corporate Catering (Executive Meetings, Corporate Events)
7.2.2 Office Meal Programs (Subscription Lunch Plans, Bulk Bento Orders)
7.2.3 Event Orders (Private Parties, Business Conferences)
7.3 Institutional Clients
7.3.1 Universities (Campus Food Courts, Student Meal Contracts)
7.3.2 Hospitals (Patient Meals, Staff Cafeterias)
7.3.3 Office Complexes (IT Parks, Business District Cafeterias)
8. Market Segmentation by Region
8.1 North America
8.2 Europe
8.3 Asia-Pacific
8.4 Latin America
8.5 Middle East & Africa
9. Regional Insights
9.1 Asia-Pacific – Largest & Fastest-Growing Market
9.2 North America – Premium & Delivery-Led Expansion
9.3 Europe – Premiumization & Fusion Innovation
9.4 Middle East & Africa – Tourism & Luxury Growth
9.5 South America – Emerging Market Adoption
10. Competitive Landscape
10.1 Market Share Analysis
10.2 Competitive Positioning Matrix
10.3 Franchise & Chain Expansion
10.4 Premium & Omakase Concept Growth
10.5 Pricing & Delivery Strategies
11. Leading Companies
11.1 Sushiro
11.2 Kura Sushi
11.3 Genki Sushi
11.4 Yoshinoya
11.5 Ippudo
11.6 Benihana
11.7 Nobu Hospitality
11.8 Zuma Restaurants
11.9 MOS Burger
12. Strategic Intelligence & AI-Backed Insights
12.1 Pheonix Demand Forecast Engine
12.2 Consumer Behavior & Trend Analytics
12.3 Innovation Tracker – AI, Loyalty, Delivery Optimization
12.4 Porter’s Five Forces Analysis
13. Sustainability & Regulatory Landscape
13.1 Sustainable Seafood Sourcing
13.2 Eco-Friendly Packaging & Waste Reduction
13.3 Food Safety & Health Regulations
13.4 Responsible Dining Initiatives
14. Market Significance
14.1 Cultural & Lifestyle Influence
14.2 Contribution to Tourism & Hospitality
14.3 Employment & Supply Chain Impact
14.4 Premiumization & Consumer Experience
14.5 Repeat Visits & Brand Loyalty
15. Final Takeaway
15.1 Growth Outlook (2026–2033)
15.2 Dual-Engine Model (Premium Omakase vs. Quick-Service / Delivery)
15.3 Omnichannel Strategy – Dine-In, Takeaway, Delivery
15.4 AI & Technology-Driven Efficiency
15.5 Strategic Recommendations for Stakeholders