Global Sushi Restaurants Market Report 2026-2033

Global Sushi Restaurants Market Forecast Snapshot: 2026–2033

Metric Value
2025 Market Size USD 12.85 Billion
2033 Market Size ~USD 17.40 Billion
CAGR (2026–2033) ~3.9%
Largest Region Asia-Pacific
Fastest Growing Region North America
Top Segment Full-Service Sushi Restaurants
Key Trend Premium Omakase Growth & Delivery-Optimized Sushi Formats
Future Focus Sustainable Seafood, AI-Based Inventory Control & Global Franchise Expansion

Global Sushi Restaurants Market Overview

The Global Sushi Restaurants Market includes traditional sushi bars, conveyor-belt (kaiten-zushi) formats, premium omakase counters, sushi-focused casual dining chains, quick-service sushi kiosks, and delivery-only sushi cloud kitchens.

Sushi has evolved from a niche Japanese delicacy into a globally mainstream dining category. Its popularity is driven by increasing preference for seafood-based and perceived healthy meals, growing fascination with Japanese culinary culture, premium experiential dining demand, and strong compatibility with takeaway and delivery platforms.

According to Phoenix Research, the Global Sushi Restaurants Market size is valued at USD 12.85 billion in 2025 and is projected to reach approximately USD 17.40 billion by 2033, reflecting a CAGR of ~3.9% during 2026–2033.

Asia-Pacific holds the largest market share, supported by strong domestic consumption in Japan and expanding sushi chain penetration across China and Southeast Asia. North America represents the fastest-growing region, driven by premium sushi adoption, fusion innovation, and high online delivery penetration.

The Post-2025 outlook indicates rising premiumization through omakase experiences, automation in sushi preparation, AI-powered seafood inventory management, and expansion of scalable franchise-led sushi formats globally.
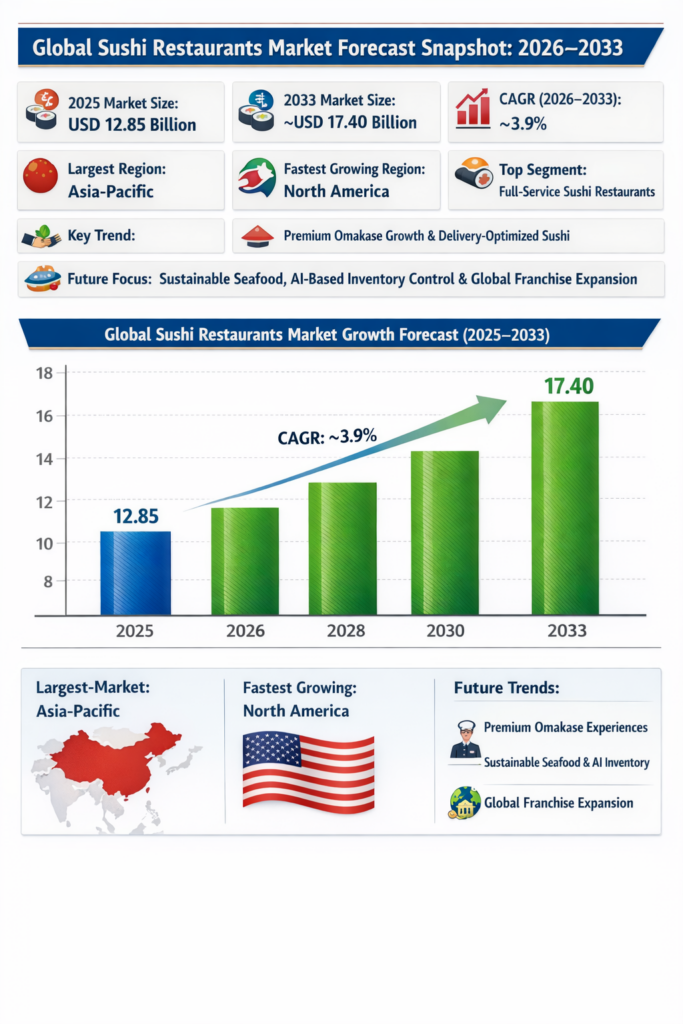

Global Sushi Restaurants Market


Key Drivers of Global Sushi Restaurants Market Growth

1. Global Acceptance of Sushi as a Mainstream Cuisine

Sushi is widely perceived as a premium yet healthy dining option. Growing demand for seafood-rich and low-fat diets supports long-term expansion.

2. Delivery & Takeaway Compatibility

Sushi’s compact format (boxes, platters, combo trays) makes it highly adaptable for takeaway and digital delivery ecosystems.

3. Premium Omakase & Experiential Dining

High-income consumers increasingly seek chef-led tasting menus and reservation-only sushi counters.

4. Franchise Expansion of Sushi Chains

Brands such as Sushiro, Kura Sushi, and Genki Sushi are accelerating international expansion through scalable franchise models.

5. Sustainable Seafood & Traceability Demand

Consumers increasingly demand responsibly sourced seafood, influencing procurement and brand positioning strategies.


Global Sushi Restaurants Market Segmentation


       1. By Restaurant Format

1.1 Full-Service Sushi Restaurants

1.1.1 Traditional Sushi Bars
1.1.1.1 Counter-Style Chef Interaction
1.1.1.2 Table-Service Sushi Dining
1.1.1.3 Family-Owned Independent Sushi Bars
1.1.1.4 Urban High-Street Sushi Restaurants
1.1.2 Premium Omakase Restaurants
1.1.2.1 Michelin-Star Omakase
1.1.2.2 Reservation-Only Boutique Concepts
1.1.2.3 Seasonal Tasting Menu Sushi
1.1.2.4 Luxury Seafood-Focused Omakase (Uni, Otoro, Caviar)
1.1.3 Sushi Lounges
1.1.3.1 Fusion Sushi Concepts
1.1.3.2 Bar-Integrated Sushi Dining
1.1.3.3 Nightlife-Oriented Sushi Venues
1.1.3.4 Hotel-Integrated Sushi Lounges
1.1.4 Casual Dining Sushi Chains
1.1.4.1 Mid-Scale National Chains
1.1.4.2 Regional Franchise Sushi Brands
1.1.4.3 Family-Oriented Sushi Dining
1.1.4.4 Mall-Based Casual Sushi Restaurants

1.2 Conveyor Belt Sushi (Kaiten-Zushi)

1.2.1 Standard Conveyor Formats
1.2.1.1 Manual Plate Pricing Systems
1.2.1.2 Color-Coded Pricing Models
1.2.1.3 Volume-Based Discount Models
1.2.2 Technology-Integrated Conveyor Formats
1.2.2.1 Automated Plate Tracking (RFID)
1.2.2.2 Tablet-Based Ordering Systems
1.2.2.3 Smart Table & Digital Menu Integration
1.2.3 Premium Conveyor Concepts

1.2.3.1 High-Quality Ingredient Conveyor Sushi
1.2.3.2 Express Urban Conveyor Units
1.2.3.3 Airport & Transit Hub Conveyor Sushi


1.3 Quick-Service Sushi

1.3.1 Mall & Retail-Based Sushi Kiosks
1.3.1.1 Food Court Sushi Counters
1.3.1.2 Supermarket In-Store Sushi Counters
1.3.1.3 Hypermarket Sushi Outlets
1.3.2 Transit & High-Footfall Locations
1.3.2.1 Airport Sushi Counters
1.3.2.2 Railway & Metro Station Units
1.3.2.3 Business District Grab-and-Go Outlets
1.3.3 Express Sushi Chains1
1.3.3.2 Bento + Sushi Combo Formats
1.3.3.3 Franchise-Led Quick Sushi Brands

1.4 Cloud Kitchen & Delivery-Only Sushi

1.4.1 Single-Brand Sushi Cloud Kitchens
1.4.1.1 App-Exclusive Sushi Brands
1.4.1.2 Subscription Sushi Delivery Models
1.4.1.3 Premium Delivery-Only Omakase
1.4.2 Multi-Brand Asian Cloud Kitchens
1.4.2.1 Japanese + Korean Hybrid Kitchens
1.4.2.2 Pan-Asian Sushi Aggregator Models
1.4.2.3 Shared Infrastructure Cloud Kitchens
1.4.3 Platform-Owned Virtual Sushi Brands

1.4.3.1 Aggregator-Launched Sushi Concepts
1.4.3.2 Influencer-Led Virtual Sushi Brands
1.4.3.3 Data-Driven Micro-Market Sushi Brands


      2. By Product Type

2.1 Nigiri Sushi

2.1.1 Tuna (Maguro – Akami, Chutoro, Otoro)
2.1.2 Salmon (Sake – Fresh & Aburi)
2.1.3 Shrimp & Shellfish (Ebi, Hotate, Ika)
2.1.4 Premium Seasonal Seafood (Uni, Botan Ebi)
2.1.5 Plant-Based & Vegan Nigiri
2.2 Maki Rolls
2.2.1 Traditional Rolls
2.2.1.1 Hosomaki (Single Ingredient)
2.2.1.2 Futomaki (Thick Rolls)
2.2.2 Westernized / Fusion Rolls
2.2.2.1 Uramaki (Inside-Out Rolls)
2.2.2.2 Tempura Rolls
2.2.2.3 Cream Cheese & Avocado-Based Rolls
2.2.3 Premium Specialty Rolls

2.2.3.1 Signature Chef Rolls
2.2.3.2 Luxury Ingredient Rolls
2.2.3.3 Limited-Time Seasonal Rolls


2.3 Sashimi

2.3.1 Tuna Varieties
2.3.2 Salmon Varieties
2.3.3 Yellowtail & Mackerel
2.3.4 Premium Imported Seasonal Fish
2.3.5 Seafood Platter Assortments


2.4 Sushi Platters & Combos

2.4.1 Family Sharing Platters
2.4.2 Party & Event Trays
2.4.3 Corporate Executive Sushi Boxes
2.4.4 Value Combo Sushi Meals


2.5 Specialty & Emerging Sushi Categories

2.5.1 Vegan & Plant-Based Sushi
2.5.2 Low-Carb / Keto Sushi
2.5.3 Brown Rice & Health-Focused Sushi
2.5.4 Sushi Burritos & Hybrid Formats


      3. By Distribution Channel

3.1 Dine-In3.1.1 Casual Dining

3.1.1.1 Family-Oriented Sushi Restaurants
3.1.1.2 Urban High-Street Casual Sushi
3.1.1.3 Mall-Based Casual Dining Units
3.1.1.4 Mid-Scale Franchise Sushi Chains
3.1.2 Premium Omakase

3.1.2.1 Reservation-Only Omakase Counters
3.1.2.2 Michelin-Star Omakase Concepts
3.1.2.3 Chef-Owned Boutique Sushi Bars
3.1.2.4 Seasonal Tasting Menu Experiences

3.1.3 Hotel & Resort Dining

3.1.3.1 Five-Star Hotel Sushi Restaurants
3.1.3.2 Luxury Resort Japanese Dining
3.1.3.3 Business Hotel Sushi Concepts
3.1.3.4 Cruise & Premium Hospitality Sushi

3.1.4 Entertainment District Dining

3.1.4.1 Nightlife-Integrated Sushi Lounges
3.1.4.2 Bar & Sushi Hybrid Concepts
3.1.4.3 Event-Centric Sushi Venues
3.1.4.4 Tourist Hub Sushi Restaurants


3.2 Takeaway

3.2.1 Counter Pickup

3.2.1.1 In-Store Order & Pickup
3.2.1.2 Express Sushi Counters
3.2.1.3 Bento & Combo Pickup Units
3.2.1.4 Pre-Packed Sushi Displays

3.2.2 Pre-Order App Pickup

3.2.2.1 Mobile App Scheduled Pickup
3.2.2.2 Click-and-Collect Models
3.2.2.3 Loyalty-App Integrated Pickup
3.2.2.4 QR-Code Based Pickup Systems

3.2.3 Drive-Thru Sushi Units

3.2.3.1 Standalone Drive-Thru Outlets
3.2.3.2 Hybrid Dine-In + Drive-Thru Units
3.2.3.3 Highway & Transit Drive-Thru Sushi
3.2.3.4 Automated Pickup Lockers

3.2.4 Grab-and-Go Refrigerated Displays

3.2.4.1 Supermarket Refrigerated Sushi
3.2.4.2 Convenience Store Sushi Racks
3.2.4.3 Corporate Office Grab-and-Go Units
3.2.4.4 Airport Grab-and-Go Sushi Displays


3.3 Online Delivery

3.3.1 Third-Party Aggregator Platforms

3.3.1.1 App-Based Food Delivery Platforms

3.3.1.2 Marketplace Commission Models

3.3.1.3 Data-Integrated Delivery Partnerships

3.3.1.4 Cross-Border Delivery Networks

3.3.2 Brand-Owned Apps

3.3.2.1 Direct-to-Consumer Sushi Apps

3.3.2.2 Integrated Loyalty & Rewards Apps

3.3.2.3 Geo-Targeted Promotions

3.3.2.4 AI-Based Personalized Menu Suggestions

3.3.3 Subscription-Based Sushi Delivery

3.3.3.1 Weekly Sushi Box Subscriptions

3.3.3.2 Premium Omakase-at-Home Programs

3.3.3.3 Corporate Lunch Subscription Plans

3.3.3.4 Family Meal Subscription Packages

3.3.4 Corporate Bulk Delivery

3.3.4.1 Executive Meeting Catering

3.3.4.2 Event & Conference Bulk Orders

3.3.4.3 Office Meal Programs

3.3.4.4 Institutional Catering Contracts


3.4 Retail Ready-to-Eat

3.4.1 Supermarket Sushi Packs

3.4.1.1 Private Label Sushi

3.4.1.2 Premium Fresh Sushi Counters

3.4.1.3 Value Combo Packs

3.4.1.4 Organic & Sustainable Seafood Packs

3.4.2 Convenience Store Sushi

3.4.2.1 Single-Serve Sushi Packs

3.4.2.2 Budget-Friendly Sushi Options

3.4.2.3 Fresh Daily Replenishment Models

3.4.2.4 24/7 Retail Sushi Availability

3.4.3 Airport Retail Sushi

3.4.3.1 Duty-Free Sushi Counters

3.4.3.2 Premium Travel Sushi Boxes

3.4.3.3 Lounge-Specific Sushi Catering

3.4.3.4 Transit Grab-and-Go Packs

3.4.4 Meal Kit & DIY Sushi Boxes

3.4.4.1 Home Sushi-Making Kits

3.4.4.2 Premium Ingredient Sushi Kits

3.4.4.3 Family DIY Sushi Boxes

3.4.4.4 Subscription-Based Meal Kits

4. By End-User

4.1 Individual Consumer s

4.1.1 Millennials

4.1.1.1 Urban Professionals

4.1.1.2 Experience-Oriented Diners

4.1.1.3 Health-Conscious Consumers

4.1.2 Gen Z

4.1.2.1 Social Media-Driven Consumers

4.1.2.2 Trend-Focused & Fusion-Oriented Diners

4.1.2.3 Delivery-First Consumers

4.1.3 Working Professionals

4.1.3.1 Office Lunch Crowd

4.1.3.2 After-Work Dining

4.1.3.3 Business Meeting Dining

4.1.4 Families

4.1.4.1 Weekend Casual Dining

4.1.4.2 Celebration & Event Dining

4.1.4.3 Bulk Sharing Orders


4.2 Corporate Customers

4.2.1 Corporate Catering Contracts

4.2.2 Executive Boardroom Catering

4.2.3 Office Meal Subscription Programs

4.2.4 Event & Conference Catering


4.3 Institutional Clients

4.3.1 Universities & Campus Food Courts

4.3.2 Hospitals & Healthcare Cafeterias

4.3.3 Corporate Office Complexes

4.3.4 Airport & Transport Catering Contracts

         5. By Region

5.1 Asia-Pacific

5.2 North America

5.3 Europe

5.4 Middle East

5.5 Latin America


Regional Insights of Global Sushi Restaurants Market

Asia-Pacific – Largest Market

Japan remains the core revenue generator, supported by high domestic sushi consumption and strong chain presence. Expansion across China, South Korea, and Southeast Asia further strengthens regional leadership.

North America – Fastest Growing

Premium sushi bars, fusion innovation, and strong digital ordering infrastructure are accelerating growth across the U.S. and Canada.

Europe

Major cities such as London and Paris drive demand for authentic and premium sushi dining, alongside sustainability-focused sourcing.

Middle East & Latin America

Growth is concentrated in metropolitan hubs such as Dubai and São Paulo, supported by affluent consumer demand for premium dining experiences.


Leading Companies in the Global Sushi Restaurants Market

  • Sushiro
  • Kura Sushi
  • Genki Sushi
  • Nobu Hospitality
  • Zuma Restaurants
  • Benihana
  • Sushi Zanmai

The market remains fragmented, with independent premium sushi operators coexisting alongside scalable international chains.S ushiro is the largest sushi restaurant company among the listed brands.


Strategic Intelligence and AI-Backed Insights – Global Sushi Restaurants Market

Phoenix Demand Forecast Engine identifies stable long-term expansion in the Global Sushi Restaurants Market, supported by international franchise rollouts, premium omakase demand, increasing delivery penetration, and rising seafood-based health preferences across urban populations.

The Consumer Behavior Analyzer highlights strong consumer inclination toward authentic sushi experiences, premium tasting menus, sustainable seafood sourcing, and convenience-driven formats such as sushi takeaway boxes and subscription platters.

The Innovation Tracker underscores automation in sushi preparation, AI-based seafood inventory optimization, smart table ordering systems in conveyor-belt formats, and loyalty-driven personalization through digital platforms as key competitive differentiators.

Porter’s Five Forces Analysis indicates high competitive rivalry due to fragmented independent operators, moderate supplier power driven by premium seafood sourcing dependency, moderate buyer power given diverse dining alternatives, and strong differentiation potential through chef expertise, sourcing transparency, and premium positioning.


Why the Global Sushi Restaurants Market Remains Critical

  1. Rising global demand for premium, seafood-based, and health-oriented dining options supports consistent revenue growth.

  2. Strong compatibility with omnichannel distribution models (dine-in, takeaway, delivery, and retail-ready formats) enhances scalability.

  3. Expanding international franchise ecosystems enable structured global market penetration.

  4. Sustainable seafood sourcing and traceability standards strengthen long-term brand credibility.

  5. AI-powered demand forecasting and inventory control reduce waste and improve operational efficiency in a highly perishable supply chain environment.

Final Takeaway of Global Sushi Restaurants Market

The Global Sushi Restaurants Market is progressively transforming into a premium-focused, innovation-driven, and globally scalable dining segment. The projected CAGR of ~3.9% during 2026–2033 reflects steady expansion supported by rising global appetite for seafood-based cuisine, premium omakase experiences, and convenient sushi takeaway formats.

Future growth will be shaped by a dual-structure model: high-margin chef-led omakase and boutique sushi counters catering to affluent urban consumers, alongside scalable quick-service, conveyor-belt (kaiten-zushi), and delivery-optimized sushi chains targeting mass-market accessibility. This balanced ecosystem enables both experiential premium positioning and operational scalability.

Operators that invest in AI-based seafood inventory management, cold-chain optimization, sustainable sourcing certifications, franchise-led international expansion, and omnichannel integration (dine-in, takeaway, retail-ready, and delivery) will secure stronger competitive positioning and long-term profitability.

At Phoenix Research, our advanced forecasting frameworks provide detailed Global Sushi Restaurants revenue forecast analysis, competitive intelligence, and strategic growth insights — empowering stakeholders to capitalize on the evolving Post-2025 landscape with data-backed decision-making and scalable expansion strategies.

1. Executive Summary

1.1 Market Forecast Snapshot (2026–2033)
1.2 Global Market Size & CAGR Analysis
1.3 Largest & Fastest-Growing Segments
1.4 Regional Leadership & Growth Trends
1.5 Key Market Drivers
1.6 Competitive Landscape Overview
1.7 Strategic Outlook Through 2033


2. Introduction & Market Overview

2.1 Definition of the Global Sushi Restaurants Market
2.2 Scope of the Study
2.3 Evolution of Sushi as a Global Mainstream Cuisine
2.4 Transition from Traditional Sushi Bars to Premium Omakase
2.5 Cultural Globalization & Culinary Mainstreaming
2.6 Digital Ordering, Automation & AI Integration
2.7 Sustainable Seafood & Traceability Trends


3. Research Methodology

3.1 Primary Research
3.2 Secondary Research
3.3 Market Size Estimation Model
3.4 Forecast Assumptions (2026–2033)
3.5 Data Validation & Triangulation


4. Market Dynamics

4.1 Drivers

4.1.1 Global Acceptance of Sushi as a Healthy Cuisine
4.1.2 Expansion of Premium Omakase Dining
4.1.3 Delivery & Takeaway Ecosystem Growth
4.1.4 Franchise Expansion of International Sushi Chains
4.1.5 Sustainable Seafood & Ethical Sourcing Demand
4.1.6 Urbanization & Experiential Dining Culture
4.1.7 AI-Based Inventory & Waste Optimization

4.2 Restraints

4.2.1 Seafood Price Volatility
4.2.2 Skilled Sushi Chef Shortage
4.2.3 High Rental & Urban Operating Costs
4.2.4 Supply Chain Sensitivity

4.3 Opportunities

4.3.1 Vegan & Plant-Based Sushi Expansion
4.3.2 Subscription-Based Sushi Models
4.3.3 Expansion into Emerging Markets
4.3.4 Retail-Ready & Supermarket Sushi Growth

4.4 Challenges

4.4.1 Cold-Chain Logistics Complexity
4.4.2 Delivery Commission Margin Pressure
4.4.3 Consumer Price Sensitivity
4.4.4 Competitive Market Fragmentation


5. Global Sushi Restaurants Market Analysis (USD Billion), 2026–2033

5.1 Market Size Overview
5.2 CAGR Analysis
5.3 Regional Revenue Distribution
5.4 Format-Wise Revenue Contribution
5.5 Margin & Pricing Trend Analysis


6. Market Segmentation by Restaurant Format (USD Billion), 2026–2033

6.1 Full-Service Sushi Restaurants

6.1.1 Traditional Sushi Bars
6.1.1.1 Counter-Style Chef Interaction
6.1.1.2 Table-Service Sushi Dining
6.1.1.3 Family-Owned Independent Sushi Bars
6.1.1.4 Urban High-Street Sushi Restaurants

6.1.2 Premium Omakase Restaurants
6.1.2.1 Michelin-Star Omakase
6.1.2.2 Reservation-Only Boutique Concepts
6.1.2.3 Seasonal Tasting Menu Sushi
6.1.2.4 Luxury Seafood-Focused Omakase

6.1.3 Sushi Lounges
6.1.3.1 Fusion Sushi Concepts
6.1.3.2 Bar-Integrated Sushi Dining
6.1.3.3 Nightlife-Oriented Sushi Venues
6.1.3.4 Hotel-Integrated Sushi Lounges

6.1.4 Casual Dining Sushi Chains
6.1.4.1 Mid-Scale National Chains
6.1.4.2 Regional Franchise Sushi Brands
6.1.4.3 Family-Oriented Sushi Dining
6.1.4.4 Mall-Based Casual Sushi Restaurants


6.2 Conveyor Belt Sushi (Kaiten-Zushi)

6.2.1 Standard Conveyor Formats
6.2.1.1 Manual Plate Pricing Systems
6.2.1.2 Color-Coded Pricing Models
6.2.1.3 Volume-Based Discount Models

6.2.2 Technology-Integrated Conveyor Formats
6.2.2.1 Automated Plate Tracking (RFID)
6.2.2.2 Tablet-Based Ordering Systems
6.2.2.3 Smart Table & Digital Menu Integration

6.2.3 Premium Conveyor Concepts
6.2.3.1 High-Quality Ingredient Conveyor Sushi
6.2.3.2 Express Urban Conveyor Units
6.2.3.3 Airport & Transit Hub Conveyor Sushi


6.3 Quick-Service Sushi

6.3.1 Mall & Retail-Based Sushi Kiosks
6.3.1.1 Food Court Sushi Counters
6.3.1.2 Supermarket In-Store Sushi Counters
6.3.1.3 Hypermarket Sushi Outlets

6.3.2 Transit & High-Footfall Locations
6.3.2.1 Airport Sushi Counters
6.3.2.2 Railway & Metro Station Units
6.3.2.3 Business District Grab-and-Go Outlets

6.3.3 Express Sushi Chains
6.3.3.1 Value-Priced Sushi Chains
6.3.3.2 Bento + Sushi Combo Formats
6.3.3.3 Franchise-Led Quick Sushi Brands


6.4 Cloud Kitchen & Delivery-Only Sushi

6.4.1 Single-Brand Sushi Cloud Kitchens
6.4.1.1 App-Exclusive Sushi Brands
6.4.1.2 Subscription Sushi Delivery Models
6.4.1.3 Premium Delivery-Only Omakase

6.4.2 Multi-Brand Asian Cloud Kitchens
6.4.2.1 Japanese + Korean Hybrid Kitchens
6.4.2.2 Pan-Asian Sushi Aggregator Models
6.4.2.3 Shared Infrastructure Cloud Kitchens

6.4.3 Platform-Owned Virtual Sushi Brands
6.4.3.1 Aggregator-Launched Sushi Concepts
6.4.3.2 Influencer-Led Virtual Sushi Brands
6.4.3.3 Data-Driven Micro-Market Sushi Brands


7. Market Segmentation by Product Type (USD Billion), 2026–2033

7.1 Nigiri Sushi
7.1.1 Tuna Varieties
7.1.2 Salmon Varieties
7.1.3 Shellfish & Shrimp
7.1.4 Premium Seasonal Seafood
7.1.5 Plant-Based Nigiri

7.2 Maki Rolls
7.2.1 Traditional Rolls
7.2.2 Westernized / Fusion Rolls
7.2.3 Premium Specialty Rolls

7.3 Sashimi
7.4 Sushi Platters & Combos
7.5 Specialty & Emerging Sushi Categories


8. Market Segmentation by Distribution Channel (USD Billion), 2026–2033


8.1 Dine-In

8.1.1 Casual Dining

8.1.1.1 Family-Oriented Sushi Restaurants
8.1.1.2 Urban High-Street Casual Sushi
8.1.1.3 Mall-Based Casual Dining Units
8.1.1.4 Mid-Scale Franchise Sushi Chains

8.1.2 Premium Omakase

8.1.2.1 Reservation-Only Omakase Counters
8.1.2.2 Michelin-Star Omakase Concepts
8.1.2.3 Chef-Owned Boutique Sushi Bars
8.1.2.4 Seasonal Tasting Menu Experiences

8.1.3 Hotel & Resort Dining

8.1.3.1 Five-Star Hotel Sushi Restaurants
8.1.3.2 Luxury Resort Japanese Dining
8.1.3.3 Business Hotel Sushi Concepts
8.1.3.4 Cruise & Premium Hospitality Sushi

8.1.4 Entertainment District Dining

8.1.4.1 Nightlife-Integrated Sushi Lounges
8.1.4.2 Bar & Sushi Hybrid Concepts
8.1.4.3 Event-Centric Sushi Venues
8.1.4.4 Tourist Hub Sushi Restaurants


8.2 Takeaway

8.2.1 Counter Pickup

8.2.1.1 In-Store Order & Pickup
8.2.1.2 Express Sushi Counters
8.2.1.3 Bento & Combo Pickup Units
8.2.1.4 Pre-Packed Sushi Displays

8.2.2 Pre-Order App Pickup

8.2.2.1 Mobile App Scheduled Pickup
8.2.2.2 Click-and-Collect Models
8.2.2.3 Loyalty-App Integrated Pickup
8.2.2.4 QR-Code Based Pickup Systems

8.2.3 Drive-Thru Sushi Units

8.2.3.1 Standalone Drive-Thru Outlets
8.2.3.2 Hybrid Dine-In + Drive-Thru Units
8.2.3.3 Highway & Transit Drive-Thru Sushi
8.2.3.4 Automated Pickup Lockers

8.2.4 Grab-and-Go Refrigerated Displays

8.2.4.1 Supermarket Refrigerated Sushi
8.2.4.2 Convenience Store Sushi Racks
8.2.4.3 Corporate Office Grab-and-Go Units
8.2.4.4 Airport Grab-and-Go Sushi Displays


8.3 Online Delivery

8.3.1 Third-Party Aggregator Platforms

8.3.1.1 App-Based Food Delivery Platforms
8.3.1.2 Marketplace Commission Models
8.3.1.3 Data-Integrated Delivery Partnerships
8.3.1.4 Cross-Border Delivery Networks

8.3.2 Brand-Owned Apps

8.3.2.1 Direct-to-Consumer Sushi Apps
8.3.2.2 Integrated Loyalty & Rewards Apps
8.3.2.3 Geo-Targeted Promotions
8.3.2.4 AI-Based Personalized Menu Suggestions

8.3.3 Subscription-Based Sushi Delivery

8.3.3.1 Weekly Sushi Box Subscriptions
8.3.3.2 Premium Omakase-at-Home Programs
8.3.3.3 Corporate Lunch Subscription Plans
8.3.3.4 Family Meal Subscription Packages

8.3.4 Corporate Bulk Delivery

8.3.4.1 Executive Meeting Catering
8.3.4.2 Event & Conference Bulk Orders
8.3.4.3 Office Meal Programs
8.3.4.4 Institutional Catering Contracts


8.4 Retail Ready-to-Eat

8.4.1 Supermarket Sushi Packs

8.4.1.1 Private Label Sushi
8.4.1.2 Premium Fresh Sushi Counters
8.4.1.3 Value Combo Packs
8.4.1.4 Organic & Sustainable Seafood Packs

8.4.2 Convenience Store Sushi

8.4.2.1 Single-Serve Sushi Packs
8.4.2.2 Budget-Friendly Sushi Options
8.4.2.3 Fresh Daily Replenishment Models
8.4.2.4 24/7 Retail Sushi Availability

8.4.3 Airport Retail Sushi

8.4.3.1 Duty-Free Sushi Counters
8.4.3.2 Premium Travel Sushi Boxes
8.4.3.3 Lounge-Specific Sushi Catering
8.4.3.4 Transit Grab-and-Go Packs

8.4.4 Meal Kit & DIY Sushi Boxes

8.4.4.1 Home Sushi-Making Kits
8.4.4.2 Premium Ingredient Sushi Kits
8.4.4.3 Family DIY Sushi Boxes
8.4.4.4 Subscription-Based Meal Kits


9. Market Segmentation by End-User (USD Billion), 2026–2033


9.1 Individual Consumers

9.1.1 Millennials

9.1.1.1 Premium Sushi & Omakase Demand
9.1.1.2 Health-Conscious Preferences
9.1.1.3 Delivery-First Behavior
9.1.1.4 Loyalty Program Adoption

9.1.2 Gen Z

9.1.2.1 Anime & Pop-Culture Influence
9.1.2.2 Social Media-Driven Dining
9.1.2.3 Value & Combo Meal Preference
9.1.2.4 Digital Payment Adoption

9.1.3 Working Professionals

9.1.3.1 Corporate Lunch Demand
9.1.3.2 Subscription-Based Meals
9.1.3.3 Late-Night Izakaya Dining
9.1.3.4 High AOV Premium Dining

9.1.4 Families

9.1.4.1 All-You-Can-Eat Sushi
9.1.4.2 Teppanyaki Group Dining
9.1.4.3 Suburban Japanese BBQ
9.1.4.4 Kids’ Menu Adaptation

9.1.5 Health-Conscious Consumers

9.1.5.1 Low-Calorie Sushi
9.1.5.2 Gluten-Free Options
9.1.5.3 Plant-Based Japanese
9.1.5.4 Sustainable Seafood Preference

9.1.6 Spending Behavior Analysis

9.1.6.1 Frequency of Visit
9.1.6.2 Average Spend Per Visit
9.1.6.3 Delivery vs Dine-In Ratio
9.1.6.4 Brand Loyalty Index


9.2 Corporate Customers

9.2.1 Catering

9.2.1.1 Corporate Events
9.2.1.2 Boardroom Meetings
9.2.1.3 Office Lunch Catering
9.2.1.4 Executive Omakase Events

9.2.2 Corporate Meal Programs

9.2.2.1 Subsidized Employee Meals
9.2.2.2 Daily Meal Contracts
9.2.2.3 Hybrid Work Meal Support
9.2.2.4 Tech Campus Foodservice

9.2.3 Event Orders

9.2.3.1 Trade Shows
9.2.3.2 Product Launch Events
9.2.3.3 Corporate Celebrations
9.2.3.4 Holiday Party Contracts

9.2.4 Subscription-Based Corporate Meals

9.2.4.1 Weekly Meal Plans
9.2.4.2 Bento Subscription Services
9.2.4.3 AI-Based Meal Customization
9.2.4.4 Volume-Based Pricing Models

9.2.5 Corporate Revenue Model Analysis

9.2.5.1 Contract Duration
9.2.5.2 Margin Structure
9.2.5.3 Bulk Order Discounting
9.2.5.4 Retention Rate


9.3 Institutional Clients

9.3.1 Universities

9.3.1.1 Campus Dining Contracts
9.3.1.2 Student Meal Programs
9.3.1.3 Food Court Japanese Units
9.3.1.4 Pop-Up Sushi Counters
9.3.1.5 Health-Oriented Campus Meals

9.3.2 Hospitals

9.3.2.1 Patient Meal Services
9.3.2.2 Staff Cafeterias
9.3.2.3 Low-Sodium & Special Diet Meals
9.3.2.4 On-Call Night Shift Dining

9.3.3 Office Complexes

9.3.3.1 Business Park Foodservice
9.3.3.2 Co-Working Space Partnerships
9.3.3.3 On-Site Japanese Kiosks
9.3.3.4 Shared Cafeteria Contracts

9.3.4 Government & Public Institutions

9.3.4.1 Public Sector Cafeterias
9.3.4.2 Event Catering Contracts
9.3.4.3 Military Base Foodservice
9.3.4.4 Long-Term Procurement Agreements

9.3.5 Institutional Revenue & Contract Benchmarking

9.3.5.1 Contract Value Analysis
9.3.5.2 Multi-Year Deal Structures
9.3.5.3 Compliance & Nutrition Standards
9.3.5.4 Procurement Pricing Models


10. Market Segmentation by Region

10.1 Asia-Pacific
10.2 North America
10.3 Europe
10.4 Middle East
10.5 Latin America


11. Competitive Landscape – Global

11.1 Market Share Analysis
11.2 Brand Positioning Matrix
11.3 Format-Wise Competitive Benchmarking
11.4 Franchise Expansion Strategies
11.5 AI & Digital Capability Comparison
11.6 Competitive Intensity Mapping


12. Company Profiles

12.1 Sushiro
12.2 Kura Sushi
12.3 Genki Sushi
12.4 Nobu Hospitality
12.5 Zuma Restaurants
12.6 Benihana
12.7 Sushi Zanmai
12.8 Regional Sushi Chains


13. Regional Insights

13.1 Asia-Pacific – Largest Market
13.2 North America – Fastest Growing
13.3 Europe – Premium Authenticity Market
13.4 Middle East – Luxury Growth Hub
13.5 Latin America – Emerging Metro Expansion


14. Strategic Intelligence & Phoenix AI-Backed Insights

14.1 Phoenix Demand Forecast Engine
14.2 AI-Based Seafood Inventory Optimization Model
14.3 Consumer Behavior Analyzer
14.4 Automation & Smart Table Innovation Tracker
14.5 Automated Porter’s Five Forces Analysis


15. Future Outlook & Strategic Recommendations

15.1 Premiumization & Omakase Expansion
15.2 Sustainable Seafood Strategy
15.3 Delivery Margin Optimization
15.4 Franchise-Led Global Expansion
15.5 Long-Term Market Outlook (2033+)


16. Appendix

17. About Us

18. Disclaimer


      Frequently Asked Questions

      What is the projected size of the Global Sushi Restaurants Market by 2033?
      The market is valued at USD 12.85 billion in 2025 and is expected to reach approximately USD 17.40 billion by 2033, growing at a CAGR of ~3.9% (2026–2033).
      What factors are driving growth in the market?
      Growth is supported by global mainstream acceptance of sushi, premium omakase demand, franchise expansion, strong delivery compatibility, and rising preference for seafood-based healthy meals.
      Which segment leads the Global Sushi Restaurants Market?
      Full-Service Sushi Restaurants dominate the market, particularly traditional sushi bars, casual dining chains, and premium omakase formats.
      Which region holds the largest and fastest-growing share?
      Asia-Pacific is the largest market, while North America is the fastest-growing region driven by premiumization and digital ordering penetration.