
Global Hydrogen Electrolyser Market Report, Size, Share and Forecast 2026–2033
The market is not waiting for a technology breakthrough. It is waiting for customers.
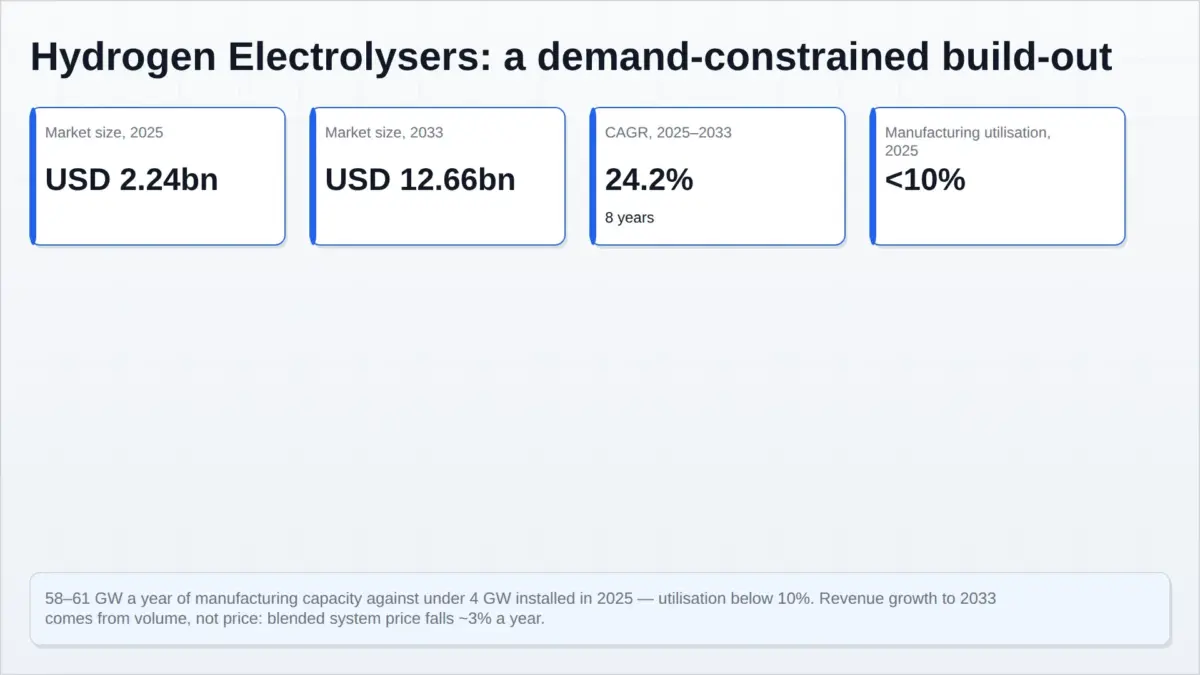
At the end of 2024 the world had 2 gigawatts of water electrolysis installed. During 2025 it commissioned a further 2 gigawatts, taking the global installed base past 4 gigawatts — the strongest year the technology has recorded, and still only about 0.2% of global hydrogen demand. Against that, the world can already build 58 to 61 gigawatts a year of electrolysers. That ratio, roughly fifteen to one between what the industry can make and what the world has bought, is the single most important fact in this market. Everything else — efficiency curves, iridium loading, membrane chemistry, subsidy design — operates inside it.
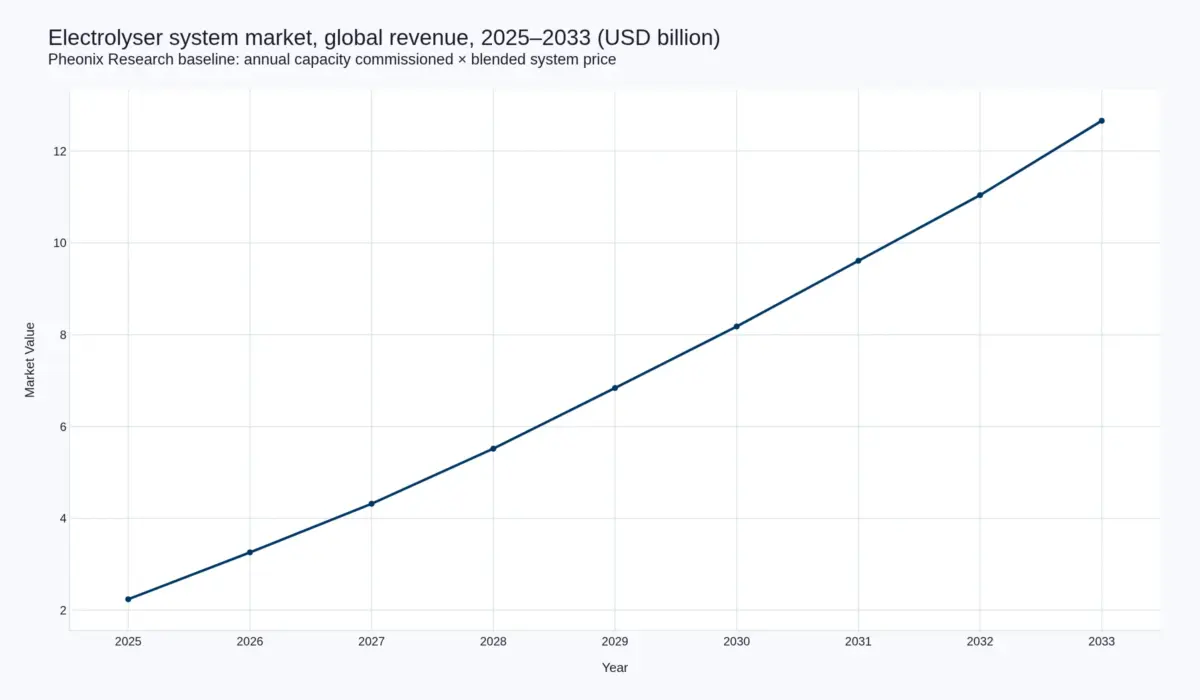
Pheonix Research sizes the global electrolyser system market at USD 2.24 billion in 2025, rising to USD 12.66 billion in 2033 — a compound annual growth rate of 24.2% across the eight periods from 2025 to 2033. The volume behind that value grows faster than the revenue: annual capacity commissioned rises from 2.0 to 14.4 gigawatts over the same window, a CAGR of 28.0%, because the blended system price falls by roughly 3% a year as Chinese manufacturing sets the global price floor.
What is inside the number
The market is measured as the value of complete electrolyser systems delivered to project developers — stack, balance-of-plant equipment and system integration — valued at the point of equipment sale, excluding civil works, land and grid connection. It is derived bottom-up as annual gigawatts commissioned multiplied by a blended system price, rather than taken from a top-down vendor estimate, because the published top-down estimates for this sector diverge by a factor of four and none of them reconcile to the physical deployment data.
The blended price is built from the regional cost structure the IEA reports: USD 500–1,100 per kilowatt for alkaline systems manufactured and installed in China in 2025, against USD 1,900–2,500 per kilowatt outside it. Weighted by where the capacity is actually being built — China holds two-thirds of both installed capacity and capacity that has reached final investment decision — that produces a global average near USD 1,120 per kilowatt in 2025, declining to about USD 880 by 2033.
The reason the price falls only 3% a year, rather than following the 23–32% learning rates measured on stack costs, is structural. More than half of electrolyser project capital expenditure is engineering, procurement, construction and contingency; a further 25–30% is conventional plant equipment — power electronics, piping, compressors, gas treatment. The stack itself is only 6–9% of the levelised cost of hydrogen. Cheap stacks therefore move the total price slowly, and a market whose cost is dominated by construction and electricity does not deflate like a semiconductor market.
Two-thirds of the market is in one country
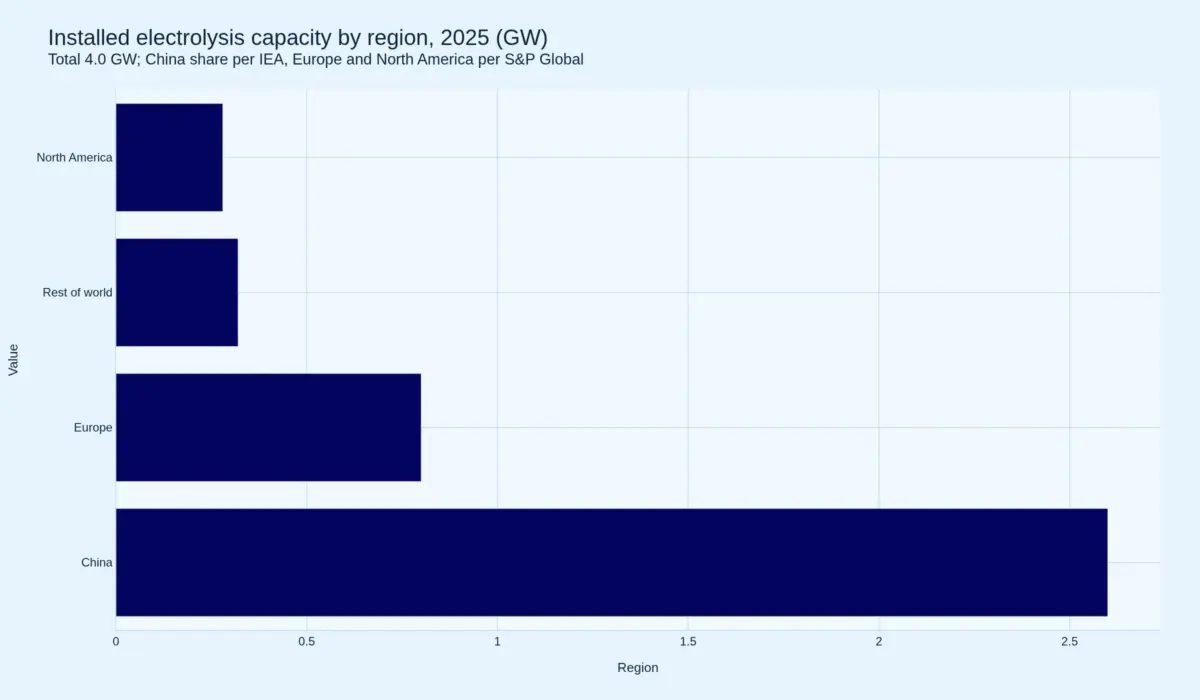
China accounts for roughly 65% of global installed electrolysis capacity and the same share of capacity that has reached final investment decision, and hosts close to 70% of manufacturing capacity. Its annual tendering runs at more than 1 gigawatt a month, or 12–14 gigawatts a year, against a domestic demand base of under 2 gigawatts — a manufacturing base running at roughly a tenth of its capability. Europe holds about 20% of installed capacity and North America about 7%.
This is habitually read as a supply-chain risk. It is more accurately a price fact. A domestic manufacturing base operating at a fraction of capacity, inside the lowest-cost industrial system in the world, exports — and the export price becomes the ceiling under every Western manufacturer's margin regardless of whose stack performs better on a datasheet. Awarded bids in Chinese auctions have fallen as low as USD 170 per kilowatt, which is below manufacturing cost and why 40 Chinese equipment makers signed a ten-point agreement in November 2025 pledging to end below-cost bidding.
The forecast assumes the pipeline, not the announcements
Projects that are operational, under construction or at final investment decision imply 4.2 to 4.3 million tonnes a year of low-emissions hydrogen by 2030, roughly a fivefold increase on 2024. Converting that to capacity at prevailing electrolyser efficiency puts cumulative installed electrolysis at approximately 30 to 35 gigawatts by 2030, which is what this forecast assumes. It does not assume the 439 gigawatts of announced electrolyser projects, nor the more than 100 gigawatts the IEA identifies as at risk of never operating if investment decisions are not taken before the end of 2027. Cumulative capacity reaches 68.8 gigawatts by 2033 on this basis — a large market built almost entirely from projects that already have a customer, a subsidy or a board approval behind them.
That conservative construction is the reason the 2033 figure is USD 12.66 billion and not the USD 60–80 billion some published estimates show. Those estimates multiply an announcement pipeline by a price, and this sector has now spent three consecutive years demonstrating that announcement pipelines shrink: the 2030 production pipeline fell from 49 to 37 million tonnes between the 2024 and 2025 editions of the IEA's review, and by a further 10 million tonnes in 2026.
Table of Contents
Competitive Landscape
Sixty-one gigawatts of capacity, and no dominant firm
The electrolyser manufacturing market is fragmented in the precise sense: 61 gigawatts a year of capacity spread across dozens of producers, with the largest single company holding about 11% of global capacity. That the top ten are all Chinese is a statement about cost, not about concentration.
| Manufacturer | Home base | Nameplate capacity (GW/yr) | Technology focus |
|---|---|---|---|
| Peric (CSSC) | China | 6.5 | Alkaline |
| Elion | China | 5.0 | Alkaline |
| LONGi | China | 3.5 | Alkaline |
| Sungrow | China | 3.0 | Alkaline |
| Guofu | China | 2.5 | Alkaline |
| Trina | China | 2.0 | Alkaline |
| Tianjin Mainland | China | 1.6 | Alkaline |
| Qing Qiji | China | 1.5 | Alkaline |
| Sany | China | 1.5 | Alkaline |
| John Cockerill | China/Belgium | 1.0 | Alkaline |
| thyssenkrupp nucera | Germany | 1.5 | Alkaline |
| Nel | Norway | 1.0 | Alkaline and PEM |
| Siemens Energy | Germany | 3.0 | PEM |
| Ohmium | India | 2.0 | PEM |
| Fortescue | Australia | 2.0 | PEM |
| Cummins (Accelera) | US/China/Spain | 1.9 | PEM |
Two structural features sit behind the table. The first is vertical integration: several Chinese entrants came out of the solar and wind industries with manufacturing experience and balance sheets, and moved into electrolysers as an adjacent product. The second is that capacity is not deliverable capacity — the World Bank is explicit that stack assembly is abundant while balance-of-plant supply, particularly power conversion and gas treatment, remains the bottleneck. Nameplate rankings therefore overstate how much of the market any one firm can actually serve.
What competition looks like when utilisation is below 10%
Competitive intensity in this market is not expressed through marketing. It is expressed through bid prices that fall below cost. Chinese awarded bids reached as low as USD 170 per kilowatt against a capital cost of USD 500–1,100, which is a firm buying volume with its own margin. The November 2025 agreement among 40 manufacturers to end below-cost bidding, followed by government performance targets in March 2026, is an attempt to stop a competition that no participant can win.
The result outside China is consolidation. The IEA describes Western manufacturers as experiencing sharp reductions in revenue and increased financial losses, with bankruptcies and acquisitions signalling a coming wave. Nel’s 2025 accounts show the shape of it: revenue down 31% to NOK 963 million, EBITDA of negative NOK 275 million, an operating loss of NOK 1,365 million, order backlog down 18% to NOK 1,319 million, and alkaline production temporarily halted at Herøya with the workforce reduced. The company nonetheless raised NOK 353 million in a private placement with Samsung E&A alongside an EPC collaboration agreement, and won a PEM order above USD 50 million for Norwegian projects — the pattern of a survivor rather than a casualty.
The three strategies that are actually being run
Cost leadership at scale is the Chinese position, and it is being defended with standards rather than price alone. Technology differentiation is the PEM position — Siemens Energy, ITM, Cummins and Ohmium compete where load flexibility and footprint justify a premium. Asset-light licensing is the newly visible third strategy: Enapter’s August 2026 restructuring hands volume manufacturing to partners in China and the United States while retaining electrode chemistry in Pisa, converting fixed cost into variable cost in a market that cannot yet absorb fixed cost.
For buyers, the competitive landscape has one practical implication. Ordering from a manufacturer with utilisation below 10% is cheap and carries counterparty risk; ordering from one with a defended technology position costs more and carries less. In a market where the electrolyser is 55–65% of the levelised cost of hydrogen but the stack is 6–9%, the warranty on a stack that fails in year eight matters more than the twelve per cent saved at the bid stage.
Value Chain
Where the value sits: almost none of it is in the stack
The electrolyser value chain is routinely drawn from membrane to module, as though the membrane were where the money is. It is not. The IEA’s cost decomposition of a project puts more than half of total capital expenditure in engineering, procurement, construction and contingency, and a further 25–30% in conventional plant components — power electronics, piping, compressors and gas treatment. The stack accounts for 6–9% of the levelised cost of hydrogen. Electrolysers overall are 55–65% of that levelised cost; electricity is the rest.
That single fact explains most of what is strange about this market. It explains why a 23–32% learning rate on stack cost moves total project economics so little. It explains why manufacturers with the best membranes can still lose money while Chinese assemblers with unremarkable cells win gigawatt orders. And it explains where the value actually migrates: to whoever integrates the balance of plant, finances the project and holds the offtake.
Stack and components
The stack layer comprises electrodes and catalyst coatings, the membrane or diaphragm, bipolar plates, porous transport layers, cell frames and seals. Two of these are supply-constrained in ways the rest are not. Catalyst coatings for PEM depend on iridium and platinum, both platinum-group metals with a single dominant source: South Africa holds more than 90% of global PGM reserves. Iridium loading has fallen from about 1.3 grams per kilowatt in 2020 toward a 2050 target of 0.4 grams per kilowatt, and platinum from 0.5 to 0.1 grams per kilowatt, but the reduction is a design and manufacturing achievement, not a market one — until loadings fall further, PEM deployment is bounded by a metal whose annual production is measured in single-digit tonnes. A South African study of a 10.9 gigawatt domestic programme requires 10.9 tonnes of iridium on 2020 loadings, which is a useful scale check on how tight the constraint is.
Electrodes and coatings are supplied by a small number of specialists — De Nora among them, with manufacturing spread across fifteen sites in Brazil, China, Germany, Italy, India, Japan and the United States — while membrane supply is concentrated in a handful of chemical producers. Titanium for bipolar plates and nickel for alkaline electrodes are less constrained but exposed to the same commodity cycles as any industrial metal.
Balance of plant and integration
This is where the bottleneck genuinely sits, and it is not a materials bottleneck. The World Bank’s 2026 assessment is explicit that while stack assembly capacity is abundant at 61 gigawatts a year, bottlenecks persist in balance-of-plant components, particularly power conversion and gas treatment units. Rectifiers, transformers, water purification, gas-liquid separation, drying and purification, compression and control systems are conventional industrial equipment, but they must be engineered into a system that runs at variable load, and the number of firms able to deliver a complete integrated megawatt-scale system is far smaller than the number able to assemble stacks.
The distinction matters commercially. It means manufacturing capacity statistics overstate deliverable capacity, and it means an OEM’s real asset is not its stack line but its reference list of commissioned integrated systems — which is precisely what Chinese manufacturers have accumulated fastest, with the world’s largest operating project rising from 30 megawatts in 2021 to a 500-megawatt unit commissioned in China in 2025.
Downstream: who actually buys the molecules
Demand comes from a narrow set of buyers. Among projects under construction that disclose their end use, chemicals — primarily ammonia — account for about 42%, e-fuels for shipping and aviation 7%, and refining 5%. Each application imposes different requirements: solid oxide systems can use waste heat from ammonia or steel plants, PEM systems are preferred where rapid load response matters, and alkaline dominates where steady baseload operation and capital cost decide the investment.
The consequence for the value chain is that electrolyser demand is derivative of ammonia and refining economics, not of hydrogen economics in the abstract. When a refiner or a fertiliser producer signs, a stack order follows; when they do not, no amount of manufacturing capacity converts into revenue. The 2024 offtake data makes the point — new agreements covered 1.7 million tonnes a year, down from 2.4 million in 2023, and only about 20% of them were firm.
Where margin accrues
In a market with sub-10% utilisation, margin accrues to whoever can refuse to compete on price. Chinese manufacturers have chosen not to, which is why 40 of them signed a ten-point agreement in November 2025 pledging to end below-cost bidding. Western manufacturers cannot compete on price at USD 500–1,100 per kilowatt and are moving toward licensing, local-content-driven supply and higher-value integration — Enapter’s August 2026 decision to keep electrode chemistry in Pisa while moving volume manufacturing to partners in China and the United States is the purest expression of that split. The value chain is separating into a commoditised stack layer and a defended integration and service layer, and the second is where the durable margin is.
Investment Activity
Capital is being spent faster than projects are being approved
Capital spending on low-emissions hydrogen projects reached USD 4.3 billion in 2024, an 80% increase on 2023, and rose by more than 80% again in 2025 to nearly USD 8 billion — of which electrolysis accounted for about 80%. Over the same period new final investment decisions fell below 0.8 million tonnes a year, after two consecutive years at around 1 million. Those two statements are not in conflict: the money is concentrated in a small number of very large projects, while the number of projects reaching a decision has fallen.
The forward order book is the honest measure of near-term revenue, and it is thin but visible. Roughly 16 gigawatts of electrolysis capacity is under construction worldwide, against 3.5 gigawatts at final investment decision and just over 4 gigawatts operating. At a blended system price near USD 1,000 per kilowatt, that construction pipeline represents about USD 16 billion of equipment value working through the market over the next two to three years — more than six years of current revenue, and the reason 2026 through 2028 revenue growth is unusually well underpinned relative to the wider hydrogen narrative.
Where the money is going
More than half of total investment in 2024 and 2025 targets hydrogen used in oil refining and industrial facilities that already consume hydrogen. That is the least romantic and most bankable segment: an existing consumer with existing infrastructure and an existing price reference. Chemicals — primarily ammonia — accounts for about 42% of disclosed end use among capacity under construction, e-fuels 7% and refining 5%. Investment in electrolysis projects is highest in China and Europe, while the United States allocates a larger share to CCUS-equipped production.
The project scale is climbing quickly. The largest operating electrolyser rose from 30 megawatts in 2021 to a 500-megawatt unit commissioned in China in 2025, and Saudi Arabia’s NEOM project targets 2 gigawatts by 2027 — a 75-fold increase in the size of the largest project in six years. Large projects matter financially as well as symbolically: they are the only mechanism by which balance-of-plant costs fall, because that is where most of the capital sits.
What the exits say
The clearest investment signal of 2026 came from a company leaving rather than entering. In June 2026 Air Products announced it would not proceed with its Louisiana Clean Energy Complex, citing expected financial returns that did not meet its criteria, and recorded pre-tax charges of up to USD 2.9 billion — approximately USD 2.2 billion after tax — primarily to write down assets and terminate contractual commitments. It simultaneously discontinued a zero-carbon liquid hydrogen facility in Casa Grande, Arizona, citing challenging commercial conditions and slower-than-expected development in hydrogen for mobility. The same announcement confirmed it was finalising a marketing and distribution agreement with Yara for renewable ammonia from NEOM — a shift from owning production to distributing it.
On the equipment side, Nel’s 2025 results describe a company managing a downturn rather than financing a boom: revenue of NOK 963 million, a 31% decline; negative EBITDA of NOK 275 million; an operating loss of NOK 1,365 million; a cash balance of NOK 1,617 million; and production at the Herøya alkaline facility temporarily halted. Its NOK 353 million private placement with Samsung E&A, alongside an EPC collaboration agreement, is a bet that the route to volume runs through Asian engineering contractors rather than European project developers.
Enapter’s August 2026 restructuring is the third archetype: an agreement with Patrimonium to discharge approximately EUR 26 million of corporate bond liabilities by transferring the Enapter Campus, converting to an asset-light model with production partners in China and the United States, a EUR 3 million bridge from major shareholders and a planned EUR 10–12 million strategic subscription. A vendor that stops owning factories to survive is telling you what the return on invested capital in electrolyser manufacturing currently is.
Public money, and its direction of travel
Announced public funding for low-emissions hydrogen fell by nearly two-thirds year on year to a cumulative USD 38 billion, but a larger share of it is now reaching specific projects as programmes move into second phases. The design is shifting from supply-side capital grants toward demand-side instruments: 112 demand-side policies advanced in the past year against 114 supply-side, and legislated policies could trigger demand for nearly 6 million tonnes a year by 2030, with government demand targets adding up to 9.5 million tonnes. Production targets, by contrast, sit at 27–33 million tonnes — a reminder that governments have promised three to five times the demand they have legislated.
Private capital has not filled the gap. Hydrogen venture capital fundraising fell by one-third in 2024, outpacing declines in broader energy venture funding, and publicly traded hydrogen companies have continued to see lower investor returns and revenues. Development finance institutions are increasingly backing blended structures in Brazil, Egypt, Morocco, Namibia and South Africa, where domestic projects need concessional capital to reach a decision.
The investment question that decides the forecast
Between now and 2027 the sector faces a single test: whether the roughly 100 gigawatts of announced electrolyser capacity that has not yet reached a final investment decision converts before the window closes. The IEA is explicit that without decisions before the end of 2027, that capacity loses any realistic chance of operating by 2030. The US credit cliff, European auction capacity of EUR 1.3 billion a year and Chinese provincial support are the three levers that decide it. The forecast in this report assumes a minority of that pipeline converts — enough to reach roughly 30 to 35 gigawatts of cumulative capacity by 2030 and 68.8 gigawatts by 2033, and not enough to validate the manufacturing capacity already built.
Technology & Innovation
A two-technology market with four technologies in it
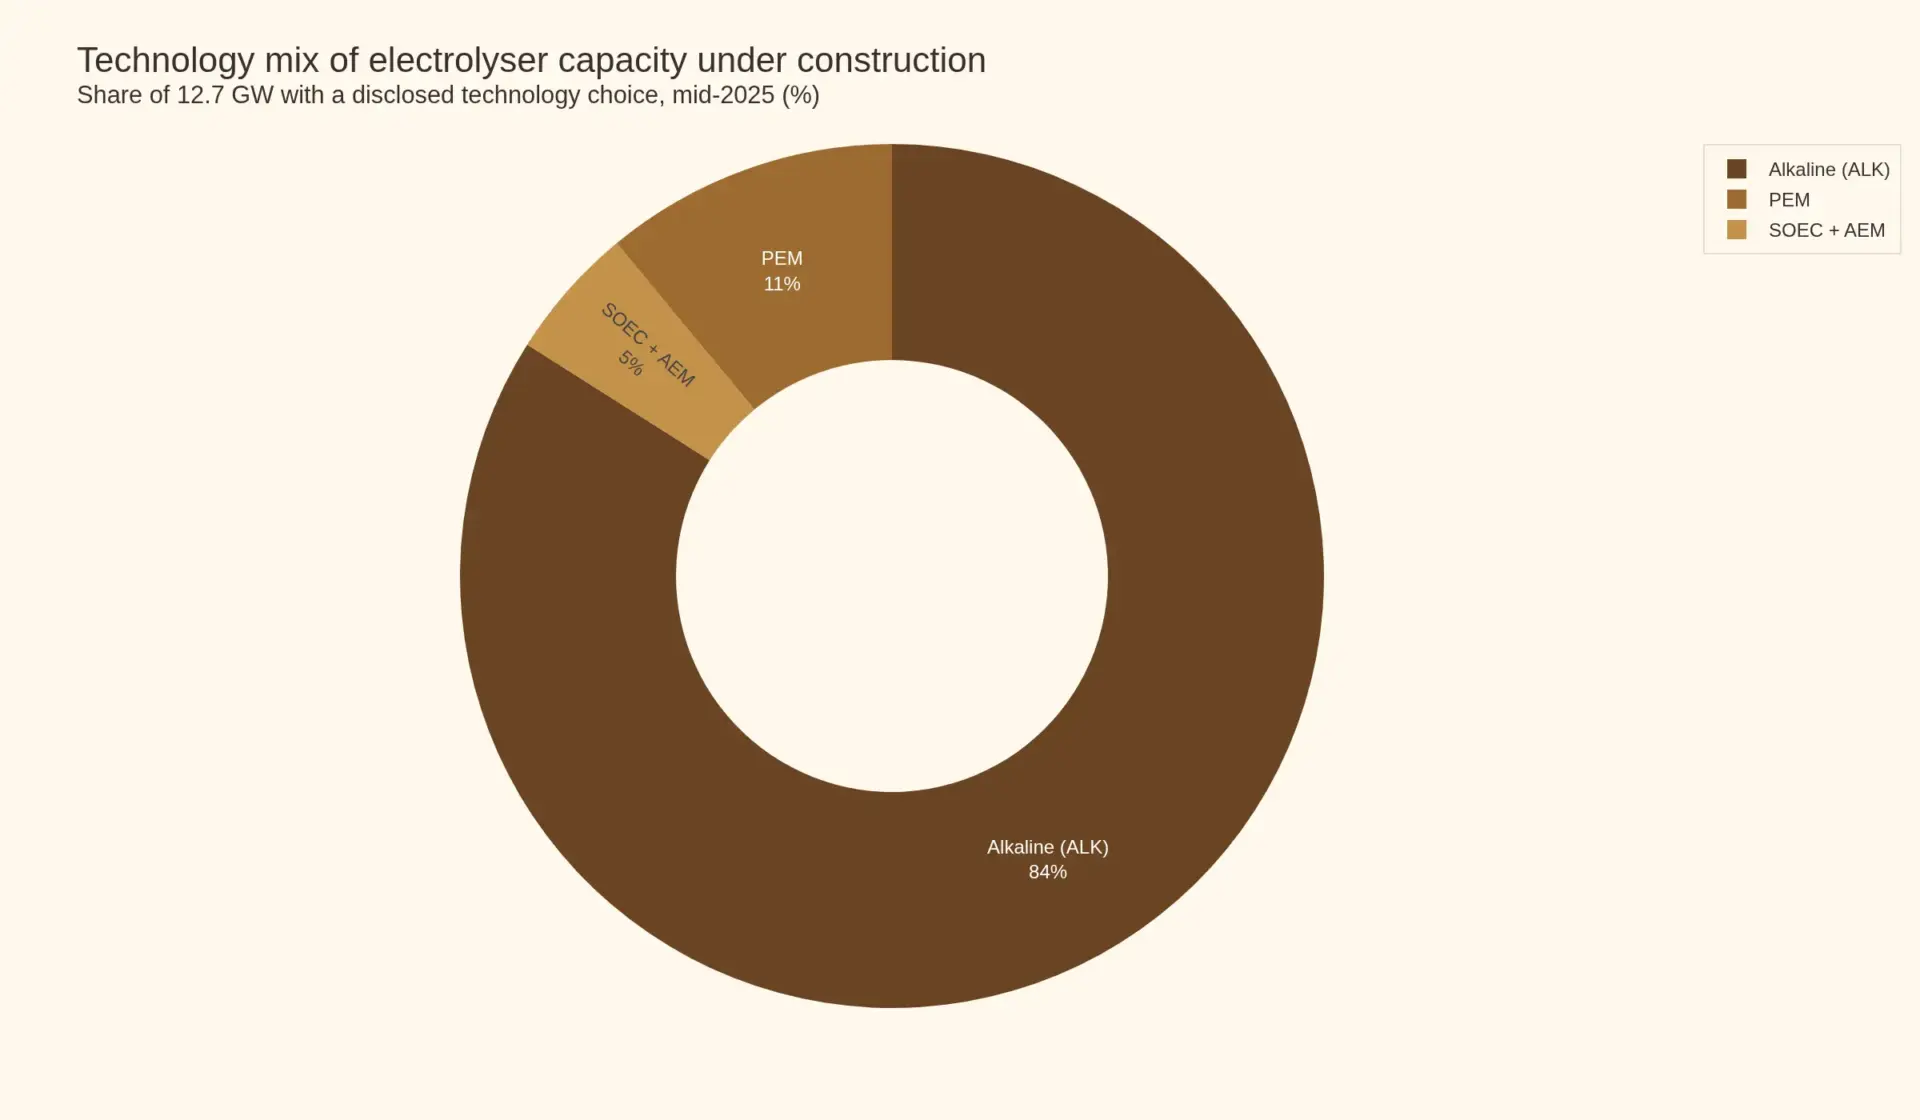
Alkaline and PEM are the market. Alkaline holds 64% of installed capacity and 84% of capacity under construction; PEM holds 36% of installed capacity but only 11% of what is being built. Solid oxide and anion exchange together make up about 5% of the pipeline. The gap between 36% installed and 11% under construction for PEM is the most consequential technology signal in the sector: the projects now being financed are choosing alkaline at a ratio of roughly eight to one.
Why alkaline is winning the pipeline
Alkaline wins on capital cost and manufacturing maturity, and in a market where the stack is 6–9% of the levelised cost of hydrogen, that is close to the whole argument. Global alkaline manufacturing capacity is 43 gigawatts a year, 86% of it in China, and Chinese alkaline capital costs fell to USD 500–1,100 per kilowatt in 2025 against USD 1,900–2,500 outside China. Eleven of the twelve largest electrolyser manufacturing facilities in the world are in China.
Alkaline’s historical weakness — slower response to variable renewable input — has been partly engineered out through multi-stack plant architecture. Projects of 100–500 megawatts, which now account for 52% of capacity under construction, consist of hundreds of modular stacks cycled individually, which gives the plant load flexibility that a single large stack cannot provide. Only 9% of capacity under construction is in units below 100 megawatts. The technology has not changed fundamentally; the way it is assembled has.
PEM’s narrowing niche
PEM retains real advantages where load response, footprint or pressure matter, and it dominates outside China’s alkaline base — Europe holds 54% of global PEM manufacturing capacity, led by Siemens Energy at 3 gigawatts, followed by Ohmium at 2 gigawatts in India, Fortescue at 2 gigawatts in Australia, ITM Power at 900 megawatts and Cummins with 700 megawatts in China, 700 in the United States and 500 in Spain. The constraint is iridium. Loading reductions from 1.3 to 0.4 grams per kilowatt are the industry’s route to gigawatt-scale PEM without competing for a metal produced in single-digit tonnes a year, and progress on that curve will decide whether PEM’s 11% share of the pipeline is a cyclical trough or a structural ceiling.
Solid oxide and anion exchange: capacity without commercialisation
Solid oxide has 2.6 gigawatts a year of manufacturing capacity, concentrated in the United States, and a genuine efficiency advantage where waste heat is available from ammonia or steel plants — its higher-temperature operation partly substitutes heat for electricity. Anion exchange is further back: 75 megawatts of annual manufacturing capacity worldwide, 50 megawatts of it in China. Enapter, the most prominent AEM pure-play, restructured in August 2026 to an asset-light model, handing volume manufacturing to partners in China and the United States, retaining electrode chemistry at Pisa, and adding alkaline products to its own portfolio to reach projects above multi-megawatt scale. A technology leader diversifying into the incumbent technology is a clearer statement about commercial readiness than any pilot result.
Efficiency and lifetime are improving faster than cost
Specific energy consumption has fallen from 51.2 kilowatt-hours per kilogram of hydrogen in 2020 toward a 2050 expectation of 43.8, and stack lifetimes have moved from 60,000–80,000 hours toward 100,000–120,000. Both changes improve project economics materially without changing equipment price, which is why cheap stacks have not translated into cheap hydrogen: durability and efficiency decide how much electricity a project consumes over twenty years, and electricity is the majority of the levelised cost.
Measured learning rates on European project data are 32.1% for PEM and 22.9% for alkaline, with small-scale systems showing around 25% — steep in the way that early-stage technologies are steep, and measured over a period when volumes were tiny. The forecast in this report deliberately does not extrapolate them to system price: with the stack at 6–9% of levelised cost and more than half of capital expenditure in construction, system price deflates at roughly 3% a year even if stack costs halve.
The Chinese standards turn
The most important technology development of the past year is regulatory, not electrochemical. In November 2025, 40 Chinese equipment manufacturers signed an agreement covering ten actions, including ending below-cost bidding and refraining from inflated claims about efficiency and lifetime. In March 2026 the Chinese government set a performance target for mass-manufactured electrolysers and began planning mandatory national standards for energy efficiency. In a market where the largest producers competed partly by overstating performance, a binding efficiency standard changes what can be sold — and would raise the floor under a price war that has driven awarded bids to USD 170 per kilowatt.
Market Risk
The risk is demand, and everything else is second order
Electrolyser manufacturing capacity of 58 to 61 gigawatts a year against just over 4 gigawatts installed is not a market with a supply problem. The risks that matter are the ones that determine whether projects get built at all.
| Risk | Level | Direction | What would trigger it |
|---|---|---|---|
| Offtake and demand | High | Rising | Firm offtake stays under 2 Mtpa against 4.3 Mtpa committed production |
| Policy reversal | High | Rising | 45V closes to construction after 2027; EU misses 2030 target too |
| Price deflation and overcapacity | High | Stable | Bids below USD 200/kW persist despite the November 2025 pact |
| Critical materials | Moderate | Falling | Iridium loading stalls above 1 g/kW for PEM |
| Electricity cost | High | Stable | Renewable PPA prices rise; stack is only 6–9% of levelised cost |
| Technology substitution | Moderate | Stable | SOEC efficiency gains where waste heat is available |
| Counterparty and consolidation | High | Rising | Further OEM failures after warranties have been sold |
Offtake: the number that does not move
Cumulative firm offtake agreements for low-emissions hydrogen total under 2 million tonnes a year — about 5% of the 37 million tonnes that announced projects could produce by 2030. Committed production from projects that are operational, under construction or at final investment decision already reaches 4.2 to 4.3 million tonnes. Producers cannot sign the contracts that would justify the next wave of investment because buyers will not pay the premium, and buyers will not commit because supply is not yet certain. That circularity, not technology, is what has kept the 2030 pipeline falling from 49 to 37 to 27 million tonnes in three successive editions of the IEA’s review.
Policy: a closing window, not a stable floor
The US credit now has an expiry date for new projects, which converts a support mechanism into a deadline and guarantees a cliff in construction starts after 2027. The EU missed its 2025 electrolyser target, has cut and raised national goals in opposite directions, and manages demand through auctions sized in hundreds of millions of euros against a capital requirement measured in tens of billions. Announced public funding has fallen by two-thirds to USD 38 billion cumulatively, while production targets of 27–33 million tonnes sit three to five times above legislated demand of about 6 million tonnes. The gap between what governments have promised and what they have legislated is the sector’s largest single source of forecast error.
Price: the deflation that helps the market and hurts the supplier
Chinese awarded bids as low as USD 170 per kilowatt are below the USD 500–1,100 capital cost range the IEA reports. That is rational for a manufacturer with a factory to fill and irrational for anyone who has to fund warranty obligations over twenty years. The November 2025 agreement among 40 manufacturers to end below-cost bidding and the March 2026 government performance targets are attempts to put a floor under this, and their enforcement is the single best indicator of whether Western manufacturers have a commercially viable niche or a temporary one protected only by local-content rules.
Electricity, not equipment, decides the project
Electrolysers are 55–65% of the levelised cost of hydrogen and the stack is 6–9%. The remaining majority is electricity. This inverts the usual risk analysis: a project can survive paying 30% more for its stacks and cannot survive paying 30% more for its power. It is why the cheapest renewable hydrogen costs 40–45% less to produce in China than in Europe or the United States, why the winning bids in the EU’s third hydrogen auction ranged from EUR 0.44 to EUR 3.48 per kilogram, and why the forecast’s regional mix follows cheap power rather than cheap equipment.
Counterparty risk in a consolidating supplier base
When manufacturers with sub-10% utilisation fail, they fail with installed equipment in the field. Nel’s halt of alkaline production at Herøya, Enapter’s restructuring and the bankruptcies and acquisitions the IEA documents all transfer risk to buyers holding warranties on machines expected to run 60,000–100,000 hours. A twenty-year asset bought from a company with one year of cash is a different asset. This is the risk least visible in market sizing and most consequential per project.
What would change the forecast
Upward: a binding global demand instrument — an implemented IMO Net-Zero Framework or an EU-style mandate extended to steel and fertiliser procurement — would convert announced pipeline into orders faster than any subsidy. Downward: if the US credit cliff passes without a replacement and European auction volumes stay in the hundreds of millions, cumulative capacity in 2033 would plausibly land near 40 gigawatts rather than 68.8, and revenue near USD 7 billion rather than USD 12.66 billion. The asymmetry is deliberate in the other direction too: this forecast already excludes the 439 gigawatts of announced projects, so the realistic range around it is wider on the upside than the downside.
Regulatory Landscape
Policy is the demand curve
No other capital equipment market has its demand set so directly by administrative decision. Electrolyser orders are not driven by replacement cycles or by consumer preference; they are driven by whether a project that produces hydrogen can be made bankable by a subsidy, a mandate or a procurement obligation. Four jurisdictions set the terms.
European Union: the auction machine, and a missed target
The EU’s stated ambition is 40 gigawatts of domestic electrolyser capacity by 2030. It missed its 2025 interim target. Member state targets have moved in both directions — France cut its 2030 goal from 6.5 to 4.5 gigawatts while Spain tripled its to 12 gigawatts — and the bloc’s manufacturing capacity stood at 8.9 gigawatts a year at the end of 2025 against a planned 41.7 gigawatts a year by 2030, according to the European Commission’s SETIS observatory.
The instrument that actually moves projects is the European Hydrogen Bank, which pays a fixed premium per kilogram of certified production for up to ten years. The third auction, launched in December 2025 with EUR 1.3 billion from emissions trading revenues, was split into three topics: EUR 600 million for renewable hydrogen, EUR 400 million for renewable and electrolytic low-carbon hydrogen, and EUR 300 million for hydrogen supplied to maritime or aviation offtakers. The results published in June 2026 show both the competitiveness and the small scale of the market: winning bids ranged from EUR 0.44 per kilogram for a 500-megawatt Finnish project to EUR 1.48 per kilogram for Spanish projects, with the maritime topic clearing at EUR 3.48. That dispersion — a factor of eight between the best and worst bid — is a cost-of-electricity map of Europe rather than a technology comparison.
The second auction added a localisation condition requiring at least 75% of electrolyser stack capacity to originate outside China. This is the most consequential trade rule in the sector: it creates a protected demand pool for non-Chinese manufacturers that would otherwise lose every price comparison, and it is the main reason European and American OEMs still have an order book at all.
United States: a credit with a closing date
Section 45V of the Internal Revenue Code provides a production credit for qualified clean hydrogen scaled to lifecycle emissions. For 2025 the base amount ranges from USD 0.127 to USD 0.637 per kilogram, multiplied by five where prevailing wage and apprenticeship requirements are met — a maximum near USD 3.19 per kilogram, which is the difference between a marginal project and a viable one.
The closing date now dominates US project economics. Public Law 119-21, the One Big Beautiful Bill Act, eliminates the section 45V credit for facilities beginning construction after 2027, and qualification requires construction to begin before 1 January 2028. For developers, this creates a hard cliff: projects that reach a construction start before the deadline keep a ten-year credit; those that slip lose the credit entirely. The predictable behaviour is a pull-forward of investment decisions into 2026 and 2027 and a thin pipeline behind the deadline — which is precisely the shape of the 2025 decline in final investment decisions, which fell below 0.8 million tonnes a year.
Adjacent credits — 45Q for carbon capture, 45Z for clean fuels, 48C for manufacturing — remain relevant, and are the reason CCUS-equipped hydrogen is more competitive than electrolysis in low-gas-price regions such as the United States and the Middle East.
China: subsidies, standards and an export drive
Chinese deployment is driven by provincial subsidies and rollout through state-owned enterprises rather than by a single national auction. Procrastination is not the problem: the country tenders more than a gigawatt a month, 12–14 gigawatts a year, against domestic demand under 2 gigawatts. The regulatory shift of the past year has been toward quality and price discipline — the November 2025 ten-point agreement among 40 manufacturers and the March 2026 performance targets and planned mandatory efficiency standards. In effect, the Chinese state is now regulating the behaviour that its own overcapacity produced.
India, Japan, Korea and the maritime route
India’s National Green Hydrogen Mission targets 5 million tonnes a year by 2030 supported by the SIGHT incentive scheme for electrolyser manufacturing, and India has emerged as a genuine manufacturing location with 2 gigawatts of PEM and 240 megawatts of alkaline capacity. Japan targets 3 million tonnes of consumption by 2030 with hub support and contracts-for-difference. Korea’s power-sector support is one of the few places where fuel cells and hydrogen-fired generation are progressing. The International Maritime Organization’s Net-Zero Framework, once implemented, would be the first binding global demand instrument for hydrogen-derived fuels — and the EU’s FuelEU Maritime and ReFuelEU Aviation rules already create regional mandates for e-fuels.
Certification: the quiet infrastructure
Hydrogen is only tradeable if its emissions attributes can be certified, and this is where regulatory progress has been fastest. The ISO standard on hydrogen certification is on track to be fully in place in 2025/2026; India has launched a national scheme; and the EU has recognised certification bodies able to certify renewable hydrogen against its delegated acts. For manufacturers, certification determines which projects can claim a premium, and therefore which projects get financed. It is the least discussed and most decisive layer of the regulatory stack.