
Global Sensors Market Report, Size, Share and Forecast 2026–2033
Sensors are the one part of the chip industry the AI cycle left behind
In 2025 the world bought USD 20.89 billion of semiconductor sensors — the packaged devices that measure pressure, motion, temperature, current, gas, light and flow. In the same year the semiconductor industry sold USD 795.64 billion of everything. Sensors were 2.63 per cent of it.
In 2026 the World Semiconductor Trade Statistics organisation expects the total market to reach USD 1.51 trillion, growth of 89.9 per cent, with memory alone up by around 250 per cent and logic up 37 per cent. Sensors are forecast to grow 3.0 per cent to USD 21.52 billion. That takes them to 1.42 per cent of the industry in a single year, and to 1.20 per cent by 2027.
Sensors are therefore the only semiconductor category in which the largest capital cycle the industry has ever run is invisible. Their demand is set by something else entirely: industrial automation, energy metering, medical monitoring, vehicle platforms, and the replacement cycle of instruments already installed. That separation is the organising fact of this report — and it produces a specific, dated hazard.
Capacity is being committed at the top of a cycle whose demand growth has just stopped
SEMI's MEMS & Sensors Fab Report (September 2026) records fab equipment spending on MEMS and sensor lines falling in both 2024 and 2025, then rising 26 per cent to USD 13 billion in 2026 and a further 44 per cent in 2027, with 19 new volume facilities and production lines entering operation from 2026 onward, and 467 facilities tracked across the 2018–2029 window.
Set that against the market it serves. USD 13.0 billion of tool spending against a USD 21.52 billion market is 60.4 per cent of one year's revenue. By 2027, USD 18.72 billion of spending against USD 23.00 billion is 81.4 per cent. No sensor cycle in the past two decades has run equipment spending at four-fifths of annual market value. That single ratio drives the conservative case in this report, and it is why the risk window is dated to 2028–2029 rather than left as a general caution.
The perimeter, stated plainly — and one figure this report withdraws
"Global sensors market" is not a defined statistical object, and the spread between published estimates is not disagreement about growth. It is disagreement about what counts. Four perimeters, in ascending order of coverage:
| Perimeter | 2025 value | What it contains |
| Sensors — WSTS product category | USD 20.89bn | Packaged semiconductor sensor devices: MEMS inertial, pressure, temperature, magnetic, flow, gas, optical and proximity |
| Optoelectronics — WSTS product category | USD 43.04bn | Image sensors, LEDs, laser diodes, optical devices. 5.41 per cent of the 2025 chip market in its own right |
| Sensors plus optoelectronics | USD 63.94bn | The widest perimeter any primary statistical body publishes |
| "Global sensors market" as this page previously carried it | Withdrawn | USD 236.75bn — 11.33 times the WSTS sensor category |
No statistical agency, industry association or exchange publishes a sensor market at USD 236.75 billion. A figure of that size is only reachable by counting complete sensor-based instruments and process-automation systems — transmitters, analysers, flow meters, machine-vision systems — in which the sensing element is a small fraction of the sale price. That is a real market. It is the instrumentation market, and mixing its revenue with device-level sensor revenue produces a growth rate that describes neither. Every figure in this report is on the device perimeter, and the WSTS sensor line is its spine because it is the only series that a primary statistical body publishes, revises and dates.
Two corrections follow from that, and both matter more than they look. The withdrawn figure was more than eleven times the real category. Its stated growth rate was also never arithmetically consistent with its own endpoints: USD 236.75 billion rising to USD 452.27 billion over eight years compounds at 8.43 per cent, not the 10.4 per cent the page printed beside it.
What FY2025 actually showed: the market split by end market, not by region
Five disclosed results, read together, describe a sensor industry that grew in one half and contracted in the other. None of these lines is a pure sensor line — Sony's segment includes display devices, TE's Industrial segment is connectors as well as sensors, Infineon's Power & Sensor Systems is mostly power semiconductors, and ST is a whole company — so they are read here for direction, not for size.
| Business | FY2025 measure | Change | Margin |
| Sony Group — Imaging & Sensing Solutions | Sales JPY 2,151.5bn (USD 14.28bn at JPY 150.7) | +19.59% | Operating income JPY 357.3bn, 16.61% |
| TE Connectivity — Industrial Solutions | Net sales USD 7,874m | +23.73% | Segment operating income 17.69% |
| Sensirion | Revenue CHF 342.4m | +23.83% | Gross margin 52.3%, EBIT 12.5% |
| Infineon — Power & Sensor Systems | Revenue EUR 4,208m | +10.88% | — |
| STMicroelectronics — group | Net revenue USD 11.80bn | −11.1% | Operating margin 1.5% |
The median sensor business grew by about a fifth. The most consumer- and automotive-exposed one fell by more than a tenth and earned a 1.5 per cent operating margin. That dispersion is not a regional story — every one of those five sells into Asia. It is an application story: industrial, energy and medical demand absorbed sensors at record rates in 2025 while consumer and automotive chains worked down inventory, and the companies whose revenue sits in the first group posted record profits while the one sitting in the second posted its worst year since the 2023 downturn.
Forecast: USD 20.89 billion to USD 36.00 billion, 7.04 per cent
The 2025 figure and the 2026–2027 rates below are WSTS's own. From 2028 the path is a Pheonix construction, described in the method note at the foot of this page.
| Year | Market value (USD bn) | Growth | Basis |
| 2025 | 20.89 | +10.4% | WSTS |
| 2026 | 21.52 | +3.0% | WSTS |
| 2027 | 23.00 | +6.9% | WSTS |
| 2028 | 24.61 | +7.0% | Pheonix |
| 2029 | 26.46 | +7.5% | Pheonix |
| 2030 | 28.58 | +8.0% | Pheonix |
| 2031 | 30.86 | +8.0% | Pheonix |
| 2032 | 33.34 | +8.0% | Pheonix |
| 2033 | 36.00 | +8.0% | Pheonix |
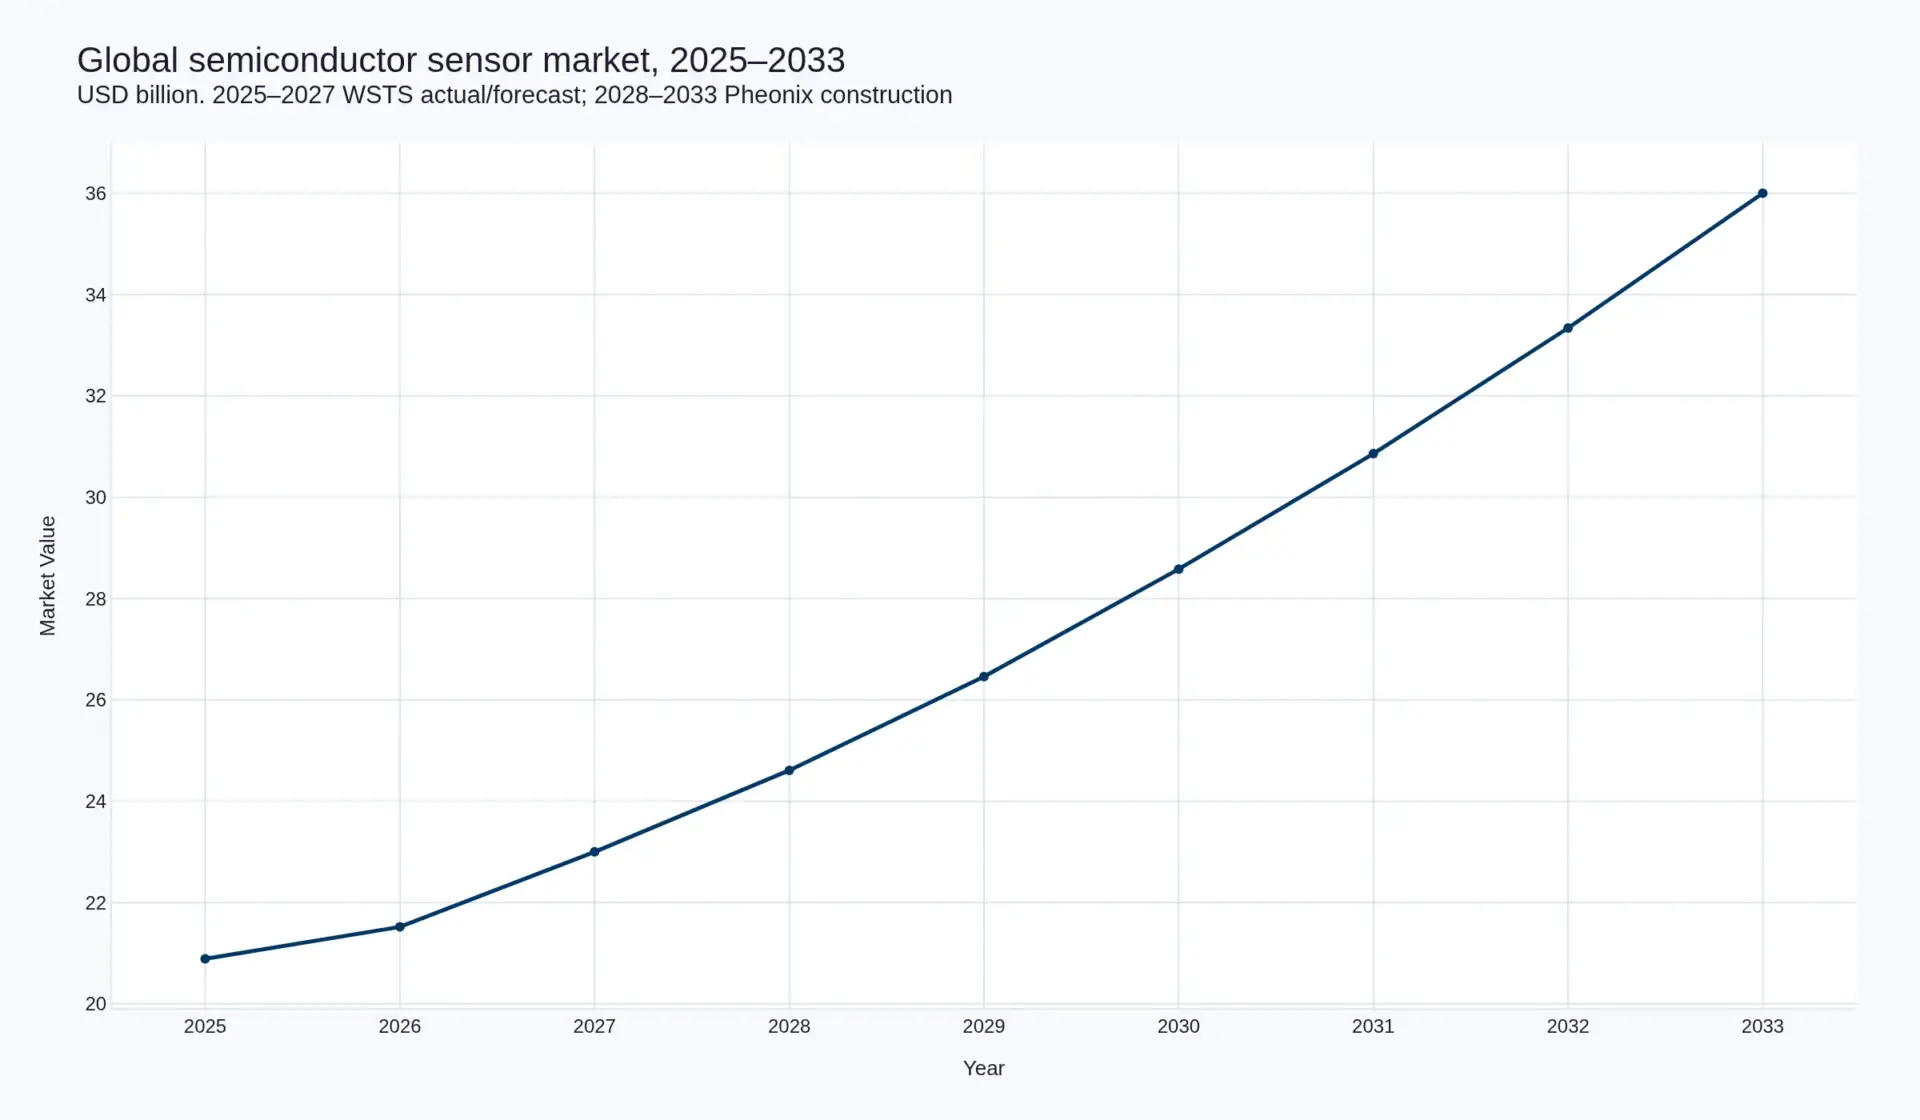
Global semiconductor sensor market value, 2025–2033 (USD billion). 2025 actual and 2026–2027 forecast per WSTS Spring 2026; 2028–2033 Pheonix construction at 7.0–8.0 per cent a year.
The shape of that path is deliberate. Growth troughs in 2026 at 3.0 per cent — the year in which memory prices rise fastest and consumer electronics budgets are squeezed hardest — then recovers through 2027 as the industrial and metering cycle carries sensor content, then runs above-trend from 2030 as robotics, grid instrumentation and vehicle platforms add sensing functions that did not previously exist. Total growth over the period is USD 15.11 billion.
Scenarios
| Case | 2033 value | CAGR 2025–2033 | What has to be true |
| Optimistic | USD 38.05bn | 7.78% | Industrial metering, robotics and vehicle sensing compound in units while average selling prices hold; the 2027 capacity wave is absorbed by new application categories rather than competing for existing sockets |
| Base | USD 36.00bn | 7.04% | 2028–2029 price deflation is absorbed by unit growth, as it was in 2019–2020 and 2023–2024; sensor content per vehicle and per machine keeps rising at a mid-single-digit rate |
| Conservative | USD 31.42bn | 5.23% | Sensor capacity oversupply lands on a decelerating consumer and automotive base; memory inflation continues to crowd sensor content out of phone bills of materials; the industrial cycle turns before 2030 |
Regional split, 2025
| Region | 2025 value (USD bn) | Share |
| Asia Pacific | 10.45 | 50.0% |
| Americas | 5.22 | 25.0% |
| Europe | 3.55 | 17.0% |
| Japan | 1.67 | 8.0% |
| Total | 20.89 | 100.0% |
WSTS reports 2025 semiconductor demand at Asia Pacific 55.3 per cent, the Americas 32.2 per cent, Europe 6.9 per cent and Japan 5.6 per cent. The sensor split above deliberately departs from it: sensors shift value away from the Americas and toward Europe and Japan, because automotive and industrial sensing — where European and Japanese vendors earn their revenue — carries a far higher sensor content per unit than the consumer and data-centre applications that dominate the Americas number. The split is a Pheonix construction on the WSTS regional frame, and it is labelled as one.
What to watch
- Sony's FY2026 segment result against its own guidance. The company guides I&SS sales down 3.79 per cent to JPY 2,070bn and operating income up 12 per cent to JPY 400bn — a 19.32 per cent margin on a shrinking top line. If the margin arrives while sales fall, sensors have become a mix story. If it does not, the consumer sensor base is deteriorating faster than the market's headline rate implies.
- Whether the 2027 capex number lands. SEMI's +44 per cent is a forecast made before the 2026 order book was complete. A shortfall is bullish for price; a landing at or above forecast is the trigger for the 2028 deflation case.
- The WSTS autumn revision. The sensor line has been revised in each of the last three cycles. A 2026 number below 3.0 per cent would confirm the consumer squeeze; above it would suggest the industrial cycle is running hotter than the aggregate shows.
- ST's gross margin. At 33.9 per cent against Sensirion's 52.3 per cent, ST is the clearest read on how much value a broad sensor portfolio captures when its end markets are weak. Recovery above 40 per cent is the signal that the commodity end of the market has cleared.
Method note
Four things in this report are externally anchored and dated: the 2025 market size, the 2026 and 2027 growth rates, the fab equipment spending series, and every company figure in the FY2025 table. Everything else is construction, and the mechanism for each is stated where it appears. Two limits are worth naming. First, no unit series is published on this page: no source supports a defensible global count of sensor units shipped, and deriving one from value divided by an assumed average price would manufacture precision that does not exist. Second, SEMI's MEMS and sensor fab series and its broader 200mm equipment outlook do not point the same way for 2027–2029; this report uses the MEMS and sensor series because it is the narrower and better-matched perimeter, and readers using the wider 200mm view should expect a different 2028–2029 shape, not a different direction.
Why this market remains the one to understand
Sensors are 1.4 per cent of the semiconductor industry by value and a far larger share of its strategic importance: every electrified vehicle, every grid meter, every surgical device and every robot is bounded by what can be measured. The industry's growth rate is modest, its qualification cycles are long, and its leaders are protected by certification rather than by process node. In a market where AI capital has concentrated all attention on memory and logic, that makes sensors the cheapest place to observe what physical demand is actually doing.
Table of Contents
- Executive summary and market overview
- Market size 2025: USD 20.89 billion
- Forecast 2033: USD 36.00 billion
- CAGR 2025-2033: 7.04 per cent
- Share of the 2025 semiconductor market: 2.63 per cent
- Share of the 2026 semiconductor market: 1.42 per cent
- Perimeter and definition – why figures above USD 200 billion describe a different market
- FY2025 performance by business – five disclosed results read together
- Forecast to 2033 – year path, scenarios, regional split
- Value chain – qualification, not silicon, sets the price
- Technology and innovation – fusion, integration, gas and biosensing
- Competitive landscape – fragmented by parameter, concentrated at the top of each
- Regulatory landscape – AEC-Q100, ISO 26262, MDR, MID
- Investment activity – capex at 60.4 and 81.4 per cent of market value
- Market risk – the 2028-2029 deflation window
Competitive Landscape
Competitive landscape: fragmented by parameter, concentrated at the top of each
There is no sensor market leader in the sense that there is a memory leader. No company holds twenty per cent of USD 20.89 billion, and the reason is that “sensors” is not one product but a dozen. Each parameter measured — pressure, motion, magnetic field, temperature, flow, gas, light — has its own qualified supplier list of two to four credible names, and a company that leads one rarely leads another.
The structure that matters
The industry is best understood as two markets sharing a boundary. The consumer market is scale-driven, priced annually, and rewards whoever can hold yield on the smallest package. The automotive, industrial and medical market is qualification-driven, priced by platform, and rewards whoever already holds the certificate. Gross margins in the first sit in the thirties; in the second, in the fifties. Almost every strategic question in this report resolves to which of the two a company is actually in.
| Business | What it actually sells | Position |
| Sony Group — Imaging & Sensing Solutions | Image sensors, overwhelmingly for mobile cameras; also automotive and industrial imaging | Largest single sensor business in the world by revenue at JPY 2,151.5bn, record operating income JPY 357.3bn |
| Bosch | Automotive MEMS inertial and pressure, consumer MEMS | Private; the benchmark automotive MEMS supplier, no disclosed segment revenue |
| Infineon Technologies | Magnetic and current sensing, pressure, radar — inside Power & Sensor Systems at EUR 4,208m alongside power semiconductors | Growth of 10.88 per cent in FY2025 on a mostly-power segment |
| STMicroelectronics | MEMS inertial, pressure, temperature, time-of-flight — inside an USD 11.80bn group | Broadest portfolio, weakest financial year: revenue −11.1%, operating margin 1.5% |
| TE Connectivity | Industrial and transportation sensors inside a USD 7,874m Industrial segment that also carries connectors | Industrial segment +23.73 per cent at a 17.69 per cent operating margin |
| Sensirion | Flow and environmental sensing, with algorithms and software attached | Pure play, CHF 342.4m revenue, 52.3 per cent gross margin, EBIT 12.5 per cent |
Beyond those six, the qualified lists include Texas Instruments and Analog Devices in signal-chain and temperature, NXP in automotive position and radar, Honeywell in industrial and aerospace, Melexis and Allegro in magnetic and current, and a long tail of specialists in gas, ultrasound and biosensing.
Why this market does not consolidate quickly
Consolidation in sensors buys revenue without buying position. Acquiring a supplier transfers its parts, its fabs and its people, but not its qualification: every customer has to accept the new owner as the manufacturer of record, and in automotive that is a fresh PPAP cycle on each part number. The practical result is that M&A in this industry is small-ticket and additive — filling a parameter gap or buying an algorithm — rather than transformational, and no transaction in the forecast period changes the top of any qualified list.
That is a genuine finding rather than a hedge. In a market where share is protected by certificates, the only two ways to grow are to enter a parameter you do not have or to grow the end market you are already in. Neither is fast, and both favour incumbents with cash.
Who gained in 2025, and why it was not about geography
Sensirion at +23.83 per cent and TE’s Industrial segment at +23.73 per cent tell the same story from opposite ends of the size range: industrial, energy and medical demand was there to be taken, and companies with calibration depth and certified part families took it. Infineon’s +10.88 per cent sits between them. ST’s −11.1 per cent is the counter-example, and it is not a story about being European or selling into Asia — it is a story about a portfolio weighted toward consumer and automotive in a year when both destocked.
The threat that is not yet in the numbers
The merchant middle — the tier of suppliers selling reasonably standard parts into reasonably open applications — is where the 2026 and 2027 capacity wave lands. The 19 new volume facilities and production lines SEMI expects from 2026 onward are the mechanism by which that middle gets competed away: new entrants cannot win an automotive socket, so they will price into whatever is open. A buyer of standard pressure, temperature or flow parts should expect more choice and better prices from 2028; the incumbent suppliers of those parts should expect the opposite.
For anyone selecting a supplier now, the practical test is not market share but certificate depth: how many part numbers are already in production at an ASIL grade, an ISO 13485 process or a legal-for-trade approval. That is the asset that survives the capacity cycle, and it is the asset the next four years will reprice.
Value Chain
Value chain: the qualification is the product, not the die
A sensor is one of the few semiconductor products where the silicon is the least interesting part of the cost stack. The chain runs: transducer design, front-end wafer fabrication, wafer-level test, packaging, calibration, module assembly, Tier-1 integration, OEM platform. In a consumer part the package and the calibration can carry more cost than the die. In an automotive part the certification that surrounds them dwarfs both.
Where the money actually sits
Three cost centres explain the margin spread across this industry better than any market-share table does.
Packaging. A MEMS transducer is a moving mechanical structure that must be protected from the environment it is measuring, or exposed to it in a controlled way, while remaining hermetic where it needs to be. Media-isolated pressure sensors, gas sensors with an open port, and microphones with a back chamber are all packaging problems before they are silicon problems. Yield is set here, not in the fab.
Calibration and test. Every sensor is an analogue device that has to be trimmed across temperature and life. That requires test capacity which is specialised, slow and expensive relative to a digital logic tester, and it is the reason a fab-lite specialist can compete with an IDM: the calibration asset is not a wafer fab, and it is not transferable to a competitor by buying the same tool.
Qualification. This is the real barrier, and it is administrative rather than physical. An automotive sensor must clear AEC-Q100 stress qualification, sit inside an ISO 26262 functional-safety argument at a defined ASIL, and be supported by a PPAP dossier. A change of die, fab or package triggers re-qualification measured in months. A medical sensor carries ISO 13485 and, in Europe, MDR obligations; in the United States a change to a cleared device may require a new submission.
The consequence is an asymmetry that governs the whole industry. A USD 2 sensor that reports wheel speed wrongly disables a USD 40,000 vehicle and a recall. No platform team second-sources that part to save cents. Once a socket is won it is held for the platform life, typically five to seven years in automotive and longer in metering and medical.
What that does to the 2026-27 capacity wave
If share is frozen in the segments where margins are earned, new capacity cannot win sockets there. It can only chase the segments where price is the deciding variable — consumer handsets, wearables, white goods and the lower industrial tiers. Those are precisely the segments where average selling prices are already weakest and where the memory squeeze described in the risk chapter is consuming bill-of-materials headroom.
That is the mechanism behind this report’s conservative case, and it is a structural argument rather than a forecast of behaviour: the capex arriving in 2026 and 2027 is aimed at the part of the market least able to defend its price, because the part that can defend its price is closed to new entrants by paperwork.
The manufacturing footprint
Sensor front ends are built overwhelmingly on mature process generations — 200mm and below for MEMS, mature nodes for CMOS sensing — which is why the leading-edge scarcity that governs logic and memory is irrelevant here. The specialist foundry tier (X-FAB, and the sensor processes offered by the large Asian foundries) sits alongside in-house IDM capacity at Bosch, ST, Infineon and Sony. Because the process generations are mature, capacity is comparatively cheap to add, and cheap to add is exactly what makes oversupply possible.
Distribution, and where price deflation first becomes visible
Three channels coexist. Direct engagement with Tier-1 suppliers and OEM platform teams carries the design-in and the qualification dossier. Authorised distribution carries volume and inventory. Catalogue and online distribution carries the long tail — and it is the only part of the chain where prices are published, updated daily and comparable across suppliers. For anyone tracking sensor pricing, catalogue listings are the earliest observable signal: they turn before contract prices do, because contract prices are renegotiated annually and catalogue prices are not.
Inventory behaviour differs by segment too. Consumer sensors carry short lifecycle commitments and are exposed to platform cancellation; automotive and metering sensors carry ten-year availability commitments that turn inventory into a contractual obligation rather than a working-capital choice. A downturn therefore lands first and hardest on the consumer chain, which is consistent with what the FY2025 results in the overview show: the businesses most exposed to consumer sensing posted the weakest revenue and the thinnest margins, while the industrial and metering-exposed ones posted their best year.
What to take from the chain
Value in this industry accrues to whoever owns the calibration and the certification, not whoever owns the fab. Sensirion’s 52.3 per cent gross margin on CHF 342.4m of revenue is earned by a company that buys its wafers. ST’s 33.9 per cent gross margin is earned by a company that owns its fabs. That inversion is the single most useful fact in the value chain, and it explains why the strategic question for any entrant is not how to build a sensor but how to get one qualified.
Investment Activity
Investment activity: capex at 60 and 81 per cent of annual market value
The investment story in sensors is not about money being spent. It is about the ratio between what is being spent and what the market it serves is worth. On SEMI’s MEMS and sensor fab series, tool spending fell in both 2024 and 2025, then rises 26 per cent to USD 13 billion in 2026 and a further 44 per cent in 2027, before flattening at +2 per cent in 2028.
| Year | MEMS & sensor fab equipment spend | Sensor market value | Spend as share of market |
| 2026 | USD 13.00bn (+26%) | USD 21.52bn | 60.4% |
| 2027 | USD 18.72bn (+44%) | USD 23.00bn | 81.4% |
| 2028 | USD 19.09bn (+2%) | USD 24.61bn | 77.6% |
For scale: a capital-intensive industry normally runs equipment spending at a fifth to a third of annual revenue. Sensors are about to run it at four-fifths. Either the demand arrives to justify it, or the price of sensors falls until the capacity is absorbed — and there is no third outcome.
What the individual companies are doing, and the disagreement is informative
STMicroelectronics invested USD 1.79 billion of net capex in FY2025 and guides USD 2.0 to 2.2 billion for 2026 — an increase, in a year when revenue fell 11.1 per cent and the operating margin was 1.5 per cent. That is not a demand bet; it is a manufacturing-footprint programme, explicitly described by the company as reshaping its footprint and resizing its global cost base. Capital is going into fewer, larger, more efficient sites.
Infineon went the other way: investments of EUR 2,094 million in FY2025, down 23 per cent from EUR 2,719 million, with free cash flow improving as a result. The company grew its Power & Sensor Systems revenue 10.88 per cent without expanding capital spending.
Two European IDMs, the same end markets, opposite capex decisions — and both are rational. ST is buying cost structure; Infineon is harvesting it. What neither is doing is adding sensor capacity in anticipation of demand, which is why the industry-wide capex increase SEMI forecasts has to be coming from elsewhere.
Sensirion shows what the asset-light version looks like: CHF 33.3 million of capital expenditure against CHF 342.4 million of revenue, free cash flow of CHF 24.8 million, and a 52.3 per cent gross margin. A fab-lite model converts growth into cash quickly, which is precisely why it is the model new entrants adopt and precisely why it cannot protect a socket that requires a proprietary process.
Where the capacity money is actually going
Three destinations. Image sensor capacity, funded by the operating cash flow of a business earning a 16.61 per cent operating margin on JPY 2.15 trillion of sales. Automotive and industrial MEMS capacity at the integrated suppliers, where the qualification gates make the investment defensible. And packaging, test and calibration capacity, which is the least discussed and most binding constraint in the chain — you can buy a wafer fab faster than you can build calibration capability, and no amount of front-end capacity produces a shippable sensor without it.
The financial-investor view
Sensor hardware is a difficult venture asset and an easier strategic one, for the reason set out in the competitive chapter: qualification does not transfer with a company sale, so an acquirer is buying the parts that are already designed in, not the platform. That makes the natural exit a sale to an incumbent that can carry the certification burden, in the sub-USD 1 billion range, in a parameter gap it does not already own — gas sensing, ultrasound, biosensing. It does not make for a large disclosed transaction, and the absence of one in this forecast period is a statement about the structure of the market rather than about the appetite for deals.
What to track
One number is worth more than any other in this chapter: the ratio of fab equipment spending to market value. At 60 per cent it is a warning. Above 80 per cent it is a leading indicator of price destruction twelve to eighteen months later, because the capacity arrives before the qualification cycles can absorb it. Track that ratio, not the capex headline, and the 2028–2029 pricing outcome stops being a surprise.
Technology & Innovation
Technology and innovation: the rent has moved from the device to the algorithm
Sensor technology is mature in the transducer and active in everything around it. The physics of a piezoresistive pressure sensor or a capacitive accelerometer has not changed materially in two decades; what has changed is how much signal processing sits beside it, how much of the package has been eliminated, and how much of the calibration has been moved from a test cell into software that runs at the edge.
Five fronts that are actually moving
- Fusion and edge processing. The discrete accelerometer, gyroscope and magnetometer are being replaced by inertial measurement units with on-board fusion and, increasingly, with machine-learning inference in the sensor package. This adds value at the module and subtracts it from the discrete-part count — a distinction that matters enormously to anyone sizing this market by device revenue.
- Integration and packaging. Wafer-level packaging, through-silicon vias and direct MEMS-on-CMOS integration all attack the same target: eliminating the wire bond and the discrete signal-conditioning die. The commercial prize is not performance but cost per unit and size, which is why it lands first in consumer.
- Ultrasound and acoustic MEMS. Piezoelectric micromachined ultrasonic transducers and MEMS speakers are the most credible new category in the device layer, with applications in medical imaging, gesture sensing and audio. This is where the most active small-ticket acquisition interest sits.
- Gas and chemical sensing. Metal-oxide, electrochemical and optical (including photoacoustic) approaches are being pulled into HVAC by refrigerant transition rules, into industrial safety by methane regulation, and into indoor air quality by building standards. Gas sensing has the least mature supply base of the major sensor categories and the highest growth rate in this report’s construction.
- Biosensing. Continuous monitoring — glucose above all — is the category with the largest theoretical volume and the hardest regulatory path. It is the clearest example of the pattern in this chapter: the device is not the differentiator, the clinical evidence and the cleared indication are.
Why the innovation is not showing up in price
Consumer sensor average selling prices have been falling for a decade and continue to fall. The reason is structural: the categories that carry the most innovation (fusion, edge inference, integration) remove discrete parts from the bill of materials, so the value migrates from a set of cheap components to a smaller number of smarter ones. A handset can double its sensing capability while its sensor spend stays flat or declines.
This is the single most important distinction to hold when reading any sensor forecast, including this one. Function per device is rising faster than revenue per device. A market can be growing 7 per cent a year in value while the number of sensing functions deployed grows several times faster. Anyone planning capacity against function growth rather than revenue growth will overbuild.
The reliability problem nobody escapes
MEMS devices drift. Offset shifts over temperature and life, and the drift is a property of the mechanical structure and the package stress, not of the electronics. Automotive programmes require demonstrated stability over a 15-year service life, which cannot be simulated — it has to be accumulated in field data. That single requirement is why new entrants struggle in automotive even when their part performs better on a bench, and why the qualification moat described in the value chain is not merely paperwork: there is a physical evidence trail behind it that takes years to build.
Where the next leg of growth comes from
Three application categories carry the 2030-onward acceleration in this report’s base case, and none of them is a consumer category. Legal-for-trade metering, where grid digitalisation and loss-reduction programmes make certified sensing mandatory rather than optional. Robotics, where force, torque and tactile sensing are the binding constraint on capability. And electrification, where thermal management and battery monitoring have turned the sensor count per vehicle into a safety-critical number.
The technology to serve all three exists today. The constraint is qualification capacity, which is why the winners in the second half of this forecast period are more likely to be the companies that already hold the certificates than the companies with the best new transducer.
Market Risk
Market risk: the 2028-2029 deflation window
Three risks in this market are material, one is structural and slow, and one is a definitional trap that will mislead any reader who benchmarks this page against a larger-looking number elsewhere. They are ranked below by expected damage to revenue, not by likelihood of appearing in a headline.
Risk 1 — capacity arriving into decelerating demand (high)
MEMS and sensor fab equipment spending reaches 60.4 per cent of annual market value in 2026 and 81.4 per cent in 2027. Sensor demand growth is 3.0 per cent in 2026 and 6.9 per cent in 2027. Those two facts are incompatible over a three-year horizon unless prices fall. The window is specific: capacity ordered in 2026 qualifies through 2027 and ships into a market in 2028 that will be growing at roughly 7 per cent against installed capacity built for considerably more.
The mitigant is that new capacity cannot win automotive or medical sockets, so the price damage should be confined to consumer and merchant-industrial parts. That confines it geographically in the revenue line but does not confine it in the margin line: the merchant middle is where a large share of unit volume sits, and a 10 per cent price decline there is enough to move the whole market’s growth rate by several points. This risk is why the conservative case is 5.23 per cent rather than 7.04.
Risk 2 — memory inflation as a demand tax on consumer sensing (high)
This is not a forecast; the largest supplier in the market has already named it. Sony’s FY2025 results state that in the fourth quarter “the impact of memory market conditions gradually became more apparent in the smartphone market, especially in the low-end”, and its FY2026 guidance incorporates “a slight year-on-year decrease in the overall sales of mobile sensors” because of the view that the trend toward larger-sized sensors for smartphones will moderate.
The mechanism is bill-of-materials arithmetic. In 2026 the memory category is forecast to grow around 250 per cent. A handset whose cost structure is being reallocated toward memory does not increase its sensor content; a low-end handset may reduce it. Sensor content per phone has been the most reliable volume driver in this market for fifteen years, and for the first time since the smartphone was invented it is being outbid inside the device it lives in. A guide-down of 3.79 per cent from the market leader is the visible end of that.
Risk 3 — automotive concentration (high)
Automotive is the highest-value, highest-certification sensor end market, and it was flat to negative in the most recent reporting period: ST recorded automotive below expectations in the fourth quarter of 2025, and Infineon’s automotive segment revenue fell 4 per cent in its FY2025. A market that depends on vehicle platforms for both its growth and its margin protection cannot absorb a second consecutive flat year without revising its ceiling.
The exposure is asymmetric. Electrification and advanced driver assistance both add sensor content per vehicle, and both were expected to carry the 2028-onward acceleration in this forecast. If either slows — because of subsidy withdrawal, tariff structures or consumer demand for electric vehicles — the back half of the forecast loses its engine, and the base case falls toward the conservative path.
Risk 4 — substitution in the merchant middle (medium)
New entrants cannot win certified sockets, so they compete where certification is lightest: standard pressure, temperature, flow and consumer motion parts. That is a slow structural compression of price rather than a shock, and it is already visible in consumer average selling prices. It matters because it removes the margin buffer that funds the next qualification programme — the mechanism by which a price war in the open segment eventually reduces competition in the closed one.
Risk 5 — architectural substitution (medium)
Sensor fusion and smart sensors absorb discrete parts. An integrated inertial unit replaces three components with one; an edge-enabled sensor replaces a sensor plus a signal chain. Function improves and device revenue does not. Any participant planning capacity on the assumption that more sensing means proportionally more sensor revenue is mis-modelling the market, and this risk is the reason this report publishes no unit series: the relationship between functions deployed and devices sold is not stable enough to support one.
Risk 6 — the definitional trap (medium, and entirely avoidable)
Estimates of the “global sensors market” above USD 200 billion are not wrong; they are counting complete instruments and process-automation systems in which the sensing element is a small fraction of the sale price. On the device perimeter used throughout this report, the market is USD 20.89 billion in 2025. A procurement or investment case built by comparing a device-level share against an instrumentation-level market size will overstate the addressable opportunity by more than a factor of ten. The perimeter table in the overview is the reference point; it should be cited alongside any figure taken from this page.
What would change our mind
- A SEMI revision putting 2027 MEMS and sensor equipment spending materially below the +44 per cent forecast — that would remove most of the 2028–2029 deflation case and move the base toward the optimistic path.
- A WSTS revision lifting the 2026 sensor line above 3.0 per cent — that would indicate the industrial and metering cycle is running ahead of the aggregate, and that the memory squeeze is being absorbed.
- Sony guiding FY2027 segment sales to growth after a down year — that would show the handset sensor content curve has stabilised.
Regulatory Landscape
Regulatory landscape: certification is the wall around the profitable half
In most semiconductor markets regulation is a constraint. In sensors it is the competitive structure. The rules do not primarily govern what a sensor may measure; they govern who is permitted to supply it and how much it costs to change supplier. That is why this chapter sits closer to the commercial analysis than it would in a report on logic or memory.
Automotive: the tightest gate
Three instruments act together. AEC-Q100 defines the stress-test qualification regime for integrated circuits, with temperature grades that map to where in the vehicle a part may be used. ISO 26262 requires every safety-relevant function to be argued at an Automotive Safety Integrity Level, which determines how much diagnostic coverage the sensor and its interface must provide and how the part must behave when it fails. IATF 16949 governs the quality system of the manufacturing site, and PPAP is the submission that documents all of it to the customer.
The commercial consequence is a re-qualification cost per part number, not per company. Change the die, the fab, the package or the test programme and the dossier is reopened, in a process that runs to months and consumes engineering time on both sides of the relationship. Programme lifetimes of five to seven years follow from that arithmetic, and they are the reason the design-in mentioned in the value chain is worth more than the price of the part.
Medical: longer even than automotive
ISO 13485 sets the quality system; in Europe the Medical Device Regulation sets conformity assessment and clinical evidence obligations; in the United States a cleared or approved device carries a submission that a component change can reopen. A sensor substitution inside a market-cleared device is a regulatory event, not a procurement decision. This is why medical sensor designs routinely last a decade or more, and why biosensing innovation is dominated by companies that understand the submission pathway rather than by companies with the best transducer.
Metering: where regulation creates volume rather than protecting incumbents
Gas, water, heat and electricity meters sold for billing must be type-approved — the Measuring Instruments Directive in Europe, NIST Handbook 44 and state weights-and-measures regimes in the United States, and equivalent national schemes elsewhere. Unlike automotive certification, metering regulation actively creates demand: grid digitalisation, loss-reduction mandates and time-of-use tariffs all require certified measurement at the edge, which converts a regulatory requirement into a sensor volume driver. It is the most under-appreciated demand source in this market.
Environmental and safety rules
Refrigerant transition rules in Europe and North America are pulling gas sensors into HVAC systems that previously needed none, because flammable refrigerants require leak detection. Methane regulation is doing the same in oil and gas. Building ventilation standards are adding carbon-dioxide and particulate sensing to commercial real estate at scale. None of these is a semiconductor rule, and all of them are sensor demand.
Cyber and IoT rules: a compliance cost that favours incumbents
Security regulation is arriving at the device layer. European cyber resilience obligations and US IoT labelling schemes both push authentication and update capability down into the node, which means the sensor must carry identity and be updatable. For a supplier whose parts are already certified, that is an engineering task; for a new entrant it is another gate. Like every other rule in this chapter, its effect is to raise the fixed cost of being a supplier and to protect whoever has already paid it.
Export control: equipment, not devices
Sensor products sit largely outside the semiconductor export-control perimeter that governs advanced logic and memory. The exposure that does exist sits at the manufacturing layer — equipment and certain high-performance imaging or inertial devices — which means controls show up as a capex and lead-time risk for anyone building capacity, rather than as a market access risk for anyone selling parts.
Net effect on the forecast
Regulation is why the base case assumes a rising share of value sits with certified suppliers and why the conservative case is about price rather than volume. Rules of this density do not reduce demand for sensors; they reduce the number of companies able to supply them into the applications that pay. The forecast’s 7.04 per cent compound growth is, in an important sense, a regulatory number: it is what a market grows when entry is expensive and substitution is slow.