
Global Fuel Card & Fleet Payment Solutions Market Size, Share & Forecast 2026–2033
Market Forecast Snapshot
| Parameter | Value |
|---|---|
| Base year | 2025 |
| Base year market size (fee and service revenue) | USD 9.40 billion |
| Forecast period | 2026–2033 |
| Forecast market size (2033) | USD 18.35 billion |
| CAGR, 2026–2033 | 8.72% |
| Base year volume | 65.75 million active cards |
| Forecast volume (2033) | 103.20 million active cards |
| Volume CAGR, 2026–2033 | 5.80% |
| Revenue per active card | USD 142.97 (2025) rising to USD 177.81 (2033), +24.37% |
| Currency and denomination | US dollars, nominal, constant 2025 average exchange rate |
| Coverage | Global — Europe, North America, rest of world |
| Perimeter | Issuer and platform fee revenue retained; excludes fuel and electricity sold, toll pass-through and telematics subscriptions |
Market Size & Forecast
This report sizes one thing and refuses to size three others: the revenue that issuers and platforms retain for settling a fleet's energy purchases. That means the service fee charged per transaction, the margin between the buy rate agreed with the merchant and the sell rate charged to the fleet, subscription and reporting charges, and the roaming margin earned on public charging. On that perimeter the global market was worth USD 9.40 billion in 2025 and reaches USD 18.35 billion in 2033, an 8.72% CAGR.
The card base behind that revenue grows more slowly: 65.75 million active cards in 2025 to 103.20 million in 2033, a CAGR of 5.80%. Revenue per active card therefore rises from USD 142.97 to USD 177.81 — 24.37% across eight years. That divergence is the report's central claim and it is arithmetic rather than assertion: an electrified van charges several times a week where a diesel van refuels once, so the transaction count per vehicle rises while the litres behind it collapse. A card paid per transaction gains from the first and loses on the second.
The perimeter question, settled
The category is normally sized on throughput, which is a pass-through rather than a revenue line. The gap between the two is large enough to make every comparison across competing estimates meaningless. DKV Mobility — Europe's largest brand-independent network — reported 2024 revenue of €839 million against transaction volume of approximately €19.4 billion. That is a gross take of 4.32%. On the throughput view the company is a €19.4 billion business; on the revenue view it is an €839 million one. Both statements are true and only the second is a market.
The same discipline applies at company level. Eurowag reported 2024 net revenue of €292.5 million, up 14.0%, serving 302,076 active trucks, up 10.0%. Revenue per active truck was €968.3, against €933.7 in 2023 — a rise of 3.71%. Growth came from adding trucks, not from earning more per truck. Any model that projects a fuel card business at its revenue growth rate is therefore projecting customer acquisition, not pricing power.
Three pools, three unit economics
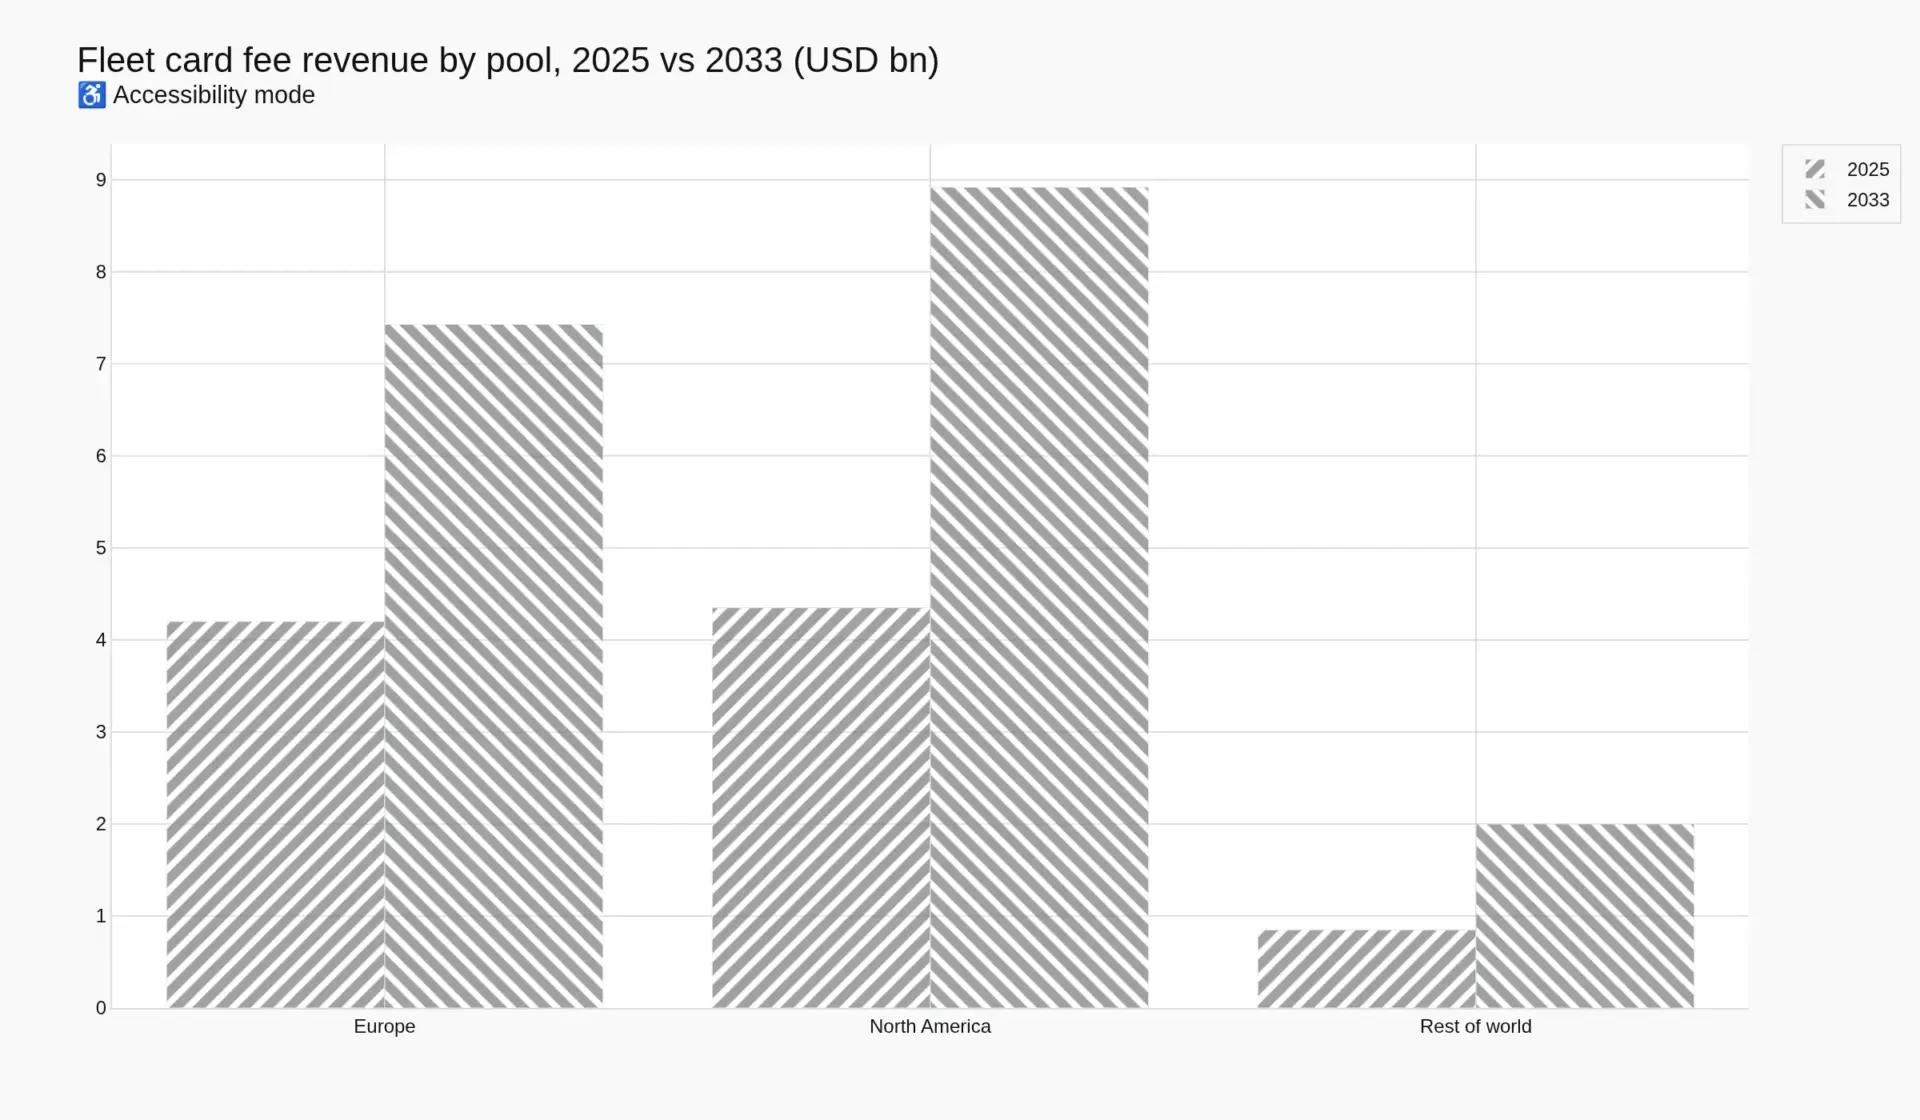
The global figure aggregates three regions with almost no shared economics. Europe is truck-centric: few cards, high value per card, and a product defined by cross-border tax recovery. North America is small-business-centric: many cards, low value per card, and a product defined by merchant acceptance and credit. The rest of the world is nascent, priced on transaction volume and frequently bundled with telematics or banking.
| Pool | 2025 value (USD bn) | 2033 value (USD bn) | CAGR | Active cards 2025 (m) | Active cards 2033 (m) | Revenue per card 2025 | Revenue per card 2033 |
|---|---|---|---|---|---|---|---|
| Europe | 4.20 | 7.43 | 7.39% | 12.35 | 15.90 | USD 340.08 | USD 467.30 |
| North America | 4.35 | 8.92 | 9.39% | 36.90 | 56.30 | USD 117.89 | USD 158.44 |
| Rest of world | 0.85 | 2.00 | 11.29% | 16.50 | 31.00 | USD 51.52 | USD 64.52 |
| Total | 9.40 | 18.35 | 8.72% | 65.75 | 103.20 | USD 142.97 | USD 177.81 |
Europe is 44.68% of global value on 18.8% of cards; North America is 46.28% of value on 56.1% of cards. A European card is worth 2.88 times a North American one, because it sits behind a truck crossing borders rather than a plumber's van staying inside one state. That ratio, not the headline growth rate, is the most useful single number for anyone deciding where to deploy capital in this category.
What is measured and what is modelled
The European pool is anchored on published company data: DKV Mobility's €839 million of revenue and ~394,000 active customers, Eurowag's €292.5 million of net revenue and 302,076 active trucks, and Edenred's group disclosures of €2.9 billion total revenue, €2.6 billion operating revenue and €1,265 million EBITDA at a 44.3% margin, within which Mobility is one of two lines. The oil-major proprietary cards — Shell, BP and Aral, TotalEnergies, Circle K, Q8, OMV — do not disclose card revenue separately and are estimated from acceptance-network scale and card-count disclosure.
The North American pool is the weakest number in this report and is labelled as such. It is built from disclosed issuer revenue where it exists — Corpay's group revenue of USD 3,974.6 million in 2024, up 6%, of which vehicle payments is one of three segments — and from a card-base estimate rather than a project count. Corpay's adjusted EBITDA of USD 2,129.0 million, a 53.57% margin, is a warning about how this category is read: a margin of that size is not a processing margin. It is processing plus float plus spread, and float income shrinks the moment rates fall.
Why revenue per card rises 24% while litres fall
Three mechanisms, in order of how much of the 24.37% they carry. First, transaction frequency: charging is a shorter, more frequent purchase than refuelling, and the fee is per transaction. Second, the compliance content: the record attached to each transaction carries more value in a jurisdiction that requires structured, real-time invoice data than in one that accepts a monthly statement. Third, attach: Eurowag's average products per truck rose from 2.5 to 2.7 in a single year, and each attached product is revenue that does not depend on litres at all.
The counterweight is fee compression, and it is real. Merchant rebates are funded from retail fuel margin, and retail fuel margin is exposed to price-transparency regulation and to merchant consolidation. Our forecast assumes the two forces roughly cancel through 2029 and that frequency and attach win thereafter, which is why the value CAGR of 8.72% runs 2.92 points above the volume CAGR of 5.80%.
What this perimeter excludes
Deliberately excluded: the fuel and electricity sold, which is a commodity flow rather than a market; tolling revenue collected on behalf of toll-charging authorities, which is a pass-through with a fixed agency fee; telematics hardware and subscription revenue, already sized in Pheonix's Global Fleet Management coverage at USD 25.4 billion in 2025 growing to USD 58.7 billion by 2033; and consumer credit cards used incidentally to buy fuel. The adjacent charging-infrastructure build is sized separately by Pheonix at USD 40.22 billion in 2025 rising to USD 147.28 billion by 2033 — that is the supply side of the same relationship, and the two reports should be read together.
Methodology and confidence
Value is fee and service revenue, in nominal US dollars, converted at a constant 2025 average rate. Volume is active cards in circulation, defined as a card that transacted at least once in the trailing twelve months. Regional pools are built bottom-up from disclosed issuer revenue where available, from card-count and revenue-per-card disclosure where available, and from acceptance-network scale where neither exists. Nothing in this report is taken from a syndicated market-research estimate, and no competitor sizing was used as a cross-check. Where a number is modelled rather than measured, the text says so and the Market Risk chapter names the assumption it rests on.
Companion analysis. The Fuel Card Is a Tax Document That Happens to Buy Diesel reads the German penetration data, the DKV–Aral–UTA ranking and the AFIR charging rules against the market sized here.
Table of Contents
- Market Size & Forecast
- Market Overview and Perimeter
- Value Chain
- Competitive Landscape
- Investment Activity
- Technology & Innovation
- Market Risk
- Regulatory Landscape
Competitive Landscape
Four business models, one selection criterion
Competition in this category is not between companies so much as between four structurally different ways of owning the same account.
Brand-independent network issuers — DKV Mobility, UTA (Edenred), Eurowag, Allstar (Corpay), Radius — contract with merchants across brands, earn a spread on each, and sell indifference. Oil-major proprietary cards — Shell, BP and Aral, TotalEnergies, Circle K, Q8, OMV — own the merchant margin and therefore can never be indifferent about it. Processors turned issuers — WEX, Corpay — arrive from transaction processing with scale in authorisation and a small-business distribution machine. Embedded and white-label programmes — leasing companies, OEM captive finance, banks — own the vehicle relationship and outsource everything else.
The German result that settles the argument
Dataforce’s 2025 study of German fleets is the cleanest natural experiment in the category and it points one way. 78% of German companies now use fuel cards for their company vehicles, and among operators with twenty or more vehicles penetration is above 90%. Growth is coming from fleets of up to nineteen vehicles buying their first card. Asked how they choose an issuer, buyers rank acceptance network first, transparent billing and usable analytics second, and the price of fuel third.
The ranking produced a share reversal. DKV leads, Aral is second, UTA third, and EuroShell has fallen out of the top three into fourth. EuroShell’s decline is not a service failure; it is the structural consequence of being the card of a company that also sells the fuel. A procurement department defending a fuel line to a finance director needs an issuer with no position in the price, and a brand-independent network is that.
Where the share actually sits
Issuing is fragmented and processing is not. On our sizing, the European pool of USD 4.20 billion is contested by at least a dozen issuers of scale plus dozens of regional specialists, and no single issuer is close to a majority. The two largest specialists for which revenue is disclosed are DKV at €839 million and Eurowag at €292.5 million — different in size and in customer mix, and together still a minority of the pool once Edenred’s Mobility line and the oil-major programmes are counted.
North America is more concentrated and more commoditised: two listed processors dominate, the fee per transaction is lower, and revenue per card of USD 117.89 is roughly a third of Europe’s USD 340.08. The mechanism is customer size. A European issuer serves a 40-tonne truck crossing four tax jurisdictions; a North American issuer serves a two-van contractor whose entire requirement is that the card works at the station on the corner and that the statement arrives before the month closes.
The second front: charging
Charging-card penetration is being contested by a different set of names, and the incumbent is not winning by default. In Dataforce’s German data, EnBW leads charging-card penetration at 30% and DKV sits just behind at 27% — but DKV ranks first among large fleets. Read that pairing carefully: the utility wins the small and medium accounts where the charging relationship is a household name, and the network issuer wins the large fleets where the requirement is one invoice across fuel, charge and toll.
The underlying penetration numbers suggest the front is still early. 60% of German companies running EVs hold a charging card, company-car drivers pay by card in two out of three public charging sessions, and more than 60% of company charging happens on the company’s own premises against 23% at public points. The public-charging market the card competes for is therefore a minority of the fleet’s energy, which caps the size of the prize even as it grows quickly.
Barriers, and the one that is falling
Three barriers are durable: acceptance breadth, because it is built contract by contract; tax and reporting competence, because it is a fixed cost that only scales with accounts; and credit, because it is a balance sheet. One barrier is falling — the payment itself. Contactless, wallets and in-app settlement have commoditised the act of paying, and AFIR’s ad hoc card-payment requirement at higher-power chargers makes card acceptance a legal obligation for the charge point operator rather than a commercial favour to the issuer. When acceptance is mandated, the network stops being a moat and starts being a public utility.
The competitive question for the next eight years is therefore not who has the widest network. It is who converts the network into a compliance and analytics relationship before the transaction itself becomes free. On the evidence of 2024, DKV is buying coverage and charge cards, Eurowag is buying attached products per truck, and Corpay is buying corporate-payments revenue with the cash the fleet business generates. Those are three different bets on the same question, and only one of them assumes the answer is ‘the card’.
Value Chain
Where the euro goes
A fuel card sits between four parties that never meet: the merchant who sells the litre, the network that authorises the purchase, the issuer that carries the credit and produces the document, and the fleet that consumes it. Five distinct functions are bundled into one piece of plastic, and the most common analytical error in this sector is to price the bundle as though it were one service.
Acceptance. Bilateral contracts with tens of thousands of merchants. DKV Mobility’s network reached approximately 69,000 fuel service stations, 24,000 alternative-fuel stations, 35,000 vehicle service stations and 893,000 public and semi-public EV charge points across more than 50 countries by the end of 2024. That network is the asset; the plastic is a key to it.
Authorisation. The decision, at the pump, that this card may buy this much of this product at this site right now. Real-time authorisation moved the decision to the moment of the transaction and shifted credit risk off the issuer’s book.
Credit. The issuer pays the merchant in days and collects from the fleet in thirty to forty-five. That is the balance-sheet function, it is why scale compounds, and it is why the sector’s margins move with interest rates almost as much as with volume.
Tax evidence. The categorised, vehicle-attributed, jurisdiction-decomposed record that a revenue authority accepts without a human reading it. This is the function customers rank highest and the one least visible in a fee schedule.
Settlement and analytics. The monthly statement, the cost-per-kilometre report, the driver-level exception list.
The revenue lines, in order of size
Four revenue lines, and they behave differently in a downturn. The merchant rebate — the gap between the buy rate and the sell rate — is the largest and the most exposed, because it is funded out of retail fuel margin. The service fee per transaction is the most defensible and the one electrification grows. Subscription and reporting charges are the most stable and the smallest. Float on prepayment and settlement timing is the most volatile and, in a high-rate environment, the most flattering.
The public numbers show the mix. DKV Mobility earned €839 million of revenue on €19.4 billion of transaction volume, a take of 4.32%. Eurowag earned €292.5 million of net revenue on 302,076 active trucks, which is €968.3 per truck. Corpay earned USD 3,974.6 million of revenue and USD 2,129.0 million of adjusted EBITDA — a 53.57% margin that no pure processing business achieves, because roughly half the profit is float and spread rather than fee. Eurowag, closer to a pure fee model, earned an adjusted EBITDA margin of 41.6%, down from 42.4% in 2023 and 42.8% in 2022. The twelve-point spread between the two is a reasonable estimate of what a balance sheet is worth in this category at current rates.
Where the cost sits
Network fees paid to merchants and scheme fees where the product is open-loop; credit losses on a fragmented customer base of small hauliers; customer service and dispute handling, which is transaction-volume-driven and therefore rises as electrification multiplies transaction counts; and the tax and reporting engine, which is a fixed cost and the main reason the category consolidates.
The asymmetry that governs strategy: the engine is fixed and the fee is variable, so the marginal card is much more profitable than the average one. That is precisely why DKV’s growth in Germany is coming from fleets of up to nineteen vehicles rather than from large fleets, where penetration already exceeds 90%.
Electrification inserts two parties and removes a rebate
A fuel transaction involves a merchant and an issuer. A charging transaction involves a charge point operator, a mobility service provider holding the roaming agreements, and an e-mobility provider holding the customer relationship — and the issuer is increasingly all three at once or none of them. Two consequences follow. The merchant rebate disappears, because there is no retail fuel margin at a public charger to rebate. And the roaming spread replaces it, which is a thinner, more transparent, more contested margin: AFIR has made the ad hoc price per kWh a displayed number, which puts a ceiling on the spread that can be earned on top of it.
The chain’s destination is visible in DKV’s own disclosure — 798,000 charge cards in circulation, up around 35%, against a fuel-card base that grew far more slowly. The card is being reissued into a network where the issuer neither funds the purchase nor earns the rebate. That is a smaller take on a much larger transaction count, which is exactly the trade the revenue-per-card arithmetic is already pricing.
Investment Activity
What the cash is being spent on
The 2024 disclosures across four issuers describe four different capital allocations, and the pattern is more informative than any single deal.
Corpay deployed over USD 2.5 billion in 2024, acquiring two Corporate Payments companies, repurchasing USD 1.3 billion of its own stock, and ending the year at 2.75 times leverage. None of that M&A went into fleet. The company that owns one of the largest vehicle-payment networks in North America spent its acquisition capital in corporate payments, where the growth rate and the multiple are both higher. That is the clearest available statement that fleet payments is being treated as a cash-generative base rather than a growth engine.
Edenred reported 2024 net profit of €507 million, funds from operations of €870 million, up 19.2%, and EBITDA of €1,265 million at a 44.3% margin — then proposed a dividend of €1.21 per share, up 10% and ran a €300 million buyback in the year, extending the programme by up to a further €300 million over three years. Earnings per share reached €2.07 against €1.71. Capital return is large relative to acquisition activity, the signature of a business whose growth is bought in small bolt-ons and returned otherwise.
Eurowag is at the other end of the cycle: after several years of heavy M&A and capital expenditure it deleveraged to 2.3 times net debt to EBITDA and is now spending on integration — a single front-end, an integrated back office, an SAP build and a data lake, with the platform rollout beginning in September 2024 and fleet-management and navigation customers migrating onto it. Adjusted cash EBITDA was €88.7 million, up 23.2%, while profit before tax was €11.7 million after a €39.3 million loss in 2023. The gap between cash EBITDA and statutory profit is the amortisation of everything it bought.
DKV Mobility is spending on coverage rather than on companies: 893,000 charge points, up 41%, 798,000 charge cards, up around 35%, and access to more than 2,600 HVO100 stations in 15 countries. This is network capex accounted for as commercial agreements rather than as assets — the cheapest of the four strategies to fund, and the easiest to lose if a competitor out-contracts it.
The metric management is now optimising
Eurowag’s key performance indicators have moved from trucks to products. Average products per truck rose from 2.5 to 2.7 in 2024, and management presents the platform build as the mechanism. The reason is arithmetic: a truck with one product is priced by the market for that product, and a truck with three is priced by the relationship. In a category where revenue per unit barely moves — Eurowag’s own revenue per active truck rose 3.71% while net revenue rose 14.0% — attach is the only lever that does not require winning more customers.
What a buyer is paying for
Three things, in ascending order of what actually drives the multiple. The card base, which is a count and easily benchmarked. The revenue per card, which is the take and distinguishes a good book from a large one. And the share of revenue that does not depend on litres — subscription, analytics, tolling, charging margin — the only line that survives the transition intact.
The valuation tension is straightforward and unresolved. A business whose revenue is transactions multiplied by a fee deserves a payments multiple. A business whose revenue is basis points on a commodity volume deserves a distribution multiple, and a declining one. Most companies in this report are, on current disclosure, still the second while describing themselves as the first. The re-rating happens when the disclosure changes: transactions per vehicle and revenue per transaction, published together, against a stated card base. No issuer currently publishes all three, and that absence is the most valuable piece of diligence a buyer can ask for.
Where the next capital goes
Three destinations are already visible. Charging-roaming consolidation, because the roaming layer is sub-scale everywhere except in a handful of networks. Tax and e-invoicing capability, because the VAT in the Digital Age package converts a fixed cost into a licence to operate. And small-fleet distribution, because the German data shows the unpenetrated segment is the one- to nineteen-vehicle operator and reaching it requires a channel rather than a sales force.
Technology & Innovation
The card is a data product with a payment attached
Nothing in this category changes because the payment changes. It changes when the data attached to the payment changes, and four technical shifts are currently doing that work.
Authorisation, from offline to at-the-pump
The original fuel card authorised offline against a prompt limit and reconciled afterwards, which is why the category was historically a credit business with a fraud problem. Real-time authorisation moved the decision to the moment of the transaction and shifted credit risk off the issuer’s book. The next step is odometer capture at the pump: the vehicle or the merchant reports mileage with the fill, and the mileage becomes the basis for benefit-in-kind reporting, mileage reimbursement, toll reconciliation and predictive maintenance. The pump is the cheapest sensor network a fleet has, and the issuer that owns the pump record owns the mileage record.
Open loop versus closed loop
Open-loop acceptance — an EMV card that works anywhere — is cheaper to distribute and narrower in what it captures, because a general-purpose merchant does not know which vehicle bought the fuel. Closed-loop proprietary networks survive not because they pay better but because they capture more: vehicle identity, product type, odometer, site. The competitive pressure is therefore not from contactless payment, which competes on the act of paying, but from any system that captures vehicle-level data at lower cost. That is precisely what an electric vehicle does natively.
Charging: OCPI, OCPP, and the thing that actually threatens the card
Two protocols do the plumbing. OCPP connects a charger to its operator’s back end; OCPI connects operators to roaming platforms, carrying tariff and session data between them. Together they make a charge session billable across parties that never contracted with each other, which is how a fuel-card issuer can reach 893,000 charge points without owning one.
The threat sits above the protocols. Plug & Charge under ISO 15118 authenticates the vehicle to the charger using a contract certificate installed at or after manufacture. No card is presented, no app is opened, and the billing relationship is the certificate’s issuer. If a vehicle OEM holds the contract certificate, the fleet’s energy purchasing relationship runs through the manufacturer and the fuel card becomes one optional settlement rail among several. This is the only technology in the category that can remove the issuer from the transaction entirely, and it is being deployed now in premium vehicles.
The counter-argument is the one the market is currently testing: Plug & Charge solves authentication, not reconciliation. The fleet still needs one invoice across diesel, electricity, tolls and vehicle services in four countries, and the OEM cannot produce it. That is why the card survives the protocol, and why it has to become a compliance product rather than a payment product.
AFIR standardises the unit, not the tariff
Regulation (EU) 2023/1804 requires the ad hoc price at publicly accessible recharging points of 50 kW or more to be based on the price per kWh and to be shown at the point. That is a genuine improvement: it makes the walk-up price comparable in the unit a fuel card already reconciles. It does not standardise the tariff. Roaming spreads, session fees, idle fees and subscription tiers sit on top of a price that is now legible, which means the customer can finally see what the issuer’s margin is. Transparency of this kind historically compresses the spread, then consolidates the intermediaries.
E-invoicing as the new interface
The most consequential technical change is not in the vehicle at all. Under the EU’s VAT in the Digital Age package, structured e-invoicing becomes the interface between merchant and customer, and digital reporting becomes real-time for cross-border business-to-business transactions from 1 July 2030. Two readings are possible and both are being invested in. In the first, the issuer becomes the fleet’s e-invoicing agent, consuming merchant invoices, validating them and producing the return — a larger, stickier, more defensible product than a card. In the second, the merchant invoices the fleet directly in a structured format and the aggregation layer that justified the fee disappears.
Which prevails depends on a detail the regulation does not settle: whether a fuel merchant can practically issue and transmit a conforming structured invoice for a €60 fill at 02:00, tens of thousands of times a day, across borders. That is an engineering problem with a per-transaction cost, and it is the same problem the fuel card solved in 1970 by batching it. The technology has changed; the economic problem has not.
Where innovation is not happening
Fee schedules are still opaque, per-transaction pricing is still rarely published, and no issuer in this report discloses transactions per vehicle and revenue per transaction together. The category’s most valuable innovation would be disclosure, and its absence is why every estimate of this market — including the one in this report — has to be constructed rather than read.
Market Risk
The five risks that matter, ranked
1. Volume decay that is already visible. Revenue is split between a basis-point margin on litres and a fee per transaction. Electrification attacks the first and feeds the second, and the two do not cancel at the same speed. The measured evidence is Eurowag: net revenue rose 14.0% in 2024 while revenue per active truck rose 3.71%, and adjusted EBITDA margin fell from 42.8% in 2022 to 42.4% in 2023 to 41.6% in 2024. A card base growing at ten per cent produced margin compression of 1.2 points in two years. That is what the transition looks like from inside a well-run issuer.
2. Fee compression from the funder’s side. The merchant rebate is funded out of retail fuel margin. Fuel retail is consolidating, motorway sites carry structural cost disadvantages, and price-transparency obligations are extending from charging to fuel. A card issuer is a price-taker on a margin it does not set, which is why every issuer in this report is trying to raise the share of revenue that is subscription or software.
3. Credit, on a fragile customer base. The issuer funds thirty to forty-five days between paying the merchant and collecting from the fleet. Eurowag’s own chairman described 2024 as a year in which a slowdown in freight demand, lower production rates and rising costs led to a peak of insolvencies, in an industry where around 90% of businesses are small or medium-sized. A card book is a concentrated bet on the solvency of the smallest operators in the economy, and the loss given default is a full fill plus fee, not a residual balance.
4. Fuel price, as a revenue line. Corpay’s own 2025 outlook names unfavourable movements in fuel prices as a headwind to earnings. That is unusual disclosure and it says something structural: when revenue includes basis points on the price of the product, a falling oil price is a revenue cut that no volume increase offsets in the same period. Float income moves the same way.
5. Disintermediation, from two directions. Upstream, Plug & Charge under ISO 15118 lets a vehicle authenticate itself against a contract certificate, removing the card from the transaction. Downstream, structured e-invoicing under ViDA makes the merchant-to-fleet invoice a real-time data flow, removing the need for an aggregator to reconstruct it. Either one, at scale, converts the issuer from a party to the transaction into an optional convenience.
The assumption this forecast rests on
The number to attack is 24.37% — the modelled rise in revenue per active card between 2025 and 2033, from USD 142.97 to USD 177.81. It requires three things to hold at once: that the per-transaction fee is not competed to zero; that transaction frequency per vehicle rises at least as fast as litres per vehicle fall; and that attach across analytics, tolling and compliance lifts the non-litre share of revenue from roughly a fifth to roughly a third. If the first fails, the value CAGR of 8.72% collapses toward the volume CAGR of 5.80% and the 2033 figure is closer to USD 14 billion. If only the third fails, it is around USD 16 billion.
Risks that are overstated
Two commonly cited risks do not survive the evidence. The first is that apps replace cards. In Dataforce’s German data, company drivers pay by card in two out of three public charging sessions and by app in one, and 53% of fleet managers rate electricity price transparency as very important — a higher share than for fuel. Walk-up card payment is being mandated by regulation at higher-power points, not displaced by apps. The second is that consolidation eliminates the specialist. The German ranking shows the opposite: the specialist gained and the oil-major card lost, in the same market, in the same year, on the same buyer preference for neutrality.
The concentration risk nobody prices
Germany is the largest single pool in Europe and the source of most published penetration data. A market whose visible evidence is one country’s survey, and whose largest players are two German-heritage networks and one Czech-listed specialist, is more exposed to a single regulatory or macroeconomic event than its global headline suggests. The geographic diversification in this forecast comes mostly from North American small-fleet growth and from rest-of-world transaction volume, neither of which is as well evidenced as the European pool.
Regulatory Landscape
The regulation that made the product
A fuel card exists, in its European form, because recovering value-added tax on fuel bought in another member state requires documentary evidence that a finance department cannot assemble by hand. Under Directive 2008/9/EC the refund claim is an electronic return filed by 30 September of the year following the purchases, supported by invoices meeting the content requirements of the VAT Directive. For a van refuelled forty times across three countries, the expensive part is not the return — it is the forty documents, each of which must name the vehicle, the product, the rate and the customer.
That is the product. Not payment. The card manufactures the document set at the moment of sale, and every regulatory change since has either widened that requirement or threatened to make it universal.
VAT in the Digital Age: the decisive change
The ViDA package was adopted on 11 March 2025, entered into force 14 April 2025, and was published in the Official Journal on 25 March 2025 as Directive (EU) 2025/516, Regulation (EU) 2025/517 and Implementing Regulation (EU) 2025/518. Its timetable matters more to this market than any other regulation in force:
- From entry into force, member states may introduce mandatory e-invoicing under specified conditions.
- From 1 July 2030, digital reporting requirements apply to cross-border business-to-business transactions, built on structured e-invoicing.
- By 1 January 2035, member states operating domestic real-time transaction reporting must align their systems with the EU model and standards.
The Commission’s stated rationale is fraud: it estimates the package can reduce VAT fraud by up to €11 billion a year and cut compliance costs for EU traders by more than €4.1 billion a year over ten years. Both numbers are about the state and the merchant, not about the intermediary — and that is the point. When every cross-border business-to-business supply carries a structured, reported invoice, the record stops being scarce. The issuer’s product becomes either the agent that operates the requirement for a fleet too small to do it itself, or nothing.
The German sequencing shows how fast this arrives in the largest national pool: receipt of structured electronic invoices became mandatory in January 2025, with issuance obligations phased across 2027 and 2028. Every German issuer is therefore rebuilding its data layer now, whether or not it has said so.
AFIR: the price becomes a legible number
Regulation (EU) 2023/1804, Article 5(4), requires that at publicly accessible recharging points of 50 kW or more the ad hoc price be based on the price per kWh delivered and be shown at the point — visibly present on a screen or a sticker, with a website reference insufficient above that threshold. Below 50 kW the price may merely be made available, which a QR code satisfies. An occupancy fee per minute is permitted, but only to discourage long occupancy. All publicly accessible points had to be digitally connected by October 2024, and ad hoc card payment at higher-power points is being phased in across 2027 and 2028.
Three consequences for issuers. The unit of settlement is now legally the kilowatt-hour, which aligns charging with the way a fuel card already reconciles litres. Card acceptance at higher-power points becomes an obligation on the operator rather than a commercial negotiation with the network, which erodes acceptance breadth as a moat. And a displayed price caps the roaming spread, because the customer can now compare the walk-up price with the price their card charged them.
Tolling and the multi-service invoice
The European Electronic Toll Service framework under Directive (EU) 2019/520 pushed tolling towards interoperable on-board units and a single contract across member states, and the card networks moved with it: a fleet now expects toll, fuel, charge and vehicle services on one statement. That bundling is the strongest regulatory tailwind the category has, because it makes the invoice — not the payment — the unit of competition.
Competition law is now part of the landscape
Edenred’s 2024 accounts carry the French competition authority’s €158 million fine, recognised in 2023, on the same page as record earnings. A category whose product is a fee on a necessary input, sold to businesses whose alternative is a different card, attracts that kind of attention. The practical implication is that merchant rebate structures and multi-year exclusivity are the parts of the model most exposed to challenge — another reason the strategic direction of travel is towards disclosed, subscription-priced services and away from opaque spreads.
What is not regulated, and should be watched
Nothing in EU law requires an issuer to disclose its transaction fee, its roaming spread, or its revenue per card. AFIR has made the price of electricity visible at the point of sale; no equivalent obligation exists for the price of the card that pays for it. The first jurisdiction to require that disclosure will change the competitive dynamics of this market more than any of the regulations above, because it would make the 24.37% revenue-per-card assumption in every forecast — including this one — independently checkable.