
Global Used Semiconductor Equipment Market Report, Size, Share and Forecast 2026–2033
Global Used Semiconductor Equipment Market Overview
The used semiconductor equipment market is the trade in tools that have already been installed in a fab and are sold on — either refurbished to a defined performance baseline with a warranty, or sold as-is to a buyer who accepts the condition risk. It is a market for second ownership, and its unit of account is a decommissioned stepper or etcher rather than a chip.
On a transaction-only perimeter the market was worth USD 4.46 billion in 2025 and reaches USD 8.17 billion in 2033, a 7.86 per cent CAGR and USD 3.71 billion of added value. The 2025 figure is the midpoint of two independent published estimates — USD 4.36bn from QY Research and USD 4.55bn from The Business Research Company — which agree to within 4.5 per cent. Everything below is built on that anchor.
The market exists because the semiconductor industry has two speeds. Leading-edge logic at 2nm gate-all-around cannot be served by pre-owned tools: a used EUV scanner is not a thing you can buy, and ASML's own refurbishment lines handle only the classic PAS 5500 and the earlier TWINSCAN XT and NXT DUV platforms, with a lifetime-extension programme supported through 2035 and beyond. But the devices that fill cars, power supplies, industrial drives and IoT nodes are built on 200mm and mature 300mm capacity, where a twenty-year-old tool with a documented service history does the same job as a new one at a fraction of the price. SEMI tracks more than 348 fabs and production lines at 200mm, and expects 16 new high-volume 200mm fabs to begin operations from 2026, taking the total to 227. Every one of those fabs is a candidate buyer in this market.
The economics turn on the discount. Secondary equipment sells for anywhere from 20 to 30 per cent of the new-tool price for older, uncertain-provenance systems up to a tighter 70 to 80 per cent for recent, well-documented tools — a spread first documented by Semiconductor Digest and broadly unchanged since. SurplusGLOBAL, the largest independent dealer, puts tools above 130nm at 50 to 60 per cent of the new-equipment price. The used market is therefore not a separate cycle: it is a price taker on the new-equipment index. When new tool prices and lead times rise, the used alternative becomes worth more even if the same number of machines changes hands.
That has an arithmetic consequence most commentary misses. Measured against SEMI's USD 135.1 billion of worldwide semiconductor manufacturing equipment sales in 2025, this market is 3.30 per cent of the primary market — at the bottom of the widely quoted "5 to 10 per cent of the primary market" rule of thumb. By 2028, when SEMI forecasts total equipment sales of USD 229.5 billion against this report's USD 5.59 billion of used transactions, the ratio falls to 2.44 per cent. The secondary market's share of the industry's capital spend is compressing, not expanding, precisely because the leading edge is booming and leading-edge tools cannot be re-used.
Three published numbers, one market: the perimeter problem
Any figure for this market is a definition, not a measurement. The published estimates for roughly the same year differ by a factor of two, and the difference is perimeter rather than error.
| Source | Value | What it counts |
|---|---|---|
| QY Research (June 2026) | USD 4.36bn in 2025; USD 6.86bn by 2032; 7.4% CAGR | Tools reintroduced to production after refurbishment — transaction value only, no service or spares |
| The Business Research Company | USD 4.55bn in 2025; USD 9.56bn by 2030; 16% CAGR; USD 19.08bn by 2035 | Same transaction perimeter, far more aggressive growth assumption |
| Caladan (broker, May 2026) | USD 6.2bn annualised in H1 2026, from ~USD 5.1bn in 2024 | Gross transaction volume including listings and as-is disposals; a marketplace's own book, not a census |
| SurplusGLOBAL (press interview) | ~USD 3.0bn annually | Dealer and fab-to-fab trading, older vintage |
| Moov / EE Times rule of thumb | 5–10% of the primary equipment market | Mixed perimeter, historically including spares and service |
| EE Times, 2011 | USD 6.0bn, ~13% of total equipment sales | Historic peak-vintage reading; shows how much the definition has drifted |
Three things follow. First, the two independent research houses cluster tightly at USD 4.4–4.6 billion for 2025, which is why this report anchors there. Second, the 16 per cent path implies a USD 19 billion market by 2035 — a physical claim as much as a financial one, since it would require roughly a fourfold increase in the value of tools changing hands inside a decade. Third, the "5 to 10 per cent of primary" rule is an artefact of perimeters that bundled spares, service and consumables into the used figure; on a transaction-only basis the true ratio is nearer 3 per cent, and falling.
Year-by-year forecast, 2025–2033
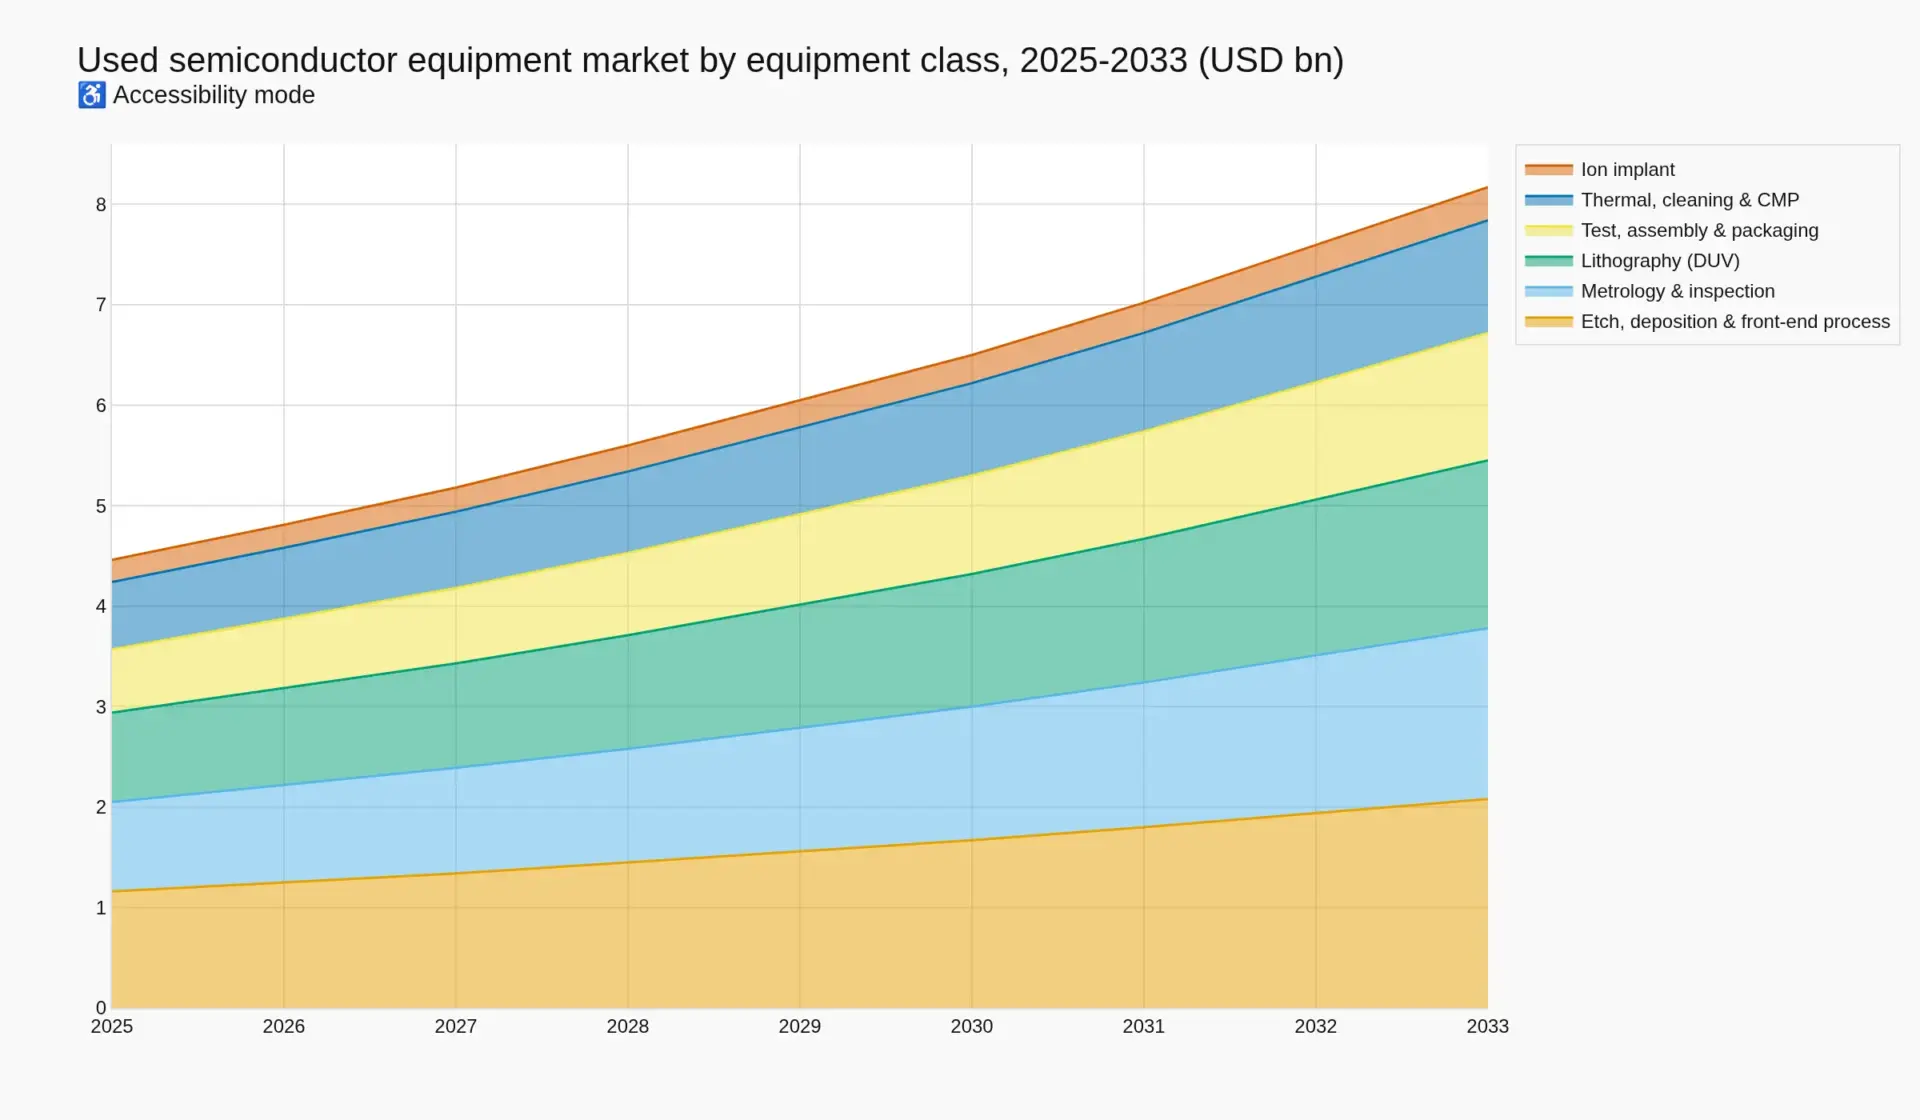
Each equipment class compounds at its own rate; the total is their sum, so no headline growth rate is asserted independently of the parts. No unit series is published for this market — the sources report transaction value, and nothing in the record supports a defensible tool count. See the method note.
| Equipment class (USD bn) | 2025 | 2026 | 2027 | 2028 | 2029 | 2030 | 2031 | 2032 | 2033 | CAGR | Share of growth |
|---|---|---|---|---|---|---|---|---|---|---|---|
| Etch, deposition & front-end process | 1.16 | 1.25 | 1.34 | 1.45 | 1.56 | 1.67 | 1.80 | 1.94 | 2.08 | 7.6% | 24.9% |
| Metrology & inspection | 0.89 | 0.97 | 1.05 | 1.13 | 1.23 | 1.33 | 1.44 | 1.57 | 1.70 | 8.4% | 21.8% |
| Lithography (DUV) | 0.89 | 0.96 | 1.04 | 1.13 | 1.22 | 1.32 | 1.43 | 1.55 | 1.67 | 8.2% | 21.1% |
| Test, assembly & packaging | 0.63 | 0.69 | 0.75 | 0.82 | 0.90 | 0.98 | 1.07 | 1.17 | 1.27 | 9.2% | 17.4% |
| Thermal, cleaning & CMP | 0.67 | 0.71 | 0.76 | 0.81 | 0.87 | 0.92 | 0.98 | 1.05 | 1.12 | 6.6% | 12.1% |
| Ion implant | 0.22 | 0.23 | 0.24 | 0.26 | 0.27 | 0.28 | 0.30 | 0.31 | 0.33 | 5.0% | 2.8% |
| Total | 4.46 | 4.81 | 5.19 | 5.59 | 6.03 | 6.51 | 7.02 | 7.57 | 8.17 | 7.86% | +3.71 |
Regional structure, 2025
| Region | 2025 (USD bn) | Share | 2033 (USD bn) | CAGR |
|---|---|---|---|---|
| China | 1.82 | 40.8% | 3.55 | 8.7% |
| Taiwan & South Korea | 0.87 | 19.5% | 1.54 | 7.4% |
| North America | 0.62 | 13.9% | 1.06 | 6.9% |
| Europe | 0.36 | 8.1% | 0.60 | 6.5% |
| Japan | 0.24 | 5.4% | 0.37 | 5.6% |
| Rest of Asia Pacific & rest of world | 0.55 | 12.3% | 1.06 | 8.5% |
| Total | 4.46 | 100.0% | 8.18 | 7.86% |
China is 40.8 per cent of the world market — above its 37 per cent share of the primary equipment market in the first three quarters of 2025, as reported by SEMI, and consistent with Caladan's estimate that Chinese buyers absorbed about USD 1.8 billion of available used inventory, paying 15 to 25 per cent premiums. Regional rows sum to USD 8.18bn against the model's USD 8.17bn total; the 0.01 gap is display rounding, not a separate adjustment.
Scenarios
Conservative USD 7.38bn (6.5% CAGR: supply stays locked, mature-node capex rolls over and the November 2026 control cliff binds). Base USD 8.17bn (7.86%). Optimistic USD 9.77bn (10.3%: China's parallel procurement persists through the full window, back-end re-use accelerates, and the dealer layer regains margin). The base-to-conservative gap is USD 0.79bn; base-to-optimistic is USD 1.60bn.
What this report covers
- Competitive landscape — why the largest used-equipment business in the world is an OEM's buyback desk, and what the leading dealer's own accounts say about the rest
- Value chain — supply, refurbishment and the parts-and-software gate where the margin actually accrues
- Investment activity — working capital, not fixed capital; marketplaces, refurb factories and inventory finance
- Technology innovation — what can be remanufactured, what cannot, and why lithography optics are the exception
- Market risk — six ranked, led by a dated regulatory cliff rather than a market variable
- Regulatory landscape — a used tool crossing a border is a new export event, and it is licensed as one
- Method note — perimeter, anchors, what is modelled and what is not
Table of Contents
- Market overview — definition, perimeter and the USD 4.46 billion (2025) anchor
- Three published numbers, one market — why USD 4.36bn (QY Research) and USD 4.55bn (The Business Research Company) bracket the answer, and why USD 6.2bn is a different measurement
- Year-by-year forecast, 2025–2033 — six equipment classes compounding from USD 4.46bn to USD 8.17bn at 7.86%
- Regional structure, 2025 — China 40.8%, Taiwan and South Korea 19.5%, North America 13.9%, Europe 8.1%, Japan 5.4%, rest of world 12.3%
- Scenarios — USD 7.38bn conservative, USD 8.17bn base, USD 9.77bn optimistic
- Competitive landscape — four channels, and why the largest used-equipment business in the world is ASML’s buyback desk rather than a dealer
- Value chain — five sources of supply, what a certified rebuild actually is, and the parts-and-software gate where margin accrues
- Investment activity — working capital rather than fixed capital; refurbishment factories, marketplaces and Chinese inventory absorption
- Technology innovation — what can be remanufactured, what cannot, and why lithography optics are the exception
- Market risk — six risks ranked, led by the dated control cliff of 10 November 2026
- Regulatory landscape — a used tool crossing a border is a new export, and it is licensed as one
- Method note — perimeter, anchors, modelled splits and known gaps
Competitive Landscape
Competitive Landscape
This market looks like a dealership business and is usually described as one. It is not. There are four layers, and only one of them is a broker.
Layer one: the OEM certified programmes. These own the top of the value ladder because refurbishment to a documented performance baseline requires OEM software, calibration files and matched spare parts. ASML has run an installed-base extension team since 1997, buying back classic PAS 5500 steppers and scanners, and latterly early TWINSCAN XT and NXT DUV systems. Systems are fully disassembled into modules in refurbishment factories in Taiwan and the Netherlands, cleaned, inspected, repaired and reassembled to original specification with a new warranty; TWINSCAN work follows a configuration-driven procedure that restores tools to an agreed baseline. The PAS 5500 lifetime-extension programme is supported through 2035 and beyond. KLA Pro Systems offers certified and remanufactured 150mm and 200mm inspection and metrology tools plus performance enhancements and 200/300mm adaptable platforms. Tokyo Electron runs a Certified Used Equipment platform covering audited tools, refurbishment, software updates and field support.
Layer two: independent dealers and marketplaces. SurplusGLOBAL (KOSDAQ: 140070) is the largest listed pure-play, with roughly 1,100 tools across three warehouses and named trading relationships with Samsung, SK Hynix, Intel, DB HiTek, TSMC and SMIC. Moov operates a real-time digital marketplace that carried more than USD 3 billion of active listings by 2023. Caladan and a long tail of regional brokers fill out the layer.
Layer three: direct fab-to-fab transfer. One manufacturer sells a line to another, often with process transfer included. In a Moov survey, 57 per cent of 80 respondents said they would sell idle equipment to another fab; the reason they often do not is the same reason the dealer layer exists at all — 81 per cent of 176 respondents named reliability as the top barrier to buying second-hand tools.
Layer four: liquidation. Fab closures and bankruptcy auctions, where price discovery is public and brutal.
The largest used-equipment business in the world is not a dealer
The single most-quoted structural claim in this market is SurplusGLOBAL’s own: that it holds 20 per cent of the world’s used semiconductor equipment. Its audited accounts do not support a market that small.
| SurplusGLOBAL, KRW bn | 2023 | 2024 | 2025 | TTM to Jun 2026 |
|---|---|---|---|---|
| Revenue | 166.03 | 251.62 | 208.41 | 180.10 |
| Growth | — | +51.55% | −17.17% | −23.59% |
| Gross profit | — | 43.46 | 22.92 | — |
| Gross margin | — | 17.27% | 11.00% | — |
| Selling, general & administrative | — | 29.30 | 34.62 | — |
| Operating profit / (loss) | — | 14.16 | (11.70) | — |
Those are the numbers. Group revenue of KRW 208.41bn in 2025 converts to about USD 151 million at roughly KRW 1,380 to the dollar — 3.39 per cent of a USD 4.46 billion market. Strip out the KRW 24.22bn of “other” revenue and the merchandise line that carries actual tool sales is KRW 182.97bn, or USD 132.6 million — 2.97 per cent. For a 20 per cent share to be true, the entire world market would have to be USD 755 million, about a sixth of the smallest published estimate for 2025.
The claim can only be about something narrower than the market — Korean dealer activity, or share of listings rather than share of completed transactions. What it cannot be is share of the USD 4.5 billion that changes hands globally.
That single reconciliation redraws the landscape. The largest independent dealer in the world is a 3 per cent participant. The certified OEM programmes are larger, because ASML’s buyback operation is not a dealer competing for those surplus tools — it is the manufacturer of the tools buying its own installed base back, pricing against a new-build alternative it also sells. No independent participant in this market is above single digits, and three OEMs have a verified public certified-remanufactured programme. The market is fragmented below a concentrated top.
And the direction is worse than the level
SurplusGLOBAL’s revenue fell 17.17 per cent in 2025 — the year worldwide equipment sales rose 15 per cent to a record USD 135.1 billion, and the year in which published research had this market growing 7.4 to 16 per cent. Gross margin fell from 17.27 to 11.00 per cent while selling and administrative costs rose from KRW 29.30bn to KRW 34.62bn, producing an operating loss of KRW 11.70bn against a KRW 14.16bn profit the year before.
A dealer that cannot cover its own overhead in a record equipment year is telling you what this market actually is at the dealer layer: a residual, supply-constrained, spread-narrowing business, not an annuity. The 2024 figure (+51.55 per cent) followed by 2025 (−17.17 per cent) is not a growth curve with a wobble. It is a liquidity cycle.
What competition is actually for
In most markets firms compete for customers. Here the buyers are identifiable and few — the fabs expanding mature nodes — and what is scarce is the tool. So the competitive variables are upstream: how fast a line can be decommissioned and taken down before a node transition, whether the provenance file is complete enough to obtain an export licence, whether the buyer can get OEM parts and a software licence, and how long inventory can be carried. The dealers with the best sourcing relationships and the strongest repair capability win; the ones with the best sales organisation do not.
This is also why the certified tier keeps taking share at the top of the value ladder. A used lithography scanner without OEM optical re-certification is a different asset from one with it, and only ASML can supply the second.
Value Chain
Value Chain
The chain runs from a fab that wants a tool gone to a fab that wants a tool cheap. Every cost and every margin sits between those two points.
Supply: where tools come from
There are five sources, and they do not behave alike.
- Node transition. A fab retires a 28nm line to make room for 14nm; the tools are intact, documented and instantly re-deployable. This is the best supply in the market — and it is the most price-sensitive, because the seller knows what it has.
- Memory capex cycles. Samsung and SK Hynix are the largest single source of trailing-edge tooling. Caladan expects memory pricing to recover in Q3–Q4 2026, and notes the consequence plainly: recovery reduces equipment retirements. Supply is counter-cyclical to the market that consumes it.
- Fab closure and consolidation. Lumpy, unpredictable, and usually auctioned.
- OEM buyback. ASML’s installed-base extension teams have been repurchasing PAS 5500 systems since 1997. This supply never reaches the open market — it is absorbed and re-marketed by the manufacturer.
- Liquidation. Distressed sellers, public price discovery, lowest realisation.
The supply paradox is the most important thing in this chapter. SEMI expects 200mm fab equipment spending to rise 9 per cent to USD 7.6 billion in 2026 and then fall 9 per cent in 2027, 16 per cent in 2028 and 18 per cent in 2029 — while installed 200mm capacity keeps growing, from 7.9 million wafers per month in 2026 by 2, 2 and 1 per cent in the following years. Falling new-tool spend with rising installed capacity means fabs are running what they already have and buying used to expand. Demand for used tools and supply of used tools come from the same installed base, and when utilisation is high the retirements stop. That is why supply, not demand, is the binding constraint in this market.
Refurbishment: what the service actually is
A certified refurbishment is a disassembly and rebuild, not a clean-up. ASML’s own description of its PAS process is the best specification available: systems are fully disassembled into individual modules; cleaned; inspected; repaired; reassembled into like-new machines meeting original specification; and shipped with a new warranty. TWINSCAN work follows predefined instructions, validated parts and structured build-and-test steps. QY Research’s summary of the category sets out the full requirement: tool-history tracking, spare-parts sourcing, cleanroom refurbishment, process-parameter recovery, safety compliance, FAT/SAT acceptance, software-version control and field-service capability.
Six of those eight are documentation and access, not mechanical skill. That is the structural asymmetry in this market: a competent third party can rebuild a chamber; only the OEM can supply the software version, the calibration file and the matched component. Value accrues to whoever controls the parts catalogue.
The value capture, honestly
The dealer layer’s economics are visible in the only listed set of accounts in the market, and they are thin. Gross margin 11.00 per cent in 2025 against 17.27 per cent in 2024. Selling and administrative costs of KRW 34.62 billion against gross profit of KRW 22.92 billion. An operating loss of KRW 11.70 billion.
| Chain step | What is done | Who captures the value |
|---|---|---|
| Sourcing | Relationship with the selling fab; early notice of line retirements | Dealer, as purchase discount — the only durable source of gross margin |
| Decommissioning & logistics | Cleanroom de-installation, crating, heavy freight, customs | Logistics providers; a cost centre for the dealer |
| Refurbishment | Teardown, cleaning, module replacement, software and control update | OEM programmes at the top; third-party workshops at 5–15% of tool value |
| Certification | FAT/SAT to an agreed baseline, warranty, process requalification | OEM, almost exclusively — this is the gate |
| Placement | Identification of a buyer, export licence, installation, field support | Dealer and OEM field service |
| Aftermarket | Spares, service contracts, upgrades | OEM; the adjacent service and parts pool is larger than the trading market itself |
The aftermarket row is the reason the OEM programmes exist and keep growing. By SurplusGLOBAL’s own account, the service and parts pool around this installed base is worth about USD 2 billion — roughly half the size of the entire used-tool trade, and it recurs annually. Selling a refurbished tool is a way of keeping a customer inside a parts and software annuity. That is a better business than trading, and it explains why the certified tier is where the strategic capital sits.
Working capital is the whole business
A dealer’s balance sheet is inventory. SurplusGLOBAL holds roughly 1,100 tools; each one carries holding cost, insurance, warehouse space and obsolescence risk, and the market has no index to hedge against. When the transaction cycle was 90–120 days in 2022 a dealer could charge for that carry. Caladan puts the current cycle at 45–60 days, with buyers accepting as-is equipment more often and paying premiums for immediate availability. Faster turns should help — except that shorter cycles also mean thinner spreads, which is exactly what the 17.27 to 11.00 per cent gross-margin collapse records.
So the dealer layer is caught between a supplier that will not sell cheaply and a buyer who now knows the market. That is a structurally uncomfortable place to stand, and it is why the report’s base case grows at 7.86 per cent rather than the 16 per cent one published estimate implies.
Investment Activity
Investment Activity
Capital in this market is not plant. It is inventory, and the returns are a function of turns and spread. That single fact explains almost every capital decision in the sector.
Where the money actually goes
One: inventory. The balance sheet is the product. A dealer that buys a fab’s retired line takes the whole line, including tools it does not want, because that is how supply is secured. SurplusGLOBAL’s roughly 1,100 tools across three warehouses is a working-capital position of real size, financed by equity, listings and trade credit rather than by project debt.
Two: refurbishment capacity. This is the only genuinely capex-heavy activity in the chain, and it is being built by OEMs rather than dealers. ASML’s refurbishment factories in Taiwan and the Netherlands are physical assets with cleanrooms, tooling and process engineers, and ASML has committed to supporting the PAS 5500 platform through 2035 and beyond. KLA’s Pro Systems operation provides the same function for 150mm and 200mm inspection and metrology. This is where capital with a ten-year horizon goes.
Three: marketplace infrastructure. Digital platforms have tried to do to this market what they did to used cars. Moov built a real-time marketplace carrying more than USD 3 billion of active listings by 2023. The distinction that matters for anyone reading this report: listings are not transactions. A USD 3 billion book of available equipment against a market of USD 4.46 billion of annual completed trade tells you the market is illiquid and that most listed tools never sell at the asking price — which is precisely the friction the dealers earn their margin from.
Four: buyer-side capital absorption. The most aggressive investor in this market in 2025 was not an investor at all. Chinese buyers absorbed an estimated USD 1.8 billion of available used inventory, paying 15 to 25 per cent premiums and accepting tools that need extensive refurbishment, according to Caladan. That is 40 per cent of the world market withdrawn from everyone else’s reach, and it is the reason western dealers report sourcing difficulty rather than demand difficulty.
What is not happening
There is no consolidation wave. No large disclosed transaction in this market has reshaped the top of the table, and there is no reason to expect one: the assets are inventory and relationships, both of which walk out of the door. What is happening is attrition at the small end. Caladan reports broker consolidation as smaller players exit because they cannot source equipment — a supply-driven exit, not a demand-driven one.
This is also why SurplusGLOBAL’s own capital decisions matter more than any announcement. Revenue fell 17.17 per cent in 2025; gross margin fell six points; the company swung to a KRW 11.70 billion operating loss from a KRW 14.16 billion profit. A dealer responding to that sells inventory and stops buying. Every dealer doing the same thing reduces the liquidity of the market it trades in — a pro-cyclical mechanism that amplifies whatever the capex cycle is doing.
| Used equipment trade | Primary equipment manufacture | |
|---|---|---|
| Dominant asset | Inventory and receivables | Fabs, plant, R&D |
| Capital intensity | Low fixed, high working capital | Very high fixed |
| Return driver | Inventory turns × gross spread | Volume × price, over a multi-year cycle |
| Cycle position | Counter-cyclical supply, pro-cyclical pricing | Pro-cyclical on both |
| Barrier to entry | Sourcing relationships and repair capability | Technology, capital and export licences |
The investment signal to watch
If this market were entering a growth phase, the leading signal would be dealers holding inventory into rising prices and paying up at sourcing. The 2025 evidence points the other way: revenue down, gross margin down, overheads up, operating result negative. The base case in this report assumes the dealer layer stabilises as supply eases and mature-node expansion continues; the conservative case assumes it does not.
One structural trend does point upward for capital formation. The adjacent service and parts pool around the installed base is, on SurplusGLOBAL’s own estimate, about USD 2 billion a year and recurring — roughly twice the trading market by its account. Every dollar of capital allocated to certified refurbishment capacity is really a bet on capturing that annuity rather than on the trade itself. That is the investment thesis worth underwriting in this sector, and it is an OEM thesis, not a dealer one.
Technology & Innovation
Technology Innovation
Almost nothing in this market is technology-led, and the little that is sits in documentation rather than in hardware. That is the honest finding, and it has commercial consequences: a market where the innovation is in tool-history data and parts access is a market where the manufacturer, not the trader, accumulates advantage.
What a refurbishment can and cannot do
A certified rebuild can restore mechanical and electrical function to original specification. Modules are separated, cleaned, inspected and replaced; chambers are re-coated; robots and load ports are rebuilt; control systems are reflashed to a supported software version; and the assembled tool is put through factory and site acceptance testing before shipment. ASML’s PAS and TWINSCAN programmes and KLA’s certified and remanufactured 150mm/200mm lines are the reference implementations.
What a third party cannot do is re-manufacture optics. Deep-ultraviolet projection lenses and illumination systems are matched, coated and calibrated at the OEM, and their performance is certified by the OEM. A used scanner without OEM optical re-certification is a materially different asset from one with it — worth less, sellable to fewer buyers, and in most cases ineligible for the process performance the original specification promises. This is the technical fact underneath the competitive structure described in the previous chapter: ASML’s position in used lithography is not a commercial preference, it is a property of the physics and the calibration data.
The same asymmetry applies less dramatically in metrology and inspection. KLA’s certified programme exists because matching a tool to a recipe requires reference standards and calibration traceability that only the OEM holds. Without them a used inspection tool is a machine of uncertain accuracy, and 81 per cent of buyers already name reliability as their first objection.
Capability extension: the genuine engineering story
The one place where used equipment does something genuinely inventive is node extension — running a tool beyond the specification it was sold against. The best-documented case is the “mix-and-match” approach described in Semiconductor Digest: of 180 tools required for a 60nm process, 108 (67 per cent of the toolset) could be met with used equipment, 12 required remanufacturing upgrades, and 82 (30 per cent) required new tools only available from the OEM. A fab converting a 130nm line to 60nm or 45nm can therefore build most of the toolset from the secondary market — which is precisely the mechanism by which used equipment competes with new at the margin.
The engineering effort involved is real but finite: chamber matching, RF and gas-delivery tuning, contamination control, and in some cases re-engineering of wafer handling for a different substrate. It is capability extension, not invention — and it is carried out by process engineers at the buyer, which is why the dealer’s sales pitch is documentation rather than specification.
Where innovation actually happens
Four areas, all of them data or logistics:
- Tool-history tracking. A complete record of installations, process recipes, maintenance events and parts replacements is now the difference between a certified price and a scrap price. It is also the basis of any export-licence application.
- Remote diagnostics and condition monitoring. Retrofitted sensor packages let a refurbisher warrant a twenty-year-old tool with something better than a visual inspection.
- Marketplace liquidity. Digital listings have made price discovery faster but not necessarily deeper; a USD 3 billion listing book against a USD 4.46 billion transaction market is a measure of how much equipment is offered and does not sell.
- Logistics and installation. De-installation from one cleanroom and re-installation in another, with process requalification inside 45–60 days, is an operational capability that most brokers do not have.
What cannot be traded at all
EUV is out of scope by construction — it is not resold, so the fastest-growing part of the primary equipment market contributes nothing to this one. Advanced immersion DUV below the control thresholds has effectively been removed from the resale pipeline as well: Caladan reports that ASML has frozen resale for advanced DUV systems, which is a supply decision as much as a compliance one. Advanced packaging tools are increasingly re-used inside the same owner rather than traded, because the process knowledge embedded in them is worth more than the resale value.
The technology maturity stage is therefore mature, patent activity is low, and innovation intensity is low. The companies that will win are not the ones that invent a better refurbishment; they are the ones that can prove what a tool has done, and get a licence to move it.
Market Risk
Market Risk
Six risks, ranked by what would actually move the number. The top one is not a market variable at all — it is a date.
1. The 10 November 2026 control cliff — dominant
The US Bureau of Industry and Security published the Affiliates Rule on 30 September 2025 (90 FR 47201). It extended Entity List restrictions automatically to any entity at least 50 per cent owned, directly or indirectly, individually or in the aggregate, by one or more listed parties. It was then stayed: effective 10 November 2025 until 9 November 2026, after which the rule is reimposed indefinitely from 10 November 2026.
That matters here more than anywhere else in the semiconductor supply chain. A used tool is a controlled item on a second journey: the buyer of a 2014-vintage DUV scanner may itself be a restricted affiliate, and the tool’s origin and technical parameters are re-evaluated at the border regardless of who owned it before. The stay has given the used market a year of unusually permissive Chinese demand — the year in which Chinese buyers absorbed an estimated USD 1.8 billion of inventory at 15 to 25 per cent premiums. If the reimposition holds, that demand pool narrows on a known date. The conservative scenario in this report exists primarily because of this risk.
2. Supply scarcity — high
The binding constraint is not buyers; it is tools. ASML has frozen resale for advanced DUV systems; secondary-market backlogs for CVD and ALD equipment run 6 to 9 months; new equipment lead times of 12 to 18 months keep buyers in this market but do not create equipment. A dealer that cannot source cannot grow, whatever the demand curve says. This is visible in the 2025 accounts: revenue down 17.17 per cent in a record year is a sourcing failure, not a selling failure.
3. Mature-node capex rollover — high
SEMI expects 200mm fab equipment spending to rise 9 per cent to USD 7.6 billion in 2026, then fall 9 per cent in 2027, 16 per cent in 2028 and 18 per cent in 2029, with installed capacity growth decelerating from 3 per cent to 2, 2 and 1 per cent. Falling new 200mm capex is ambiguous for this market — it can mean more retirements and therefore more supply — but falling capacity growth is unambiguously negative for demand, because a fab that is not expanding is not buying tools.
4. Dealer margin compression — high
Gross margin fell from 17.27 to 11.00 per cent at the only listed pure-play dealer in 2025 while overheads rose, producing a KRW 11.70 billion operating loss. If the spread continues to narrow, the intermediation layer shrinks and volume migrates to fab-to-fab deals and OEM programmes. The market can grow while the dealer layer loses money — that is not a paradox, it is a description of 2025.
5. Chinese domestic substitution — high
The same policy that creates demand for used tools in China also builds a domestic new-tool industry that competes with them. China’s imports from outside its top five supplier countries grew 28 per cent in 2025, and domestic SME production is rising on estimates from Yole, Global Net and MIR Databank. A Chinese fab choosing between an imported used etcher with a licence risk and a domestic new etcher with none is increasingly able to choose the domestic option. This is the risk that compounds: it attacks the fastest-growing region in the model from inside.
6. Cyclical inversion — moderate
Caladan expects memory pricing to recover in Q3–Q4 2026, which would reduce equipment retirements just as dealers have paid up for inventory. SurplusGLOBAL’s own record makes the volatility concrete: +51.55 per cent in 2024 followed by −17.17 per cent in 2025. A market shaped like that can be forecast for direction but not for any single year, and the scenarios are deliberately wider than the base case’s confidence interval implies.
| Risk | Level | Mechanism | What would signal it is biting |
|---|---|---|---|
| Export-control cliff, 10 Nov 2026 | High | Restricted-affiliate buyers lose access to controlled used tools | Reimposition holds; Chinese premiums collapse |
| Supply scarcity | High | No tools to sell; OEM resale freeze; parts backlogs | Dealer revenue falls while enquiries rise |
| Mature-node capex rollover | High | 200mm capacity growth decelerates to 1% by 2029 | 200mm equipment spend below USD 7.6bn in 2026 |
| Dealer margin compression | High | Spread narrows as buyers gain price transparency | Gross margin below 11% on a recovering revenue line |
| Chinese domestic substitution | High | Domestic new tools displace imported used tools | China’s used imports fall while total SME imports rise |
| Cyclical inversion | Moderate | Memory recovery stops retirements; inventory written down | Inventory days rising into a capex recovery |
The mirror image deserves stating, because it is what the optimistic scenario buys. If Chinese demand persists beyond the cliff because the tool in question falls outside controlled parameters, if back-end re-use accelerates alongside a record test and packaging cycle, and if the dealer layer consolidates enough to restore spread, the market reaches USD 9.77 billion by 2033 rather than USD 8.17 billion. That is a USD 1.60 billion swing on three variables — none of which this report can resolve from the public record, and all of which are dated or observable.
Regulatory Landscape
Regulatory Landscape
The single legal fact that shapes this market is that a used tool crossing a border is a new export. It does not inherit permission from its first journey. Country of origin, technical parameters, end user and end use are all re-evaluated, and a licence issued for the original sale confers nothing on the resale. That is why provenance is not paperwork in this industry — it is the product.
The US regime
Semiconductor manufacturing equipment moves under the Export Administration Regulations, administered by BIS. Two developments matter for the forecast window.
The Affiliates Rule. Published 30 September 2025 (90 FR 47201), it extended Entity List restrictions to any entity 50 per cent or more owned, directly or indirectly, individually or in the aggregate, by one or more listed parties or by unlisted parties already subject to licence requirements on ownership grounds. Its implementation was then split into two phases by a subsequent final rule: the rule is stayed from 10 November 2025 until 9 November 2026, and the licence requirements and related provisions are added back into the EAR effective 10 November 2026, extending indefinitely.
For this market that is a dated change in the addressable buyer list, not a change in the tools themselves. It is also the clearest example in the sector of a regulatory variable that can be modelled precisely because its effective date is published.
Tariff exposure. A Section 232 investigation into semiconductors returned an affirmative finding, and the policy options under discussion include component tariffs and export controls on semiconductor manufacturing equipment. None of that is adopted policy, and this report does not model it — but an import duty on tool components would raise refurbishment cost directly, because a rebuild consumes a large number of parts.
The Chinese side of the same transaction
China imported a record USD 51.1 billion of semiconductor manufacturing equipment in 2025, up 4 per cent on 2024, and accounted for about 37 per cent of the global SME market in the first three quarters of 2025 on SEMI data. The composition of those imports is the interesting part: Japan and the Netherlands were the two largest sources, followed by Singapore and the United States; the US share of Chinese equipment imports fell from 23 per cent in 2016 to 9 per cent in 2025; and imports from countries outside the top five suppliers grew 28 per cent in 2025. Lithography remained the largest single import category.
Read together, those four facts describe routing rather than substitution. The equipment is being bought; it is being bought through different intermediaries. That is why provenance documentation commands a premium in this market — an unbroken origin and end-user trail is what makes a tool financeable and insurable across a diverted route.
No mutual recognition, and no global licence
There is no multilateral licensing regime for used semiconductor equipment. National controls apply to their own exporters, and their technical thresholds, end-user lists and licence conditions differ. A tool that can be sold from one jurisdiction may not be re-exported from the buyer’s. The practical consequence is that a single used-tool sale may require three separate determinations: the export licence from the seller’s jurisdiction, the import permit at destination, and a re-export assessment against the buyer’s own onward customers.
Environmental and end-of-life rules
The circular-economy framing that drives European demand for certified refurbished tools is itself a regulatory effect: reuse avoids new-build embodied carbon, and refurbishment is now explicitly part of the sustainability case fabs make to their own customers. Against that, decommissioning a tool involves handling of process gases, refrigerants and in some cases PFAS-containing components, and cross-border movement of electronic waste is restricted under the Basel Convention and domestic equivalents. A refurbished tool exported as equipment is not waste; the same tool exported for scrap is. That classification decision is made by the exporter, and getting it wrong is an enforcement risk rather than a documentation error.
Compliance as a commercial moat
The practical effect of all of the above is that regulatory capability has become the differentiator. An OEM programme can certify origin, parameters and software lineage from its own records; an independent dealer has to reconstruct the same file from maintenance logs. That is a real barrier, it favours the certified tier, and it is the reason the three OEM programmes discussed in the competitive chapter will keep the top of the value ladder.