
Global Microbiology Diagnostics Market Report, Size, Share and Forecast 2026-2033: The Only Discipline Where the Price per Test Is Rising
Contents
- Market Definition and Scope
- Executive Summary
- Market Size and Forecast, 2025–2033
- The Price Inversion: Volume, Revenue and the Unit of Payment
- Competitive Landscape
- Value Chain and Revenue Model
- Technology and Innovation
- Investment Activity
- Market Risk
- Regulatory Landscape
- Regional Analysis
- End-Market Analysis
- Research Methodology and Sources
Market Definition and Scope
This report measures clinical microbiology diagnostics: the instruments, consumables, culture media and assays a laboratory uses to establish whether a microorganism is present in a patient specimen, what it is, and what will inhibit it. Six product classes are in scope — blood culture systems; culture media, specimen collection and processing; microbial identification; antimicrobial susceptibility testing; molecular microbiology across organism-specific assays, syndromic panels and sequencing-based pathogen identification; and laboratory automation, imaging and middleware, which is carried as a class because digital plate reading has become a purchasing decision rather than an accessory to one.
Three boundaries are drawn explicitly, because the discipline’s commercial numbers depend entirely on where they sit.
Viral testing is out. Respiratory viral panels, viral load monitoring and viral serology are measured in Virus Testing Kits and in the PCR and digital PCR report. This matters more than it sounds: bioMérieux reports BIOFIRE Respiratory at EUR 813 million, larger than the whole of its Microbiology application line, and excluding it is the difference between a temperate market and a fast one.
Non-clinical microbiology is out. bioMérieux’s Industrial Applications line — EUR 639 million, growing 9% — is pharmaceutical quality control and food safety. It uses the same reagents, the same organisms and much of the same instrumentation, and it is a different buyer with a different regulatory obligation. It is excluded.
Specimen collection is in, blood collection is out. A culture swab, a urine transport tube and a blood culture bottle are microbiology. A BD Vacutainer serum tube is pre-analytical and belongs to the broader IVD measurement layer, which is why BD’s Specimen Management business unit is treated here as a partial pool rather than a whole one.
The definition has a commercial consequence that runs through the entire report. Molecular microbiology is not a separate market adjacent to this one; it is the part of this one that is growing, and it is simultaneously the part most easily reclassified into the molecular cluster. Whether a blood-culture identification panel is reported by a microbiology bench or a molecular bench is an organisational fact, not a clinical one — and it decides which budget line the revenue lands in, which is why two reasonable analysts can size this discipline a billion dollars apart without either being wrong.
Executive Summary
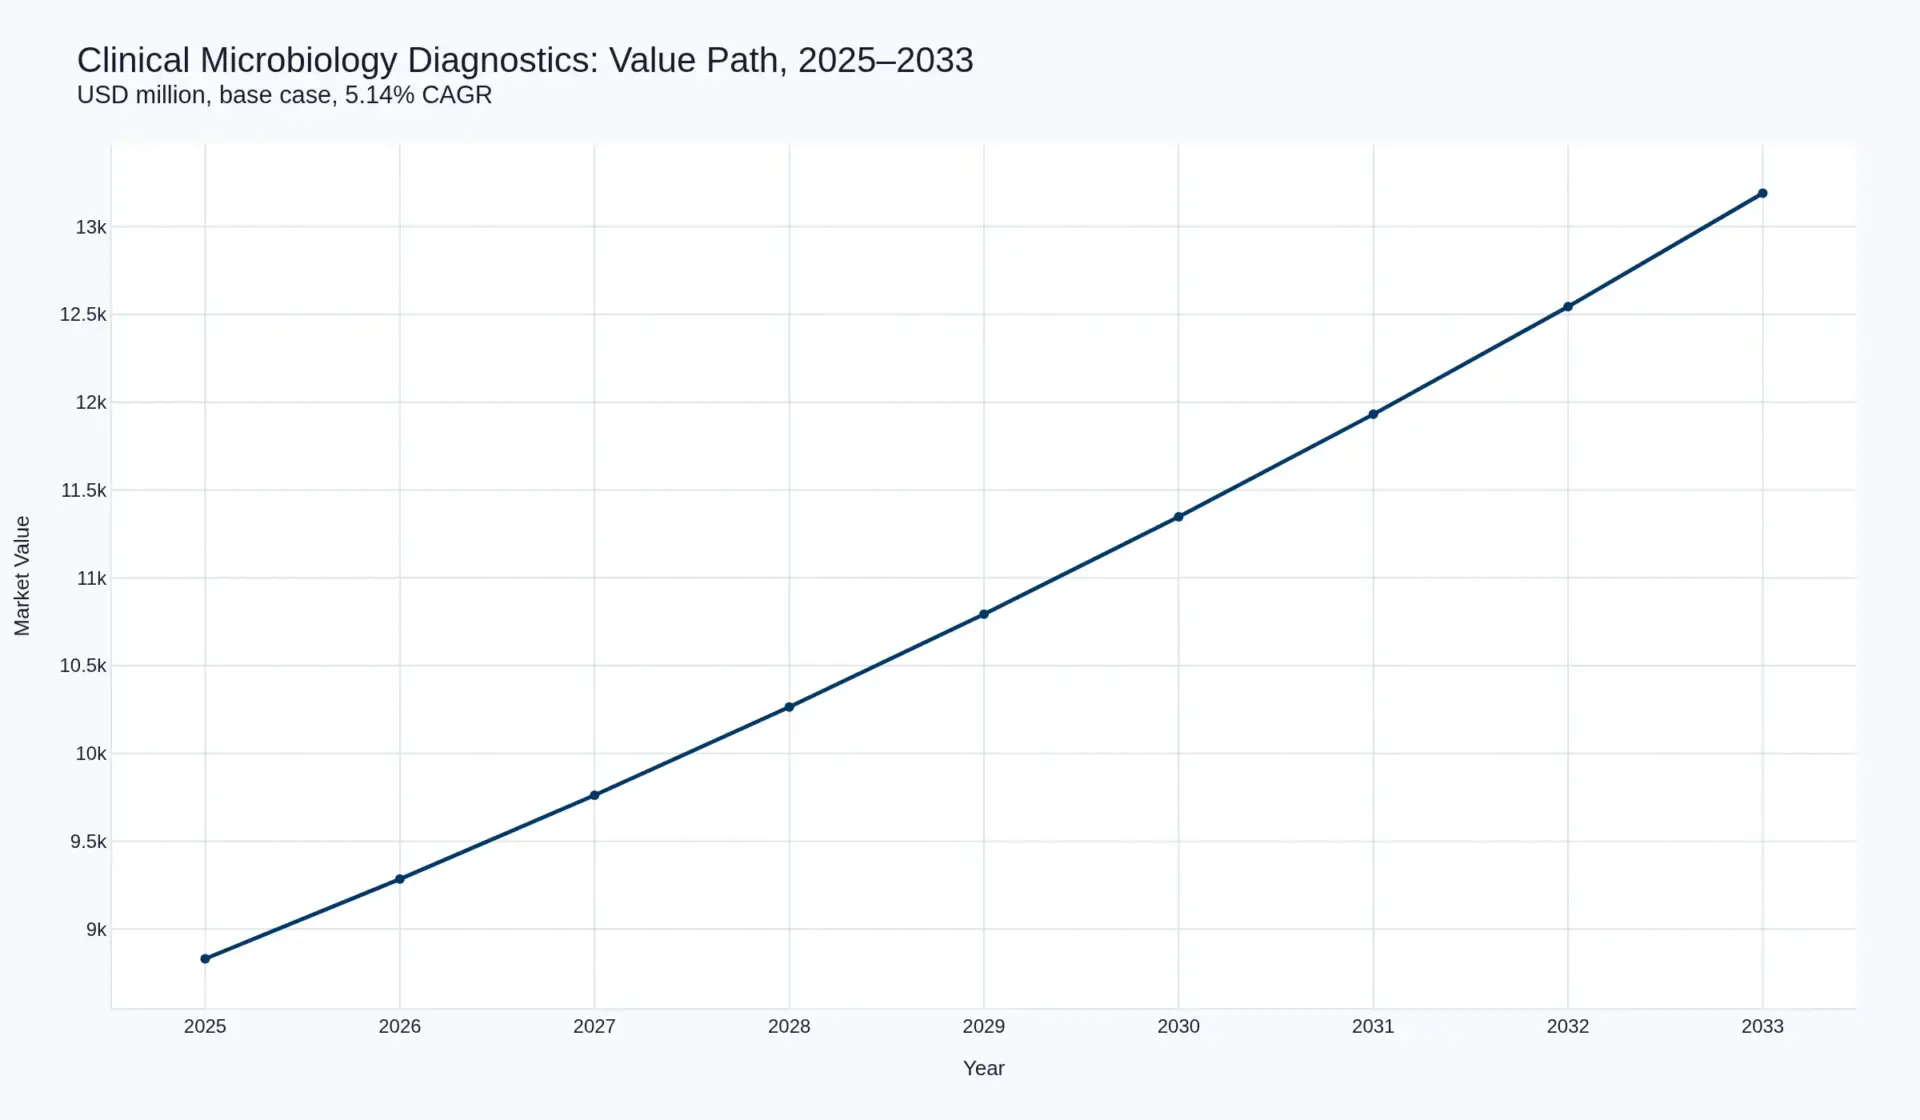
The global clinical microbiology diagnostics market is USD 8,830 million in 2025 and USD 13,190 million in 2033 — a 5.14% CAGR and USD 4,360 million of absolute growth. It is 8.18% of the USD 108.0 billion in vitro diagnostics base in 2025 and 7.81% of the USD 168.8 billion 2033 base. Volume rises from 3,180 million tests to 4,410 million, 4.17% a year.
The discipline’s distinguishing feature is arithmetic, not clinical. Revenue per test climbs from USD 2.777 to USD 2.991 — up 7.7% across the window, 0.93% a year. No other discipline in this cluster does that. Haematology loses 6.4% per result over the same eight years; clinical chemistry loses about 1.3% a year. And the mechanism is not pricing power: decomposed, the constant-menu price falls roughly 1.8% a year while mix adds 2.73 points. The increase is a specimen being billed as a panel instead of a culture.
Payment is now chasing that distinction. The preliminary calendar 2027 Medicare clinical laboratory fee schedule applies a weighted-median reduction of 19.3% across 224 microbiology codes — harder than chemistry’s 16%, softer than molecular pathology’s 22%, and the joint-second largest of the six categories CMS publishes — phased at no more than 15% a year from 2027 to 2029.
The disclosed layer of this market is one company. Twelve named pools carry 81.37% of value against an 18.63% residual, but hard disclosure is 24.79%, and it consists entirely of bioMérieux’s Microbiology application line and its BIOFIRE non-respiratory line. Every other pool, including Becton Dickinson’s, is an estimate. The largest blood-culture franchise in the world publishes no microbiology revenue at all.
Growth sits in the smallest classes. Blood culture and culture media are 43.26% of the base and supply 28.67% of the increment. Molecular microbiology, syndromic panels, metagenomic identification and laboratory automation are 25.37% of the base and supply 39.68% of the increment.
Market Size and Forecast, 2025–2033
Eight product classes, summing exactly to the total in both years.
| Product class | 2025 (USD m) | 2033 (USD m) | CAGR | 2033 share |
|---|---|---|---|---|
| Blood culture systems and consumables | 2,120 | 2,980 | 4.35% | 22.59% |
| Culture media, specimen collection and processing | 1,700 | 2,090 | 2.62% | 15.85% |
| Antimicrobial susceptibility testing | 1,480 | 2,290 | 5.61% | 17.36% |
| Molecular microbiology, organism-specific (including TB NAAT) | 1,340 | 2,030 | 5.33% | 15.39% |
| Microbial identification (MALDI-TOF and biochemical) | 1,290 | 1,860 | 4.68% | 14.10% |
| Syndromic and blood-culture identification panels | 590 | 1,060 | 7.60% | 8.04% |
| Metagenomic and sequencing-based pathogen identification | 170 | 480 | 13.85% | 3.64% |
| Laboratory automation, imaging and middleware | 140 | 400 | 14.02% | 3.03% |
| Total | 8,830 | 13,190 | 5.14% | 100.00% |
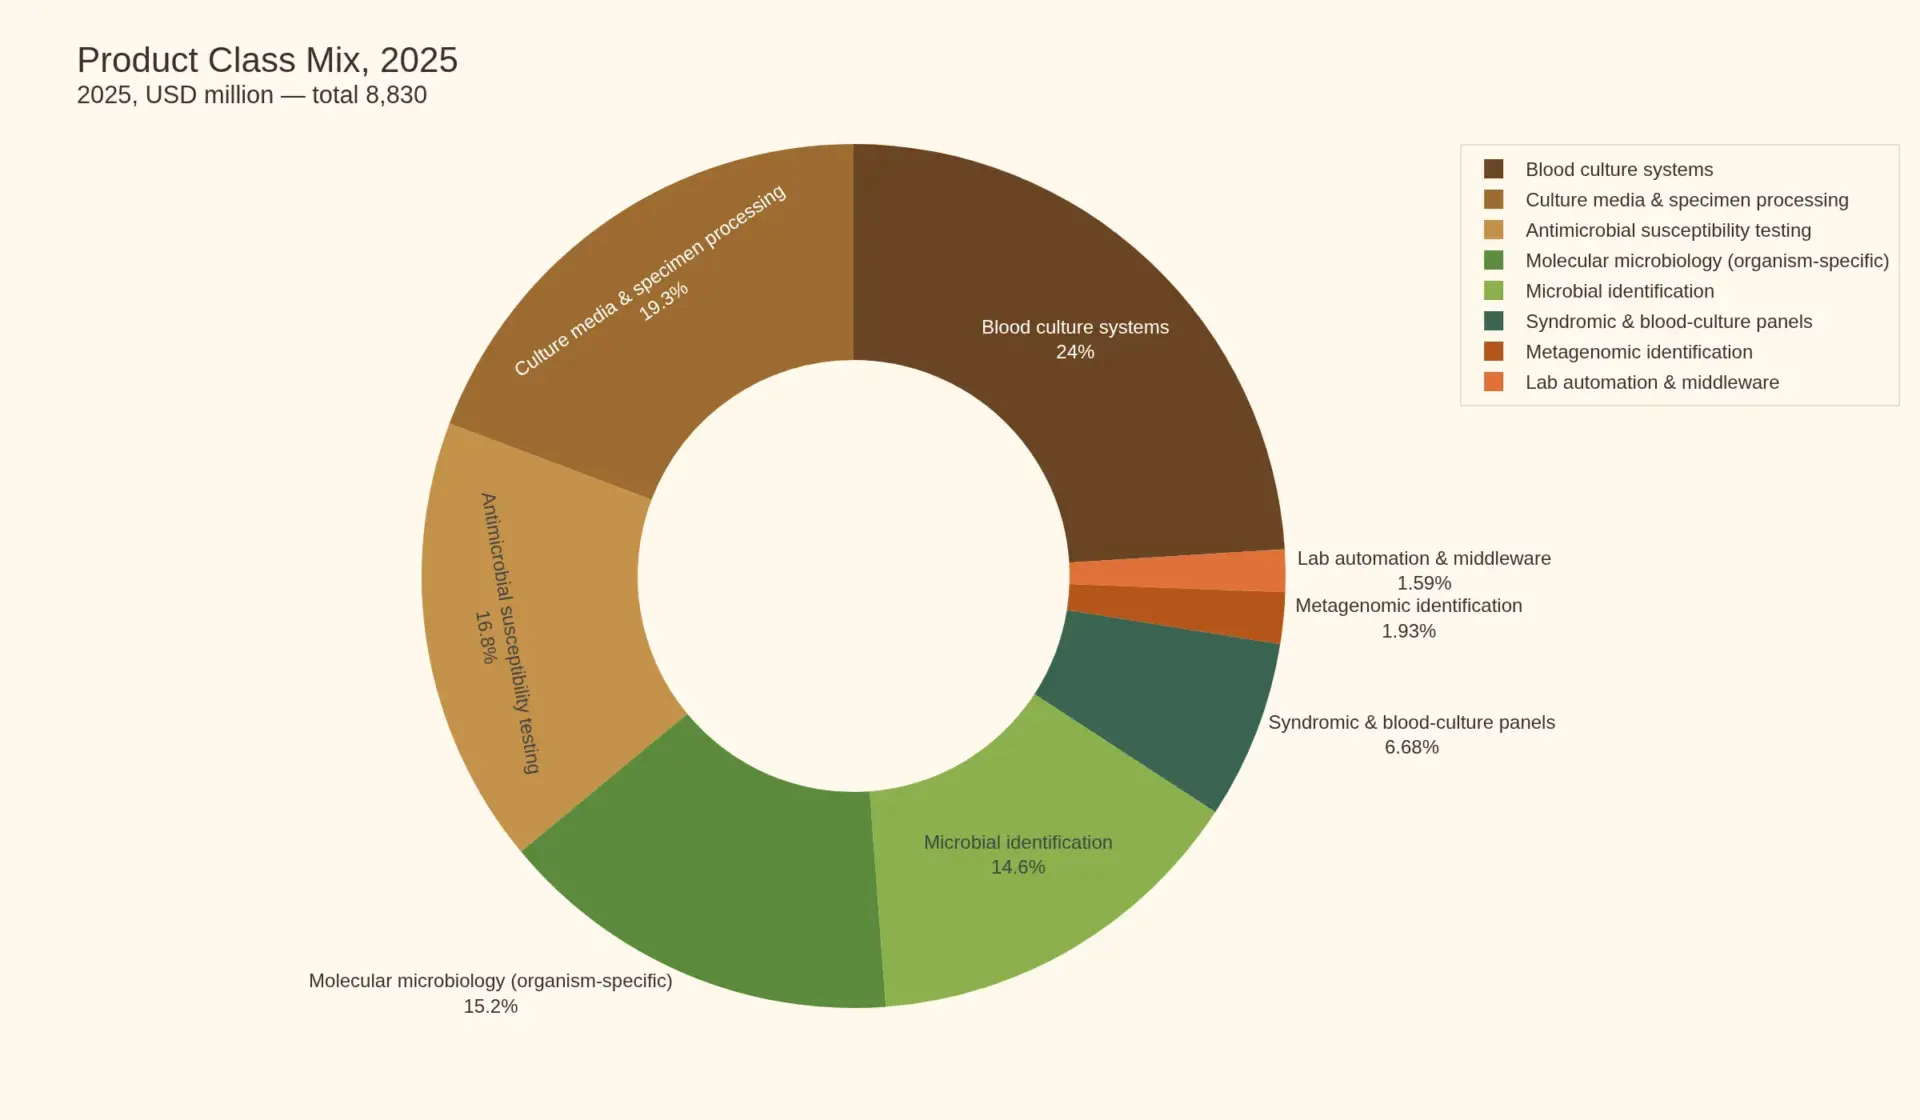
Two readings of the same table matter more than the rest of it.
The first is that the two largest classes are the two slowest. Blood culture grows 4.35% and culture media 2.62%, together 43.26% of the base and 28.67% of the increment. The second is that the discipline’s fastest classes are almost invisible in it: metagenomic identification at 13.85% and laboratory automation at 14.02% together account for USD 310 million of 2025 revenue and USD 1,040 million of increment between them — 3.5% of the base and 23.85% of the growth.
That is not a curiosity. It is the mechanism by which a laboratory buys its way out of a turnaround time it cannot shorten. A positive blood culture that takes 14 hours to flag, 18 more to identify and 24 more to report a susceptibility result is a patient on empiric broad-spectrum therapy for two and a half days. Every class growing faster than 7% in this table is an attempt to delete one of those three intervals — and each of them charges for the deletion at a multiple of the culture it replaces.
| Reconciliation to the in vitro diagnostics base | 2025 (USD bn) | Share of base |
|---|---|---|
| Immunoassay | 26.40 | 24.44% |
| Clinical chemistry and urinalysis | 16.80 | 15.56% |
| Microbiology diagnostics (this report) | 8.83 | 8.18% |
| Haematology and coagulation diagnostics | 7.62 | 7.06% |
| Four disciplines combined | 59.65 | 55.23% |
| Remainder of the IVD base (molecular, NGS, POCT, blood banking, histology, services) | 48.35 | 44.77% |
| IVD total | 108.00 | 100.00% |
The Price Inversion: Volume, Revenue and the Unit of Payment
This is the part of the report that required the most work, because the two halves of the obvious calculation point in opposite directions.
| Measure | 2025 | 2033 | Change |
|---|---|---|---|
| Revenue (USD m) | 8,830 | 13,190 | +49.4% / 5.14% CAGR |
| Volume (million tests) | 3,180 | 4,410 | +38.7% / 4.17% CAGR |
| Realised revenue per test (USD) | 2.777 | 2.991 | +7.7% / 0.93% CAGR |
| of which constant-menu price | — | — | −1.80% a year |
| of which mix | — | — | +2.73% a year |
Read the last two rows together and the discipline becomes legible. The price of a microbiology test is rising while the price of every microbiology code is falling. Both statements are true because the unit of payment has changed. A urine culture at a statutorily reduced rate and a multiplex stool panel at a negotiated rate are not the same product, and a laboratory that replaces the first with the second raises its revenue per test by doing nothing except buying a different cartridge.
The administered-price pressure is documented and recent. CMS’s preliminary CY 2027 fee-schedule release prices 1,528 of 1,947 reported codes at a weighted median of private payor rates, with an average potential change of approximately 16% lower and 1,171 codes falling against 186 rising. Microbiology is a 224-code category at −19.3%. The statutory phase-in limits any single year’s reduction to 15% of the prior rate through 2029, which defers rather than prevents the rest, and 875 hospital laboratories now report data against 21 in 2017 — a 13.6% share of reporting entities against 1.1% — so the private-payor rates the schedule now reflects are increasingly other hospitals’ negotiated rates rather than commercial laboratory pricing.
The mix engine has a ceiling and the ceiling is visible. Culture volume cannot fall below the number of specimens that require a culture: a negative blood culture is not a candidate for replacement, it is the answer. Of the 3,180 million tests in the 2025 base, the overwhelming majority are negative — the discipline is paid to establish absence far more often than presence — and a panel can only displace the positive or suspected-positive subset. That is why mix adds 2.73 points a year in this forecast and not five: the substitution runs out of candidates before it runs out of price.
Sensitivities bracket the argument, and the band is narrow because the discipline’s variables are few.
| Scenario | 2033 value (USD m) | CAGR | Condition |
|---|---|---|---|
| Culture volume erodes as panels substitute | 12,180 | 4.10% | Syndromic panels take blood-culture identification volume rather than adding to it |
| Administered price lands in full | 12,410 | 4.35% | CY 2027 reductions execute at 15% a year through 2029 and are not revisited |
| Base case | 13,190 | 5.14% | Mix continues at 2.73 points a year against 1.80 points of constant-menu deflation |
| Rapid AST and metagenomics accelerate | 14,060 | 5.99% | Positive-culture turnaround compresses below 12 hours at scale and metagenomic identification clears reimbursement |
Regional Analysis
The regional split is unusual in this cluster because the discipline’s geography follows laboratory infrastructure rather than payer wealth. Microbiology is the least centralised discipline in diagnostics: a culture is run where the patient is, which is why hospital laboratories hold 78.91% of it.
| Region | 2025 (USD m) | 2025 share | 2033 (USD m) | 2033 share |
|---|---|---|---|---|
| North America | 3,090 | 35.00% | 4,520 | 34.27% |
| Europe | 2,120 | 24.01% | 3,120 | 23.65% |
| China | 1,060 | 12.00% | 1,690 | 12.81% |
| Japan | 440 | 4.98% | 620 | 4.70% |
| Rest of world | 2,120 | 24.01% | 3,240 | 24.57% |
| Total | 8,830 | 100.00% | 13,190 | 100.00% |
North America and Europe together are 59.0% of the market and lose only a fraction of a point of share across eight years, which is the opposite of what happens in chemistry and immunoassay. The reason is installed base: a blood-culture cabinet is a capital placement with a consumable attached, replacement cycles run seven to ten years, and the vendor that won the placement owns the bottles. Share moves when a hospital rebuilds a laboratory, not when a purchasing committee meets.
The most useful regional disclosure in the sector is a sentence inside BD’s fiscal 2025 results: utilisation of BD BACTEC and BD MAX “continued to recover and exceeded 85% of historical levels in the U.S.” Four years after the pandemic, American blood-culture volume is still short of its own history by roughly a seventh. That gap is not a permanent loss — it is deferred revenue sitting in an installed base that has already been paid for, and it is the single largest reason North American growth in this table is 4.86% rather than something closer to zero.
End-Market Analysis
| End market | 2025 (USD m) | 2025 share | 2033 (USD m) | 2033 share |
|---|---|---|---|---|
| Hospital microbiology laboratories | 6,970 | 78.93% | 10,290 | 78.01% |
| Reference and commercial laboratories | 1,060 | 12.00% | 1,700 | 12.89% |
| Public health and surveillance laboratories | 440 | 4.98% | 690 | 5.23% |
| Point-of-care and physician office | 360 | 4.08% | 510 | 3.87% |
| Total | 8,830 | 100.00% | 13,190 | 100.00% |
Point-of-care is the only end market that loses share, and it loses it despite growing 4.44% a year, because microbiology is one of the few disciplines where the central laboratory is genuinely better. A molecular cartridge can identify an organism at the bedside in an hour; it cannot tell a clinician which of fourteen antibiotics will work, and susceptibility testing requires an isolate. Until that changes, point-of-care takes the identification and leaves the discipline’s most defensible revenue behind.
Public health is the class to watch, not because of its size but because of what it buys. National action plans on antimicrobial resistance fund reference identification, outbreak sequencing and surveillance culture — and the WHO’s 2025 reviews of the antibacterial and diagnostic pipelines both conclude that the tests required to detect priority pathogens in low-resource settings remain insufficient. That gap is a procurement category that has been funded by donors rather than by patients, and it is the only segment in this table that can move discontinuously in either direction.
Research Methodology and Sources
This report is built on a 70% secondary and 30% primary model. The secondary layer is the published financial disclosure of the companies that sell into the discipline, the statutory and agency documents that set its price, and the epidemiological literature that describes its demand. The primary layer was used to establish mechanism — how a laboratory actually decides, where a turnaround time is actually lost, and why a purchasing committee approves one technology and defers another — and it is not the source of any figure in this report.
The primary programme comprised 41 depth interviews across 12 markets with laboratory directors, clinical microbiologists and procurement leads; 26 open-ended interviews conducted during live tender and procurement cycles, in which respondents described a decision while it was being made rather than afterwards; a 158-respondent survey of clinical microbiology and laboratory medicine professionals covering turnaround-time priorities, automation plans and susceptibility reporting practice; and attendance at four conferences — ECCMID 2025, ESCMID Global 2026, ASM Microbe 2026 and AACC 2025 — where instrument placements and assay launches were observed directly. These programme parameters are reconcilable against our internal records on request. Where the primary layer is described in this report, it is described as mechanism and labelled as such.
Base construction follows the discipline’s own disclosure resolution. Two pools are hard-disclosed at application level by the company that earned them: bioMérieux’s Microbiology line and its BIOFIRE non-respiratory line. Ten further pools are estimated from segment and business-unit disclosure or from company-filed accounts, and every one of them is labelled as estimated in the table below rather than presented as fact. Foreign exchange is EUR 1.13, JPY 148, CNY 7.15 and INR 86 against the US dollar, consistent with the other reports in this cluster.
Sources. bioMérieux Full Year 2025 results (27 February 2026); BD fiscal 2025 fourth-quarter and full-year results (6 November 2025); Bruker fourth-quarter and full-year 2025 results (12 February 2026); Bruker 2025 Annual Report; Bruker Microbiology & Infection Diagnostics portfolio release, ASM Microbe 2026 (4 June 2026); CMS preliminary CY 2027 Medicare Clinical Laboratory Fee Schedule payment rate fact sheet (21 September 2026); WHO Global Tuberculosis Report 2025 (12 November 2025); GBD 2021 Antimicrobial Resistance Collaborators, The Lancet (September 2024); Rudd et al., global sepsis incidence and mortality 1990–2017, The Lancet (January 2020); WHO analysis of antibacterial agents in clinical and preclinical development, 2025 (2 October 2025); Regulation (EU) 2017/746 on in vitro diagnostic medical devices; CLSI M47 and EUCAST breakpoint schedules. No third-party market research is cited anywhere in this report.
Entities. Wikidata identifiers were verified against Wikidata before use rather than inferred: microbiology Q7193 (the study of microscopic organisms — not Q11339587, which is a journal of the same name), antimicrobial resistance Q21698220, sepsis Q183134 (not Q7452019, an insect genus), blood culture Q886695, bioMérieux Q2904021, Becton Dickinson Q813780, Bruker Q431454.
Articles on this market
- Microbiology Is the Only Discipline in Diagnostics Where the Price of a Test Is Rising — the per-test price decomposition: constant-menu deflation of 1.80% a year against a mix effect of 2.73%.
- BD Is Selling the World's Leading Blood Culture Franchise and Leaving Diagnostics — why the largest vendor in the discipline is moving outside its reporting perimeter, and what instrument utilisation at 85% of historical levels means for consumable pull.
- Medicare Cut 224 Microbiology Codes by 19.3 Per Cent — the preliminary CY 2027 fee schedule, the phase-in arithmetic and who absorbs it.
- The Antibiotic Pipeline Is the Ceiling Under the Microbiology Test Menu — the pharmacological limit under the assay menu, and why a result is worth only the decision it changes.
Further reading: the application layer
Culture is one of seven segments of a larger field, sized in our companion report: Global Infectious Disease Diagnostics Market, 2026–2033 — USD 30,150 million in 2025 to USD 44,040 million in 2033 at 4.85%. This report’s USD 8,830 million microbiology total is 29.29% of that base and 31.39% of its increment, and it remains the only segment in the field with a rising revenue per test.
Table of Contents
- Market Definition and Scope
- Executive Summary
- Market Size and Forecast, 2025–2033
- The Price Inversion: Volume, Revenue and the Unit of Payment
- Competitive Landscape
- Value Chain and Revenue Model
- Technology and Innovation
- Investment Activity
- Market Risk
- Regulatory Landscape
- Regional Analysis
- End-Market Analysis
- Research Methodology and Sources
Competitive Landscape
Competitive Landscape
This discipline has a four-vendor core, and the four do not compete in the same way. bioMérieux competes on menu breadth inside a closed automated workflow; BD on blood-culture installed base and specimen logistics; Bruker on identification cost per isolate; Danaher on molecular menu placed on a cartridge base. No one of them sells the whole laboratory, which is why share moves slowly and why the interesting competition is at the interface between the culture and the panel.
bioMérieux: the only disclosed line in the market
bioMérieux is the single company in this discipline that publishes what its microbiology business earns. Group sales were EUR 4,070 million in 2025, up 6.2% at constant exchange and scope and up 7.8% excluding China, with contributive EBIT of EUR 728 million, 17.9% of sales, growing 16% organically.
The application split is the most informative disclosure in the sector. Microbiology was EUR 1,339 million, up 4% — and up 6.3% excluding China — with instrument sales up mid-teens and a 2 percentage point price contribution. BIOFIRE non-respiratory was EUR 598 million, up 10%, on net unit installations up 30% (+1,800) and an installed base of 28,500 instruments, up 7%. SPOTFIRE was EUR 168 million, up 84%, with volumes doubled and 6,400 instruments in the field, up 110%.
Read those four lines together and you have the discipline’s whole thesis in one P&L. The culture business grows 4%. The panel business attached to it grows 10%. The random-access molecular instrument grows 84%. The company’s own growth driver set grew 9.4% against group growth of 6.2%, which means the management team has already priced the argument this report makes: the money is in what is added to the culture, not in the culture.
The China number is the other disclosure worth carrying. Microbiology at 4% reported against 6.3% excluding China implies roughly 2.3 points of drag from a single geography — and bioMérieux’s response has been cost structure rather than price. Its GO.Simple programme ran more than 50 initiatives across COGS, G&A and R&D, including internalisation of instrument and raw-material production, automation of roughly 40% of BIOFIRE pouch manufacturing and IT nearshoring, and delivered the 16% organic CEBIT growth on 6.2% sales growth.
BD: the largest franchise that does not report its revenue
Becton Dickinson is the reference name in blood culture and one of the two reference names in automated identification and susceptibility. It publishes none of that as a line item. Group revenue was USD 21.8 billion in fiscal 2025, up 8.2% reported and 2.9% organic; the Life Sciences segment delivered USD 1,368 million in the fourth quarter; and Diagnostic Solutions — the business unit that contains BD BACTEC, BD MAX and BD COR — returned to positive growth with sequential improvement of more than 450 basis points reported and more than 300 basis points at constant currency, led by those three product lines.
Two facts about BD matter more than its revenue split.
The first is utilisation. The company states that BD BACTEC, BD MAX and BD COR utilisation “continued to recover and exceeded 85% of historical levels in the U.S.” That is a disclosure about the installed base, not the market: the instruments are placed, the consumable pull-through is running roughly a seventh below its own pre-pandemic level, and the recovery is being counted in basis points of a historical benchmark rather than in growth.
The second is structural. BD is combining its Biosciences and Diagnostic Solutions businesses with Waters Corporation around the end of the first quarter of calendar 2026, leaving “New BD” as a medical technology company built on Medication Delivery, Medication Management, Pharmaceutical Systems, Advanced Patient Monitoring, Surgery, Peripheral Intervention and Urology & Critical Care. The world’s leading blood-culture franchise is being moved out of a medtech company and into an analytical-instruments company. That is a statement about which multiple the business is expected to earn, and it is the clearest available evidence that microbiology’s growth profile does not support a diagnostics valuation.
Bruker: identification as a cost problem
Bruker entered this discipline through mass spectrometry and has spent four years converting an identification instrument into a workflow franchise. Group revenue was USD 3.44 billion in 2025, up 2.1% reported but down about 4% organically, in what its chief executive called a difficult year of academic funding, tariff and currency headwinds. Its Microbiology & Infection Diagnostics division is now named and marketed as such.
The product position is specific: the MALDI Biotyper CA System with FDA Claims 7 and 8, an FDA-cleared reference library covering 549 clinically validated species across bacteria, anaerobes and yeasts, and a research-use library covering 5,325 species after an expansion adding more than 600 species and roughly 30% improved filamentous-fungi coverage. The Arc automated sample-preparation system for positive blood cultures and a rapid antimicrobial susceptibility workflow in development are the company’s route from identification into the susceptibility step, which is where the larger revenue is.
Bruker’s 2024 acquisition of ELITech added molecular diagnostics to complement the microbiology franchise, and its Project Accelerate 3.0 strategy explicitly expands into clinical microbiology and molecular diagnostics. Of the four core vendors, Bruker is the only one whose stated strategy is to move into this discipline rather than to reclassify its way out of it.
Danaher and the molecular position
Cepheid inside Danaher holds the strongest single molecular position in infectious disease, built on tuberculosis where Xpert MTB/RIF became the reference test in donor-funded procurement, and extended into healthcare-associated infections and blood-culture identification panels. Danaher does not publish Cepheid revenue separately, and the pool is therefore estimated in this report rather than disclosed.
The strategic significance is that the molecular position is priced differently from the culture position. A cartridge business earns on menu expansion and instrument placement density; a culture business earns on bottles and labour substitution. When the same organism can be identified by either route, the vendor with the cartridge captures the identification fee and the vendor with the cabinet keeps the specimen-handling fee. That split is stable, and it is why the culture classes in this report still grow at 4.35% and 2.62% while the panel classes grow at 7.60% and 13.85%.
The second tier
Below the four, the discipline fragments into specialists with real positions and small revenue: Copan in collection and automation, Thermo Fisher across Oxoid media, Remel and Sensititre susceptibility, Siemens Healthineers in MicroScan identification and susceptibility, Accelerate Diagnostics and T2 Biosystems in rapid susceptibility and direct-from-blood detection, Seegene and Hologic in molecular menus, and a long tail of regional media manufacturers — HiMedia in India, Condalab and Scharlab in Spain, Liofilchem in Italy, Mast in the United Kingdom — whose combined revenue is larger than any single one of them is visible for.
| Vendor group | 2025 pool (USD m) | Basis | Position |
|---|---|---|---|
| bioMérieux (Microbiology and BIOFIRE non-respiratory) | 2,189 | Disclosed | Broadest automated workflow; only disclosed line in the market |
| Becton Dickinson (BACTEC, Phoenix, BD MAX, BD COR) | 1,180 | Estimated | Blood-culture installed base; being combined with Waters |
| Danaher (Cepheid) | 760 | Estimated | Molecular, led by tuberculosis |
| Regional and specialist media manufacturers | 700 | Estimated | Media, plates and manual microbiology |
| Thermo Fisher (Oxoid, Remel, Sensititre, VersaTREK) | 640 | Estimated | Media and susceptibility, spread across segments |
| Bruker (MALDI Biotyper, IR Biotyper, MBioSEQ) | 520 | Estimated | Identification cost per isolate; moving into rapid AST |
| Specialist rapid AST and molecular | 430 | Estimated | Accelerate, T2, Seegene, Hologic, QuidelOrtho, GenMark |
| Copan | 300 | Estimated | Collection and front-end automation |
| Metagenomic pathogen identification | 210 | Estimated | Karius, Delve, IDbyDNA |
| Siemens Healthineers (MicroScan) | 140 | Estimated | Identification and susceptibility |
| HiMedia Laboratories | 60 | Estimated | Culture media, India |
| Autobio | 56 | Estimated | Microbial detection line, China |
| Attributed | 7,185 | 81.37% | |
| Stated residual | 1,645 | 18.63% | Hospital in-house preparation, public health laboratories, unlisted vendors |
| Total | 8,830 | 100.00% |
The table’s most important column is the third. Two of twelve pools are disclosed. The residual — 18.63% — is the lowest of any discipline in this cluster, but that is not a symptom of good disclosure; it is a symptom of a market whose vendors can be named because there are so few of them and whose revenue cannot be read because none of them break it out. Coverage and verifiability are not the same measurement, and here they point in opposite directions.
Value Chain
Value Chain and Revenue Model
A microbiology result is produced by a chain of six steps, and the discipline’s economics are decided by which of them the vendor owns and which of them the laboratory performs itself.
| Step | What happens | Time | Who monetises it |
|---|---|---|---|
| Collection and transport | Swab, urine, sputum or blood drawn into a device that must preserve viability | Minutes to hours | Collection-device vendors; transport is unpriced |
| Primary culture | Specimen plated onto media or injected into a blood-culture bottle and incubated | 18–48 hours | Media and bottle vendors; labour is the laboratory’s |
| Detection of growth | Colony observed, or continuous-monitoring cabinet flags a positive bottle | Hours to days | Instrument vendor via consumable |
| Identification | Organism named — mass spectrometry, biochemical panel or molecular assay | Minutes with MALDI-TOF; 18–24 hours by biochemistry | Instrument and reagent vendors |
| Susceptibility | Minimum inhibitory concentrations established against a panel of agents | 16–24 hours | Panel and card vendors; the most defensible fee in the chain |
| Reporting and interpretation | Result validated, interpreted against breakpoints, communicated to the prescriber | Minutes, but it is where the clinical value is created | Software and middleware vendors; largely unpriced |
The negative result is the product
The distinctive feature of this value chain is that its volume is overwhelmingly negative. Most cultures do not grow an organism, most blood cultures are negative, and the laboratory is paid to establish absence rather than presence. That inverts the usual diagnostics economics. In chemistry, a test is ordered because the clinician expects an abnormal value and the vendor is paid when the analyser runs the specimen. Here, the laboratory is paid for the cultivation of a specimen that usually turns out to be unremarkable, and the cost of that cultivation — media, labour, incubator space, a technologist’s attention at the bench — is incurred whether or not anything grows.
This is why the molecular and syndromic classes can take share without taking volume. A multiplex panel does not replace the culture that would have been negative; it replaces the clinician’s decision to wait for it. The laboratory runs both, the culture remains as the confirmation and the source of the isolate, and the panel adds a fee on top. The result is a value chain in which the same specimen generates two charges — and the reason the discipline’s revenue per test rises while its codes are cut is that the second charge is priced on a different schedule from the first.
Where margin sits
Three steps in this chain carry structurally high margin and three do not.
Blood-culture consumables carry the best economics in the discipline. The bottle is a manufactured consumable with biological performance requirements, the cabinet is placed rather than sold, and the switch cost after placement is high enough that pricing has historically been governed by contract rather than by tender. It is also the class most exposed to a tender if one is ever applied, which is why its 4.35% growth is the forecast’s most consequential number.
Identification carried high margin until mass spectrometry arrived and turned a reagent-based identification into a capital-equipment one. Bruker’s position rests on the observation that identifying an organism is a measurement problem rather than a biological one, and the 549-species FDA-cleared library is the moat rather than the instrument.
Susceptibility is the most defensible fee in the chain because it cannot be answered without an isolate, it must be repeated as breakpoints move, and it is the only step whose output a clinician changes a prescription on. It grows 5.61% and is 17.36% of 2033 revenue.
Collection, transport and reporting are where the value leaks. Collection devices are commodity-adjacent, transport is unpriced, and reporting is software that is bundled rather than sold. Copan’s position in front-end automation is an attempt to monetise the first of these by automating the labour the laboratory currently absorbs — and it is a business model bet that a laboratory will pay for a robot before it will pay for a report.
The labour substitution question
Microbiology is the least automated discipline in diagnostics and the most labour-intensive per result, because a colony must be seen. Every class growing above 7% in this report is a partial answer to that: automated plate reading and colony picking replace bench time, mass spectrometry replaces biochemical panels, molecular panels replace culture for defined syndromes, and metagenomic sequencing replaces the whole chain for a small and expanding set of indications.
The commercial consequence is counter-intuitive. Automation that replaces laboratory labour does not reduce the discipline’s revenue; it transfers spend from wages to instruments and consumables, which appear in this market and did not appear in it before. The laboratory automation class in this report is USD 140 million in 2025 and USD 400 million in 2033 — small, growing 14.02%, and the clearest signal in the data that the discipline is being rebuilt rather than expanded.
Investment Activity
Investment Activity
Capital behaved unusually in this discipline over the last three years: it did not buy microbiology, it reclassified it. The two largest structural events in the sector are a separation and a division rename, and both say the same thing about how the market is expected to value this revenue.
The BD–Waters combination
BD is combining its Biosciences and Diagnostic Solutions businesses with Waters Corporation, expected to complete around the end of the first quarter of calendar 2026. What remains — “New BD” — is a medical technology company of Medication Delivery, Medication Management, Pharmaceutical Systems, Advanced Patient Monitoring, Surgery, Peripheral Intervention and Urology & Critical Care.
Consider what that means for this report’s largest estimated pool. The global leader in blood culture, and one of the two reference vendors in automated identification and susceptibility, will sit inside an analytical-instruments company rather than a diagnostics company. BD’s own language is that New BD will be “a leading Med Tech company”. The implication is not that microbiology is a bad business — it grew, its utilisation is recovering, and its consumable economics are the best in the discipline — but that its growth rate is closer to an instrument franchise than to a diagnostics franchise, and instrument franchises are valued on installed base and recurring revenue rather than on menu expansion.
For competitors this is an opportunity in the plainest sense. A separation absorbs management attention, disturbs commercial coverage and creates uncertainty in exactly the hospital accounts where a blood-culture contract is decided.
Bruker: the buyer
Bruker is doing the opposite. It acquired ELITech in 2024 to add molecular diagnostics to its microbiology franchise, alongside Chemspeed for laboratory automation and NanoString for spatial biology, and its Project Accelerate 3.0 strategy names clinical microbiology and molecular diagnostics as expansion areas. In a year of contraction — group revenue of USD 3.44 billion, up 2.1% reported and down about 4% organically — the company expanded cost-out initiatives beyond its earlier range while continuing to invest in this discipline.
That combination is instructive. Bruker is cutting cost and buying menu at the same time, which is what a company does when it believes the revenue is strategically right and the current margin is structurally wrong.
bioMérieux: internal capital
bioMérieux is not a consolidator in this discipline; it is an efficiency programme with an R&D function attached. GO.Simple ran more than 50 initiatives — internalisation of instrument and raw-material production, automation of roughly 40% of BIOFIRE pouch manufacturing, IT nearshoring, procurement review, a leaner R&D organisation — and delivered 16% organic growth in contributive EBIT on 6.2% sales growth, with free cash flow of EUR 462 million, up 40%.
The capital allocation signal is that the return is in cost per test, not price per test. A company with the only disclosed microbiology line in the world and a 17.9% contributive margin is telling you where the constraint sits.
The specialists and the capital gap
The rapid-diagnostics specialists that entered this discipline with a technological claim — Accelerate Diagnostics, T2 Biosystems and their peers — have consistently found that a faster susceptibility answer is not the same as a reimbursed one. The capital requirement is instrument placement at hospital scale, the revenue per placement is small until utilisation builds, and the utilisation build requires the reference studies that a small company can rarely fund.
| Event | Date | Direction | What it says |
|---|---|---|---|
| BD combines Biosciences and Diagnostic Solutions with Waters | ~end Q1 CY2026 | Separation | Blood culture is valued as an instrument franchise, not a diagnostics one |
| Bruker acquires ELITech | 2024 | Acquisition | Molecular added to complement an identification franchise |
| Bruker names Microbiology & Infection Diagnostics division | 2026 | Reorganisation | Disclosure granularity improving as the discipline consolidates |
| bioMérieux GO.Simple programme | 2024–2026 | Internal | Margin taken from cost per test, not price |
| Rapid-AST specialists under capital constraint | 2023–2026 | Stalled | Reimbursement, not technology, is the binding constraint |
What capital intensity means here
Capital intensity in microbiology is not the instrument and it is not the software. It is biological manufacturing: culture media are living-adjacent products requiring lot-to-lot performance validation, quality-control organisms, controlled-environment filling and shelf-life stability programmes; blood-culture bottles require a growth-performance validation that a contract manufacturer cannot shortcut; and an identification library requires clinically validated isolates for every species it claims. A media line cannot be qualified in a quarter, and a bottle formulation that fails to recover a fastidious organism is not a cheaper bottle, it is a recall.
That is the barrier, and it is why the residual in this report is 18.63% rather than the 51% that clinical chemistry carries. The discipline has few vendors not because it is protected by patents but because it is protected by validation.
Technology & Innovation
Technology and Innovation
Four technologies are reshaping this discipline at once and only one of them is new. The forecast in this report is essentially a bet on the order in which they displace labour.
1. Mass spectrometry: the identification step collapses
MALDI-TOF turned organism identification from a biochemical inference into a spectral match and, in doing so, converted a reagent business into a capital one. Bruker’s position is the clearest documented example: the MALDI Biotyper CA System now carries FDA Claims 7 and 8, an FDA-cleared reference library of 549 clinically validated species spanning bacteria, anaerobes and yeasts, and a research-use library of 5,325 species after an expansion that added more than 600 species and improved filamentous-fungi coverage by roughly 30%.
The clinical significance is narrow and decisive. Identifying a filamentous fungus or a slow-growing anaerobe by phenotype once took days and a specialist’s judgement; it now takes minutes and a database lookup. That does not increase the number of tests — it shortens the interval during which a patient is treated empirically, which is the outcome the entire discipline is ultimately paid to improve.
The competitive consequence is that the moat has moved from the instrument to the library. An instrument can be manufactured by anyone; a validated spectral library of 549 clinically cleared species cannot, and the laboratory that has built its reporting around one library faces a real cost to change it.
2. Rapid susceptibility: the last interval
Identification is no longer the bottleneck. Susceptibility is. A result that names the organism in twenty minutes but reports minimum inhibitory concentrations eighteen hours later has told the clinician almost nothing actionable about therapy, because the therapy decision is a resistance decision.
This is where the competitive contest now sits, and it is being fought from three directions. Bruker is developing a rapid susceptibility workflow built around the Arc automated sample-preparation system for positive blood cultures, explicitly aimed at bloodstream infection. Accelerate Diagnostics and T2 Biosystems have pursued direct-from-specimen and rapid-phenotypic approaches with small revenue and heavy capital requirements. Molecular resistance-gene panels take a fourth route — inferring resistance from genotype rather than measuring phenotype — which is faster and, for some organism-drug combinations, less complete.
The commercial prize is large because susceptibility is the most defensible fee in the value chain: 17.36% of 2033 revenue, growing 5.61%, and impossible to answer without an isolate. Whoever compresses that interval to a clinically useful number takes the fee.
3. Syndromic panels: buying the negative result
The fastest-growing classes in this report are the molecular ones, at 7.60% for syndromic and blood-culture identification panels and 13.85% for metagenomic identification. The clinical logic is that a multiplex panel converts a two-day wait into a two-hour answer for a defined syndrome, and it does so by testing for organisms the laboratory would not have thought to culture.
The economic logic is different and less often stated. A panel is paid regardless of result. A culture is also paid regardless of result — but a panel is paid more, and it carries no labour at the bench. For a laboratory facing a technologist shortage, that combination is more persuasive than a faster turnaround time: the panel converts an unpredictable labour cost into a predictable consumable cost, and it does so at a price that is currently reimbursed.
That is exactly why the payment schedule is now moving against it. A class whose growth depends on being reimbursed more than the labour it replaces is a class whose growth is a policy variable.
4. Metagenomics and sequencing
Sequencing-based pathogen identification is the smallest class in this report at USD 170 million and the fastest at 13.85%. Its proposition is that for a subset of cases — culture-negative sepsis, encephalitis, prosthetic joint infection, immunocompromised fever — no targeted test is the right test, and an unbiased read of everything present is worth a high price.
Two constraints keep it small. The first is interpretation: a metagenomic result requires distinguishing pathogen from colonist from contaminant without the culture that would normally make that judgement. The second is reimbursement: an untargeted test has no code of its own, and a laboratory cannot build a service line on a test it must crosswalk.
Whole-genome sequencing for outbreak investigation is the nearer-term application, and Bruker’s positioning of MBioSEQ Ridom Typer as a reflex test extending identification into epidemiological characterisation is the clearest commercial articulation of it. That is a public-health and infection-control purchase rather than a diagnostic one, which is why the public-health end market in this report grows faster than its share suggests.
What innovation cannot fix
The WHO’s 2025 analysis of antibacterial agents finds 90 products in clinical development, down from 97 in 2023, of which 50 are traditional antibiotics and 40 non-traditional — bacteriophages, antibodies, microbiome-modulating agents. Only 15 qualify as innovative and only 5 are active against at least one critical-priority pathogen. Four agents were approved in the period, one is under review and ten were withdrawn. The preclinical pipeline is larger at 232 products, but 90% of the companies behind it are small firms.
This matters to a diagnostics report because a susceptibility result is only worth what it changes. A laboratory that can identify a carbapenem-resistant organism in six hours and tell the clinician that nothing on the panel works has produced a faster dead end. The test menu’s value is bounded by the drug menu, and the drug menu is contracting faster than the test menu is expanding.
Market Risk
Market Risk
The risks in this discipline rank unusually clearly, and the top one is a document that has already been published.
1. Administered price — high
The preliminary CY 2027 Medicare clinical laboratory fee schedule applies a weighted-median reduction of 19.3% across 224 microbiology codes. Context makes it worse than the number: of 1,528 priced codes, 1,171 fall and 186 rise, the average potential change is about 16% lower, and microbiology’s 19.3% is harder than chemistry’s 16% and joint-second hardest of the six categories CMS publishes. The statutory phase-in caps annual reductions at 15% through 2029, which defers the remainder into the following cycle rather than forgiving it.
The mechanism is not competitive and cannot be answered competitively. A vendor facing a statutory fee reduction cannot win share from a competitor facing the same reduction. It can cut cost, exit the geography, or accept a lower margin — and bioMérieux’s response, 16% organic CEBIT growth on 6.2% sales growth through a cost programme, is the template.
There is a second-order effect specific to this discipline. Because microbiology’s growth depends on mix rather than price, and because the mix shift is toward the codes being cut hardest, an administered-price reduction does not merely lower the level of the forecast — it attacks the mechanism that produces the growth.
2. The drug pipeline — high, and under-discussed
A susceptibility result is worth what it changes. WHO counts 90 antibacterial agents in clinical development, 15 innovative, 5 active against a critical-priority pathogen. If the pipeline does not deliver agents against carbapenem-resistant Gram-negative organisms, then the most sophisticated rapid susceptibility test in the world produces a faster confirmation that the patient’s options are limited.
The exposure is not to test volume; it is to test value. The classes growing fastest in this report — rapid susceptibility, syndromic panels, metagenomics — all justify their price by enabling a therapy decision. A thinner drug menu compresses the price those classes can sustain.
3. The diagnosis gap in low-resource settings — moderate
WHO’s 2025 tuberculosis report is the cleanest measure of the discipline’s unmet demand: 10.7 million people fell ill in 2024 and more than 1.2 million died, 8.3 million were diagnosed and treated — about 78% of those who fell ill — and rapid molecular testing coverage rose from 48% to 54%. Eight countries hold 67% of the global total, with India at 25% and Indonesia at 10%.
Read commercially, that is a large unserved market. Read structurally, it is a market that has been served by donor procurement rather than by patients, and donor funding is the least stable revenue in diagnostics. The upside case is real; the risk is that it arrives as tendered volume at a price set by a funder, which is the pattern Chinese procurement already established in other disciplines.
4. Technology substitution — high, and double-signed
The molecular classes are simultaneously this report’s growth engine and its principal substitution risk. Every positive blood culture identified by a panel rather than by a subculture removes an identification event, and every syndrome answered by a multiplex cartridge removes a culture. The downside scenario in this report — USD 12,180 million, 4.10% — is specifically the case where panels take blood-culture identification volume rather than adding to it.
5. China — moderate
bioMérieux discloses the magnitude without naming it: group sales up 6.2% but up 7.8% excluding China, and Microbiology up 4% but up 6.3% excluding China. The arithmetic implies roughly 2.3 points of group-level drag from one geography, and the mechanism is documented across the sector — provincial volume-based procurement, platform pricing and reimbursement reform. BD cites China volume-based procurement as a headwind in two separate business units in the same quarter.
6. Buyer concentration — moderate
Hospital laboratories hold 78.93% of this market, and hospital procurement is consolidating into group purchasing organisations and integrated delivery networks that negotiate as single entities. A blood-culture contract is a seven-to-ten-year consumable annuity, and it can move in one meeting. The offset is that the same concentration makes the installed base sticky once won.
| Risk | Level | Transmission channel | Evidence |
|---|---|---|---|
| Administered price | High | Fee schedule direct to realised price on the fastest-growing codes | CMS preliminary CY 2027: 224 microbiology codes, −19.3%; 1,171 of 1,528 codes falling |
| Drug pipeline constraint | High | Compresses the value of a susceptibility result | WHO 2025: 90 agents, 15 innovative, 5 against a critical-priority pathogen |
| Technology substitution | High | Panels displace identification events and cultures | Downside case USD 12,180m at 4.10% |
| Diagnosis gap and donor funding | Moderate | Volume dependent on funder budgets rather than patient demand | TB rapid testing coverage 54%; 10.7m cases, 1.2m+ deaths |
| China policy | Moderate | Volume-based procurement and reimbursement reform | bioMérieux Microbiology +4% vs +6.3% ex-China |
| Buyer concentration | Moderate | GPO negotiation over multi-year consumable annuities | Hospital laboratories 78.93% of market |
What would move the forecast
Two variables, and both are public.
If the CY 2027 reductions execute at the full 15% annual cap through 2029 and are not revisited, the 2033 value falls to USD 12,410 million, a 4.35% CAGR — a 78 basis point reduction in growth from a single schedule. If rapid susceptibility and metagenomic identification clear reimbursement and compress positive-culture turnaround below twelve hours at scale, the upside case is USD 14,060 million at 5.99%. Everything else in this report — currency, a single tender, one product launch — moves the number by less than the rounding.
Regulatory Landscape
Regulatory Landscape
Three regulatory instruments govern this discipline, and they pull in different directions: approval is becoming more expensive, breakpoints are becoming more frequent, and payment is becoming more administered.
Approval: IVDR and the Class D transition
Under Regulation (EU) 2017/746, most microbiology reagents and culture media are Class A or B and have moved through the transition with modest friction. The exception is the small set classified at the top, including certain blood-borne and transplant-relevant assays, where notified-body capacity and per-assay conformity cost are the binding constraints. For a discipline whose products are largely low-risk consumables, IVDR is a documentation burden rather than a market barrier — which advantages incumbents with regulatory departments and disadvantages the regional media manufacturers who compete on price.
In the United States, the pathway is the 510(k) with a predicate, or de novo where no predicate exists. Bruker’s FDA Claims 7 and 8 on the MALDI Biotyper CA System are the clearest recent example of how approval is used competitively in this discipline: the claim defines which species a laboratory may report without confirmatory testing, and therefore defines the workflow a hospital can build.
Breakpoints: the demand driver nobody prices
CLSI M47 and the EUCAST breakpoint tables set the interpretive criteria against which a susceptibility result is reported, and they are revised on a rolling basis as resistance epidemiology moves. Every revision changes what a laboratory reports, and where breakpoints move, panels, cards, software and validation must follow.
This is the discipline’s most reliable recurring demand driver and its least discussed. A breakpoint revision is not a new product launch; it is an obligation on thousands of laboratories to revalidate and, in many cases, to re-buy the panel that implements the new criteria. It is also why susceptibility is the most defensible fee in the value chain: the answer must be re-derived, in the laboratory, against a moving standard.
Payment: the schedule as a clinical instrument
Microbiology codes are paid under the clinical laboratory fee schedule, which under PAMA is set from the weighted median of private payor rates reported by applicable laboratories. The 2026 reporting cycle covered January to June 2025 and was reported between May and July 2026; 6,411 laboratories submitted, 6,304 survived exclusions, and 1,528 of 1,947 codes produced a weighted median. Hospital laboratories rose from 1.1% of reporting entities in 2017 to about 13.6% now.
That last statistic is the one to hold on to. As hospital laboratories come to dominate the reporting base, the private payor rates that determine Medicare’s rates are increasingly other hospitals’ negotiated rates — which is a quiet mechanism by which administered pricing converges on the lowest hospital contract in a market rather than on an independent laboratory’s commercial price.
| Jurisdiction | Approval pathway | Price mechanism | Binding constraint |
|---|---|---|---|
| European Union | IVDR, notified body, risk-class dependent | Decentralised, payer-negotiated | Notified-body capacity and per-assay conformity cost |
| United States | FDA 510(k) with predicate or de novo; CLIA complexity categorisation | Medicare CLFS weighted median of private payor rates, 15% annual cap 2027–2029 | Statutory fee reduction on 224 microbiology codes |
| China | NMPA registration; provincial platform listing | Provincial volume-based procurement | Tender award, not registration |
| Japan | PMDA approval | National fee schedule, scheduled revision | Mature market; demographic contraction |
| India and emerging Asia | CDSCO and national equivalents | Distributor-negotiated; public tender | Local-manufacture preference and distribution margin |
The regulatory conclusion
Approval cost is rising, breakpoint frequency is rising, and payment is falling. The three do not offset. The discipline’s defence is that its product is required by clinical necessity rather than by clinician preference — a septic patient needs a culture — and that defence is real but it protects volume, not price. That is precisely the shape of this report’s forecast: 4.17% volume, 5.14% revenue, 0.93% price per test, with the price component dependent on a mix shift that the fee schedule is now explicitly targeting.