
Canada PFAS Drinking Water Treatment Market Report, Size, Share and Forecast 2026–2033
The number that is not a limit
On 9 August 2024 Health Canada published an objective of 30 ng/L for the sum of 25 per- and polyfluoroalkyl substances (PFAS) in drinking water. It replaced two guidelines — PFOS at 600 ng/L and PFOA at 200 ng/L — and nine screening values for individual substances, collapsing eleven separate numbers into one group-based sum. A non-detect counts as zero, and Health Canada recommends concentrations be held as low as reasonably achievable (ALARA) on top of the 30 ng/L figure.
The value was set on treatability as much as on toxicology. Health Canada derived it from the concentrations consistently achieved at pilot and full scale by granular activated carbon (GAC), anion exchange (AIX) and reverse osmosis (RO), each of which removes more than 90 per cent of the PFAS it targets. The objective is, in the department's own words, "a benchmark for all jurisdictions to strive towards."
It is also not a standard, and nothing enforces it. No province or territory has written 30 ng/L into a drinking water limit. Québec states that it has no PFAS standard for drinking water, that analysis is not mandatory, and that the federal objective "is not intended as a basis for regulation." Ontario's O. Reg. 169/03 carries no PFAS value at all; the province works to an interim advice value of 70 ng/L for the sum of 11 PFAS, which is advice rather than a legal limit. A 14-jurisdiction regulatory tracker lists every Canadian jurisdiction as guidance or advisory on PFAS in drinking water, with no adoptions. Regulatory pressure on PFAS has moved faster on materials than on water, and Pheonix Research tracks that side of the molecule in its Europe PFAS-free food contact packaging market report.
That is the single most important fact in this market, and it governs everything that follows: the trigger is provincial enactment, not the federal number. The 30 ng/L objective does not create demand by existing. It creates demand when a province decides to enforce it, or when a contamination event forces a utility to act ahead of any rule at all. The wider municipal water sector these utilities sit inside is sized separately in Pheonix Research's global wastewater treatment market report.
What the market is worth, and how it is built
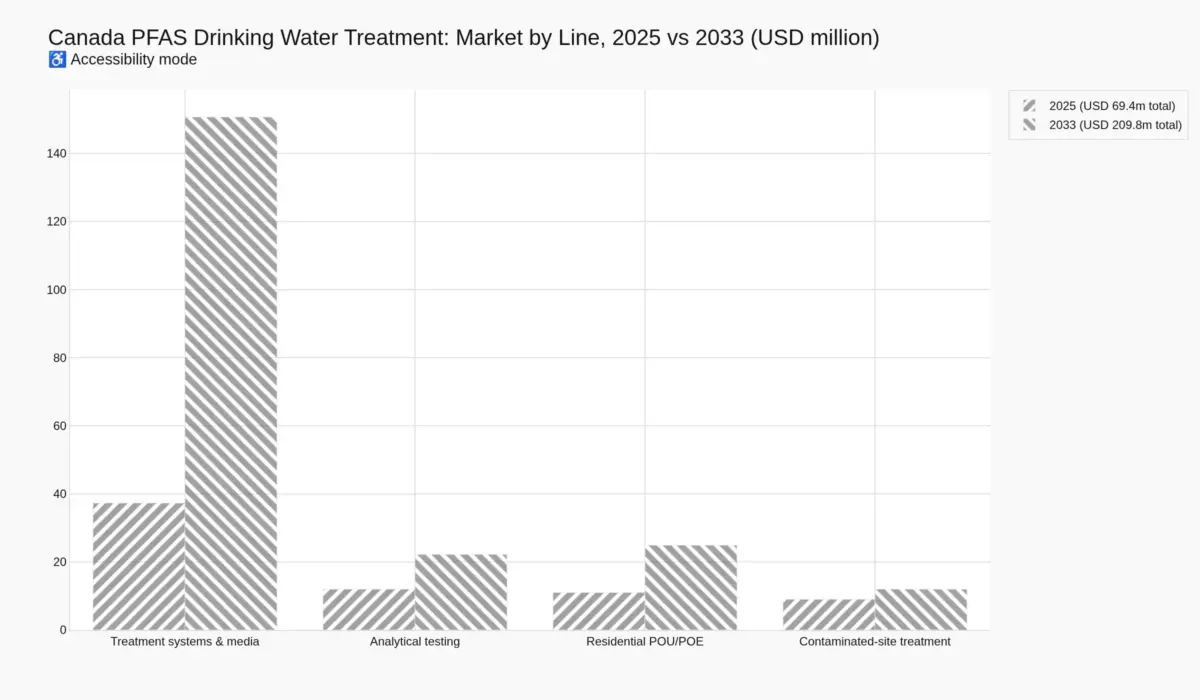
Pheonix sizes the Canadian PFAS drinking water treatment market at USD 69.4 million in 2025, rising to USD 209.8 million by 2033 — a CAGR of 14.8 per cent, inside a band of USD 106.2 million to USD 305.7 million that is 95.1 per cent of the base case wide. The band is not a technical uncertainty. It is a regulatory one: the low path assumes no province ever enacts and the high path assumes most do.
| Revenue line | 2025 (USD m) | 2033 (USD m) | Driver |
|---|---|---|---|
| Treatment systems and media | 37.3 | 150.7 | Facilities built, plus recurring media and residuals |
| Analytical testing | 12.0 | 22.2 | Samples at USD 350 each |
| Residential point-of-use / point-of-entry | 11.0 | 24.9 | Certified devices and replacement cartridges |
| Contaminated-site water treatment | 9.0 | 12.0 | Federal liability at defence sites |
| Total | 69.4 | 209.8 | CAGR 14.8% |
The model runs on facilities, not on a top-down market forecast, because no published Canadian statistic covers PFAS treatment spend and a top-down number would be an invention. The universe is 3,342 water treatment facilities (Statistics Canada, Core Public Infrastructure Survey, 2020). Against that, this report applies an action rate borrowed from the only regulator that has published one: the US EPA projects that 4,100 to 6,700 of 66,000 public water systems will have to act under its own PFAS rule, or 6.21 to 10.15 per cent. The base case takes the low end, 208 facilities; the low path takes Canada's own measured exceedance of 3.33 per cent (111 facilities); the high path takes the EPA upper bound (339 facilities).
Per facility, the report applies USD 3.0 million of capital and USD 0.11 million a year of media, operation and residuals. The capital figure sits inside the published range for PFAS plants — USD 0.75 to 6.02 per gallon per day of capacity for ion exchange and USD 2.99 to 8.89 for GAC — applied to an average Canadian plant of 1.76 million gallons a day. The operating figure is the midpoint of the published operating range applied to that same plant's annual throughput.
The measurement problem, which is the real story
PFAS is close to ubiquitous in Canadian tap water and almost never above the objective. Those two statements are both true and both matter.
- A Québec study of 463 tap water samples from 376 municipalities found PFAS in 99.3 per cent of them — median total 2 ng/L, 95th percentile 13 ng/L — and exceeded 30 ng/L in ten samples from five localities, or 2.16 per cent of samples and 1.33 per cent of municipalities.
- The first province-wide British Columbia assessment, 120 samples, found four above 30 ng/L — 3.33 per cent. Short-chain PFAS (C6 and shorter) appeared in 74.5 per cent of samples with any detection.
- Saskatchewan's 2023 sampling of seven plants detected at least one PFAS in every sample and still peaked at 23 ng/L, below the objective.
- Ontario's 2012–2016 programme across 25 systems detected PFOA in 73 per cent of drinking water samples, at a median of 1.1 ng/L and a maximum of 6.6.
So the objective is met almost everywhere on the evidence that exists — and the evidence that exists is thin, because PFAS has not been regularly monitored at Canadian treatment plants, and where it has, it has been for a limited suite, at varying detection limits, at varying frequencies. The five localities and the four BC samples are the entire visible tip. What sits under the waterline is a question of monitoring policy, and that is the part of this market that is already being paid for.
Five findings
- Two federal liability sites are worth more than half of one year of the national market. Defence Department commitments for PFAS at drinking water plants in North Bay and Saguenay total CAD 53.68 million, about USD 38.65 million at a 0.72 planning rate — 55.7 per cent of the entire 2025 market. The largest single buyer in Canada is not a utility. It is the department that contaminated the water. Aqueous film-forming foam is the usual origin of PFAS at defence sites, and the phase-out of PFAS-containing foam runs through Pheonix Research's global fire protection system market report.
- The first commercial effect of 30 ng/L is a testing order, and testing is a small business. Testing is 17.4 per cent of the market in 2025 and falls to 10.6 per cent by 2033 as hardware dominates. At CAD 350 a sample, even universal quarterly monitoring of every regulated plant is a few million dollars a year.
- The denominator is contested by 40 per cent. Statistics Canada counts 2,000 regulated plants serving 300 or more people. Its infrastructure survey counts 3,342 water treatment facilities. The regulated universe excludes the small systems that BC's data shows are more likely to be contaminated, which is precisely the population a future regulation would have to reach.
- Compliance will not mean absence. A utility that reports "below 30 ng/L" is reporting on 25 named substances at whatever detection limit its lab uses. 99.3 per cent of Québec samples contained PFAS. The gap between detected and exceeding is the gap between a chemistry result and a health claim, and it will be litigated.
- Once the build finishes, the market deflates. In 2033 capital is USD 128.0 million against USD 22.7 million of recurring spend — a rollout profile. At full build the recurring line converges on the EPA's own per-system annual cost, roughly USD 58 million for 208 systems. Anyone forecasting this market past 2034 is forecasting replacement media, not construction.
How the market segments
| Axis | Segments | Where the money is |
|---|---|---|
| Technology | GAC; anion exchange; RO / nanofiltration; multi-stage treatment trains; destruction (pre-commercial) | GAC and IX carry essentially all municipal volume; RO is confined to small and remote systems and to concentrate management |
| End user | Municipal utilities; federal and defence liability sites; First Nations systems; industrial and private wells; households | Municipal utilities on a regulatory timeline; the federal liability estate on a litigation timeline |
| Service | Analysis; piloting; engineering and design; equipment; media and consumables; residuals disposal; operation | Design and piloting, which are paid before a single vessel is procured |
| Source water | Surface water (88 per cent of Canadian potable volume); groundwater | Groundwater, which is where the highest concentrations and the most exceedances cluster |
No public source publishes technology shares for Canada, and this report does not invent them. What can be said with evidence is the trade-off that decides most procurements: ion exchange carries the lower normalised capital cost (USD 0.75–6.02 per gallon per day against USD 2.99–8.89 for GAC), while GAC carries the lower operating cost at the bottom of its range. The choice is settled by water chemistry — competing anions, organic matter, and how often the media must be regenerated — not by price list. Substitution at the media layer is technically live but not yet commercial at municipal scale; Pheonix Research tracks the adjacent adsorbent market in its global biochar market report.
What this report is not
It is not a forecast of what provinces will do. It prices two regulatory worlds and names the switch between them. It does not assume the 30 ng/L figure survives: Health Canada has said the objective stays in place only until a full guideline replaces it, and a guideline is a different instrument with a different stringency. It does not model destruction technologies as a market, because they are not yet a procurement category in Canadian drinking water. And it does not treat the absence of exceedances as evidence of safety — it treats it as evidence about monitoring.
Table of Contents
- Overview: the objective is not a limit, and that is the market
- Competitive landscape: media multinationals, Canadian integrators, and a design layer that gets paid first
- Value chain: where the CAD 8.25 million goes before a filter is bought
- Investment activity: the Defence Department is the largest buyer in the country
- Technology: three workhorse processes, a short-chain problem, and a residuals bill
- Market risk: the switch is regulatory, the floor is litigation
- Regulatory landscape: fourteen jurisdictions, zero adoptions
Competitive Landscape
Four layers, each paid at a different moment
PFAS treatment is not an industry so much as an assembly of four supply layers with different economics, different customers and different reasons for being paid. Reading the competitive landscape as one market obscures the only thing that matters commercially: which layer holds the annuity.
Layer one — the media. Granular activated carbon and anion exchange resin are commodity-adjacent products with a small number of global suppliers. Calgon Carbon, now part of Kuraray, is the reference name in GAC; Purolite, owned by Ecolab, and DuPont’s Water Solutions business are the reference names in PFAS-selective ion exchange resin, alongside Xylem’s ion exchange portfolio following its acquisition of Evoqua. Canada has no meaningful domestic GAC manufacturing capacity, so every municipal vessel is filled with imported media — and the strategic consequence is that reactivation and disposal logistics, not manufacturing, are where a Canadian firm can build a defensible position. Health Canada is explicit that spent GAC and ion exchange media require specialised disposal, such as high-temperature reactivation or destruction, to avoid releasing PFAS back into the environment. Somebody has to own that truck, that furnace and that manifest.
Layer two — the vessels and package plants. Systems integration is more fragmented and more regional. H2O Innovation of Québec City brings membrane process design; Newterra and Bishop Water operate in Ontario on packaged treatment and dewatering; Veolia, Xylem and the former SUEZ businesses supply both vessels and process guarantees at the large end. In Canada this layer competes on lead time and on the willingness to performance-guarantee an effluent number, which is a harder promise here than in the United States because the target — 30 ng/L for a sum of 25 — has no legal force to hide behind.
Layer three — engineering and design. This is the layer that gets paid first and carries the least technology risk. The North Bay contribution agreement makes the split visible: of CAD 8,249,214 committed for pilot and design, CAD 7,499,285 is engineering services and CAD 749,929 is city project management. That is 90.9 per cent of the money going to design and piloting before a single treatment vessel is procured. Stantec, WSP, AECOM and Jacobs are the national-scale firms positioned for this work, with regional consultancies taking the smaller plants. A firm that wins the pilot usually writes the specification that the equipment is then bought against, which is why piloting is the most strategically valuable revenue line in the chain despite being the smallest.
Layer four — the analytical laboratory. PFAS by liquid chromatography tandem mass spectrometry is a specialised, accreditation-dependent service, and Health Canada states plainly that testing should be done by a laboratory accredited for the analysis. ALS, Bureau Veritas and SGS dominate Canadian commercial capacity, with university platforms filling gaps and setting the price anchor: the Université de Montréal’s emerging contaminants platform publishes CAD 350 per sample for a 75-plus PFAS panel by LC-MS/MS, the same price to academic and industrial clients. Laboratory capacity is a genuine constraint on how fast monitoring can scale, and it is the one layer where the constraint is physical rather than commercial.
The Canadian specialist that shaped the objective
There is one competitive fact in this market that deserves to be stated precisely, because it is unusual. When Health Canada set the 30 ng/L value, it grounded the treatability judgement in published pilot- and full-scale removal data, and the principal study it cites for that purpose is a 2022 report by Sanexen Environmental Services, the Québec remediation firm owned by LOGISTEC. In other words, the Canadian company best positioned to sell PFAS treatment into municipal plants supplied part of the evidence base for the number those plants are now being measured against.
That is not a conflict; it is a normal feature of how treatability-based standards get written, and Health Canada’s document sets out the reasoning transparently. But it does mean that Sanexen enters procurement conversations in Ontario, Québec and the Atlantic provinces with a credibility that is hard to buy: it can say its own field data sits underneath the objective. Its base is contaminated-site work — soil, groundwater, and the water-treatment-adjacent remediation that defence sites generate — which is exactly where the largest cheques in this market are being written.
Where concentration actually sits
No public source publishes market shares for Canadian PFAS drinking water treatment, and this report does not invent them. What the structure tells you without shares is this: the media layer is an oligopoly of perhaps half a dozen global suppliers; the engineering layer is fragmented but consolidating around four national firms; the laboratory layer is three national chains plus academic capacity; and the integration layer is the most contestable and the most exposed to a single utility’s capital budget.
The commercial prize is not the capital sale. It is the media replacement and residuals contract that follows it, which recurs every six to twenty-four months for the life of the asset and which the utility cannot easily re-tender without re-piloting. Whoever wins the vessel tends to win the annuity; whoever wins the pilot tends to win the vessel. That is why the most important competitive battle in this market is fought over a six-month pilot worth a few million dollars, such as the one North Bay has now funded and expects to take to a tender-ready package by the end of 2027.
Four layers, each paid at a different moment
PFAS treatment is not an industry so much as an assembly of four supply layers with different economics, different customers and different reasons for being paid. Reading it as one market obscures the only thing that matters commercially: which layer holds the annuity.
Layer one, the media. Granular activated carbon and anion exchange resin are commodity-adjacent products from a small number of global suppliers. Calgon Carbon, now part of Kuraray, is the reference name in GAC; Purolite, owned by Ecolab, and DuPont Water Solutions are the reference names in PFAS-selective ion exchange resin, alongside Xylem’s portfolio following its acquisition of Evoqua. Canada has no meaningful domestic GAC manufacturing capacity, so every municipal vessel is filled with imported media. The strategic consequence is that reactivation and disposal logistics, not manufacturing, is where a Canadian firm can build a defensible position. Health Canada is explicit that spent GAC and ion exchange media require specialised disposal, such as high-temperature reactivation or destruction, to avoid releasing PFAS back into the environment. Somebody has to own that furnace and that manifest.
Layer two, the vessels and package plants. Integration is more fragmented and more regional. H2O Innovation of Québec City brings membrane process design; Newterra and Bishop Water operate in Ontario on packaged treatment and dewatering; Veolia and Xylem supply vessels and process guarantees at the large end. In Canada this layer competes on lead time and on the willingness to performance-guarantee an effluent number, which is a harder promise here than in the United States because the 30 ng/L target has no legal force to hide behind.
Layer three, engineering and design. This layer is paid first and carries the least technology risk. The North Bay contribution agreement makes the split visible: of CAD 8,249,214 committed for pilot and design, CAD 7,499,285 is engineering services and CAD 749,929 is city project management. That is 90.9 per cent of the money going to design and piloting before a single treatment vessel is procured. Stantec, WSP, AECOM and Jacobs are positioned for this work at national scale, with regional consultancies taking the smaller plants. A firm that wins the pilot usually writes the specification the equipment is then bought against, which is why piloting is the most strategically valuable revenue line in the chain despite being the smallest.
Layer four, the analytical laboratory. PFAS by liquid chromatography tandem mass spectrometry is a specialised, accreditation-dependent service, and Health Canada states that testing should be done by a laboratory accredited for the analysis. ALS, Bureau Veritas and SGS dominate Canadian commercial capacity, with university platforms filling gaps and setting the price anchor: the Université de Montréal’s emerging contaminants platform publishes CAD 350 per sample for a 75-plus PFAS panel by LC-MS/MS, at the same price to academic and industrial clients. Laboratory capacity is a genuine constraint on how fast monitoring can scale, and the one place where the constraint is physical rather than commercial.
The Canadian specialist underneath the number
One competitive fact deserves precision because it is unusual. When Health Canada set 30 ng/L, it grounded the treatability judgement in published pilot- and full-scale removal data, and the principal study it cites for that purpose is a 2022 report by Sanexen Environmental Services, the Québec remediation firm owned by LOGISTEC. The Canadian company best positioned to sell PFAS treatment into municipal plants supplied part of the evidence base for the number those plants are now measured against.
That is not a conflict; it is how treatability-based standards get written, and Health Canada sets out the reasoning transparently. But Sanexen does enter procurement conversations in Ontario, Québec and the Atlantic provinces with a credibility that is hard to buy: it can say its own field data sits underneath the objective. Its base is contaminated-site work — soil, groundwater and the water-treatment-adjacent remediation that defence sites generate — which is exactly where the largest cheques in this market are written.
Value Chain
The path from source water to a disposed filter
Every dollar in this market travels the same nine steps, and the commercially important feature is that seven of them are spent before any PFAS is removed. Understanding that sequence explains why a market of USD 69.4 million generates so much engineering revenue and so little hardware revenue in its early years.
Step one, source characterisation. A utility samples raw water at intake points. Surface water supplies 88 per cent of Canadian potable volume, and PFAS concentrations are generally lower and more stable there than in groundwater. The British Columbia study found centralised systems exhibited consistent concentrations and composition profiles while decentralised systems varied far more — which matters because variability determines how much treatment capacity has to be built for a worst case rather than an average.
Step two, treated-water verification. Sampling downstream of existing processes establishes whether conventional coagulation, flocculation, sedimentation and disinfection are removing anything. They are not: Health Canada states directly that common treatment technologies are not effective for PFAS removal. A utility with a modern conventional plant therefore starts from zero, not from a partial solution.
Step three, the treatability study and pilot. This is where the largest share of early spend goes. North Bay budgeted a six-month pilot of various PFAS treatment media followed by detailed design, and set CAD 7,499,285 of engineering against CAD 749,929 of internal project management. The pilot’s output is a media selection, an empty bed contact time, a regeneration or replacement interval, and an effluent number the vendor will stand behind.
Step four, detailed design and permitting. Vessel sizing, building, backwash, chemical systems and the residuals stream are all fixed here. The tender-ready package North Bay expects by the end of 2027 is the gate that releases the capital spend: nothing is procured until it exists.
Step five, procurement and installation. Vessels, media, valves, instrumentation and construction. This is the visible market and the one a supplier counts, but it is a consequence of steps three and four rather than an independent event.
Step six, commissioning and verification. Confirmatory sampling, which for a 25-substance sum means a laboratory accredited for the panel and a detection limit agreed in advance. A utility cannot demonstrate compliance against a limit it cannot measure at.
Step seven, media replacement. The annuity. Granular activated carbon and ion exchange resin exhaust, and the interval that matters commercially is six to twenty-four months depending on loading. Every installed vessel becomes a recurring order for the life of the asset.
Step eight, residuals management. The step most often omitted from market models and most likely to become the binding constraint. Health Canada identifies spent GAC and ion exchange media as requiring specialised disposal such as high-temperature reactivation or destruction, and notes that membrane processes generate PFAS-bearing reject water requiring treatment or specialised disposal. Residuals availability may limit which technology a utility selects at all.
Step nine, the long tail of private water. Four million Canadians rely on a private well, and Health Canada’s guidance directs them to activated carbon at the tap or at the point of entry, reverse osmosis at the tap, and ion exchange designed for PFAS removal. Devices certified to NSF/ANSI Standard 53 or 58 reduce a specified set of seven PFAS to a total of 20 ng/L or less. There are, notably, no certified ion exchange systems for residential PFAS removal — a real gap in a category the department itself recommends.
What the sequence means for margin
In the first year of any project, roughly nine dollars in ten goes to firms that produce documents: sampling plans, pilot reports, drawings, specifications and permits. In the following fifteen years, the recurring revenue belongs to whoever supplied the media. A utility that runs a competitive pilot and then tenders hardware separately can capture much of the design value for itself; a utility that accepts a vendor-led pilot usually hands over both.
The Canadian market’s structural weakness is that the design layer is domestic and healthy while the media layer is imported. That means the country exports the highest-margin recurring component and imports it back, and the only domestic counterweight is the residuals leg — reactivation, destruction and manifesting — which is heavy, regulated, locally sited and therefore hard to displace once built.
Investment Activity
The largest buyer in Canada is not a utility
In a market of USD 69.4 million, two federal contribution agreements account for more than half of all annual spending. They are not pilot programmes or research grants. They are liability settlements, paid by the Department of National Defence because firefighting foam containing PFAS was used at its bases for decades — from the early 1970s to the mid-1990s at North Bay and from 1972 to the early 2010s at Bagotville.
The commitments that matter for drinking water are modest in the context of the overall remediation bill and enormous in the context of this market:
| Commitment | Value | Term | Scope |
|---|---|---|---|
| North Bay — pilot and design, North Bay Drinking Water Treatment Plant | CAD 8,249,214 | 2 years, signed 2 December 2025 | Six-month media pilot plus detailed design; DND 97 per cent, city 3 per cent |
| Saguenay — installation and operation of temporary treatment units at La Baie | CAD 45,430,596 | March 2024 to March 2033 | Reduce PFAS in water serving citizens on the municipal network |
| Drinking-water PFAS total | CAD 53.68 million | About USD 38.65 million, 55.7 per cent of the 2025 market |
The North Bay remediation agreement is larger still and worth separating out: the original CAD 20 million agreement of 2021 was amended in December 2025 by a further CAD 100 million, taking total project costs to CAD 122,670,523 over sixteen years through 2037, again at 97 per cent federal. That money is mostly soil, groundwater and surface water, not drinking water — about 23,000 tonnes of soil have been removed from the Jack Garland Airport site — but it explains the political economy of the whole market. A defence site generates a remediation programme first and a water treatment programme second, and the second one is funded because the first one proved the contamination.
What the federal money does and does not buy
Three observations follow, and they are the most commercially useful lines in this chapter.
First, the federal money is site-specific, not programme funding. There is no national PFAS drinking water fund in Canada equivalent to the US state revolving fund arrangements that accompany the EPA rule. Defence pays where defence contaminated. A municipality whose PFAS arrived from a landfill, an industrial user or historic fire training on private land has no equivalent counterparty, which means its treatment plant competes for capital against roads and arenas on its own budget.
The Canadian Water and Wastewater Association’s position, stated publicly in 2025, is that whatever standard governments decide to enforce must come with funding: making a regulation at a desk and implementing it are different things. That is not a lobby talking point in this market; it is the structural reason the base case grows at 14.8 per cent rather than at the rate a binding standard would produce.
Second, the money buys documents before it buys equipment. Of the CAD 8.25 million committed at North Bay, CAD 7.5 million is engineering and CAD 0.75 million is project management, and the deliverable is a tender-ready package at the end of 2027. The procurement that follows is not yet funded. That is the single clearest piece of evidence in this report that the Canadian market’s 2026–2027 revenue is a design market, and its 2028–2031 revenue is a construction market.
Third, the liability estate is larger than the two sites that have been funded. North Bay, Saguenay and Torbay, Newfoundland are the three communities named in national reporting as having PFAS contamination in drinking water. Only two have published contribution agreements. Every additional site converts a known concentration into a pilot, a design and eventually a plant, which is why the contaminated-site line is carried at USD 9.0 million in 2025 growing only to USD 12.0 million by 2033 — deliberately conservative, because the next agreement is not public until it is signed.
Where private capital actually goes
Residential spending is the least visible and most reliably recurring part of the market. Four million Canadians rely on a private well, and Health Canada’s guidance tells them to buy a certified device. At USD 250 for a typical under-sink or point-of-entry installation and a replacement interval measured in months, this is a consumer market with a utility-like repeat cycle. It is carried at USD 11.0 million in 2025, of which USD 3.0 million is replacement cartridges, reaching USD 24.9 million by 2033 with USD 7.0 million of that recurring.
Industrial self-supply — food and beverage plants, semiconductor facilities, landfills operating their own leachate treatment — is not separately sized here. It is real, it is growing, and it is the segment most likely to transact without waiting for a regulation, because a private operator with a discharge permit or a brand commitment faces a different clock. Treat the base case as a floor for that reason.
Technology & Innovation
Three workhorse processes and no fourth
Health Canada’s technical basis identifies precisely three treatment technologies that achieve more than 90 per cent removal for the PFAS they target: granular activated carbon, anion exchange, and membrane filtration by reverse osmosis or nanofiltration. Everything else in the market is either a pre-treatment, a polishing step, a residuals solution or a pilot-stage idea.
The economics of the two municipal workhorses are genuinely different, and the published ranges are wide enough that site conditions dominate:
| Technology | Normalised capital (USD per gallon per day) | O&M (USD per gallon) | Where it wins |
|---|---|---|---|
| Anion exchange | 0.75 – 6.02 | 0.09 – 0.25 | Lower capital, smaller footprint, selective resins, single-use media |
| Granular activated carbon | 2.99 – 8.89 | 0.06 – 0.28 | Broad-spectrum organics removal, reactivation options, familiarity |
| Reverse osmosis / nanofiltration | Highest | Highest | Small and remote systems, and where a concentrate can be managed |
Two readings follow. Ion exchange carries roughly a quarter to two-thirds of the normalised capital cost of carbon at the midpoint of each range, which is why it has taken share wherever a utility can manage the brine. But carbon carries the lower floor on operating cost and offers a reactivation route for the spent media that ion exchange resin does not always have. The choice is settled by competing anions, organic matter and regeneration frequency, not by a price list — and Health Canada says so directly.
What matters more than the choice is that no single treatment removes a wide range of PFAS under all conditions. Achieving a group sum may require a treatment train, or the same technology used twice in series. That is a structural feature of this market rather than an engineering detail: a group-based limit of 30 ng/L for 25 substances is a harder design problem than a per-substance limit of the same stringency, because it cannot be met by solving for the one compound that is highest.
The short-chain problem nobody has priced
The chemistry is shifting under the treatment market. Long-chain PFAS were regulated first and removed first, and what remains is increasingly short-chain — more mobile, less readily adsorbed, and more expensive to remove per unit of mass. The British Columbia study found short-chain PFAS of C6 and shorter in 74.5 per cent of samples with any detection, and attributed that to the phase-out of long-chain compounds, transformation of precursors, and the greater mobility of short chains.
Health Canada’s own monitoring review shows the same direction: in federal freshwater sampling from 2013 to 2020 across 29 sites, concentrations of PFBA and PFPeA increased significantly over the period while PFHpA, PFOA and PFOS decreased. The replacement chemistry is not benign to the treatment plant; it is simply newer.
This has a commercial consequence that runs against the headline. A GAC vessel specified for long-chain removal may meet its design number on day one and drift above it as the influent profile shifts toward short chains, which shortens the media replacement interval and pushes the recurring revenue line up even as the capital line flattens. The base case carries that effect in the operating cost rather than the capital cost, deliberately.
Certification is doing work that regulation is not
With no enforceable standard, the de facto specification in Canada is a private one. Devices certified to NSF/ANSI Standard 53 for activated carbon and Standard 58 for reverse osmosis reduce a defined set of seven PFAS to a total of 20 ng/L or less — tighter than the federal objective, and the basis on which a consumer can make a purchase decision. Health Canada recommends both standards and, separately, notes that there are currently no certified ion exchange systems for residential PFAS removal, even though it recommends ion exchange as a household option.
That gap is the most under-served product opportunity in this market. A residential ion exchange device that achieved certification would be selling into a four-million-person private-well base with a federal recommendation already in place and no certified product to buy.
Destruction is research, not yet a category
The residuals problem is where the technology frontier actually sits. Existing and emerging destruction technologies include electrochemical oxidation, thermal degradation, supercritical water oxidation, plasma-based treatment and sonolysis; Health Canada’s assessment is that most destructive technologies remain developmental, that efficacy and cost are hard to evaluate for drinking water, and that results are promising.
The federal government has funded the search. Innovation, Science and Economic Development Canada launched a challenge in October 2024 under the Innovation Solutions Canada programme specifically to advance destruction of PFAS in contaminated media, seeking cost-effective and scalable solutions across solid and aqueous matrices. Until a destruction route clears cost and permitting, the market’s residuals leg remains a disposal and logistics business, which is exactly why the incumbent advantage sits with whoever already owns permitted high-temperature capacity.
One analytical trend deserves a note because it will move the market before any treatment technology does. Detection limits have collapsed: a Québec study covering 376 municipalities reported individual limits of 0.001 to 0.082 ng/L, against the 0.5 to 5 ng/L limits used in earlier provincial monitoring. A 30 ng/L sum measured at 0.08 ng/L increments detects things a 5 ng/L method never saw. As detection improves, sums rise, exceedances increase, and the population of plants needing treatment grows without a single regulatory change.
Market Risk
The band is the risk, and it is regulatory
This market carries an unusual risk profile: almost none of its uncertainty is technical. The technologies work, the cost ranges are published, and the contamination is measured. The uncertainty is whether any province converts a federal benchmark into a number a utility must meet. That single decision moves the 2033 market from USD 106.2 million to USD 305.7 million — a band 95.1 per cent of the base case wide, which is to say the downside and the upside are each roughly half the base case.
| Path | Facilities acting | 2033 market | CAGR to 2033 |
|---|---|---|---|
| Low — no province enacts | 111 | USD 106.2 million | 5.5% |
| Base — Ontario and two or three others adopt by 2028 | 208 | USD 209.8 million | 14.8% |
| High — most provinces adopt, guideline finalised | 339 | USD 305.7 million | 20.4% |
Risk one: the denominator is contested by 40 per cent
The report sizes against 3,342 water treatment facilities (Statistics Canada, 2020) but the federal survey frame covers only 2,000 plants serving 300 or more people. The gap of 1,342 facilities is not noise. It is the small-system population — and small systems are where the evidence says contamination concentrates. Households in municipalities under 1,000 are the least likely in Canada to be on a distribution system at all (50.2 per cent) and the most likely to be on private wells (47.3 per cent). The BC study found decentralised systems more variable and more susceptible to contamination than centralised ones.
If a province enacts 30 ng/L, the regulated population it must reach is materially larger than the 2,000 plants Statistics Canada surveys, and the marginal facility is smaller, poorer and harder to treat. That is upside to facility count and downside to average contract value, simultaneously.
Risk two: First Nations systems sit outside the frame entirely
The Statistics Canada survey explicitly excludes First Nations communities, whose water systems are federally funded and which carry a documented history of long-term drinking water advisories. This report does not size that segment, because no public dataset gives the number of community systems or their PFAS status, and inventing one would be worse than omitting it. The commercial implication is straightforward: it is a real, funded, policy-prioritised segment that is invisible in every national statistic used to build this market, and any operator with capacity there is selling into demand the forecast does not count.
Risk three: compliance will be mistaken for safety
A report of “below 30 ng/L” is a statement about 25 named substances, measured at a laboratory’s detection limit, on the day of sampling. It is not a statement about absence. 99.3 per cent of Québec tap samples contained PFAS while only 2.16 per cent exceeded the objective, and a 2023 pilot across 14 Canadian plants using methods with limits as low as 0.01 ng/L found PFAS at the highest detection frequencies in exactly the compounds the objective’s sum depends on.
Three consequences. Utilities will face freedom-of-information requests they lose. Insurers and lenders will start asking for a PFAS sampling history. And the definition of the sum itself becomes a commercial battleground — which laboratory, which limit, which sampling point — because a result that sits at 25 ng/L under one method can sit at 40 under another.
Risk four: the residuals leg is the binding constraint
Spent carbon and ion exchange media require specialised disposal, and membrane processes generate PFAS-bearing reject water. Health Canada states that the availability of disposal options may limit which technology can be selected. A municipality that cannot contract permitted disposal capacity cannot install the treatment it has designed, and in practice that redirects spend toward whichever vendor can bundle media supply with a disposal route. The risk is concentration, not shortage.
Four falsifiers, and what to watch for nothing
The base case rests on provincial enactment. These are the cheap tests of whether it is happening, in order of how early they would fire:
- Ontario publishes a PFAS value in O. Reg. 169/03. Today the province has an advisory 70 ng/L for 11 PFAS and no legal value. Any draft posting on the Environmental Registry is a material event.
- Québec reverses its position. Québec currently states the objective is not intended as a basis for regulation; a MELCCFP monitoring programme with mandatory reporting would signal the opposite.
- A fourth and fifth defence-site agreement appears. Each new contribution agreement is a direct revenue event, not a leading indicator, and the pattern so far is 97 per cent federal with a 3 per cent municipal share.
- The CAD 350 sample price falls materially. Cheaper analysis is the single most effective way to expand monitoring across 2,000 plants, and it would show up in laboratory pricing before it shows up in any policy document.
Against these, the report is careful not to overstate the downside. Detection limits have improved by more than an order of magnitude in a decade, which raises reported sums and exceedances with no policy change at all. PFAS is being restricted as a class under federal toxic substances law, which pulls utilities toward precaution regardless of provincial inaction. And in 2025 a group of thirteen Canadian scientists publicly called for the 30 ng/L limit to be made legally enforceable. The low path exists because inertia is real, not because the direction of travel is toward it.
Regulatory Landscape
Four words that are not interchangeable
Canadian drinking water regulation runs through instruments with very different force, and the entire commercial structure of this market sits in the gap between two of them.
A guideline under the Guidelines for Canadian Drinking Water Quality is the normal instrument, and developing one takes many years. An objective exists precisely because that timeline was too slow: Health Canada, with the provinces and territories, may set an objective to reduce exposure while a guideline is revised or developed. An objective is a goal for a maximum level of a contaminant, set with regard to available treatment technology and analytical methods. A standard is what a province enacts into its own drinking water regulation, and it is the only one of the three that a utility can be prosecuted for missing.
The PFAS objective is the second category. Every enforceable number in this market is in the third, and there are currently none.
Fourteen jurisdictions, zero adoptions
Every Canadian jurisdiction was assessed for this report, and the pattern is uniform. Not one has written 30 ng/L into a drinking water standard.
| Jurisdiction | Position on 30 ng/L | What actually binds |
|---|---|---|
| Federal | Objective, 9 August 2024 | Nothing; Health Canada does not regulate any water system |
| Ontario | Guidance; MECP assessed applicability | No PFAS value in O. Reg. 169/03; interim advice value of 70 ng/L for sum of 11 PFAS |
| Québec | Guidance; objective used to interpret monitoring | No PFAS drinking water standard; analysis not mandatory |
| British Columbia | Guidance | Source Drinking Water Quality Guidelines, sections 1.39 and 1.40 |
| Alberta, Nova Scotia | Provincial standard, but not for drinking water | Tier 1 soil and groundwater remediation guidelines |
| Saskatchewan, Manitoba, New Brunswick, Newfoundland and Labrador, Prince Edward Island, Yukon, Northwest Territories, Nunavut | Guidance; federal objective applies as advisory | No jurisdiction-specific PFAS drinking water standard |
Two details are worth more than the table. Ontario is the closest to enactment and is therefore the single most important jurisdiction in this report: its 70 ng/L figure covers 11 PFAS against the federal objective’s 25, is described by the province’s own regulator as interim advice rather than a standard, and is absent from the regulation that carries legal limits. The Ministry of Environment, Conservation and Parks has said that if Ontario adopts the federal objective, it would expect affected municipalities to provide a plan and then implement it. That sentence is the mechanism by which this market becomes large.
Québec is the clearest statement of the status quo: no PFAS standards for drinking water, no mandatory analysis, and an explicit statement that the federal objective is not intended as a basis for regulation. Given that the province also produced the most thorough Canadian occurrence dataset — 463 tap samples across 376 municipalities — the position is not one of ignorance.
What federal law is doing instead
Ottawa is not idle; it is working on a different axis. In April 2021 the government published a Notice of Intent to address PFAS as a class. In May 2023 it released the Draft State of PFAS Report. The Prohibition of Certain Toxic Substances Regulations, 2025 (SOR/2025-270) carry federal prohibitions covering PFOS, PFOA and certain long-chain PFAS, extending a regime that until now reached only three substance groups. PFAS is being moved toward listing as toxic under federal environmental law, which permits control of manufacture, import and use rather than of drinking water.
Those instruments regulate the front of the pipe, not the back. A prohibition on manufacture does not remove what is already in the aquifer, and it does not oblige a water utility to do anything. That is why source-control progress and treatment demand are only loosely coupled in this market: they can both advance without touching each other.
Three adjacent federal actions matter for the treatment market’s edges. The Canadian Food Inspection Agency began enforcing an interim standard for PFAS in biosolids in October 2024, which reaches wastewater solids spread on agricultural land. ISED launched an PFAS destruction challenge the same month. And federal environmental quality guidelines for PFOS in surface water, fish tissue and bird eggs continue to apply to the receiving environment rather than to drinking water.
The international comparison sets the ceiling
The stringency of a foreign limit is a reasonable guide to what a Canadian guideline might eventually look like, and the spread is large. The European Union sets 100 ng/L for the sum of 20 PFAS and 500 ng/L for the sum of all PFAS in drinking water — looser than Health Canada’s objective on the group measure. The United States sets individual maximum contaminant levels of 4 ng/L each for PFOS and PFOA — far stricter, and the reason the US treatment burden is not a valid scaling base for Canada.
Canada’s 30 ng/L for a sum of 25 therefore sits between the two, and closer to Europe on stringency than to the United States. Any comparison of Canadian and US market size that ignores this will overstate Canada by a wide margin, which is why this report does not scale from US totals.
The instrument to watch is a guideline, not a standard
Health Canada has stated that the objective will remain in place only until new, updated Guidelines for Canadian Drinking Water Quality are published, and that the full revision will include a comprehensive review of new toxicological evidence and reference values, of analytical and treatment methods, and of treatment residuals management. That revision is the event that redefines this market, in either direction. A guideline that adopts 30 ng/L for a sum of 25 gives provinces a defensible number to enact and pushes the market toward the high path. A guideline that lands looser — on newer toxicology, or on what smaller systems can actually achieve — would leave the objective as the aspirational ceiling it is today and hold the market near the low path.
Neither outcome is priced as certain here. The base case assumes partial enactment by 2028 and a guideline broadly consistent with the current objective, which is the central expectation and not a prediction.
Related reading
Four Pheonix reports sit around this one. The Global Wastewater Treatment Market covers the segment this report sits inside, and the difference matters: wastewater treatment is a regulated, funded, mature market, while PFAS drinking water treatment is a voluntary one built on a benchmark. Europe PFAS-Free Food Contact Packaging tracks the same chemical class being designed out at the front of the pipe, which is the substitution this market cannot perform. The Global Fire Protection System Market is where the contamination came from: aqueous film-forming foam is the reason North Bay and Saguenay are spending. And Global Biochar is an adjacent adsorbent media competing for the same vessel volume as granular activated carbon.
Sources: Health Canada, Objective for Canadian Drinking Water Quality — Per- and Polyfluoroalkyl Substances (9 August 2024) and Water Talk: PFAS in Drinking Water; Gouvernement du Québec, PFAS advisory; Government of Ontario, O. Reg. 169/03 and MECP interim advice; Government of British Columbia, Source Drinking Water Quality Guidelines; Prohibition of Certain Toxic Substances Regulations, 2025; CFIA interim standard for PFAS in biosolids; Innovation Solutions Canada PFAS destruction challenge; US EPA PFAS National Primary Drinking Water Regulation; European Union Drinking Water Directive.