
Global Oncology Molecular Diagnostics and Tumour Profiling Market Size, Share, Trends and Forecast 2026-2033
Market Forecast Snapshot, 2025-2033
| Indicator | Value |
|---|---|
| Market value, 2025 | USD 6.50 billion |
| Market value, 2033 | USD 16.93 billion |
| Compound annual growth rate, 2025-2033 | 12.71% |
| Implied CAGR from the two endpoints | 12.7114% |
| Growth multiple | 2.60x |
| Incremental value created, 2025-2033 | USD 10.43 billion |
| First forecast year growth rate, implied by the segment build | 12.09% |
| Currency and basis | USD, nominal, 2025 average exchange rates |
| Forecast horizon | 2026-2033 |
The global market for oncology molecular diagnostics and tumour profiling was worth USD 6.50 billion in 2025 and is forecast to reach USD 16.93 billion by 2033, a compound annual growth rate of 12.71%. That is a multiple of 2.60x on the base year, or USD 10.43 billion of incremental value created over eight years.
The thesis: nobody makes money on a discretionary panel
The single most useful fact about this market is that it grows at 12.71% a year and almost nobody in it earns a return. Of the six largest participants, four reported a net loss in 2025: Natera lost USD 208.2 million on USD 2,306.1 million of revenue, Tempus AI lost USD 245.0 million on USD 1,271.8 million, NeoGenomics lost USD 108 million on USD 727 million, and Guardant Health burned USD 233 million of free cash on USD 982.0 million of revenue. Exact Sciences lost USD 208 million on revenue of USD 3.25 billion. Veracyte is the exception, and it is an instructive one: USD 66.4 million of GAAP net income at 12.8% of revenue, and an adjusted EBITDA margin of 27.6%.
What separates Veracyte from the others is not technology, scale, or the quality of the science. Veracyte sells two tests. One of them, Decipher, grew 27% to USD 310.7 million on roughly 102,000 tests, and it answers a single question - whether a man with prostate cancer needs adjuvant treatment after surgery - that a guideline asks and a payer pays for without argument. NeoGenomics sells a menu, serves the ordering oncologist directly, and converts USD 727 million of revenue into a 5.91% adjusted EBITDA margin. The market rewards the test that a guideline requires, not the platform that generates it.
The 2025 disclosures this report is built on
| Participant | Disclosed line, 2025 | Growth | Volume |
|---|---|---|---|
| Guardant Health | Oncology revenue USD 683.6m | +26% | ~276,000 oncology tests, +34% |
| Natera | Total revenue USD 2,306.1m; oncology not separately disclosed | +35.9% total | ~800,800 oncology tests, +51.6% |
| Exact Sciences | Precision Oncology revenue USD 717.0m | +18% total | not disclosed |
| Tempus AI | Diagnostics revenue USD 955.4m | +111.5% | Oncology volume +26% |
| NeoGenomics | Revenue USD 727m; clinical +15% | +10% total | not disclosed |
| Veracyte | Testing revenue USD 493.2m; Decipher USD 310.7m | +18% testing | ~169,714 testing tests, +19% |
| Myriad Genetics | Tumour Profiling revenue USD 121.7m | -3% | Prolaris volume +12% in Q4 |
| Roche Diagnostics | Molecular Lab CHF 2,527m; Pathology Lab CHF 1,723m | Molecular +4% CER; Pathology +14% CER | 53 new tests launched in 2025 |
Three findings that carry the forecast
One: volume growth is being bought with price
Guardant Health grew oncology revenue 26% while oncology test volume grew 34%. The arithmetic is unavoidable: realised revenue per oncology test fell from roughly USD 2,635 in 2024 to USD 2,476 in 2025, a decline of 6.04%. Veracyte grew testing revenue 18% on testing volume up 19%, realising USD 2,906 per test against USD 2,938 a year earlier, a decline of 1.09%. Myriad Genetics sold 3% less tumour profiling revenue than the year before while Prolaris volume rose 12% in the fourth quarter. Wherever a participant discloses both revenue and volume in this market, the price line is flat or negative.
This is not a pricing failure by the vendors. It is the structural condition of the market. The price of a molecular test is set by a procedure code and a fee schedule, and the vendor negotiates volume against a published rate. A forecast for this market is therefore a volume forecast with a reimbursement overlay, which is why the restraints section of this report is longer than the technology section.
Two: the profitable business is the annuity, not the panel
The dividing line is repeatability. A therapy-selection panel is ordered once, at diagnosis, to choose a first-line drug. A molecular residual disease assay is ordered serially, after treatment, to detect recurrence - the same patient, the same bespoke build, quarter after quarter. Natera processed 800,800 oncology tests in 2025, up 51.6%, on a product that is administered as a monitoring relationship rather than a single event, and its gross margin rose from 60.3% to 64.7% as the volume compounded. That is what an annuity looks like: incremental volume arriving at better unit economics. Guardant's oncology test count grew 34% and its price per test fell 6%, which is what a one-shot business looks like when the payer holds the price.
Three: the disclosure gap is 16.7% of the market
Nine named pools reconcile to USD 5,414.0 million. The residual that covers unlisted and regional laboratory testing, private participants, Chinese and Japanese hospital laboratories, and other in-vitro diagnostic suppliers is USD 1,086.0 million - 16.7% of the base. That is a far larger disclosure gap than the polymerase chain reaction market carries, and the reason is structural: a very large share of tumour profiling is performed inside hospital laboratories that publish nothing, by pathologists who report no revenue line. Any participant-level view of this market is therefore a view of its listed minority.
What is inside the perimeter
| Inside the boundary | Outside the boundary |
|---|---|
| Somatic tumour profiling and therapy selection, tissue-based | Germline hereditary cancer testing (Myriad hereditary USD 372.4m; Natera women's health) |
| Blood-based therapy selection and comprehensive genomic profiling | Colorectal and multi-cancer screening (Exact Screening USD 2.53bn; Guardant Shield USD 79.7m) |
| Molecular residual disease and recurrence monitoring | Biopharmaceutical data and clinical trial services (Guardant USD 210.1m; Tempus USD 316.4m) |
| Prognostic and diagnostic genomic classifiers | Anatomic pathology and immunohistochemistry (Roche Pathology Lab CHF 1,723m) |
| Oncology-attributable molecular reagents and kits sold to hospital laboratories | Prenatal, transplant and organ health testing |
Two of those exclusions carry more weight than the rest and both are deliberate. Germline hereditary cancer testing is oncology molecular diagnostics by any clinical reading, but it is a risk assessment performed on a healthy person and priced through a different code set and a different payer logic. Screening is a population programme, not a profiling test, and folding Exact Sciences' USD 2.53 billion screening line into a tumour profiling market would misdescribe what the market does. Excluding both is what puts this base at USD 6.50 billion rather than several times that figure, and the exclusion is stated here rather than left for the reader to discover in a footnote.
How the 2025 base was constructed
| # | Revenue pool | Basis | 2025, USD m |
|---|---|---|---|
| 1 | Guardant Health, oncology | Disclosed | 683.6 |
| 2 | Natera, oncology | Estimated: 800,800 oncology tests at USD 950 realised | 760.8 |
| 3 | Exact Sciences, precision oncology | Disclosed | 717.0 |
| 4 | Tempus AI, diagnostics oncology share at 72% | Estimated split of disclosed USD 955.4m | 687.9 |
| 5 | NeoGenomics, oncology molecular share at 65% | Estimated split of disclosed USD 727m | 472.6 |
| 6 | Veracyte, Decipher and Afirma | Disclosed, summed | 483.6 |
| 7 | Myriad Genetics, tumour profiling | Disclosed | 121.7 |
| 8 | Roche, oncology-attributable molecular at 35% of CHF 2,527m converted at 1.2062 | Estimated split | 1,066.8 |
| 9 | QIAGEN, oncology-attributable | Estimated | 420.0 |
| Named total | 5,414.0 | ||
| Residual: unlisted and regional laboratory testing, private participants, other IVD suppliers | Estimated | 1,086.0 | |
| Total, 2025 | 6,500.0 |
Natera is the largest single estimate in the table. The company reports oncology test volume but does not disaggregate oncology revenue in its results release, so the row applies a realised average of USD 950 per oncology test to the disclosed 800,800 tests. A realised average of USD 800 would reduce the base by USD 120.5 million and a realised average of USD 1,100 would raise it by the same order; neither moves the CAGR by more than a few basis points.
The Roche row carries the largest single judgement. Molecular Lab is CHF 2,527 million at 4% growth in constant currency, which is USD 3,048 million at the 2025 average rate of 1.2062. A 35% oncology attribution produces USD 1,066.8 million. Roche does not disclose an oncology split, and the attribution is set to reflect a molecular base weighted towards viral load, donor screening and sexual health rather than to reflect Roche's undoubted strength in tumour profiling through Foundation Medicine. A 50% attribution would add USD 457 million to the base.
The segment build, and why the CAGR is higher than the first year
| Segment | 2025, USD m | Share | Growth 2026-2033 | 2033, USD m |
|---|---|---|---|---|
| Therapy selection and comprehensive profiling | 3,510 | 54.0% | 10.0% | 7,524.0 |
| Molecular residual disease and recurrence monitoring | 1,420 | 21.85% | 20.0% | 6,105.7 |
| Prognostic and diagnostic classifiers | 940 | 14.46% | 8.0% | 1,739.9 |
| Other oncology molecular: fusion, methylation, HRD, companion diagnostic kits | 630 | 9.69% | 12.0% | 1,559.9 |
| Total | 6,500 | 100% | 12.09% in 2026 | 16,929.5 |
The segment build produces a 12.09% growth rate in the first forecast year. The eight-year compound rate is 12.71%, and the 62 basis point difference is the whole point: the faster segments compound up in weight. Molecular residual disease is 21.85% of the base today and 36.1% of it in 2033, so a market that grows 12.09% in 2026 arrives at 12.71% compounded. A reader who checks the first-year growth rate against the headline will find a gap, and the gap is arithmetic rather than error.
What would change the number
- If molecular residual disease grows at 15% rather than 20%: the 2033 market falls to USD 15,167.6 million and the CAGR to 11.17%. This is the single largest sensitivity in the model, and it is where the competitive intensity is concentrated.
- If therapy selection grows at 7% rather than 10%: the 2033 market falls to USD 15,436.3 million and the CAGR to 11.42%.
- If the reimbursement code set is rebased downward after PAMA reporting resumes: the price line, which is already negative at 6.04% a year in the volume leader, accelerates. The model does not embed a price decline beyond the flat-to-negative realised price that participants actually reported in 2025, and a structural cut would take the CAGR below 10%.
The 12.71% figure is a revenue forecast. It is not a returns forecast, and the gap between the two - a market compounding at double digits while four of its six largest participants lose money - is the subject of the investment chapter.
Two companion analyses work through the findings this growth rate depends on. Six Per Cent of Price Is the Whole Growth Story tests the volume and price identity across every participant that discloses both lines, and shows that Guardant's 26% oncology revenue growth on 34% more tests closes only with a 6.04% fall in realised revenue per test: 1.34 multiplied by 0.9396 is 1.259. Coverage Is the Product, and the Panel Is the Overhead reads the same six participants' margins against the breadth of their menus, and finds that the company selling the single test a guideline requires earns per test what the company selling a platform does not.
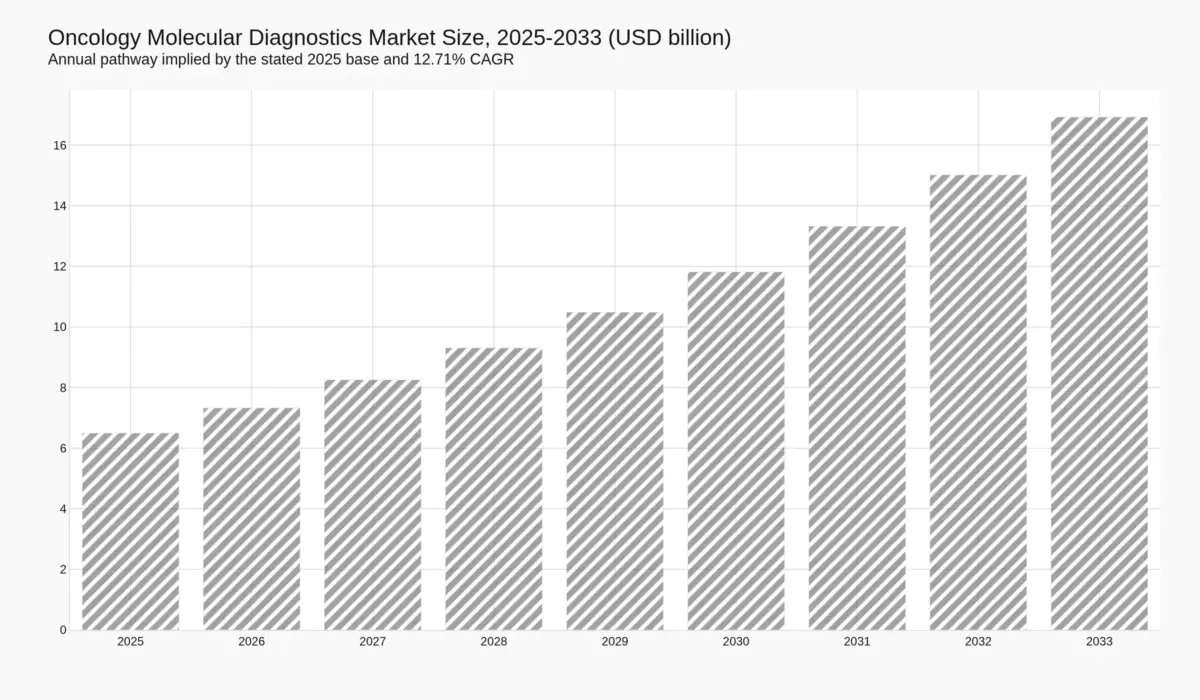
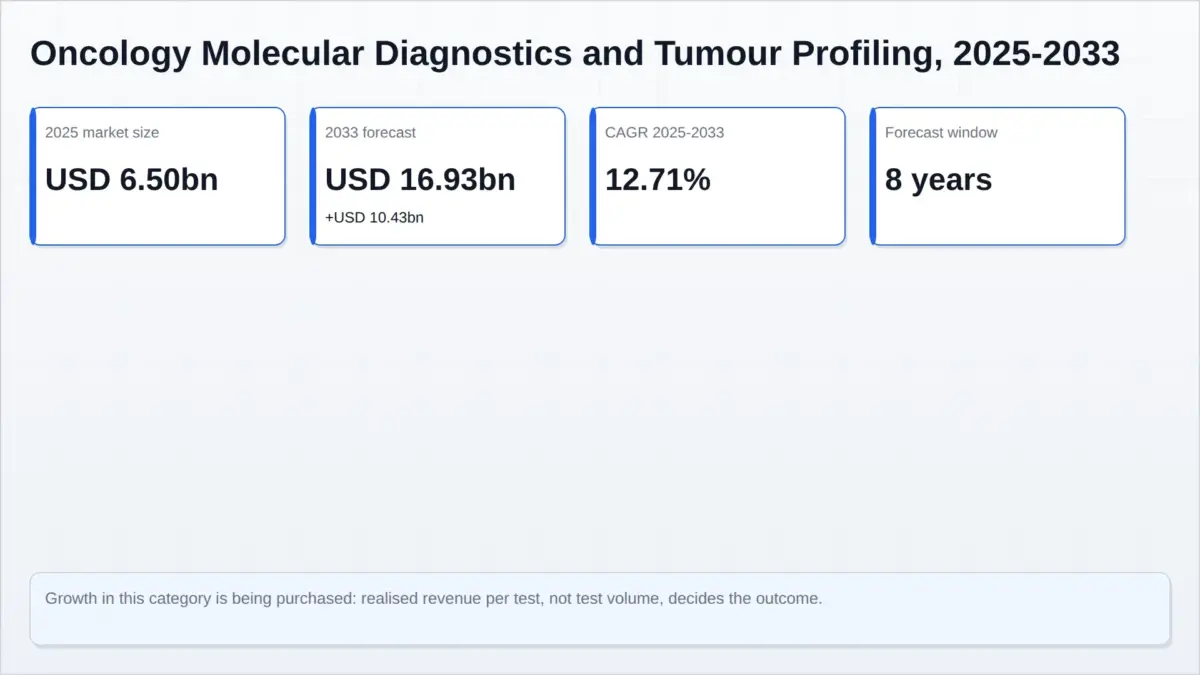
Table des matières
Table of Contents
- Market Forecast Snapshot, 2025-2033
- The thesis: nobody makes money on a discretionary panel
- The 2025 disclosures this report is built on
- Three findings that carry the forecast
- What is inside the perimeter, and why the level is where it is
- How the 2025 base was constructed
- The segment build, and why the CAGR is higher than the first year
- Competitive Landscape
- Value Chain and Margin Structure
- Technology Insight: Tissue, Blood and the Tumour-Informed Assay
- Investment and Capital Formation
- Market Risk Assessment
- Regulatory and Policy Environment
Paysage concurrentiel
Competitive Landscape
This market has twelve participants of tier-one scale and no concentration at the level of the technology. Every one of them can sequence a tumour. What is concentrated is the right to be paid for it, and that right is held by a code set, a coverage determination and a guideline rather than by a company.
Two layers that share a market and nothing else
Laboratory testing is where the revenue is recognised as a diagnostic result: Guardant Health, Natera, Exact Sciences, Tempus AI, NeoGenomics, Veracyte, Myriad Genetics and Foundation Medicine, which sits inside Roche Diagnostics. These businesses take a specimen, run an assay, interpret it and bill a payer. Their costs are specimen logistics, laboratory labour, sequencing consumables, interpretation, and a sales force that calls on oncologists. Their revenue is a fee per report.
Reagent and platform supply is where the tools come from: Roche, QIAGEN, Thermo Fisher, Illumina and Abbott sell panels, chemistries and instruments to laboratories that perform the test themselves, including the thousands of hospital laboratories that constitute most of this market’s 16.7% disclosure residual. Their costs are manufacturing and instrument placement. Their revenue is a price per kit and per flow cell, and it is not exposed to whether any individual patient’s claim is paid.
The two layers are commonly reported as one market and they have almost nothing in common commercially. A reagent supplier collects from a laboratory on terms. A laboratory collects from a payer on an adjudication, which is a fundamentally different risk. The margin structures below follow from that difference and not from anything about the assays.
The size ranking is not the growth ranking
| Participant | Attributed 2025, USD m | Share of base | Reported growth |
|---|---|---|---|
| Roche Diagnostics, oncology-attributable molecular | 1,066.8 | 16.4% | Molecular Lab +4% CER; Pathology Lab +14% CER |
| Natera, oncology | 760.8 | 11.7% | Oncology tests +51.6% |
| Exact Sciences, precision oncology | 717.0 | 11.0% | Total company +18% |
| Tempus AI, diagnostics oncology share | 687.9 | 10.6% | Oncology volume +26% |
| Guardant Health, oncology | 683.6 | 10.5% | Oncology revenue +26% |
| Veracyte, Decipher and Afirma | 483.6 | 7.4% | Testing revenue +18% |
| NeoGenomics, oncology molecular share | 472.6 | 7.3% | Clinical revenue +15% |
| QIAGEN, oncology-attributable | 420.0 | 6.5% | Group +5% CER |
| Myriad Genetics, tumour profiling | 121.7 | 1.9% | Tumour profiling -3% |
The largest participant is the slowest-growing and the second-largest is among the fastest. That is not a coincidence and it is not a comment on either company’s competence. It is what happens when one participant sells reagents to a laboratory and the other sells a monitoring relationship to a patient.
Why the largest participant is the least exposed
Roche’s oncology exposure is reported inside a Diagnostics division that reached CHF 13,847 million in 2025, up 2% at constant exchange rates and down 3% in Swiss francs. Within it, Molecular Lab grew 4% to CHF 2,527 million and Pathology Lab grew 14% to CHF 1,723 million, while Core Lab was flat and Near Patient Care fell 3%. Roche is simultaneously the largest participant in this market and the only one of scale that is comfortably profitable on the activity, and the reason is structural: it does not carry the collection, authorisation and bad-debt cycle that a laboratory carries. It also means Roche’s growth rate is a floor rather than a benchmark – a reagent franchise grows with installed base, where a laboratory grows with covered indications.
Two Roche figures deserve separate attention. Asia-Pacific fell 12% at constant exchange rates on healthcare pricing reforms in China, which is the single clearest evidence in this report that this market’s growth is administered rather than commercial. And Pathology Lab grew 14%, faster than any molecular line at Roche – a reminder that the oldest layer of the tissue diagnostic stack is compounding faster than the newest one.
The NeoGenomics problem
NeoGenomics is the purest expression of the tissue-profiling laboratory and the least profitable participant at scale. Revenue grew 10% to USD 727 million, clinical revenue grew 15%, and 13% excluding the Pathline acquisition. The company still reported a net loss of USD 108 million, 37% wider than the year before, on an adjusted EBITDA of USD 43 million – a 5.91% margin. It also resolved the RaDaR ST patent litigation and flagged an imminent clinical launch of that assay, which is the most consequential line in its release. A laboratory that adds a serial monitoring test is not adding a product; it is changing the shape of its revenue.
Tempus: a diagnostics business attached to a data business
Tempus reported diagnostics revenue of USD 955.4 million, up 111.5%, alongside oncology volume growth of 26% and hereditary volume growth of 29%. Those two facts cannot be reconciled from the disclosure, and the report does not pretend they can: more than doubling revenue on a quarter more volume means the difference is acquired or re-priced, and the release names only the Paige AI and OneOme acquisitions, neither of which is an oncology sequencing laboratory at that scale. What is not ambiguous is the second segment. Data and applications revenue reached USD 316.4 million, up 30.9%, with Insights up 38.0%, remaining total contract value above USD 1.1 billion and net revenue retention of 126%. The diagnostics arm is best understood as the specimen acquisition mechanism for the data arm – a different business from a laboratory that sells reports.
Guardant: the hedge is biopharma
Guardant’s oncology revenue of USD 683.6 million grew 26% on 276,000 tests. Alongside it, biopharmaceutical and data revenue reached USD 210.1 million, up 18% for the year but only 9% in the fourth quarter, which is a deceleration worth noting rather than smoothing. Screening contributed USD 79.7 million from roughly 87,000 Shield tests, and that line sits outside this market’s perimeter. Guardant’s exposure is the mirror image of Tempus’s: its data revenue is a smaller share of a larger diagnostics base, so the diagnostics price compression passes through its income statement more directly.
Where competition actually happens
Not on chemistry. Three assets decide the competitive order, and none of them is an assay. The coverage determination creates and defines a market: Medicare covers Natera’s Signatera under LCD L38779 across colorectal, breast, bladder, ovarian and lung cancer and for pan-cancer immunotherapy monitoring, and that list is a more valuable asset than the assay chemistry it describes. The guideline decides whether a test is discretionary: Decipher grew 27% because a recommendation made it standard, and a broad panel that no guideline names grows by persuasion instead. The specimen decides who can sell anything at all: a tissue block that has already been consumed for diagnosis cannot be profiled, which is why the blood-based assays and the tissue-based assays are complements fought over as substitutes.
Molecular residual disease is the contested ground, and it is where the 20% growth assumption in this forecast is either earned or lost. Natera processed 800,800 oncology tests in the year. NeoGenomics is launching RaDaR ST. Guardant has a Reveal franchise and a biopharma relationship to support it. The competitive advantage in that fight is the one Natera already holds – a coverage determination – and the reason it matters more than the assay is that a payer will cover one MRD test and not three.
Chaîne de valeur
Value Chain and Margin Structure
The value chain in oncology molecular diagnostics runs from a patient’s tumour to a payer’s adjudication, and every margin in this market is decided in the last step. No participant sets a price. A procedure code establishes that a billable service exists, a fee schedule sets what Medicare pays, and a coverage policy decides whether it pays at all.
The chain, in order
Specimen. A tissue block from a resection or biopsy, or a blood draw. The tissue route consumes a physical object that pathology may have already used, and the blood route consumes nothing that cannot be repeated. Everything downstream inherits that constraint.
Laboratory. Extraction, library preparation, sequencing or hybridization, bioinformatic interpretation and a signed report. This is where costs are incurred: consumables, instrument depreciation, labour and a variant-curation function that is the least visible and most expensive part of the operation.
Ordering clinician. Oncology ordering is concentrated in a relatively small number of treaters, which is why the selling cost in this market is unusually high relative to manufacturing cost.
Payer. A coverage policy, a code, a rate and a prior authorisation. A test without a covered indication is not a discounted product; it is an unbillable one.
Gross margins cluster; operating margins do not
| Measure | 2025 | What it measures |
|---|---|---|
| Natera, gross margin | 64.7% (60.3% in 2024) | Cost of processing a test at volume |
| Tempus, diagnostics gross margin | 59.59% (revenue USD 955.4m less cost of revenue USD 386.1m) | Cost of a diagnostics operation |
| Myriad, gross margin | 70.0% in Q4 2025 | Mature, small-volume assay economics |
| Veracyte, adjusted EBITDA margin | 27.6% | What survives the operating cost base |
| Veracyte, GAAP net margin | 12.8% | What survives everything |
| NeoGenomics, adjusted EBITDA margin | 5.91% (USD 43m on USD 727m) | What survives a broad menu |
The gross margin spread across these participants is about ten points, from 59.59% to 70.0%. The operating spread is the difference between a 27.6% adjusted EBITDA margin and a 5.91% one, and the net spread is the difference between USD 66.4 million of profit and USD 108 million of loss. Manufacturing cost does not explain that dispersion, because the manufacturing is not what varies. What varies is the cost of getting a covered order.
Tempus discloses the number that makes this concrete. It spent USD 731.7 million of selling, general and administrative expense against USD 1,271.8 million of revenue – 57.5% of every dollar. That is the price of selling a menu to oncologists one account at a time. Veracyte, selling two tests that guidelines name, spends a fraction of that proportion and keeps the difference.
The mechanism that sets price: the ADLT window
The most important piece of value-chain mechanics in this market is buried in a payment rule rather than in a product. Under the Protecting Access to Medicare Act, a new Advanced Diagnostic Laboratory Test is paid at its own list charge for an initial period of three calendar quarters. After that, payment reverts to a rate derived from a volume-weighted median of private payor rates reported to CMS. Natera’s Signatera holds ADLT status, and the company states this plainly in its filings.
That is a legislated price holiday followed by a reversion, and its commercial consequence is directional: the first year of a new serial test is priced at list, and every year afterwards is priced at a market-derived median. For a one-shot profiling panel, the reversion is a permanent step down in the economics of the product. For a serial monitoring test, the reversion is absorbed because the patient remains on test, and the installed base keeps compounding volume at the reverted price. The ADLT mechanism therefore advantages exactly the business model this report argues is the only profitable one.
PAMA’s reporting requirements have been suspended since 2021 and were most recently delayed until 2027. The effect is that the clinical laboratory fee schedule has not been rebased downward, and every price in this market currently contains that deferral. It is the largest single policy exposure in the forecast, and it is a timing question rather than a direction question: when reporting resumes, the rate is defined as a median of commercial rates, and commercial rates for molecular testing are not systematically above the Medicare rate.
Where the margin actually accrues
Revenue per test is the cleanest available measure of what the chain pays for, because it nets out volume. Guardant realised about USD 2,476 per oncology test in 2025 against USD 2,635 in 2024. Veracyte realised about USD 2,906 per testing test, with Decipher at roughly USD 3,046 across 102,000 tests and Afirma at roughly USD 2,554 across 67,700. Natera’s oncology realised revenue is not disclosed and this report estimates it at USD 950 per test – a materially lower figure, and the right one for a serial assay that a patient receives several times a year.
Read together, those figures say something the headline growth rates hide. The highest price per test in this market belongs to the single-question classifier, the lowest to the serial monitoring assay, and the serial monitoring assay is the one whose volume is compounding at 51.6%. Value in this chain does not accrue to the test that costs the most. It accrues to the test that is ordered most often, and the payer has already decided which one that will be.
Two elements of the chain are not quantifiable from disclosure and are named here rather than estimated: the cost of prior authorisation and denial management, and the bad debt carried on self-pay and denied claims. Both are real, both are larger in the United States than in any other market, and no participant reports them separately.
Activité d'investissement
Investment and Capital Formation
This market compounds at 12.71% a year and is funded largely by equity. That combination is the defining capital fact of the category, and it explains why so much strategic money has moved into annotation rather than into laboratories.
Who actually generates cash
| Participant | 2025 cash measure | Net result |
|---|---|---|
| Exact Sciences | Operating cash flow USD 491m; free cash flow USD 357m | Net loss USD 208m; adjusted EBITDA USD 400m |
| Veracyte | Operating cash flow USD 136.3m; cash and short-term investments USD 412.9m | Net income USD 66.4m |
| Natera | Positive cash inflow USD 107.6m | Net loss USD 208.2m |
| Tempus AI | Adjusted EBITDA negative USD 7.4m | Net loss USD 245.0m |
| Guardant Health | Free cash flow negative USD 233m, improved from negative USD 275m | Not reported as profitable |
| NeoGenomics | Adjusted EBITDA USD 43m | Net loss USD 108m |
Two participants generated positive free cash flow and both did it on the same model: a test that is repeated or programme-driven. Exact Sciences’ USD 357 million of free cash flow comes from a screening franchise of USD 2.53 billion, not from its USD 717 million precision oncology line. Veracyte’s USD 136.3 million of operating cash comes from two guideline-embedded classifiers. Natera converted a USD 208.2 million net loss into a USD 107.6 million cash inflow, which is what happens when a gross margin rises 4.4 points on 36% revenue growth and the working capital follows. The pattern is consistent enough to state as a rule: in this market, cash comes from repetition, and repetition comes from a guideline or a monitoring schedule.
What the losses are actually spent on
The losses in this category are not research losses. They are commercial ones. Tempus carried USD 731.7 million of selling, general and administrative expense in 2025 and USD 172.9 million of research and development expense – a ratio of better than four to one in favour of selling. It also carried USD 70.3 million of interest expense and a USD 12.0 million loss on debt extinguishment, which is the signature of a company that has funded growth with convertible debt as well as equity. Guardant’s cash burn improved by USD 42 million year on year while its oncology revenue grew 26%, which is the correct direction and still leaves it dependent on capital markets.
That has a direct consequence for how this market should be valued. A 12.71% revenue forecast is a statement about demand. It is not a statement about returns, and the record of 2025 is that demand grew at double digits while four of six large participants lost money. The variable that separates the participants is not growth. It is the ratio of covered, repeatable revenue to the cost of acquiring it.
What strategic capital is buying
The transactions in this market are more informative than the valuations. Tempus acquired Paige AI, a computational pathology business, and OneOme, a pharmacogenomics business. Neither is a sequencing laboratory; neither adds specimen volume at scale. Both add annotation – the interpretation layer that sits on top of a specimen someone else already processed. NeoGenomics absorbed Pathline and reported clinical growth of 13% excluding it. Veracyte liquidated its French subsidiary, with biopharmaceutical and other revenue falling to USD 9.7 million from USD 13.2 million. Myriad Genetics sold its international EndoPredict business in August 2024, which is why its tumour profiling line declined 3% to USD 121.7 million. NeoGenomics settled its RaDaR ST patent litigation rather than fight it to judgment.
The pattern is selective rather than consolidating. Nobody is buying laboratories to get scale in tissue processing, because tissue processing is not where the scarcity is. The scarcity is in the interpretation layer and in the reimbursement right, and the first can be bought while the second has to be earned through evidence. That is why Tempus bought Paige and OneOme and why the same company reports net revenue retention of 126% on its data segment: the annotation layer is where pricing power survives.
Capital intensity and the return problem
Capital intensity in this market is moderate and falling. A sequencing laboratory is not a fab; the instruments are placed or leased, the consumables are bought as used, and the marginal cost of an additional test is dominated by reagents and labour rather than by capacity. What is expensive is the evidence programme – the trials, the publications, the health-economic models and the guideline submissions that precede a coverage determination. That is a fixed cost paid before any revenue exists, and it is the real barrier to entry.
The return problem follows directly. A participant must fund the evidence programme for an assay before it knows whether a payer will cover it, and if coverage arrives with a restricted indication the addressable population may be a fraction of the tested population. The ADLT three-quarter list-charge window then reprices the test to a commercial median. The result is a category in which the revenue line and the return line diverge, and in which the participants most likely to earn a return are those whose assays require the least persuasion – which is to say, the ones a guideline already names.
For a strategic acquirer the implication is that a molecular diagnostics asset should be underwritten on its coverage position rather than on its growth rate. For an investor, the observable that matters is the direction of realised revenue per test. Four of the five participants that disclose both revenue and volume reported a flat or declining realised price in 2025. That is the number to watch, and it is the number this report’s 12.71% forecast is deliberately built on top of rather than around.
Technologie et innovation
Technology Insight: Tissue, Blood and the Tumour-Informed Assay
Four assay architectures do the work in this market, and they are not successive generations of one another. They answer different questions and they carry different constraints, which is why they grow at different rates and why a technology view alone will not explain the forecast.
Architecture one: tissue comprehensive profiling
A section of the diagnostic block is sequenced across a panel of genes – commonly tens to hundreds – to identify the somatic variants that make a tumour eligible for a targeted therapy. Its output is a report that an oncologist uses once, to choose a first-line regimen. Its constraint is physical: the block may have been exhausted by diagnostic immunohistochemistry, may be decades old, may be fixed in a way that degraded the nucleic acid, or may simply not exist if the diagnosis was made on a fine-needle aspirate. The tissue assay consumes the specimen that pathology holds, and that single fact governs the commercial relationship between the tissue laboratory and the hospital pathologist.
Architecture two: blood-based profiling
Cell-free DNA from a plasma draw is sequenced for the same purpose. It removes the specimen constraint entirely, which is its entire commercial proposition. It pays for that with sensitivity: circulating tumour fraction can be very low in early-stage or low-burden disease, so a negative result is less informative than a positive one, and the assay is most useful where disease burden is highest. The tissue and blood assays are therefore complements sold as substitutes, and the substitution is decided by whether the block is usable rather than by which assay performs better.
Architecture three: the tumour-informed MRD assay
This is the architecture that changes the shape of the market, and Natera’s Signatera is the clearest specification of it in public disclosure. A bespoke assay is built for each patient from the mutational signature found in that patient’s own tumour tissue. The assay then tracks those specific clonal variants in blood, at a stated sensitivity down to a sample-level average variant allele frequency of 0.0002%. It is not a therapy-matching test and Natera says so explicitly: it does not screen against a generic panel, because its purpose is to measure how much disease remains rather than to identify a drug.
Three consequences follow, and they are commercial rather than technical. First, the assay is repeatable: the same bespoke build is run on successive blood draws, which is precisely the annuity structure the value chain chapter identifies as the only profitable one. Second, it is coupled to tissue: the bespoke build requires the patient’s tumour, so the profiling test and the monitoring test are sold into the same episode of care, and the tissue laboratory has a structural advantage in capturing both. Third, its evidence burden is different: a monitoring assay must demonstrate that detecting residual disease changes an outcome, which is a longer and more expensive trial than showing that a variant predicts drug response.
Natera has since extended the architecture to a genome-based version, Signatera Genome, covered by Medicare under the same coverage determination, LCD L38779, as the original assay. The coverage mirrors the parent product across colorectal, breast, bladder, ovarian and lung cancer and pan-cancer immunotherapy monitoring. At the 2025 ASCO meeting the company presented a pan-cancer study of 392 patients across more than 2,600 samples. The technology rests on a multiplex PCR and sequencing approach rather than on whole-genome sequencing, which is a deliberate cost choice: the assay interrogates a small number of variants at very high depth rather than a large number at low depth.
Architecture four: expression and methylation classifiers
A genomic classifier does not look for a mutation. It measures a pattern – gene expression or methylation – and returns a risk category or a diagnostic call. Decipher answers whether a prostate tumour is aggressive enough to need adjuvant treatment, and it grew 27% to USD 310.7 million on roughly 102,000 tests. Afirma resolves indeterminate thyroid nodules and grew 9% to USD 172.9 million. These assays are cheap relative to sequencing panels, they answer a fixed question, and their volume is bounded by the incidence of a single cancer rather than by the number of drugs approved against it.
Why the technology is not the constraint
The sequencing problem is largely solved. Roche reports that its next-generation sequencing technology decoded an entire human genome in under four hours in 2025, and the company launched 53 new tests across its diagnostics portfolio with research activity concentrated in high-medical-value oncology assays. Instrument throughput and reagent cost are no longer what limits the market.
What limits the market is demonstration. Natera’s filings cite more than 350 peer-reviewed publications and more than 100 published clinical studies supporting Signatera, plus Breakthrough Device Designations covering several applications. That body of evidence is what produced a Medicare coverage determination spanning six clinical settings, and the coverage determination is what produces revenue. The same pattern holds across the category: the assays are technically comparable, and the ones that are paid for are the ones with the trials behind them.
That is why the 12.71% forecast does not depend on a technology step change. It depends on the installed base of covered indications expanding, which is an evidence-generation and reimbursement process with a multi-year lead time and a known cost. The technology risk in this market is not that the assays stop working. It is that a competitor’s assay works equally well and is covered first.
One genuine technical substitution risk sits at the end of the forecast window. A tumour-naive MRD assay – one that screens a generic variant set in blood without a bespoke build from tissue – would remove the tissue dependency that currently couples the profiling test to the monitoring annuity. That would not shrink the market. It would redistribute it away from the participants whose advantage rests on holding the block, and toward whoever can run a monitoring test without one.
Risque de marché
Market Risk Assessment
The risks that decide this market are administrative rather than clinical. The assays work. What can remove revenue is a fee schedule, a coverage policy, a coding decision or a change in the regulatory status of a laboratory-developed test – and every one of those is decided by an institution rather than by a competitor.
Risk one: the fee schedule has not been rebased since 2021
Under the Protecting Access to Medicare Act, the clinical laboratory fee schedule is meant to be set from a volume-weighted median of private payor rates reported by laboratories. That reporting has been suspended since 2021 and was most recently delayed until 2027. Natera states the position plainly in its annual report: the suspension has not resulted in rate reductions under the Medicare Part B schedule.
Every price in this market therefore contains a deferral, and the deferral is worth more than any individual product’s growth rate. When reporting resumes, rates become a function of commercial pricing rather than of the administered schedule, and the direction is not guaranteed to be upward. The statutory cap that limits how far the schedule can fall in a single year dampens the move but does not prevent it: a cap converts an abrupt repricing into a staged one, and a staged repricing is worse for a forecast because it persists.
This is the largest single risk to the 12.71% figure. The model embeds the flat-to-negative realised price that participants actually reported in 2025. It does not embed a structural cut, and a structural cut would take the eight-year CAGR below 10%.
Risk two: realised price is already falling
Guardant’s realised oncology revenue per test fell 6.04% in 2025 while volume grew 34%. Veracyte’s testing revenue per test fell 1.09% while volume grew 19%. Myriad’s tumour profiling revenue fell 3% while Prolaris volume rose 12% in the fourth quarter. That is not a forecast; it is what four participants reported in the base year, and the forecast assumes it stops rather than worsens. Growth in this market is a volume phenomenon and the price line is a policy variable, not a commercial one.
Risk three: coverage is concentrated in a handful of documents
A molecular test’s revenue depends on a coverage determination that names the clinical settings in which it is paid for. Signatera’s Medicare coverage runs through LCD L38779 across colorectal, breast, bladder, ovarian and lung cancer and pan-cancer immunotherapy monitoring. That single document is a larger asset than the assay it describes, and its revision in either direction moves revenue immediately. A participant with one covered indication is a participant with one policy risk.
The concentration is not only institutional but geographic. Asia-Pacific fell 12% at constant exchange rates at Roche on healthcare pricing reforms in China – a pricing decision taken in one jurisdiction that removed several hundred million francs of growth from the largest participant in the market. Nothing about the assays changed.
Risk four: the regulatory status of the test is not settled
Most tests in this market are laboratory-developed tests performed in CLIA-certified, CAP-accredited laboratories rather than devices with marketing authorisation. That status was contested. A rule issued on 6 May 2024 would have phased laboratory-developed tests into device regulation; it was vacated on 31 March 2025, and the agency reverted to its pre-2024 framework on 19 September 2025. The question is therefore open rather than closed, and the consequence of a future re-regulation is not trivial: a device pathway would add premarket review, quality system obligations and a per-assay timeline to a business that currently launches tests into its own laboratory.
This is the risk most likely to be underestimated by a reader who assumes the United States regulates diagnostics the way it regulates drugs. It does not, and the reason the market has twelve fast-moving participants rather than four is precisely that the barrier is a validation study rather than a premarket approval.
Risk five: molecular residual disease is crowded and the payer will not cover three tests
The 20% growth assumption for molecular residual disease carries the forecast, and it is the most contested segment in the market. Natera processed 800,800 oncology tests in 2025 on a covered, ADLT-status product with a six-indication coverage determination. NeoGenomics has resolved its RaDaR ST patent litigation and flagged an imminent clinical launch. Guardant has a Reveal franchise and a biopharma relationship behind it.
Three credible entrants do not triple the market for a monitoring assay. A payer that has covered one MRD test for a given cancer type has little reason to cover a second, so competition in this segment is competition for a coverage slot rather than for share within one. If residual disease growth lands at 15% rather than 20%, the 2033 market is USD 15,167.6 million and the CAGR 11.17% – and that is the arithmetic of a segment where the second and third entrant do not get paid.
Risk six: the participants depend on capital markets
Four of the six largest participants reported a net loss in 2025 and the two largest cash generators derive their cash from screening and from guideline-embedded classifiers rather than from broad profiling. A sustained contraction in equity or convertible financing would not change clinical demand, but it would change who can fund an evidence programme – and the evidence programme is the entry ticket to coverage. Capital availability is therefore a competitive variable in this market in a way that it is not in a market where participants fund themselves from operations.
Risk seven: substitution decouples the profiling test from the monitoring annuity
The commercial logic of the category rests on a coupling: the tissue profiling test consumes the block, the monitoring test needs that block to build a bespoke assay, and the laboratory that holds the block can sell both. A tumour-naive monitoring assay that screens a generic variant set in blood would break that link. It would not shrink the market, but it would move value away from the participants whose position depends on holding the specimen.
What is not a risk
Sequencing cost. Roche’s sequencing technology decoded an entire human genome in under four hours in 2025, and panel costs have fallen far enough that reagent price is not the constraint on demand. The constraint is the willingness of a payer to pay for the answer, and no reduction in sequencing cost changes that.
Overall market risk assessment: high. The growth forecast is well supported by disclosed volume, but the revenue line is exposed to an administered price, a concentrated coverage base, an unsettled regulatory classification and a segment where growth depends on a payer declining to cover competitors. Each of those is a policy variable, and policy variables move in both directions.
Paysage réglementaire
Regulatory and Policy Environment
This market is regulated as a laboratory service rather than as a device, and that single fact explains its structure.
The operative framework
Laboratory certification. Tests are performed in CLIA-certified, CAP-accredited laboratories. Validation is the laboratory’s own obligation; there is no premarket review of an assay’s clinical validity by a regulator before it is sold.
Coding and pricing. A procedure code establishes that a billable service exists. Payment follows the clinical laboratory fee schedule, which PAMA requires to be derived from a volume-weighted median of private payor rates. Reporting requirements have been suspended since 2021 and delayed until 2027, so the schedule has not been rebased.
Coverage. A local coverage determination names the clinical settings in which Medicare pays. This is the binding constraint on revenue, and it is a document rather than a clearance. Signatera’s coverage runs through LCD L38779 across colorectal, breast, bladder, ovarian and lung cancer and pan-cancer immunotherapy monitoring.
Advanced Diagnostic Laboratory Test status. A new ADLT is paid at its own list charge for an initial period of three calendar quarters, after which payment reverts to the PAMA-derived median. The mechanism front-loads price for a new serial test and then reprices it.
Device pathway where a drug label requires it. A companion diagnostic tied to a specific therapy follows the device route. This is why the tissue-profiling and companion-diagnostic reagent businesses look different from the laboratory businesses in the same market.
Laboratory-developed test rule. A rule issued on 6 May 2024 that would have phased laboratory-developed tests into device regulation was vacated on 31 March 2025, and the agency reverted to its pre-2024 framework on 19 September 2025. The classification is settled for now and not settled permanently.
The practical consequence is that the barrier to entry in this market is an evidence programme followed by a coverage submission, not a regulatory approval. That is a cheaper barrier than a device pathway and a slower one than a product launch, and it is why the participants who lead are the ones with the longest publication record rather than the best instrument.