
Global Diagnostic Tests Market Size, Share, Trends and Forecast 2026-2033
| Metric | Value |
|---|---|
| Market Size (2025) | USD 118.60 Billion |
| Market Size (2033) | USD 197.85 Billion |
| CAGR (2026-2033) | 6.60% |
| Largest Segment | Clinical Laboratory Testing |
| Fastest Growing Segment | Molecular Diagnostics |
| Leading End-Use Segment | Hospitals and Diagnostic Laboratories |
| Key Trend | Syndromic multiplex panels, installed-base reagent annuities and laboratory automation |
| Regulatory Influence | EU IVDR transition deadlines, US CLIA/LDT settlement and CMS clinical laboratory payment reform |
| Future Outlook | Volume growth partially offset by test-price deflation in China and capped US reimbursement |
What this report argues
The global diagnostic tests market was worth USD 118.60 billion in 2025 and is forecast to reach USD 197.85 billion by 2033, a compound annual growth rate of 6.60%. That headline number is not the interesting part. The interesting part is that the growth is being delivered by a shrinking subset of the market while the largest segment by revenue grows at roughly nothing.
This report is built on the 2025 audited results of the six largest listed diagnostics businesses, because in a market this disaggregated the company filings are the only reliable disaggregation. Read together they say something the aggregate forecast conceals: clinical chemistry and immunoassay - the reagent annuity that funds the entire industry - has stopped growing in real terms, while molecular, pathology and syndromic testing grow at high single to low double digits. Roche's Diagnostics Division grew 2% at constant exchange rates to CHF 13.8 billion in 2025, but its Core Lab customer area grew 0%, its Near Patient Care area fell 3%, and its Pathology Lab area grew 14%. That is not a market growing at 6.60%. It is four markets with different economics bundled into one line item.
The second argument is that price, not technology, is the binding constraint. Three of the six largest players independently identified the same drag on 2025 revenue: healthcare pricing reform and volume-based procurement in China. Roche's Asia-Pacific diagnostics sales fell 12% at constant exchange rates on it. Abbott cited volume-based procurement programmes as the reason growth in other geographies failed to offset China. bioMerieux reported a double-digit decline in China. When the same exogenous, administratively set price shock shows up in three unrelated income statements in the same year, it belongs in the forecast as a structural feature rather than a one-off.
The third argument is that reimbursement, not regulatory approval, decides which tests exist commercially. Two 2025 events settled the US position: the Food and Drug Administration's laboratory developed test rule was vacated by a federal district court on 31 March 2025 and formally removed from the regulation on 19 September 2025, and the 2026 appropriations package revised clinical laboratory fee schedule data reporting while delaying the private-payor rate phase-in. Neither event changed what a laboratory is technically permitted to run. Both changed what it gets paid for running.
The fourth argument concerns where the money actually sits. Across the six majors, diagnostics operating margins in 2025 ranged from roughly 7.5% to 29.5% - a spread of 22 percentage points that cannot be explained by instrument capability, since all six sell broadly comparable analysers. It is explained by menu breadth, installed-base density and the ratio of reagent revenue to instrument revenue. Every strategic move in the market in 2025 and early 2026 - Agilent's USD 950 million agreement to acquire Biocare Medical explicitly framed as improving its non-instrument revenue mix, bioMerieux's 6,400-unit SPOTFIRE installed base, QIAGEN's disposal of NeuMoDx - is a move on that ratio.
How 2025 actually broke down
The table below states each company's own reported figures in its own reporting currency. The figures are not additive and are not converted: the point is the direction and the mix, not a synthetic total.
| Company | 2025 diagnostics revenue | Reported growth | Margin signal |
|---|---|---|---|
| F. Hoffmann-La Roche | CHF 13,847 million | +2% CER, -3% in CHF | Operating margin 7.7%, down from 13.6% |
| Abbott Laboratories | USD 8,937 million | -3.6% organic in Q4, -0.2% excluding COVID-19 testing | Core Lab +3.6% organic; Rapid Diagnostics -17.8% reported in Q4 |
| Danaher Corporation | USD 9,941 million | +1.6% in USD | Operating margin 26.7% |
| Thermo Fisher Scientific | USD 4,676 million (Specialty Diagnostics) | +3.6% in USD | Segment income margin 26.9% |
| QIAGEN | USD 2,090 million | +5% CER | Adjusted operating margin 29.5%, up 80 basis points |
| bioMerieux | EUR 4,070 million | +6.2% organic | SPOTFIRE revenue EUR 168 million, up 84% |
Danaher's diagnostics business is instructive because of its scale relative to its parent: at USD 9,941 million it represented 40.5% of group revenue in 2025, and it carried the highest reported segment operating margin in the peer set at 26.7%. That margin is a function of Cepheid's consumable-led cartridge model and Beckman Coulter's installed base, not of any unique diagnostic capability. The same logic explains why QIAGEN, at less than a quarter of Danaher's diagnostics revenue, reports a higher adjusted operating margin: sample preparation and consumables carry different economics to instruments.
Scope and definitions
This report covers in vitro diagnostic testing sold to hospitals, reference and specialty laboratories, physician offices and, increasingly, near-patient and home settings. It includes clinical chemistry, immunoassay, hematology, microbiology, molecular diagnostics including PCR and sequencing-based tests, rapid and point-of-care tests, and the pathology and digital pathology workflows that sit alongside them. Imaging modalities are treated as an adjacent market and referenced only where they compete for the same diagnostic pathway.
Reagents, consumables, service and instrument placement revenue are counted where the company reports them within a diagnostics segment. Figures are value-denominated. This report deliberately publishes no global test-volume series: there is no defensible common unit across a chemistry panel, a sequencing run and a lateral flow cassette, and constructing one would produce a number with no operational meaning.
Where to read next
Two adjacent Pheonix Research reports carry the technology detail this report deliberately does not repeat. The global next-generation sequencing market report covers the sequencing layer, its instrument economics and its competitive structure. The point-of-care testing market report covers the decentralised channel and the near-patient price dynamics discussed in Chapter 2.
For the demand-side and operating context, see the clinical laboratory services market report and, for the workflow layer, the digital pathology market and histopathology market reports.
Companion analysis from Pheonix Research: The Reagent Is the Business, on why Roche's diagnostics margin halved while cost of sales rose 10 percent at constant currency, and why instrument placements are a cost rather than revenue; and Fifteen Per Cent a Year, on the clinical laboratory fee schedule, the vacated LDT rule and the IVDR transition dates.
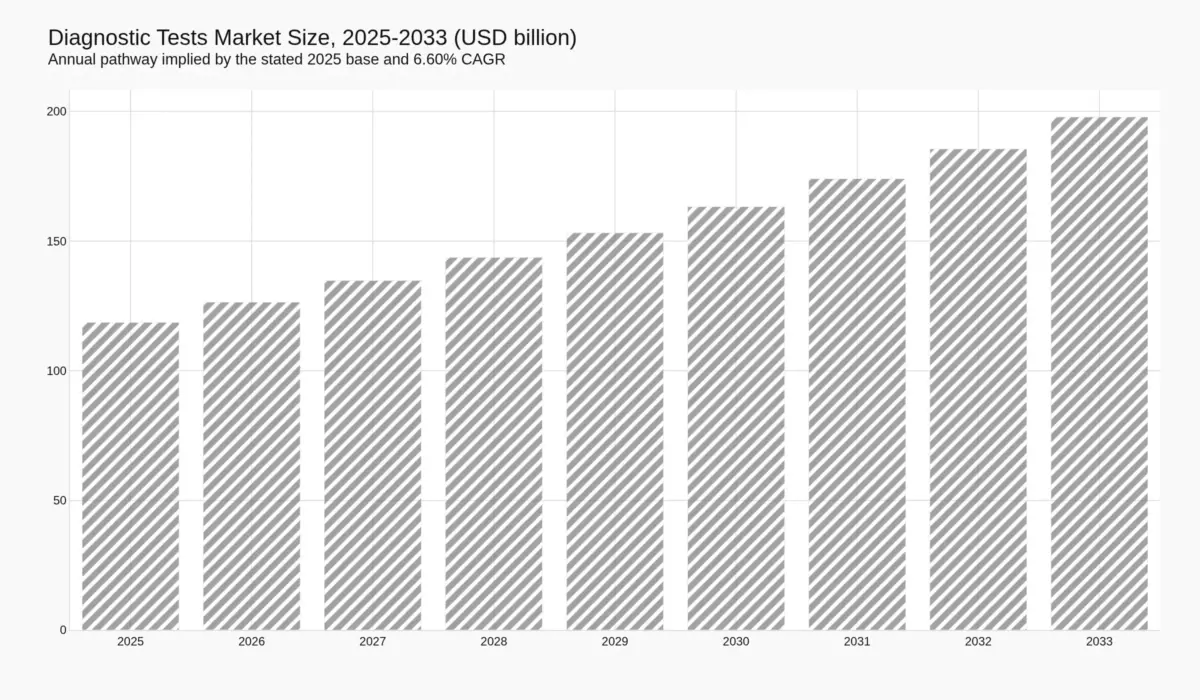
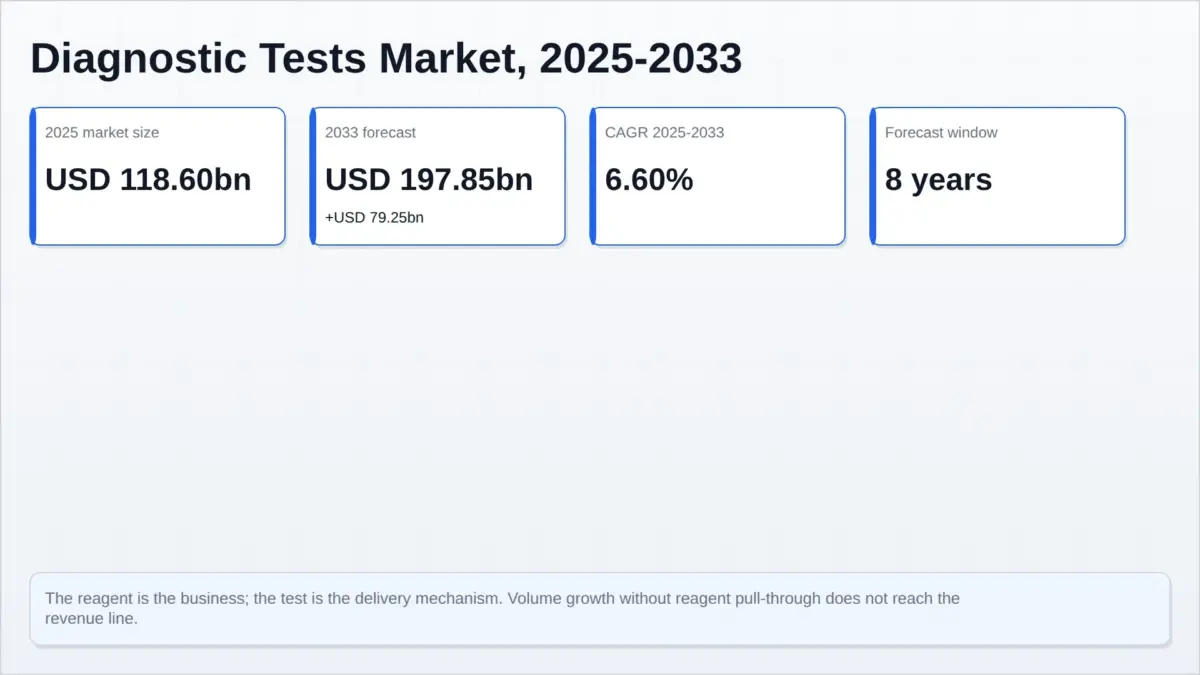
Table of Contents
1. Competitive Landscape and Market Structure
1.1 The six majors and what their 2025 filings actually say
1.2 Core lab versus molecular versus pathology: the mix problem
1.3 Margin dispersion as the real competitive scoreboard
1.4 China procurement reform as a structural, not cyclical, shock
1.5 Consolidated or fragmented? A segment-level answer
2. Value Chain and Laboratory Economics
2.1 Six stages, from antigen supply to clinical decision
2.2 The instrument placement model and the reagent annuity it creates
2.3 Quantifying pull-through: SPOTFIRE, BIOFIRE and the installed base
2.4 Labour as the binding operational constraint
2.5 Tender-driven and fee-for-service channels
3. Technology and Innovation Landscape
3.1 Automation and menu breadth in the core laboratory
3.2 Syndromic multiplex molecular testing
3.3 Decentralisation and the near-patient revenue paradox
3.4 Digital pathology and the sequencing layer
3.5 Why validation, not instrument capability, sets the adoption rate
4. Regulatory and Reimbursement Framework
4.1 United States: the LDT rule, its vacatur and the settlement of the lab channel
4.2 European Union: IVDR transition deadlines to 2027-2029
4.3 The clinical laboratory fee schedule and the 2027-2029 reduction cap
4.4 China: volume-based procurement and administratively set test prices
4.5 Coverage as the commercial gate
5. Investment, Capital and Consolidation
5.1 Diagnostics capital intensity and where 2025 capital went
5.2 Menu acquisition: the Biocare and Parse transactions
5.3 Portfolio pruning and discontinued platforms
5.4 Installed-base placement as capex-light annuity building
5.5 What 2026 guidance says about reinvestment
6. Risks and Disruption Threats
6.1 Eight risks, each with its transmission channel
6.2 Price and reimbursement risk
6.3 Supply chain, tariffs and input cost
6.4 Technology substitution and the near-patient price effect
6.5 What would break the 6.60% forecast
Competitive Landscape
Competitive Landscape and Market Structure
Aggregate forecasts treat the diagnostic tests market as a single competitive arena. It is not. It is a set of adjacent businesses that share a customer – the laboratory – and compete for the same capital budget, but which have different growth rates, different margin structures and different barriers to entry. The 2025 filings of the six largest listed diagnostics companies allow that structure to be measured directly rather than inferred, and what they show is a market in which the revenue base and the growth engine have come apart.
1.1 The six majors and what their 2025 filings actually say
F. Hoffmann-La Roche remains the largest pure diagnostics franchise in the peer set. Its Diagnostics Division recorded CHF 13,847 million in 2025, up 2% at constant exchange rates but down 3% in Swiss francs, and those two numbers sitting side by side are the cleanest illustration of how much currency is doing in this market. Diagnostics accounted for 22.5% of group sales of CHF 61,516 million. Within the division, the customer-area split is the important disclosure: Core Lab CHF 7,614 million (55.0% of diagnostics sales, 0% at CER), Molecular Lab CHF 2,527 million (18.3%, +4% CER), Near Patient Care CHF 1,983 million (14.3%, -3% CER) and Pathology Lab CHF 1,723 million (12.4%, +14% CER).
Abbott Laboratories reported full-year 2025 Diagnostics sales of USD 8,937 million within group sales of USD 44,328 million, split between Core Laboratory at USD 5,360 million, Rapid Diagnostics at USD 2,454 million, Point of Care at USD 606 million and Molecular at USD 517 million. Fourth-quarter diagnostics sales of USD 2,457 million fell 2.5% on a reported basis, 3.6% organic and 0.2% excluding COVID-19 testing-related sales, which had fallen to USD 89 million in the quarter from USD 176 million a year earlier. Abbott’s disclosed full-year COVID-19 testing revenue of USD 297 million is now small enough that the pandemic comparison has almost fully washed out of the base, which is exactly why the underlying -3.6% organic print matters more than it looks.
Danaher reported Diagnostics sales of USD 9,941 million against USD 9,787 million in 2024, an increase of 1.6% calculated from the company’s own segment table, and diagnostics operating profit of USD 2,650 million at a 26.7% margin against 26.8% a year earlier. At 40.5% of group revenue, diagnostics is Danaher’s second-largest segment behind Life Sciences, and its margin is the highest reported segment margin among the six. Thermo Fisher Scientific‘s Specialty Diagnostics segment reached USD 4,676 million, up 3.6% from USD 4,512 million, with segment income of USD 1,256 million at a 26.9% margin, improved from 25.7%.
QIAGEN generated USD 2,090 million of net sales, up 6% at actual rates and 5% at constant exchange rates, and lifted its adjusted operating income margin 80 basis points to 29.5% despite tariffs and currency headwinds. bioMerieux reported sales of EUR 4,070 million, up 6.2% organically, with its four GO-28 growth drivers up 9.4% organically. Siemens Healthineers, whose fiscal year closed on 30 September 2025, reported fourth-quarter Diagnostics comparable revenue flat at -0.3% with an adjusted EBIT margin of 7.5%, against group comparable revenue growth of 5.9% and a group adjusted EBIT margin of 16.5% for the full year.
1.2 Core lab versus molecular versus pathology: the mix problem
Read the Roche disclosure as a market map rather than a company result. Core Lab – clinical chemistry and immunoassay – is 55% of the largest pure-play diagnostics franchise and grew 0% at constant exchange rates. Molecular Lab is 18.3% and grew 4%. Pathology Lab is 12.4% and grew 14%. Near Patient Care, 14.3% of the division, shrank 3%.
The arithmetic consequence is unavoidable: a business whose largest component is flat and whose fastest-growing components are collectively around 30% of the base cannot compound at a high single-digit rate without either an acquisition or a price recovery in the core. The 6.60% market CAGR in this report is therefore not a description of momentum. It is a description of what must happen to the core lab franchise – through volume growth in emerging markets, menu expansion, or consolidation – for the aggregate to land there. That is the central tension in this market, and it is invisible in any single-company growth rate.
The pathology number deserves separate attention because it contradicts the received view that diagnostics growth is a molecular story. Pathology Lab grew 14% at constant exchange rates at Roche and, at Agilent, pathology was compelling enough to justify a USD 950 million cash acquisition of Biocare Medical announced in March 2026. The growth is being driven by the digitisation of a workflow that had been almost entirely analogue: immunohistochemistry, in situ hybridisation and digital image analysis moving from glass slides and manual scoring to scanners and algorithms. It is a workflow replacement, not a new test category, which is why it grows faster than test volumes.
1.3 Margin dispersion as the real competitive scoreboard
The most informative number in the peer set is not any single revenue figure but the span of margins. Siemens Healthineers’ Diagnostics segment earned a 7.5% adjusted EBIT margin in the fourth quarter of fiscal 2025. Roche’s Diagnostics Division earned a 7.7% operating margin for calendar 2025, down from 13.6%. Danaher’s Diagnostics segment earned 26.7%, Thermo Fisher’s Specialty Diagnostics 26.9%, and QIAGEN a 29.5% adjusted operating margin. The spread between the top and the bottom of that range is 22 percentage points.
All six companies sell automated analysers, reagents and service into laboratories. Instrument capability is not the explanation for a 22-point spread. The explanation is portfolio composition: what proportion of revenue is consumable rather than capital, how densely the installed base is placed, how broad the test menu is per instrument, and how much of the business sits in price-regulated geographies. QIAGEN’s sample-preparation and consumable weighting produces a structurally higher margin on a fifth of Danaher’s diagnostics revenue. Roche’s 7.7% reflects a portfolio heavily weighted to price-pressured core lab in China and a cost of sales line that rose 10% at constant exchange rates against sales growth of 2%.
That cost-of-sales divergence is the mechanism of margin compression in this industry. When reagent revenue grows more slowly than the cost of the reagents and the service obligations attached to them, the annuity model inverts: the installed base becomes a liability carried at fixed service cost rather than an asset generating expanding revenue. The companies holding margin in 2025 were those whose revenue mix shifted toward consumable-heavy, menu-differentiated testing fast enough to outrun that inversion.
1.4 China procurement reform as a structural, not cyclical, shock
Three independent companies attributed 2025 revenue weakness to the same administrative mechanism. Roche reported Asia-Pacific diagnostics sales down 12% at constant exchange rates, explicitly citing healthcare pricing reforms in China and a significant negative impact on its cardiac and oncology test portfolio in Core Lab, while Europe, Middle East and Africa grew 6%, North America grew 9% and Latin America grew 11%. Abbott cited volume-based procurement programmes among the challenging market conditions in China that offset growth in other geographies. bioMerieux reported a double-digit organic decline in China in Microbiology, which grew 6.3% once China was excluded.
Volume-based procurement is a purchasing mechanism in which a public payer aggregates demand and awards volume against a negotiated price, typically with sharp reductions. Its relevance to a market forecast is that it compresses revenue per test without compressing test volume – and possibly while increasing volume, since a lower price expands access. A forecast expressed in value terms therefore records procurement reform as pure deflation even when clinical utilisation is rising. This is why the Asia-Pacific decline at Roche sits alongside volume growth in the same region, and why treating 2025 as a one-off bad year would mis-specify the model: the mechanism is a standing feature of the largest-volume public payer in the world.
1.5 Consolidated or fragmented? A segment-level answer
At group level the market looks moderately consolidated: nine players above roughly USD 2 billion in diagnostics revenue, with the largest at CHF 13.8 billion. At discipline level it is far more concentrated in some places than others. Syndromic molecular testing is effectively a duopoly at the cartridge level. High-throughput clinical chemistry is a four- or five-supplier market defined by installed analyser platforms. Digital pathology is still fragmented across scanner vendors, image-analysis software firms and antibody suppliers – which is precisely why Agilent bought a 300-antibody portfolio rather than building one.
For competitive strategy the practical implication is that share battles are fought one discipline at a time, and that a company’s national share of ‘diagnostics’ is a poor predictor of its position in any specific test category. The next-generation sequencing market report documents the same pattern in sequencing, where instrument share and consumable share diverge sharply. Buyers, payers and suppliers should size the discipline, not the aggregate.
Value Chain
Value Chain and Laboratory Economics
The diagnostic tests value chain is unusual in medical technology because the revenue is not where the product is. Instruments are placed, often at or below cost, into laboratories that then buy reagents for a decade. Understanding the market means understanding that placement decision, the consumable annuity it creates, and the operating constraints inside the laboratory that determine whether the annuity is ever realised.
2.1 Six stages, from antigen supply to clinical decision
The chain runs through six stages. First, biological input supply: antibodies, antigens, enzymes, primers, probes, control materials and the microfluidic and plastic consumables that carry them. Second, assay development and validation, which is where the regulatory burden concentrates and where a menu is built. Third, instrument manufacture – analysers, cartridge readers, sequencers, scanners. Fourth, placement and installation, usually under a reagent-rental, lease or cost-per-reportable-result contract. Fifth, laboratory operations: specimen handling, quality control, accreditation, staff and turnaround time. Sixth, the clinical and financial close, where a result is interpreted, coded, billed and paid.
Siemens Healthineers describes the economics of stages three to five more candidly than most: its Diagnostics business “generates profits mainly from long-term contracts that include an initial instrument placement followed by ongoing reagent sales, which result in a predictable and resilient revenue stream.” That sentence is the business model of the industry. The instrument is customer acquisition cost; the reagent is the product.
2.2 The instrument placement model and the reagent annuity it creates
Because placement precedes revenue, installed-base data is the leading indicator that financial statements lag. bioMerieux discloses it directly, which makes the company the cleanest laboratory for the model. Its BIOFIRE non-respiratory panels delivered EUR 598 million of sales, up 10% organically, on a net installed-base expansion of 1,800 units in 2025 against 1,350 units in 2024. Its SPOTFIRE system generated EUR 168 million in sales, an 84% increase in value and more than 100% in volume, with an installed base of 6,400 instruments at year-end, up 110% on 2024.
Divide SPOTFIRE revenue by the closing installed base and the revenue per placed instrument is roughly EUR 26,250 a year. That figure is an approximation – units placed late in the year contribute partial revenue, and the mix includes service and consumables – but its order of magnitude is the useful part. A near-patient molecular instrument generates tens of thousands of euros of annual pull-through, not hundreds of thousands. Placement velocity therefore has to be high for revenue to compound, which is exactly why a 110% increase in installed base produced an 84% increase in revenue rather than a proportional one: average revenue per instrument fell as the base grew and as new placements matured.
Compare that with the high-throughput central-laboratory economics described by Siemens, where a single analyser placement can support a multi-year reagent contract across a broad menu. The pull-through per box is an order of magnitude larger, the sales cycle is longer, and the switching cost is higher because re-validating a menu on a new platform consumes laboratory resources. This is why core lab is defensible but slow, and why near-patient is fast but ragged.
2.3 Where the reagent price actually lands
The 2025 numbers show the annuity being repriced from two directions at once. At Roche, Diagnostics cost of sales rose from CHF 7,133 million to CHF 7,561 million – up 6% in Swiss francs and 10% at constant exchange rates – against sales growth of 2% at constant exchange rates. That is a structural deterioration in the ratio of reagent revenue to the cost of delivering it, and it is what took division operating profit from CHF 1,946 million to CHF 1,070 million.
On the other side, the payer is repricing the test. China’s volume-based procurement sets reagent prices administratively for public buyers, and the US clinical laboratory fee schedule sets Medicare payment by reference to weighted median private-payor rates. The laboratory sits between those two prices, which is why laboratory operators have been the most aggressive adopters of anything that reduces cost per reportable result. The clinical laboratory services market report covers that operating position in detail.
2.4 Labour as the binding operational constraint
The constraint that most limits throughput is not reagent supply or instrument capacity. It is staff. The American Society for Clinical Pathology’s 2024 vacancy survey, published in the American Journal of Clinical Pathology in 2025, found that automation was the single largest driver of changes to laboratory staffing needs, cited by 56.3% of respondents, ahead of molecular testing at 47.9% and laboratory information systems at 39.6%. Respondents described automation as “eliminating a large number of touchpoints with specimens” or allowing them to maintain “a similar level of personnel but with more capacity” – which is the economics of an automation sale in one sentence.
The same survey found that only 17.4% of responding laboratories had incorporated any AI tool, concentrated in laboratory information systems and quality assurance at 33.3% and anatomic pathology at 30.4%. That gap between the promise of AI in diagnostics and 17.4% adoption is a useful corrective to any forecast that assumes algorithmic pathology or AI-assisted interpretation is already a revenue driver. It is a capital expenditure argument being made to laboratory directors who are short of staff and sceptical of unvalidated tools.
2.5 Two channels, two price mechanisms
The channel determines the pricing mechanism, and the two are not converging. In tender-driven public systems – much of Europe, the Middle East and Asia – a contract is awarded on a bundle of instrument, reagent and service, and the price is negotiated at the point of award for the life of the contract. In fee-for-service systems, principally the United States, the instrument and reagent are priced commercially and the test is separately reimbursed, so price discipline arrives through the fee schedule rather than the tender.
China’s procurement model is a third mechanism: aggregated public demand with administratively set prices, applied to a reimbursement list. It reaches the supplier faster than either of the other two because it resets the price for an entire province or the whole country at once. The consequence for the value chain is that a supplier’s geographic revenue mix now determines its exposure to price deflation more powerfully than its technology position does – which is the single most important structural fact in this market and the reason Chapter 4 treats reimbursement as a first-order variable rather than a compliance topic.
Near-patient testing adds a fourth channel whose economics are still unsettled. Placing instruments in physician offices and pharmacies expands access but fragments the base, reduces tests per instrument, and pushes average revenue per placement down – the pattern visible in bioMerieux’s SPOTFIRE arithmetic and in Roche’s declining Near Patient Care revenue. The point-of-care testing market report covers that channel’s unit economics in full.
Investment Activity
Investment, Capital and Consolidation
Capital allocation in diagnostics is a bet on where the consumable annuity will be in five years. That framing explains almost every transaction and every capital decision in 2025 and early 2026, including the ones that look like technology bets. It also explains why so much of the capital went into buying menus rather than building instruments.
5.1 Where the 2025 capital actually went
The cash generation available to fund it was substantial. Siemens Healthineers reported free cash flow of around EUR 2.7 billion for fiscal 2025, clearly above the prior year, and proposed a dividend of EUR 1.00 per share against EUR 0.95. QIAGEN lifted its adjusted operating income margin 80 basis points to 29.5% while absorbing tariffs and currency headwinds, and grew its designated growth pillars to USD 1.49 billion at constant exchange rates, up 8%. Danaher generated operating cash flow of USD 6.4 billion and non-GAAP free cash flow of USD 5.3 billion at group level, with diagnostics contributing USD 2,846 million of adjusted operating profit.
It did not all translate into diagnostics profit growth. Danaher’s diagnostics adjusted operating profit fell from USD 2,916 million to USD 2,846 million even as sales rose 1.6%, and reported segment operating profit rose only from USD 2,625 million to USD 2,650 million. Roche‘s Diagnostics Division operating profit fell 45% in Swiss francs to CHF 1,070 million from CHF 1,946 million, cutting the division’s margin from 13.6% to 7.7%, while group core operating profit rose 13% at constant exchange rates to CHF 21,833 million. The contrast is the point: in 2025, diagnostics was the segment that consumed margin rather than the segment that produced growth, and capital was allocated accordingly.
5.2 Buying the menu instead of building it
The clearest statement of strategy in the period came from Agilent, which in March 2026 agreed to acquire Biocare Medical for USD 950 million in cash from an investor group led by Excellere Partners and GHO Capital. Biocare supplies more than 300 specialised antibodies across immunohistochemistry, in situ hybridisation and fluorescence in situ hybridisation, generated over USD 90 million of revenue in 2025, and had delivered double-digit annual revenue and profit growth since 2021. Agilent stated the transaction was expected to be accretive to its top-line growth rate, margin profile and non-instrument revenue mix in year one.
Read that last clause carefully. The acquirer’s stated rationale is a shift in revenue mix away from instruments toward consumables and reagents. At roughly 10.6 times revenue for a fast-growing reagent franchise, Agilent paid for the annuity, not the technology. The same logic applies inside the large caps: QIAGEN’s 2025 results included a contribution from its Parse acquisition, which it has folded into the growth-pillar portfolio that now represents the majority of its forward growth guidance.
This is a durable feature of the market rather than a cyclical wave. When a placed instrument generates a decade of reagent revenue, the cheapest way to grow is to add assays that run on instruments already in the field or on a menu a laboratory already validates. Acquisition of a menu is faster and more certain than development of one, which is why the multiples stay high for reagent-heavy assets and low for instrument-led ones.
5.3 Pruning as the other half of the strategy
Portfolio discipline is the unglamorous counterpart. QIAGEN’s 2025 net sales included headwinds of about USD 20 million from discontinued products – NeuMoDx and Dialunox – as it exited platforms that could not earn their cost of capital. Abbott’s COVID-19 testing revenue has now fallen to USD 297 million for the full year and USD 89 million in the fourth quarter, from USD 176 million in the fourth quarter of 2024, with Rapid Diagnostics down 17.8% on a reported basis in that quarter. Roche’s Near Patient Care area shrank 3% at constant exchange rates.
Underneath the voluntary pruning sits a regulatory forcing function. As set out in Chapter 4, the EU IVDR transitional periods run to 31 December 2027 for class D, 31 December 2028 for class C and 31 December 2029 for class B and sterile class A devices, and they are conditional on a quality management system being in place by 26 May 2025 and a conformity assessment application having been lodged with a notified body. For a manufacturer carrying a long tail of low-volume legacy assays, the rational response is to withdraw them rather than fund conformity assessment. That concentrates revenue into fewer, higher-volume tests – which mechanically raises average revenue per assay while reducing the number of assays on the market.
5.4 Capex-light annuity building and its limit
Placing instruments to capture reagent revenue is capital-light only in the sense that the instrument is not sold at a margin; it is not capital-free. bioMerieux‘s installed base expansion – 6,400 SPOTFIRE instruments at year-end, up 110%, and a net 1,800-unit BIOFIRE expansion against 1,350 in the prior year – sits on the balance sheet as placed equipment earning future consumable revenue. The return on that capital depends entirely on pull-through per instrument, and Chapter 2 showed the arithmetic: roughly EUR 26,250 of annual revenue per SPOTFIRE instrument, an order of magnitude below a high-throughput central-laboratory analyser.
That spread is why decentralised placement is a volume strategy and central-laboratory placement is a value strategy, and why the two require different capital discipline. It also explains the industry’s preference for syndromic panels: a panel raises revenue per cartridge without requiring more placements, so the same installed base supports more revenue. Every incremental menu addition on an existing instrument is the highest-return capital in the industry, because the capital has already been spent.
5.5 What 2026 guidance implies about reinvestment
QIAGEN guided to net sales growth of at least 5% at constant exchange rates for 2026, with its growth pillars expected to contribute about USD 1.64 billion, roughly 9% at constant exchange rates, and adjusted diluted earnings per share of at least USD 2.50 at constant exchange rates. That guidance is a statement about mix: the legacy portfolio is expected to grow slower than the pillar portfolio, so total growth converges on the legacy rate as the base expands.
Across the peer set, the reinvestment priority is consistent – menu breadth, syndromic panel content, pathology digitisation and automation – and the de-prioritised items are equally consistent: low-volume legacy assays, loss-making point-of-care platforms and any instrument without a consumable stream behind it. For investors, the implication is that diagnostics revenue growth will increasingly be a function of menu density on an installed base rather than of new instrument placements, and that the companies able to fund menu acquisition from cash flow will compound while those dependent on instrument tenders will not.
Technology & Innovation
Technology and Innovation Landscape
Technological change in diagnostics is real, well funded and slower to convert into revenue than the volume of innovation would suggest. The reason is that a diagnostic technology has to clear three separate gates before it generates income: analytical validation, regulatory or accreditation acceptance, and payment. Most innovation in this market clears the first gate easily and stalls at the third. This chapter separates the four technology fronts that matter commercially and identifies the specific constraint on each.
3.1 Automation and menu breadth in the core laboratory
Automation is the least discussed and most commercially consequential technology in the market, because it is the only lever that addresses the binding constraint on laboratory throughput: staff. The American Society for Clinical Pathology’s 2024 vacancy survey, published in 2025, found that automation was the single largest driver of change to laboratory staffing needs, cited by 56.3% of respondents – ahead of molecular testing at 47.9% and laboratory information systems at 39.6%. Respondents described the effect as eliminating specimen touchpoints, standardising turnaround time, or allowing them to keep the same headcount with more capacity.
That last formulation is the purchasing argument. When a laboratory is short of qualified staff, an analyser that increases tests per technologist is worth more than an assay that adds a test the laboratory cannot staff. This is why core-lab automation sells even in a flat revenue environment, and why Danaher invested 2025 in broadening the assay menu of the Beckman Coulter DxI 9000 immunoassay platform, with particular progress in neurodegenerative disease assays. Menu breadth per installed instrument is the mechanism by which a supplier converts a placed box into growing reagent revenue without placing another box. It is the cheapest growth available in this market, which is why it is pursued so relentlessly.
3.2 Syndromic multiplex molecular testing
The clearest revenue-generating innovation in 2025 was syndromic multiplex testing: a single cartridge that tests for a panel of pathogens from one specimen, replacing a sequence of single-target assays and a culture. Danaher received FDA clearance during 2025 for Cepheid’s Xpert GI Panel, a rapid multiplex PCR test detecting 11 common gastrointestinal pathogens from a single sample. bioMerieux‘s BIOFIRE non-respiratory panels grew 10% organically to EUR 598 million, with net installed-base expansion of 1,800 units. QIAGEN’s growth pillars – the portfolio it has designated as its expansion engine – delivered USD 1.49 billion at constant exchange rates, up 8%.
The economics of syndromic testing are unusually favourable for the supplier. A panel is priced well above a single-target assay while consuming one cartridge, one instrument cycle and one labour step, so both the supplier’s revenue per test and the laboratory’s cost per result move in the right direction. The constraint is menu breadth and reimbursement: a panel is only attractive if the payer covers the panel as a unit rather than paying separately for each pathogen it detects. Where payers unbundle, the economics collapse back to single-target testing.
This is also the segment where market structure is tightest. Cartridge-based syndromic testing is effectively a duopoly at the platform level in the United States, with the two largest positions held by Danaher’s Cepheid and bioMerieux. The competitive variable is panel menu, not instrument design – which is why the 2025 news flow was clearances and menu expansions rather than new platforms.
3.3 Decentralisation and the near-patient revenue paradox
Near-patient and point-of-care testing is growing in units and, in several portfolios, shrinking in revenue. Both facts are true and the combination is the most misunderstood dynamic in the market. bioMerieux’s SPOTFIRE installed base reached 6,400 instruments, up 110% year on year, and generated EUR 168 million, up 84% in value and more than 100% in volume. Roche’s Near Patient Care customer area, by contrast, fell 3% at constant exchange rates in 2025. Abbott’s Point of Care revenue was USD 606 million for the full year while its Rapid Diagnostics line fell 17.8% on a reported basis in the fourth quarter.
The reconciliation is price per test. Decentralised testing disperses a fixed number of tests across a larger number of instruments and sites, so revenue per placement falls while placement counts rise. Where the decentralised test replaces a central-laboratory test at a lower price point, total market value can grow more slowly than volume – or, as at Roche, decline. Any forecast that treats point-of-care unit growth as a proxy for point-of-care revenue growth will overstate the segment. The point-of-care testing market report sets out the channel economics in detail.
3.4 Digital pathology and the sequencing layer
Pathology was the fastest-growing customer area at the largest diagnostics franchise in 2025: Roche’s Pathology Lab revenue rose 14% at constant exchange rates to CHF 1,723 million, against 0% in Core Lab. The underlying technology shift is digitisation – whole-slide imaging, image analysis and, increasingly, computational scoring of immunohistochemistry. The strategic response has been consolidation at the reagent and antibody layer. In March 2026, Agilent agreed to acquire Biocare Medical for USD 950 million in cash, adding more than 300 specialised antibodies across immunohistochemistry, in situ hybridisation and fluorescence in situ hybridisation, and explicitly framing the deal as improving its non-instrument revenue mix in year one.
That framing is the tell. Digitising pathology does not by itself generate reagent revenue; owning the antibody menu that the digital workflow reads does. The same pattern appears in sequencing, where instrument placements matter far less than the consumable stream they pull through – documented in this site’s next-generation sequencing market report, which quantifies consumable pull-through per instrument.
The adoption constraint in digital pathology is different from the constraint in molecular testing. It is not reimbursement of a test but capital and workflow: a laboratory must buy scanners, validate an image-management system, integrate it with its laboratory information system, and persuade pathologists to sign out on screen. The ASCP survey found AI use concentrated in anatomic pathology at 30.4% of laboratories – the highest of any discipline alongside laboratory information systems – and only 17.4% of laboratories reporting any AI adoption at all. That is a market in early adoption, not one in scale.
3.5 Why validation, not instrument capability, sets the adoption rate
The gap between the technical state of the art and the deployed base in this market is best explained by the third gate: evidence and validation. A laboratory that adopts an unvalidated assay carries the clinical and legal risk itself, and the accreditation framework under CLIA requires it to establish performance specifications before reporting patient results. That is why the FDA’s vacated laboratory developed test rule mattered so much commercially: it left the validation burden, and the liability, with the laboratory rather than transferring it to a device premarket review.
Innovation therefore reaches the market at the speed of someone’s willingness to validate it and someone else’s willingness to pay for it. That is slower than the technology cycle and faster than a pessimistic reading would suggest – which is precisely the pattern in the 2025 results, where menu expansion and panel clearances generated measurable revenue while algorithmic diagnostics generated conference presentations.
Market Risk
Risks and Disruption Threats
The risks that matter in this market are not the ones that appear in a typical risk register. Clinical demand for diagnostic testing is structurally stable and rising; the volatility comes from price, payment and policy. Eight risks are set out below, each with the specific channel through which it reaches the forecast, followed by an explicit statement of what would break the 6.60% path.
6.1 Eight risks and how each one transmits
One: Chinese procurement reform. Transmission channel is revenue per test, not test volume. Roche‘s Asia-Pacific diagnostics sales fell 12% at constant exchange rates in 2025 on healthcare pricing reform, with a specific impact on cardiac and oncology tests in Core Lab. Because the mechanism aggregates public demand and sets price administratively, it can reset an entire national price level in a single cycle.
Two: US fee schedule reductions from 2027. Transmission channel is US test price. Per the CMS clinical laboratory fee schedule rules as amended by Section 6226 of the Consolidated Appropriations Act, 2026, there is no phase-in reduction in 2026, but from 1 January 2027 through 2029 payment for a test may not be reduced by more than 15% per year against the prior year’s amount. A 15% annual cap sounds generous until it compounds across three consecutive years for a test whose private-payor reference rate has fallen sharply.
Three: EU IVDR deadlines. Transmission channel is menu withdrawal in Europe. The transitional periods under Regulation (EU) 2024/1860 expire on 31 December 2027 for class D, 31 December 2028 for class C and 31 December 2029 for class B and sterile class A devices, conditional on a quality management system in place by 26 May 2025 and a lodged notified-body application. Manufacturers rationalise low-volume assays rather than fund conformity assessment, which removes revenue and reduces test availability.
Four: reversal of the US laboratory developed test settlement. Transmission channel is the in-house testing business model. The 2024 rule was vacated by a district court on 31 March 2025 and removed from the regulation on 19 September 2025, but that outcome rests on litigation and administrative action rather than statute. A successful appeal or a better-documented future rulemaking could bring laboratory developed tests back into device regulation, raising cost and time-to-market for the highest-margin esoteric testing.
Five: tariffs and input cost. Transmission channel is cost of sales. Siemens Healthineers attributed a slightly lower year-on-year quarterly adjusted EBIT margin to higher tariffs, and QIAGEN reported lifting its margin despite tariffs and currency headwinds. Roche’s diagnostics cost of sales rose 10% at constant exchange rates against sales growth of 2%, a divergence that produced most of the division’s margin decline.
Six: the near-patient price effect. Transmission channel is segment value per unit of volume. Decentralisation disperses tests across more instruments and sites, lowering revenue per placement: Roche’s Near Patient Care fell 3% at constant exchange rates, Abbott’s Rapid Diagnostics fell 17.8% on a reported basis in the fourth quarter, and bioMerieux’s SPOTFIRE revenue grew 84% on a 110% larger installed base. Unit growth is not revenue growth in this channel.
Seven: post-pandemic base normalisation. Transmission channel is the prior-year comparison. Abbott’s full-year COVID-19 testing revenue fell to USD 297 million, and fourth-quarter diagnostics sales were down 0.2% only after excluding COVID-19 testing – the underlying organic decline was 3.6%. As the pandemic comparison disappears from the base, weakness that was previously masked becomes visible in reported growth.
Eight: customer consolidation. Transmission channel is buyer pricing power. As hospital networks and reference laboratories consolidate and as public systems aggregate demand through tenders, the number of independent buyers of diagnostic reagents falls. Each consolidation event transfers a negotiating advantage to the buyer and compresses the supplier’s reagent price for the life of a multi-year contract.
6.2 The interaction that matters most
These risks are not independent, and the correlation between two of them is the central threat to the forecast. Price deflation in China and reimbursement reduction in the United States arrive in the same businesses over the same years. A supplier exposed to both faces revenue per test falling in its two largest value pools simultaneously, while its cost of sales is rising with tariffs. That combination – declining price with rising input cost – is what took Roche’s Diagnostics Division operating margin from 13.6% to 7.7% in a single year on a 2% CER revenue increase.
There is a second-order consequence worth stating. Diagnostics margin funds diagnostics research and development. Roche’s division spent CHF 2,052 million on R&D in 2025 on CHF 13,905 million of revenue. If the annuity that funds that spending is repriced downward permanently, the industry’s innovation capacity contracts with a lag of two to three years – which would slow the molecular and pathology growth that is currently offsetting core-lab stagnation. That self-reinforcing loop is the mechanism by which a price shock becomes a structural growth problem.
6.3 What would break the 6.60% forecast
Three conditions would move this market materially below the forecast path. First, if China-style aggregated procurement spreads to European or Middle Eastern public tenders – that is, if price setting moves from contract negotiation to administrative award – the deflation currently confined to Asia-Pacific becomes global. Second, if the US reduction cap binds at or near 15% in each of 2027, 2028 and 2029 for high-volume chemistry and immunoassay tests, the largest revenue pool in the market reprices faster than volume can offset. Third, if core laboratory revenue fails to stabilise in the world’s two largest diagnostics franchises, the reagent annuity that funds the entire industry stops growing while the cost attached to the installed base does not.
On the upside, the forecast is conservative in one specific respect. If syndromic panel menus continue to expand and pathology digitisation continues at the pace implied by Roche’s 14% constant-currency growth in Pathology Lab and Agilent’s USD 950 million commitment to pathology reagents, the mix shift toward higher-revenue-per-test categories happens faster than the aggregate rate assumes. The upside and downside cases therefore hinge on the same variable – how quickly the revenue mix rotates away from price-pressured clinical chemistry – and differ only in whether that rotation outruns the deflation attached to the base.
What this report does not do is attach a probability to either outcome. The transmission channels are documented; the timing of administrative price decisions in Beijing, Washington and Brussels is not knowable from company filings, and presenting it as a modelled certainty would be false precision.
Regulatory Landscape
Regulatory and Reimbursement Framework
In diagnostics, regulation determines what may be sold; reimbursement determines whether it is worth selling. The two are frequently conflated in market analysis, and 2025 provided a clean natural experiment in the difference. The United States resolved its most contested device-regulation question in favour of the status quo and, in the same year, reopened the payment question. The European Union continued a staged deferral of its in vitro diagnostic regime. China used procurement rather than regulation to reset prices. The binding constraint on this market is now payment.
4.1 United States: the laboratory developed test rule and its vacatur
The sequence matters, because a version of this dispute is likely to recur. On 6 May 2024 the FDA issued a final rule amending the definition of in vitro diagnostic products in 21 CFR 809.3(a) to add the words “including when the manufacturer of these products is a laboratory” – the mechanism by which laboratory developed tests would have been drawn into device regulation. On 31 March 2025 the United States District Court for the Eastern District of Texas vacated the rule in American Clinical Laboratory Association v. FDA, No. 4:24-CV-479-SDJ, setting it aside and remanding the matter. On 19 September 2025 the FDA issued a final rule removing that language and reverting to the pre-2024 text of the regulation.
The commercial consequence is that laboratory developed tests remain outside device premarket review and inside CLIA accreditation. For the large reference laboratories that develop proprietary esoteric tests, that preserves a business model in which the assay is intellectual property protected by laboratory operation rather than by a device clearance. For device manufacturers, it means the competitive moat around a cleared assay is reimbursement and menu depth rather than regulatory exclusivity, because a laboratory can build a competing test without a premarket submission.
The unresolved part is that the settlement rests on litigation rather than legislation. A district court vacatur can be appealed, and a future rulemaking could revisit the definition with a stronger administrative record. Any forecast that assumes the current position is permanent is making a policy assumption, not an observation. It is worth stating plainly: the risk that in-house testing is brought back into device regulation is live, just not currently active.
4.2 European Union: IVDR transition deadlines to 2027-2029
The EU In Vitro Diagnostic Regulation replaced the older directive but has been implemented through a long transition. Regulation (EU) 2024/1860 amended Article 110 of the IVDR to extend the periods during which certain legacy devices may be placed on the market or put into service. Devices covered by a directive certificate valid under the transitional provisions may be placed on the market until 31 December 2027. For devices that did not require notified-body involvement under the old directive but do under the IVDR, the deadlines are 31 December 2027 for class D devices, 31 December 2028 for class C devices, and 31 December 2029 for class B devices and class A devices placed on the market in sterile condition.
Those extensions are conditional, and the conditions are the commercially interesting part. A device may only use the extended period if it continues to comply with the old directive, if there are no significant changes in design and intended purpose, if it presents no unacceptable risk, if the manufacturer has put in place a quality management system in accordance with Article 10(8) no later than 26 May 2025, and if a formal application for conformity assessment has been lodged with a notified body by the applicable date. In substance, the extension rewards manufacturers who were already investing in a quality system and a notified-body relationship, and it does nothing for those who were not.
The effect on the market is portfolio pruning by deadline. A manufacturer with a long tail of low-volume legacy assays faces a rational decision to withdraw them rather than carry them through conformity assessment, which removes tests from the European market and concentrates revenue in the assays that justify the cost. That is a mechanism for consolidation in the reagent menu that shows up as revenue growth for the survivors and as reduced test availability for the laboratory.
4.3 The clinical laboratory fee schedule and the 2027-2029 reduction cap
Medicare payment for clinical diagnostic laboratory tests is set under the clinical laboratory fee schedule by reference to the weighted median of private payor rates, with data reported by laboratories and rates updated on a three-year cycle. That mechanism, created by the Protecting Access to Medicare Act, has been repeatedly deferred and modified by statute – and was again in 2026.
Per the Centers for Medicare and Medicaid Services, Section 6226 of the Consolidated Appropriations Act, 2026, enacted on 3 February 2026, updated the data reporting requirements for clinical diagnostic laboratory tests that are not advanced diagnostic laboratory tests, and delayed the phase-in of payment reductions. The most recent data reporting period ran from 1 May 2026 to 31 July 2026, based on a data collection period of 1 January 2025 to 30 June 2025. There is no phase-in reduction in 2026. From 1 January 2027 through 2029, payment for a test may not be reduced by more than 15% per year compared with the payment amount established for that test in the preceding year. After the 2026 reporting period, a three-year data reporting cycle applies.
For suppliers, the practical reading is that the repricing of the US laboratory book has been deferred, not cancelled. The 15% annual cap converts what would have been a step change into a multi-year glide path, and because the reference is the preceding year’s amount, the compounding effect over 2027, 2028 and 2029 can still be substantial for a test whose private-payor rate has fallen. For laboratories, the cap provides planning visibility. For anyone forecasting the market in value terms, the cap is the mechanism by which US price deflation enters the model from 2027 – three years inside the forecast window of this report.
4.4 China: procurement as the price-setting instrument
China does not need to change a device regulation to change a market. Volume-based procurement aggregates public hospital demand and awards volume against a negotiated price, and the resulting reductions propagate through the entire supplier base because public procurement sets the reference price. The 2025 evidence is unambiguous: Roche’s Asia-Pacific diagnostics sales fell 12% at constant exchange rates with the company citing healthcare pricing reforms and a specific impact on cardiac and oncology tests in Core Lab; Abbott cited volume-based procurement among the challenging conditions in China; bioMerieux reported a double-digit organic decline in China in Microbiology, which grew 6.3% excluding that geography.
Three companies, three different portfolios, one administrative mechanism. For the purposes of this report, Chinese procurement is treated as a standing deflationary feature of the Asia-Pacific revenue pool rather than an event. That treatment is what distinguishes the forecast here from a simple extrapolation of 2024 growth rates.
4.5 Coverage, not approval, as the commercial gate
Put the four jurisdictions together and a single rule emerges. A diagnostic test becomes a market when a payer agrees to pay for it, and the regulatory framework determines only the cost and time of getting into a position to ask. The FDA’s vacatur lowered the regulatory barrier to in-house test development while leaving the payment barrier untouched. The IVDR extension gave manufacturers more time to comply without giving them a payer decision. The CLFS cap determines the trajectory of US test prices for the rest of the decade. China set its prices directly.
That is why this chapter sits before the investment chapter rather than after it. Capital in this market is allocated against reimbursement pathways – a company decides whether to develop a companion diagnostic because a payer has agreed to cover it alongside a drug, not because the assay is technically feasible. Innovation follows coverage, and the forecasts in this report follow both.