
Global Human Capital Management Software Market Report, Size, Share and Forecast 2026–2033
A market priced per head, in the year headcount stopped being the unit
Every other large enterprise software category has already been repriced. Databases moved from seats to cores to consumption; infrastructure from servers to metered compute; marketing automation from contact records to sends. Human capital management never made that move. It is the last category above USD 30 billion still billed as a rate per employee per month multiplied by headcount, and that single fact dominates its next eight years.
The reason is not inertia. Payroll carries a statutory deadline and a financial penalty on every error, and headcount is the one number every employer already knows, audits and cannot argue about. A per-employee rate is easy to budget, easy to audit and impossible to dispute. It survived because it worked.
It is now being displaced from two directions at once. The first is supply. Workday prices its AI and platform capability on Flex Credits, a usage-based model in which credits are consumed when an agent acts rather than when an employee exists. Its published rate card meters by skill: one credit for an agent retrieving information, five for an agent completing a task autonomously, with credits bought annually in bulk and complimentary credits scaled to company size. Workday states the break with its own former model explicitly, describing the shift as charging for the work AI completes rather than the number of employees in the organisation.
The second is demand, and it is the more corrosive of the two. If agents absorb the administrative work that justified a per-employee licence, headcount stops being a proxy for value delivered - and at the limit an agent that reduces a customer's administrative payroll reduces the vendor's revenue in the same motion that proves the product works. That is a structurally unstable pricing model. It is why the forecast below decomposes growth into headcount and price rather than reporting a single rate.
Market size and forecast
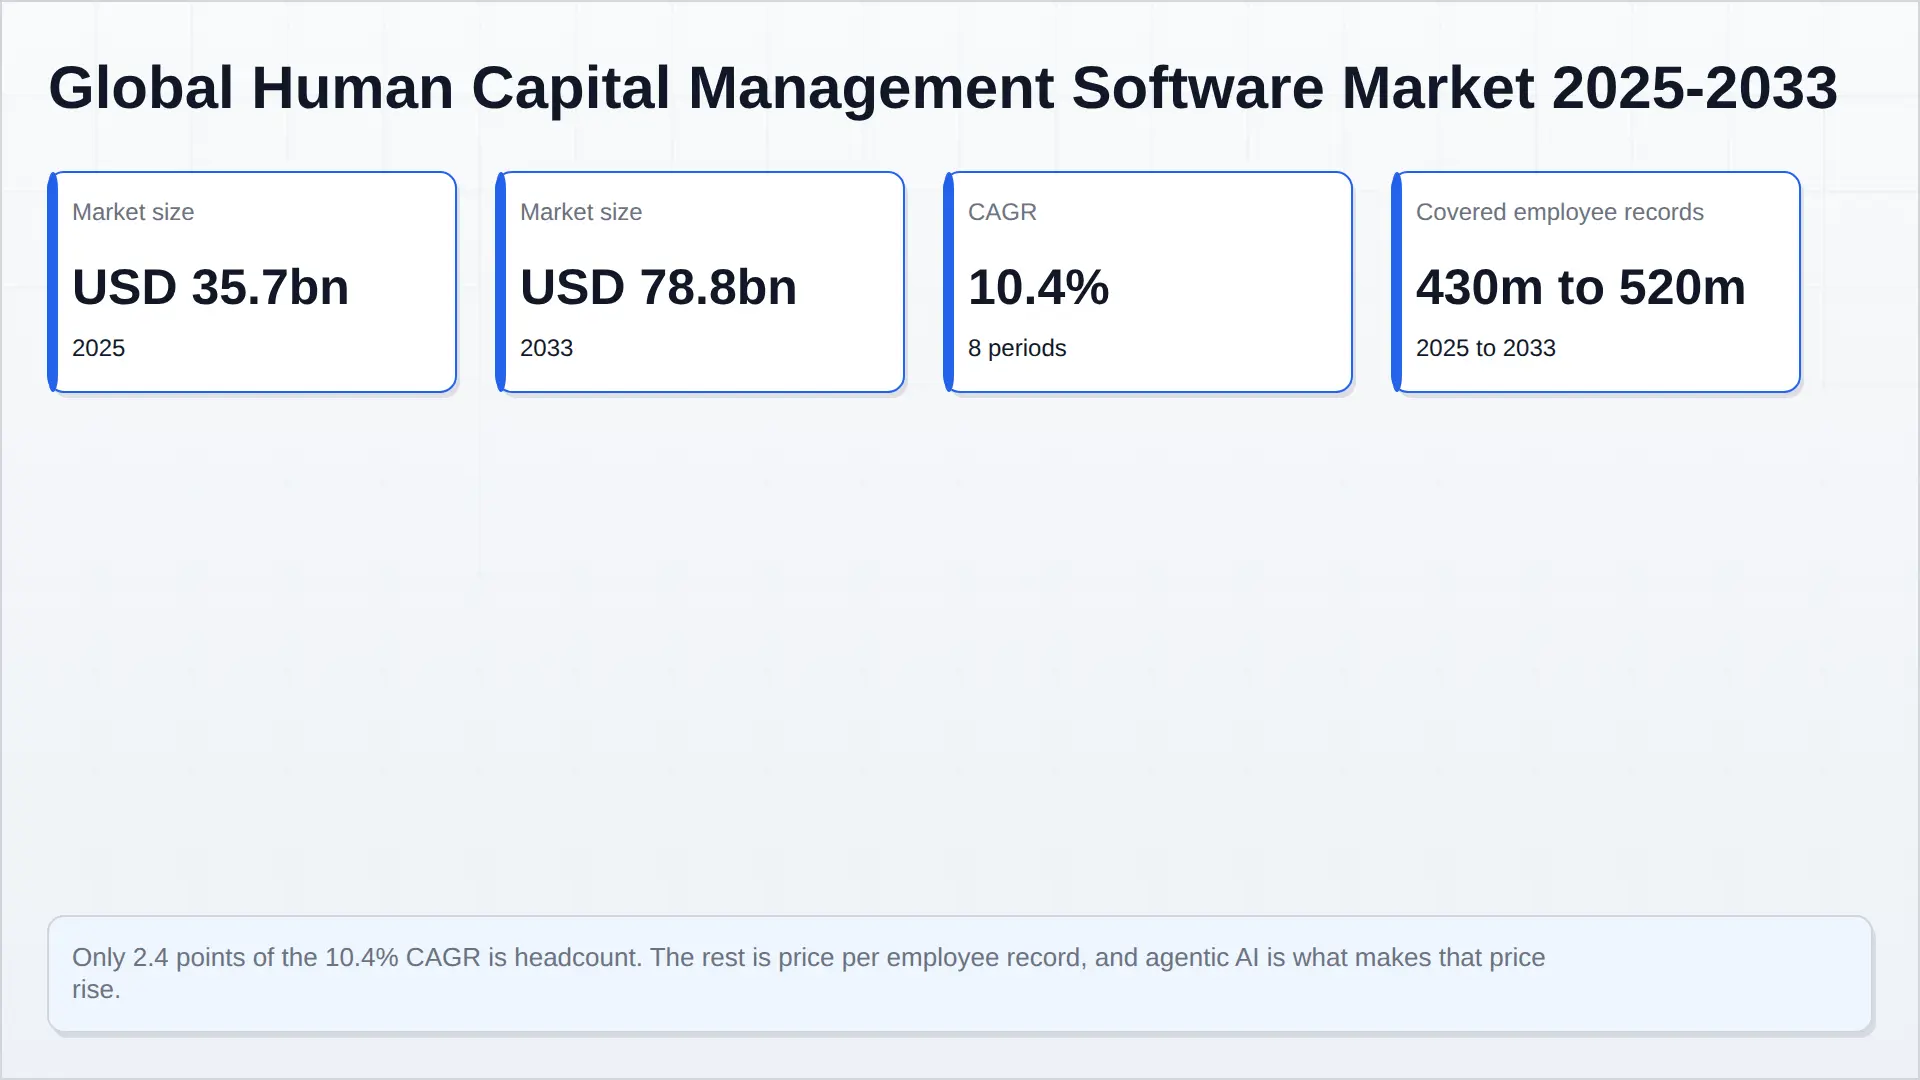
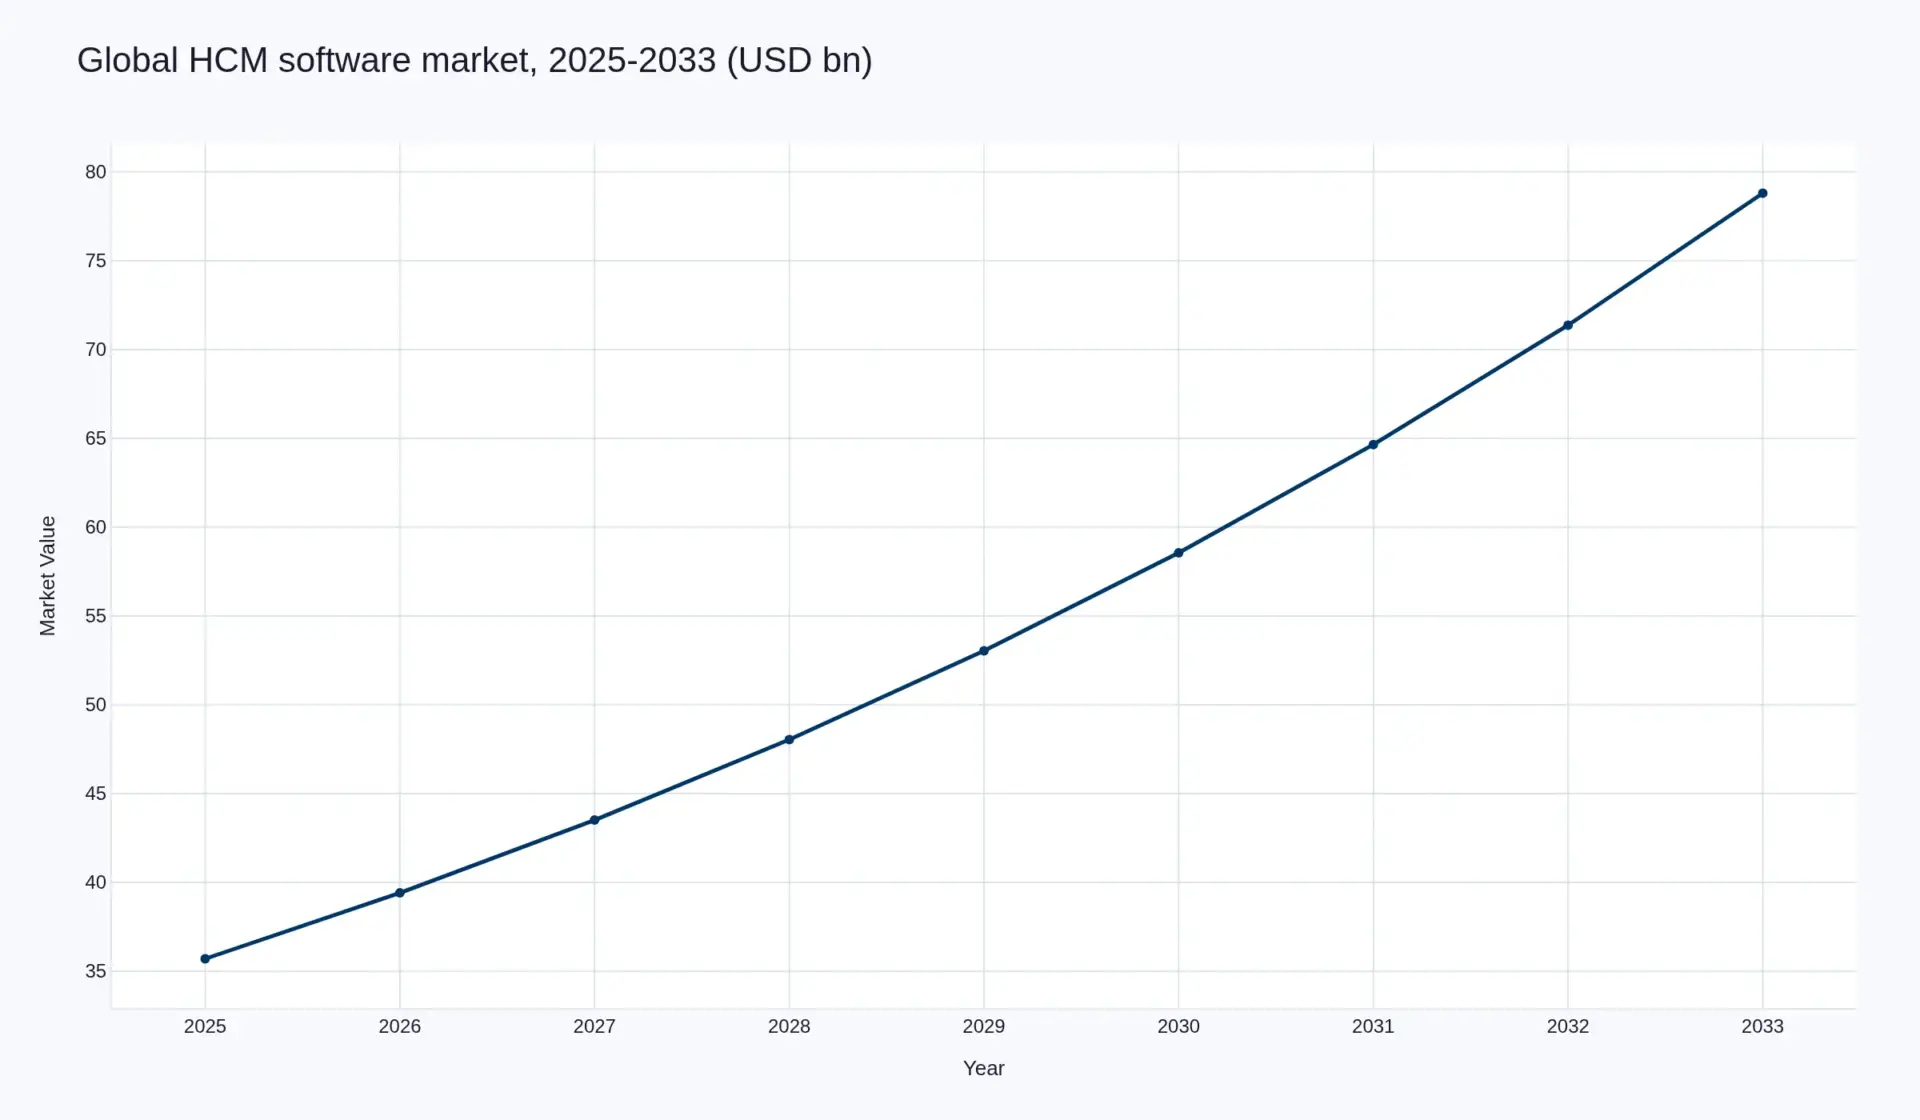
The global human capital management software market is estimated at USD 35.7 billion in 2025 and forecast to reach USD 78.8 billion in 2033, a compound annual growth rate of 10.4 per cent across eight periods.
The decomposition carries more information than the total. Of the 10.4 per cent, roughly 2.4 points is volume: covered employee records under paid subscription rise from an estimated 430 million in 2025 to 520 million in 2033, as formal employment grows and as smaller employers in Europe, India, Latin America and Southeast Asia leave spreadsheets and local payroll bureaux. The remaining 7.8 points is price per covered record, rising from about USD 83 a year to about USD 152.
That split is the central judgement in this report. A reader who believes agentic AI compresses software pricing should expect the price line to fall rather than rise, and should read the downside case set out under Market Risk: with price per record growing at 4 per cent instead of 7.8, and volume unchanged, the 2033 market is USD 59.1 billion rather than USD 78.8 billion. A reader who believes the incumbents convert their compliance content and workforce data into metered agent revenue should expect a higher terminal value than the base case. Both positions are defensible from the evidence assembled here; the base case sits between them.
How the base year was built, and why the number is larger than some published estimates
The 2025 base is constructed bottom-up from company disclosure, not adopted from a published estimate. Attributable HCM software revenue is taken from primary filings and releases for the ten largest vendors, and estimated from established scale where a vendor does not break the line out - SAP SuccessFactors, Oracle Fusion HCM and UKG do not disclose HCM software revenue, and their entries are Pheonix Research estimates anchored on disclosed customer counts and total revenue.
Scope is the reason the base sits above narrower definitions of this market. It counts application software subscription across core HR, payroll, workforce management, talent acquisition and talent management, and it excludes four things that are often mixed in: PEO and business-process-outsourcing pass-through revenue; interest earned on client funds, which is a payments business rather than a software business and moves with short rates; outsourced payroll processing fees; and benefits brokerage. A definition restricted to core HR administration, with no payroll and no services, produces a base roughly a third of this one. Both are legitimate; they answer different questions. This report measures what buyers actually spend on HCM software.
There is a demand-side cross-check. If 430 million employee records are covered by paid HCM software at a blended USD 83 a record, the market is USD 35.7 billion - the same number, arrived at from the opposite direction. The coverage figures behind that count are disclosed: Workday reports more than 75 million users under contract, ADP pays 42 million workers worldwide, SAP states that 290 million people use SuccessFactors, and UKG reports data from more than 65 million employees. Those numbers overlap materially - the same worker commonly appears in a payroll bureau's count and in a talent module's count - so the 430 million figure is a net estimate, not a sum, and it is the largest single judgement in the model.
Segment structure
Core HR and payroll is half the market and will grow slowest, because it is priced on headcount and headcount grows at roughly the rate of formal employment. Talent management and, above all, analytics and embedded intelligence grow fastest, because those are the modules where agents add measurable work and where consumption pricing is being introduced.
| Segment | 2025 (USD bn) | Share | 2033 (USD bn) | CAGR |
|---|---|---|---|---|
| Core HR and payroll software | 18.21 | 51.0% | 36.82 | 9.2% |
| Talent management: performance, learning, engagement | 5.36 | 15.0% | 12.35 | 11.0% |
| Talent acquisition | 4.64 | 13.0% | 9.59 | 9.5% |
| Workforce management and time | 4.64 | 13.0% | 10.31 | 10.5% |
| HR analytics, planning and embedded intelligence | 2.86 | 8.0% | 9.70 | 16.5% |
| Total | 35.71 | 100% | 78.77 | 10.4% |
Segment growth rates are set independently and sum with rounding to the market total. The gap between the core at 9.2 per cent and analytics at 16.5 per cent is the whole investment case in one table: the incumbents' revenue base grows slowly, and the growth has to be bought by selling a new unit of consumption on top of an old one.
Regional structure
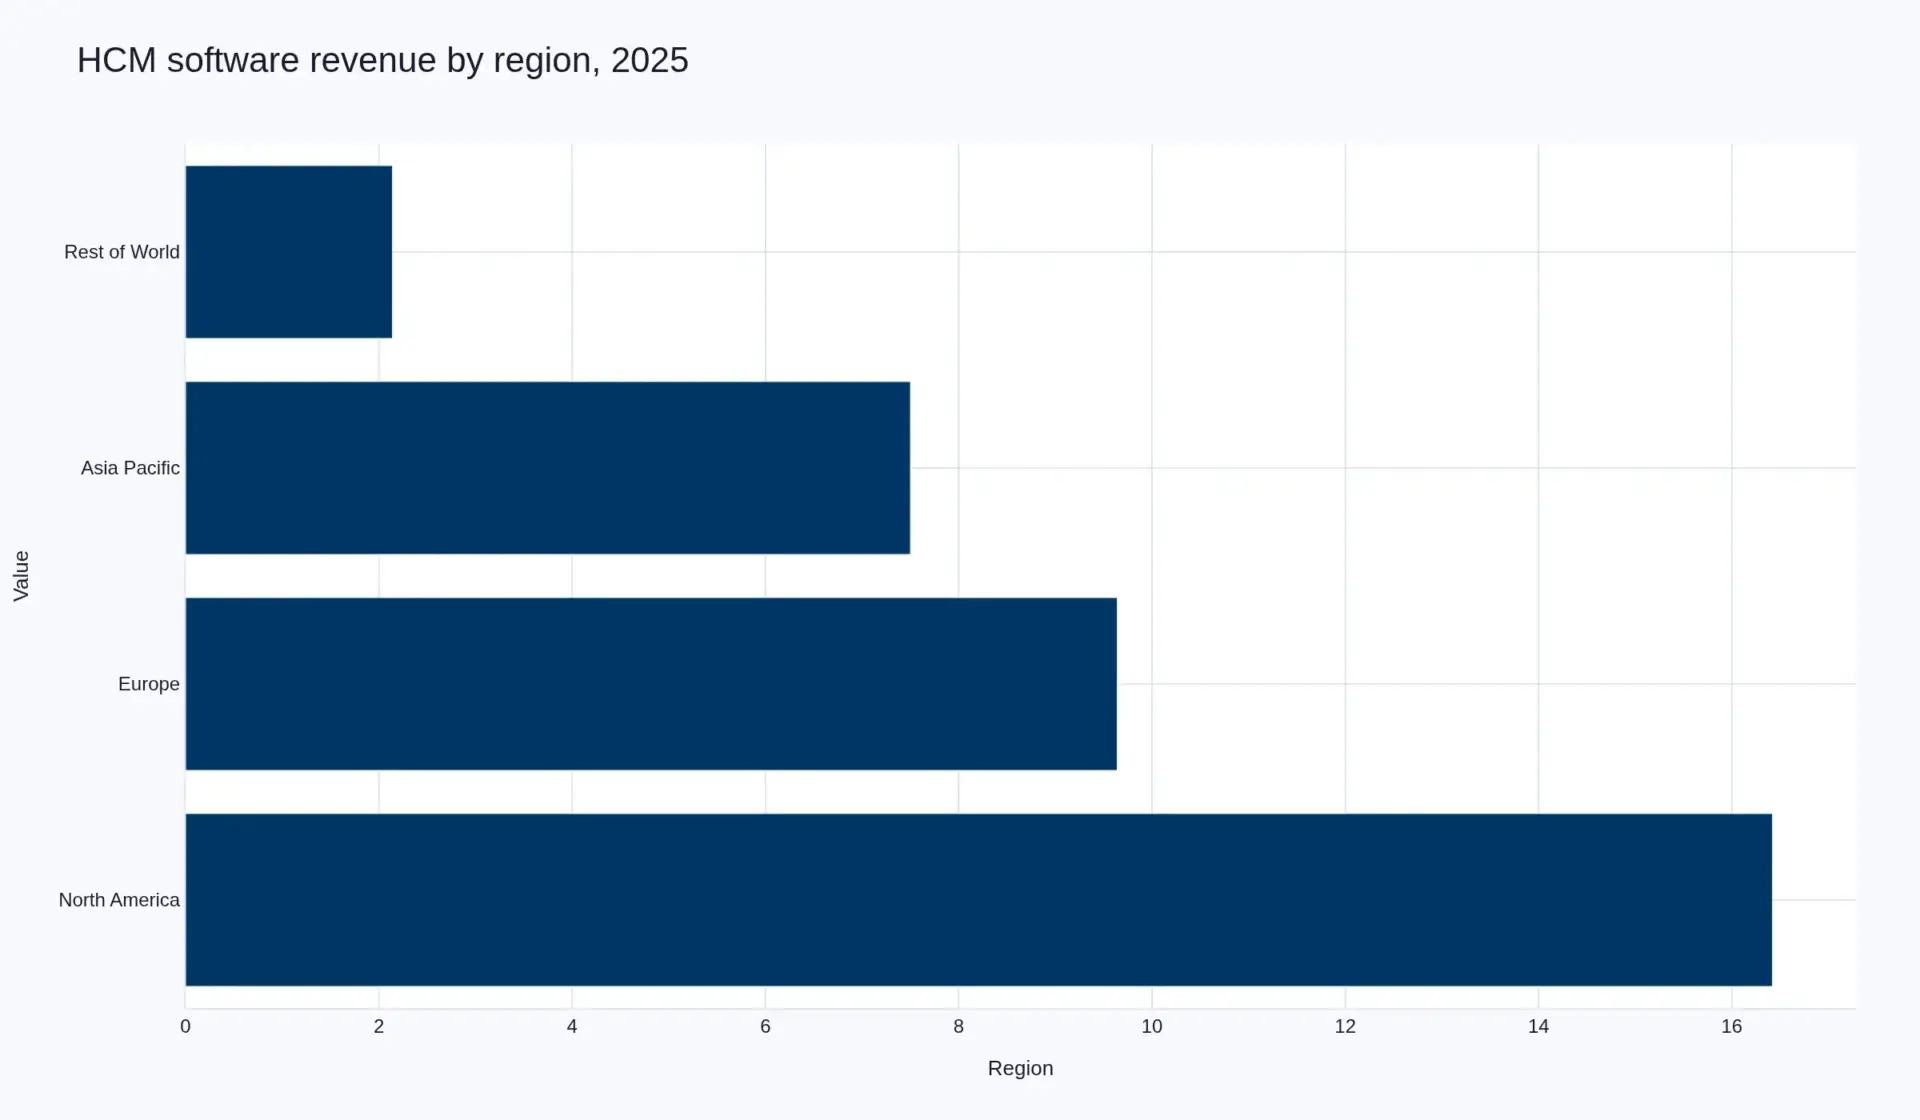
| Region | 2025 (USD bn) | Share | Defining characteristic |
|---|---|---|---|
| North America | 16.42 | 46% | Highest revenue per covered record; four of the five largest vendors headquartered here |
| Europe | 9.64 | 27% | SAP's installed base; the pay transparency and AI Act compliance burden falls here first |
| Asia Pacific | 7.50 | 21% | Fastest volume growth; India, Australia and Japan the largest single markets |
| Rest of World | 2.14 | 6% | Lowest revenue per record; largely payroll bureaux and local vendors |
North America is close to half the market because the largest vendors earn the large majority of their revenue at home: ADP pays one in six American workers, and the SMB payroll cohort - Paycom, Paylocity, Paychex - operates almost entirely inside the United States. That concentration is a growth problem rather than a strength. The vendors with the strongest revenue base have the least exposure to the regions where covered records will grow.
What the forecast deliberately leaves out
- PEO and BPO pass-through. ADP's PEO paid an average of about 762,000 worksite employees in fiscal 2026, and Paychex reports a PEO and insurance segment separately. That revenue is employment administration, not software.
- Client-funds interest. ADP moved USD 3.5 trillion of client funds in the United States in fiscal 2026. The interest on that float is rate-sensitive and would contaminate a software growth rate.
- Outsourced payroll processing fees. Material for the payroll-led vendors, and not software subscription.
- Job advertising and benefits brokerage. Adjacent, cyclical and separately measurable.
Three judgements worth challenging
First, that price per record can compound at 7.8 per cent for eight years. This is the assumption that carries the forecast. It is supported by the first year of metered agent pricing, not by a track record, and the alternative case is set out in full under Market Risk.
Second, that 430 million records is the right denominator. If the true net figure is closer to 380 million, revenue per record is higher at both ends of the forecast and the market total is exactly the same. The denominator changes the interpretation, not the size.
Third, that no new entrant captures the agent layer. If one does, incumbent price growth is lower and total market growth could be higher, because agent spend would be incremental rather than a repricing of existing seats. The forecast would then understate the market while overstating the incumbents - the outcome most likely to surprise a reader who treats those two numbers as the same thing.
Table des matières
Paysage concurrentiel
Sixty-one per cent of the market sits with five vendors, and none holds a quarter of it
This market is concentrated without being dominated. The five largest vendors account for USD 21.9 billion of the 2025 base – 61.3 per cent – and the largest, ADP, holds 20.2 per cent. No vendor has pricing power over the category, and no vendor is small enough to be irrelevant in a head-to-head enterprise deal.
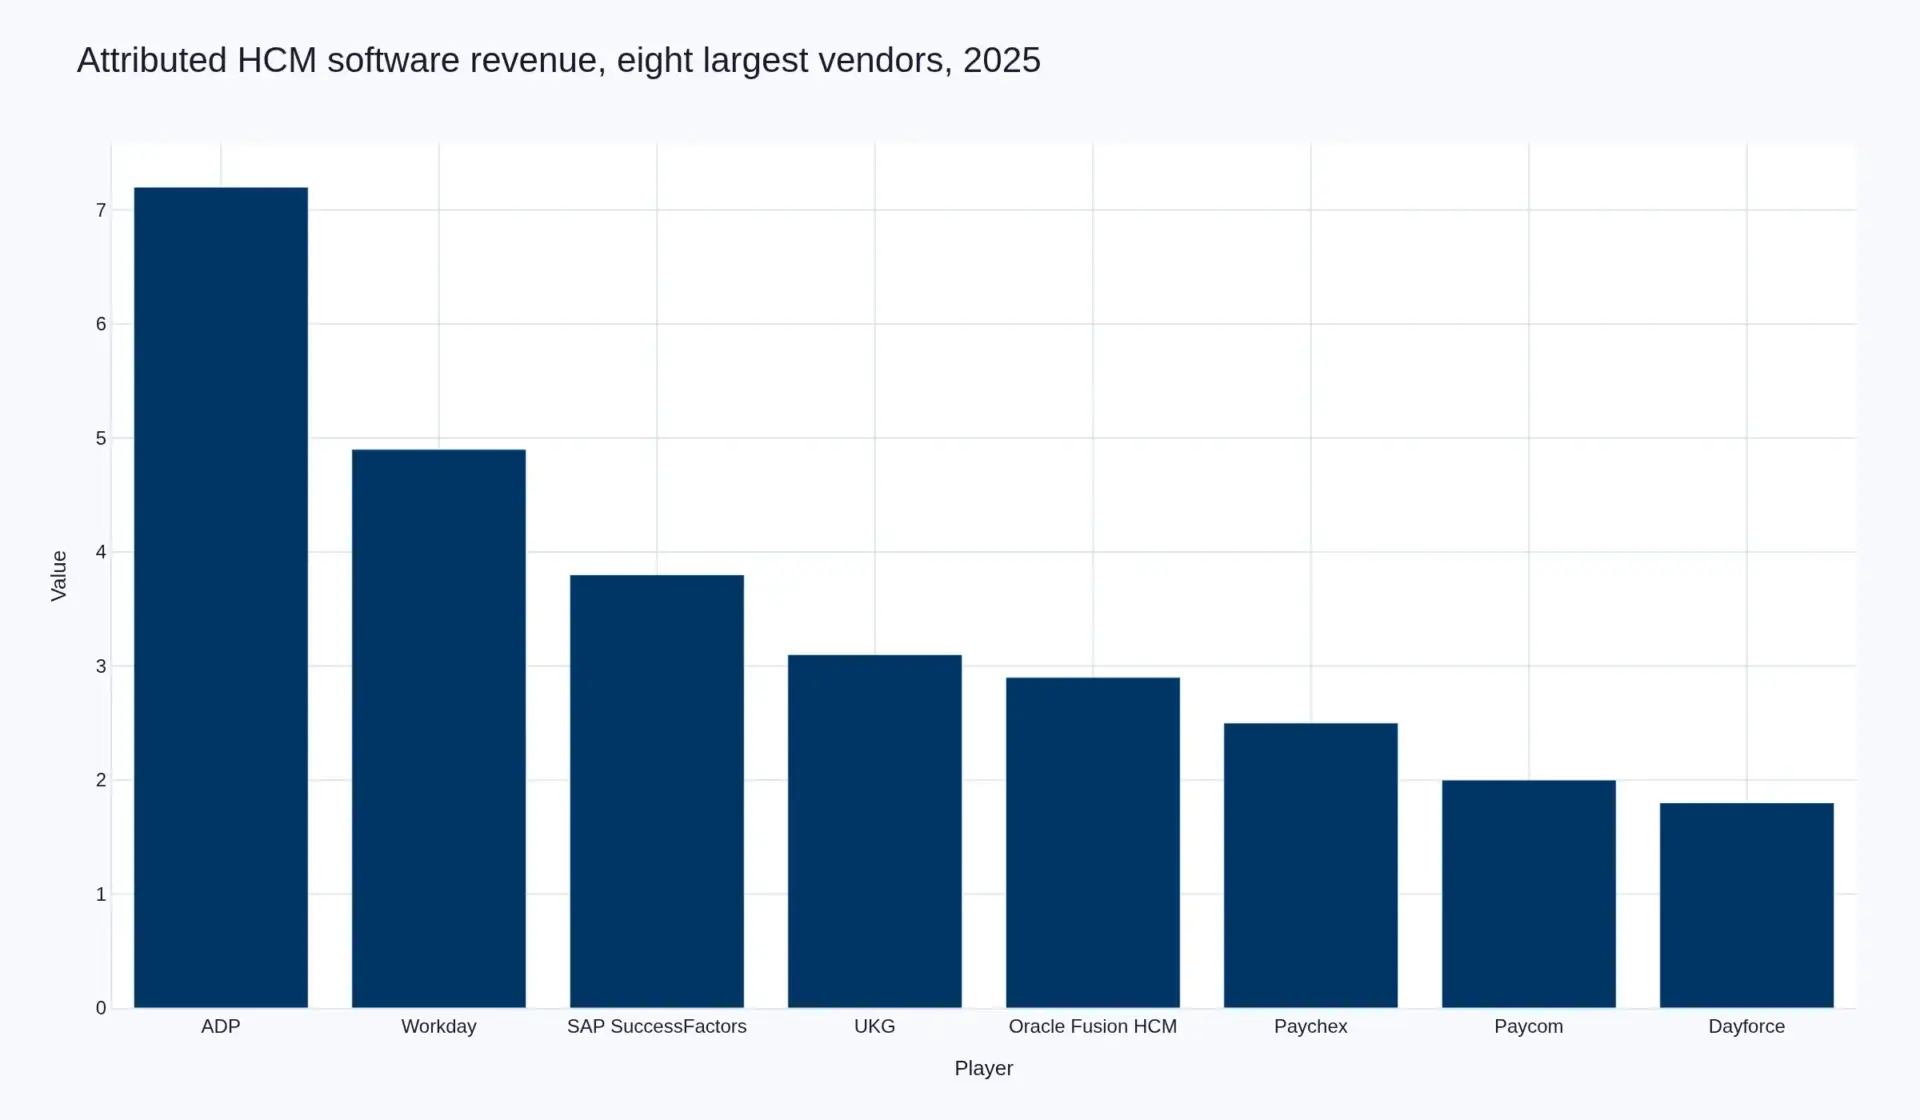
| Vendor | 2025 HCM software revenue (USD bn) | Basis |
|---|---|---|
| ADP | 7.2 | Reported USD 21.9bn fiscal 2026 revenue; software and subscription share of Employer Services, excluding PEO and float |
| Workday | 4.9 | Reported USD 8.833bn subscription revenue; HCM share of a mixed HCM and financials subscription base |
| SAP SuccessFactors | 3.8 | Estimate. Not disclosed separately; anchored on 10,000+ customers and 290 million people |
| UKG | 3.1 | Estimate. Private; anchored on 80,000 organisations and two-thirds of the Fortune 1000 |
| Oracle Fusion HCM | 2.9 | Estimate. Not disclosed separately; embedded in Fusion applications revenue |
| Paychex | 2.5 | Reported USD 6.512bn fiscal 2026 revenue; Management Solutions software share, excluding PEO and insurance |
| Paycom | 2.0 | Reported USD 2.052bn 2025 revenue, 94.5 per cent recurring |
| Dayforce | 1.8 | Estimate. Private since February 2026 |
| Paylocity | 1.7 | Reported USD 1.771bn fiscal 2026 revenue |
| Deel | 1.0 | Estimate. Global payroll and employer-of-record platform |
| Cornerstone and other listed point solutions | 0.7 | Aggregate of listed learning, talent and engagement vendors |
| Rippling | 0.6 | Estimate, implied by its May 2025 valuation round |
| All other vendors | 3.5 | Private mid-market, regional and specialist vendors, including HiBob at more than USD 250m ARR |
Four strategic positions, not one market
Suite incumbents. Workday, SAP and Oracle sell a system of record with a broad module estate, mainly to enterprises above roughly 1,000 employees. Their advantage is completeness; their constraint is that revenue is weighted to the highest-price, slowest-growing part of the market. Workday grew 13.1 per cent in fiscal 2026 to USD 9.552 billion, with subscription revenue up 14.5 per cent and a non-GAAP operating margin of 29.6 per cent – the best growth-margin combination among the large vendors, achieved while absorbing two acquisitions and USD 303 million of restructuring.
Payroll-led SMB and mid-market. ADP, Paychex, Paycom and Paylocity sell payroll first and everything else second. Revenue is a function of clients multiplied by pays per control, and both move slowly: ADP’s US pays per control grew 1 per cent in fiscal 2026 and client revenue retention was flat at 92.1 per cent. The cohort is the cash machine of the category – ADP’s adjusted EBIT margin reached 26.8 per cent and it returned USD 4.7 billion to shareholders – and it is also where growth is decelerating most visibly. Paycom grew 9.0 per cent in 2025 and guided to 6 to 7 per cent for 2026. Paylocity grew 11.0 per cent, faster than its larger SMB peers because it is taking share in the 50 to 1,000 employee band.
AI-native global payroll and employer-of-record. Rippling, Deel and their peers sell the employment relationship across borders rather than the HR record inside one. This is the fastest-growing position in the market and the least profitable at scale, because it carries regulatory licensing and settlement cost. Rippling’s valuation reached USD 16.8 billion in a USD 450 million round in May 2025, up from USD 13.5 billion a year earlier. These platforms are the main structural threat to the payroll incumbents’ float economics, and the main source of new covered records in Europe and Asia Pacific.
Point solutions. Recruiting, learning, engagement, assessment and analytics vendors that sell one module. This is the exposed position. Their functionality is the most reproducible inside a suite and the most replicable by an agent, they hold no payroll content, and they have no float. The consolidation of the past two years has been about buying exactly this capability rather than competing with it.
What the deals reveal about where share moves
Three transactions define the current structure. Thoma Bravo’s USD 12.3 billion take-private of Dayforce, completed on 4 February 2026 at USD 70.00 a share, removed the only public pure-play mid-market HCM suite and signalled that private capital will pay a control premium for a scaled, cash-generative suite. Paychex’s April 2025 acquisition of Paycor added roughly eight percentage points to fourth-quarter Management Solutions growth and pushed Paychex upmarket, where its historic small-business franchise was weakest. Workday’s purchase of Paradox and Sana shows suite vendors buying the AI layer rather than building it, which is faster and, for a company generating USD 2.777 billion of free cash flow, cheap.
The pattern is consistent: capability consolidates upward into whoever owns the record, and the cohort that gets acquired sells a single module with no payroll engine.
The mid-market is the contested ground
The 200 to 5,000 employee band is where four positions collide. ADP, UKG and Workday have all moved downmarket; Rippling has moved upmarket; and specialists such as HiBob, with 4,800 organisations and more than USD 250 million of ARR across a distribution that is 79 per cent European, defend the segment on usability rather than breadth. Buyers in this band have outgrown a simple HRIS but will not accept a nine-month enterprise implementation, which makes implementation speed and price transparency the deciding variables rather than module count.
The competitive consequence by 2033 is a squeeze from both ends. Suite incumbents hold the enterprise record and add metered agent revenue on top of it. Payroll incumbents hold the compliance content and the float. Vendors that do neither are either acquired or watch price per seat decline as buyers consolidate modules into whichever platform already runs their payroll.
Concentration is unlikely to rise much
Despite two years of consolidation, the largest vendor holds a fifth of revenue and the top five hold 61 per cent. That is low for enterprise software: the three largest ERP or CRM vendors routinely exceed 60 per cent between them. The reason is the fragmentation of payroll law. There is no single global payroll engine, only a patchwork of national ones, and every jurisdiction is a foothold for a local vendor. Consolidation will continue in the application layer without producing a dominant vendor – good for buyers, and a real cap on the pricing power that this forecast’s price-growth assumption depends on.
Chaîne de valeur
Who captures the money, and why the software layer does not capture all of it
The value chain of human capital management software is usually drawn as a stack of modules – core HR, payroll, time, recruiting, learning, performance – sitting on a database. That drawing is accurate about the product and useless about the economics. The money in this market is distributed by a different logic: whoever holds the system of record for employee identity collects the subscription, whoever holds the tax and filing content sets the switching cost, and whoever holds the money flow collects the float.
Layer one: the system of record
Core HR – the employee master record, org structure, job architecture, position management – is the least glamorous and most defensible part of the chain. Once an organisation’s job architecture and employee history live in a system, every other module reads from it, every downstream report depends on it, and replacing it requires a data migration with no tolerance for error. That is why core HR renewals are rarely contested on price alone, and why so many enterprise agreements are, in practice, multi-decade relationships renewed without a competitive process.
Licensing in this layer is per employee per month, tiered by headcount band, and frequently sold as a bundle of three to five modules where the incremental module is priced well below its standalone list. The bundling is rational for both sides: the vendor raises revenue per account without a new procurement cycle, and the buyer avoids integrating a point solution whose data model will never quite match the core.
Layer two: the transaction engines, and where the content moat actually sits
Payroll and time and attendance are where an HR platform becomes operationally irreplaceable, because they are the only HR processes with a statutory deadline attached to a financial penalty. Payroll is also where the content lives. Multi-country payroll requires a maintained library of tax rules, filing formats, statutory rates, works council agreements and local benefit rules across every jurisdiction served. ADP serves clients in more than 140 countries and territories; that library is not software in any conventional sense. It is an annually renewed compliance asset with a large fixed cost and almost no marginal cost.
This is the real barrier in the category, and it explains why payroll consolidates while every other HR module fragments. A new entrant can build a competent performance management product in a year. A compliant payroll engine across thirty countries takes a decade of accumulated rule maintenance and a network of local filing agents, and the rules change every year.
Layer three: the money flow, the part that analysis usually misses
Payroll is not only a software business; it is a payments business with a very large balance sheet attached. ADP moved USD 3.5 trillion in client funds in the United States in fiscal 2026, holding those funds between the employer debit and the employee credit. Interest on client funds is a revenue line, not a footnote. It moves with short rates, and it is close to pure margin.
That structural feature explains several things at once: why payroll incumbents could price software aggressively through a decade of cloud migration without losing share, why they carry investment-grade credit ratings that software companies generally do not, and why private capital paid a control premium for a scaled HCM suite in 2026. It also reframes the competitive threat from AI-native global payroll platforms. The threat is not primarily to the product. It is to the balance sheet: an intermediary that moves money across borders, employs workers of record and settles in local currencies inserts itself between the employer and the float.
Layer four: implementation, and the services drag that is not quite a drag
Around the software sits a services layer – systems integrators, managed payroll bureaux, benefits administrators and the vendor’s own professional services arm. Enterprise implementation routinely runs nine to eighteen months, and services revenue carries a materially lower gross margin than subscription. The conventional reading is that services dilute software economics.
The evidence does not support that as cleanly as it used to. ADP, which is more than half services and payments by revenue, reported an adjusted EBIT margin of 26.8 per cent in fiscal 2026. Workday, which is almost entirely subscription, reported a non-GAAP operating margin of 29.6 per cent. Two very different business models have converged to within three points of each other. On one side the float and the scale have paid for the services drag; on the other, fifteen years of cloud margin expansion have done the work. The margin gap that justified a premium valuation for pure software over payroll services no longer exists at the operating line.
Layer five: workforce data, the newest and least proven asset
The largest vendors now sit on datasets no single employer could assemble. UKG reports data from more than 65 million employees, 30 billion frontline interactions, 9 billion schedules and 8 billion punches. Workday reports more than 75 million users under contract. ADP delivers over 79 million employee tax statements a year in the United States alone.
The strategic claim made for these datasets is that they are the raw material for benchmarking products and for training agents that understand workforce behaviour. Part of that claim is real: compensation benchmarking and attrition prediction genuinely improve with pooled data, and neither is replicable by a small vendor. Part of it is not. The data is siloed by contract, cannot be freely pooled, and the value of a benchmark product is a small fraction of the value of the subscription it is bolted onto. Data is a differentiator at the margin of the product; it is not a moat around the revenue.
Where margin migrates to 2033
The pattern across the forecast period is a squeeze on the middle of the chain. Point solutions with no payroll engine, no system of record and no float will keep losing pricing power, because their functionality is the easiest to reproduce inside a suite and the easiest for an agent to replicate. The vendors that hold the record, the rules and the money flow keep the subscription and add a metered AI layer on top of it.
The services layer will be the first to feel agentic automation, because implementation and tier-one payroll support are the most documentable, most repeatable work in the entire chain – and therefore the most automatable. That is where the first visible gross margin movement should appear, and it is the part of the value chain most exposed to the same technology that the vendors are selling.
Activité d'investissement
Public HCM became a cash-return sector while private capital bought the control positions
The capital structure of this market changed character in 2026, and that change is now the clearest signal about its maturity. The listed vendors are no longer valued primarily for growth. They are valued for free cash flow, and they are returning it.
Workday generated USD 2.939 billion of operating cash flow in fiscal 2026, up 19.4 per cent, and USD 2.777 billion of free cash flow, up 26.7 per cent, on revenue of USD 9.552 billion. It repurchased approximately 12.8 million Class A shares during the year and closed two acquisitions – Paradox in the third quarter and Sana in the fourth – while absorbing USD 303 million of restructuring. A company doing all four at once out of operating cash flow is not a growth company funding expansion; it is a mature platform reallocating its own cash.
ADP returned USD 4.7 billion to shareholders in fiscal 2026, its fifty-first consecutive year of dividend increases, while carrying AA- / Aa3 / AA- ratings from S&P, Moody’s and Fitch – the strongest in the category, and a direct consequence of the client-funds balance sheet described in the Value Chain chapter. Paychex returned USD 2.2 billion. Paylocity repurchased USD 398.1 million of stock, or 2.8 million shares, in fiscal 2026, taking its programme since May 2024 to USD 697.8 million.
What the Dayforce transaction actually priced
Thoma Bravo’s acquisition of Dayforce is the defining transaction of the cycle. The agreement was announced on 21 August 2025, approved by Dayforce stockholders on 12 November 2025, and completed on 4 February 2026 at USD 70.00 per share in cash, for approximately USD 12.3 billion. The stock ceased trading and was delisted from both the New York and Toronto exchanges.
Three things about it matter more than the price. First, it removed the only listed pure-play mid-market HCM suite, which leaves the remaining public comparables either larger and slower (ADP) or smaller and United States-only (Paycom, Paylocity), and leaves the mid-market without a public benchmark. Second, it was a control transaction for a cash-generative suite rather than a growth bet – the strategic logic stated by both parties was scale, customer value and AI investment as a private company. Third, it demonstrates that the discount public markets apply to payroll-adjacent software does not hold in private markets, where the float, retention and cash conversion are priced directly.
Paychex’s acquisition of Paycor in April 2025 is the second structural deal. It moved a small-business payroll franchise upmarket into the 100 to 1,000 employee band, and Paychex disclosed that Paycor contributed roughly eight percentage points to fourth-quarter Management Solutions growth. Mid-market HCM capacity is being bought, not built.
Where growth capital is going instead
Private capital is doing two different things at once. Sponsors are buying cash-generative suites and taking them private. Venture and growth investors are funding a different thesis altogether: the cross-border employment layer. Rippling raised USD 450 million in May 2025 at a USD 16.8 billion valuation, up from USD 13.5 billion a year earlier, in a round with no lead investor and with the company stating that an IPO was not imminent.
The distinction is instructive. The sponsor thesis is that HCM suites are infrastructure with predictable retention and should be levered. The growth thesis is that the headcount relationship itself is migrating to platforms that can employ, pay and comply across borders, and that the incumbents’ national payroll engines are a liability in a remote-first labour market rather than an asset. Both can be right at once, because they are buying different cash flows: the sponsor buys the installed base and the renewal, the growth investor buys the new covered record.
What this means for pricing power, and for the forecast
Capital allocation has a direct consequence for the price-growth assumption in this report. A vendor buying back shares and paying a growing dividend has committed to returning cash, which limits how much it will spend on speculative product development. A sponsor-owned vendor carrying acquisition debt has committed to margin expansion, which pushes it toward price increases on renewals and toward packaging AI as a paid tier rather than a bundled feature.
Those incentives support the base case: agent capability arrives as an upsell with a rate card, not as a giveaway. They also define the main downside path. If two large vendors decide to bundle agents free to defend renewals, the price line collapses quickly, because that decision would be made by two or three management teams rather than by a market.
The investment conclusion for the forecast period is therefore narrower than “AI in HR is growing”. Capital is flowing to the two ends of the value chain – the compliance record that cannot be replaced and the cross-border employment relationship that is being created – and away from the middle, where single-module vendors sit. That is the same conclusion the competitive analysis reaches from market share, arrived at from cash flow instead.
Technologie et innovation
Three layers of software, and only one of them can be rebuilt by a model
An HCM platform is three different kinds of software wearing one interface. The first is a system of record: employee identity, job architecture, org hierarchy, compensation history. The second is a set of deterministic transaction engines: payroll calculation, tax filing, time capture, statutory reporting. The third is an intelligence layer that reads the first two and produces recommendations – who to hire, what to pay, who is about to leave, who is available for a role.
The first two cannot be replaced by a language model, and that constraint is the most important technical fact about agentic AI in this category. A payroll engine that is 99.5 per cent accurate is not a payroll engine; it is a liability. Statutory calculation has to be deterministic, auditable and reproducible to the cent, which is why the core of every HCM suite remains conventional software and will remain so through 2033.
The third layer is where the model goes, and it is where revenue is starting to move. Recruitment screening, candidate matching, policy Q&A, case triage, schedule optimisation, compensation benchmarking, attrition modelling and internal mobility matching are all tolerant of probabilistic output in a way payroll is not, and all of them consume work that was previously done by a person reading documents.
What the vendors have actually shipped
Workday now describes itself as an enterprise AI platform for managing people, money and agents, and bought its way into two adjacent capabilities during fiscal 2026: Paradox, a conversational recruiting platform, closed in the third quarter, and Sana, an AI assistant business, closed in the fourth. Sana is the front end through which Workday exposes agents, and the company describes it as both a new AI experience and a way to connect, orchestrate and manage agents across the enterprise using the existing security, permissions and audit framework.
SAP’s route is Joule, its copilot layer, which SAP markets with a claim that everyday HR tasks complete 90 per cent faster – a vendor figure, not an independently measured one. UKG has positioned its platform around frontline work specifically, and its scale claims are unusually concrete: data from more than 65 million employees, 30 billion frontline interactions, 9 billion schedules and 8 billion punches, across 80,000 organisations and two-thirds of the Fortune 1000. Oracle embeds agents inside Fusion applications rather than selling them separately.
The metering mechanism is the real innovation
Workday’s Flex Credits matter less for what they cost than for how they are counted. Credits are purchased annually in bulk and consumed when an eligible agent or platform capability runs in production. The rate card meters by skill: an agent retrieving information consumes one credit per action, an agent completing a task autonomously consumes five. Complimentary credits are allocated by company size so a customer can test agents in production and build a budget from observed usage rather than a forecast. Because credits can be switched between capabilities inside the product, a customer can reallocate spend without a new procurement cycle – which removes the single largest friction in enterprise software expansion.
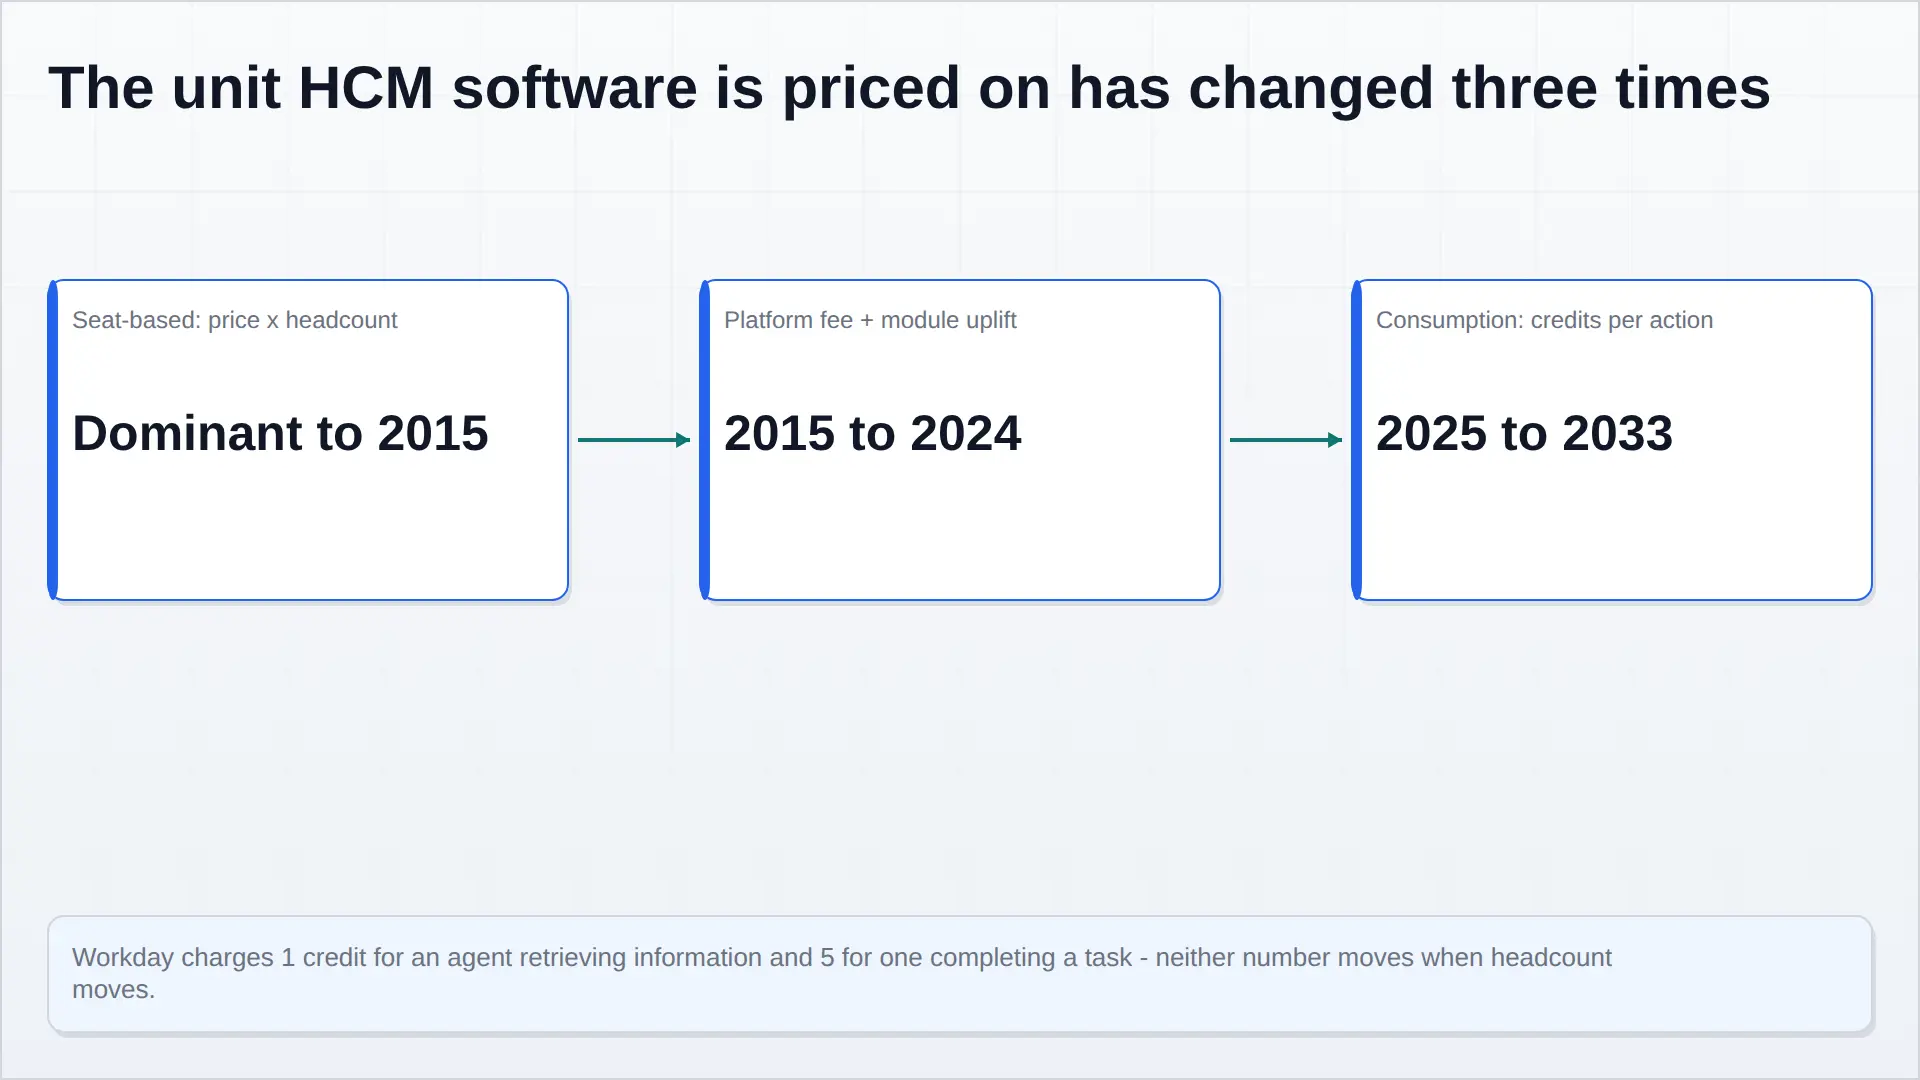
Two things follow. First, vendor revenue becomes decoupled from the customer’s employee count, which is valuable in a downturn and useful when a customer shrinks. Second, customer spend becomes harder to budget, which is why the annual bulk purchase exists – it is a budgeting device dressed as a pricing model. The design reveals the vendor’s own view of the risk: pure consumption pricing on agents would produce revenue volatility that neither side wants.
Where agents earn their credits, and where they will not
The use cases with measurable value in 2026 are narrower than the marketing suggests. Four stand out.
- Employee and manager self-service. Policy questions, payslip explanations, leave rules and benefits eligibility are high-volume, low-risk and document-based. This is where the retrieval credit is spent, and it substitutes directly for tier-one HR service desk labour.
- Recruitment screening and scheduling. The highest-volume administrative cost in hiring, and the most heavily regulated – see the Regulatory Landscape chapter, where this exact use case is classified high-risk in the European Union.
- Payroll anomaly detection. Not payroll calculation, but the review of exceptions before a run: a far easier problem than calculation, with a quantifiable error cost avoided.
- Frontline scheduling. Where the labour model is genuinely combinatorial, agents that draft schedules against demand forecasts and local rules produce measurable savings – and where UKG’s dataset advantage is most concrete.
What does not work yet is anything requiring a judgement the company will be held legally accountable for: final hiring decisions, termination recommendations, pay-setting. The technology can draft; accountability stays with a person. That ceiling is a feature of this market rather than a temporary limitation, and it caps how much work can be fully handed to an agent – which in turn caps how much consumption revenue a vendor can earn per employee.
Implementation is the bottleneck nobody prices
Enterprise HCM deployment still takes nine to eighteen months, and the largest single cause of delay is data: cleaning job architectures, deduplicating employee records, mapping legacy pay codes. Agents do not fix that. They can accelerate mapping work at the margin, but customer data quality remains the binding constraint on time-to-value.
This is where the next competitive advantage is likely to sit, and it is unglamorous. A vendor that can present a credible, auditable migration from a legacy system in a quarter rather than a year converts more mid-market accounts than a vendor with a better agent catalogue. It is also why the payroll incumbents remain dangerous: their client data is already clean, because they have been running it.
What this means for the forecast
This chapter carries the 16.5 per cent CAGR assigned to HR analytics, planning and embedded intelligence – the fastest of the five segments, from USD 2.86 billion in 2025 to USD 9.70 billion in 2033 – and a portion of the price growth in the other four. That is a bet that metered agent revenue compounds, not a bet that agents replace the transaction engines. If agents turn out to be a feature incumbents bundle for free to defend renewals, the analytics segment still grows and the price line does not – which is precisely the downside case set out under Market Risk.
Risque de marché
The total is defensible; the price line is the bet
Nine of the ten assumptions in this forecast are conventional and well supported by disclosure. The tenth – that the price a vendor earns per covered employee record can compound at 7.8 per cent for eight years – is not supported by a track record, because the practice is only about a year old. The scenario table below shows exactly how much of the forecast rests on it, with volume held constant in every case.
| Scenario | Price per record, 2033 | 2033 market (USD bn) | CAGR 2025-2033 | What has to be true |
|---|---|---|---|---|
| Downside | USD 114 | 59.1 | 6.5% | Price grows 4% a year: agents are bundled free to defend renewals, and metered credits stay a small add-on |
| Base | USD 152 | 78.8 | 10.4% | Price grows 7.8% a year: metered agent revenue compounds and renewals carry an AI tier |
| Upside | USD 178 | 92.5 | 12.6% | Price grows 10% a year: agent consumption becomes the primary growth line, and compliance deadlines tighten the market |
The spread between the outer cases is USD 33.4 billion of 2033 revenue, on the same headcount. That is the range a buyer of this market is actually taking a view on, and it is wider than the range created by any plausible assumption about employment.
Risk register
| Risk | Probability | Impact | Leading indicator to watch |
|---|---|---|---|
| Price-per-record deflation as agents reduce administrative headcount | High | High | Net revenue retention split between seat revenue and consumption revenue in vendor disclosure |
| Agent capability bundled free to defend renewals | Medium-High | High | Any major vendor withdrawing its AI rate card or folding credits into the base subscription |
| Employment downturn compressing pays per control | Medium | Medium | ADP US pays per control, currently growing 1% a year |
| Screening litigation reallocating liability to vendors | Medium | Medium | Class certification and expert discovery in Mobley v. Workday |
| Regulatory divergence raising cost without raising demand | Medium | Low-Medium | Member state transposition count against the 7 June 2026 deadline |
| Cross-border platforms disintermediating the payroll float | Medium | Medium | Employer-of-record revenue growth versus payroll incumbent float income |
| Sponsor leverage constraining product investment after take-private | Medium | Low | Dayforce R&D disclosure once private, and renewal pricing behaviour |
| Payroll data or payment security incident | Low | Very high | Any breach affecting a payroll processor’s client-funds or tax-filing infrastructure |
The structural risk: the customer’s headcount is the vendor’s revenue
No other large software category has this particular misalignment. A vendor selling a seat licence for a design tool benefits when its customer hires designers. An HCM vendor’s largest revenue line is billed per employee, and the product it is now shipping exists in part to reduce the administrative work those employees’ HR departments do. If agents succeed at the extreme – a self-service agent handling the questions a tier-one HR desk handles today – the customer’s response is to shrink that desk, and the vendor’s seat count shrinks with it.
The industry’s answer is to change the unit, which is what metered credits do. But the answer contains its own risk: consumption revenue is volatile, harder to forecast for the customer’s finance team, and easy for a procurement function to cap. Workday’s design already concedes this by selling credits as an annual bulk purchase rather than pay-as-you-go. That structure protects the vendor’s revenue visibility at the cost of making credits behave, from the buyer’s perspective, a good deal like the subscription they replaced.
The honest reading is that the industry has not yet proved it can grow revenue per employee faster than it reduces cost per employee. The base case assumes it can. The downside case assumes it cannot.
The second risk: bundling
The fastest way for an incumbent to defend a renewal against an AI-native challenger is to give the agents away. That decision costs a management team very little in the quarter – inference cost is small relative to subscription revenue – and it destroys the pricing architecture for everyone. It is the single most likely route to the downside case, and it would be invisible in unit economics for at least two quarters. The signal to watch is not a price cut; it is a vendor quietly withdrawing a published AI rate card or folding credits into a base subscription tier.
The cyclical risk is smaller than it looks, and asymmetric
HCM revenue is more employment-linked than most software, because the payroll cohort bills per pays per control. ADP grew US pays per control by 1 per cent in fiscal 2026, which is the number its revenue base moves with. In a downturn, that line goes negative and the whole payroll segment contracts in a way a seat-based SaaS business does not. But the same feature supports the AI transition: if a vendor’s revenue is decoupled from headcount by metered credits, a shrinking customer is no longer a shrinking account. In a downturn, the pricing model change that threatens the incumbents is also their hedge.
Liability, regulation and the cost of getting it wrong
Screening litigation is the risk with the largest gap between probability and consequence. The pleading stage of Mobley v. Workday established that a vendor can be treated as a participant in an employment decision, and if that position survives class certification the entire recruitment module category acquires a liability that must be insured, documented and priced. The mitigation is already visible in the product roadmap – explainability, audit logs and human-in-the-loop review – and it raises cost for everyone at the same time, which favours the vendors large enough to absorb it.
Regulatory divergence is a smaller risk than it appears, and mispriced in the opposite direction by most commentary. The AI Act deferral to 2 December 2027 did not reduce the eventual compliance burden; it moved it past the forecast window’s early years. The pay transparency patchwork reduced the chance of a single sharp demand spike and raised the chance of a steady, multi-year one. Neither of those is a threat to the forecast; both are reasons the growth curve is flat rather than steep in 2027 and 2028.
What would actually break the forecast
Three events would move the number materially, and none of them is a recession. First, a major vendor bundling agents free and forcing the rest of the market to follow, which removes the price line. Second, a payroll or tax-filing security incident at a top-five processor, which would slow enterprise replacement cycles for two years and hand the initiative to smaller, newer vendors. Third, a credible agent platform that sits outside the HCM suite entirely – an enterprise assistant that reads the HR system through an API and answers employee questions without consuming an HCM credit – which would take the fastest-growing segment away from the vendors whose forecast this is. The third is the one that would surprise the market most, because it would not look like an HCM company until it had already won.
Paysage réglementaire
Three regulators, three tests, and a clock that moved in the market’s favour
HCM software sits at the intersection of three regulatory regimes, built independently, imposing different tests on the same product. The European Union classifies the software. European employment law dictates what the software must compute and disclose. United States state law and litigation allocate liability when it gets it wrong. A vendor selling a recruitment module into a multinational in 2027 has to satisfy all three, and the compliance cost is largely fixed rather than volume-driven – which is itself a competitive force favouring suites over point solutions.
The European Union: classification, and a two-year deferral
The AI Act treats employment as a high-risk domain. Under Annex III point 4(a), AI systems intended to be used for the recruitment or selection of natural persons are high-risk, and the Commission’s AI Act Service Desk sets out worked examples that leave little room for interpretation: an automated job matching and ranking tool that scores and shortlists candidates is high-risk; a sourcing tool that searches job boards and social platforms and generates a candidate shortlist is high-risk; and a platform that ranks self-employed service providers for consumers is high-risk too. The service desk addresses and rejects the obvious escape route, noting that the Article 6(3) exceptions do not apply where the system has a material influence on the outcome of decision-making.
What changed in 2026 is timing, and the change matters to anyone modelling compliance-driven demand. The simplification regulation in the Omnibus VII package received the Council’s final approval on 29 June 2026 and sets a fixed, delayed application date for high-risk rules: 2 December 2027 for stand-alone high-risk AI systems and 2 August 2028 for high-risk systems embedded in products. Most of the Act’s rules came into force on 2 August 2026.
The same instrument did several other things that matter to HCM providers. It postponed the deadline for national AI regulatory sandboxes to 2 December 2027. It shortened the grace period for transparency solutions for artificially generated content from six months to three, with a new deadline of 2 December 2026. It reinstated the obligation on providers to register systems in the EU database for high-risk systems even where they consider themselves exempt from classification. And it reinstated a strict-necessity standard for processing special-category personal data for the purpose of bias detection and correction – a provision that matters enormously for recruitment AI, because measuring adverse impact requires processing exactly the protected-characteristic data that data protection law otherwise restricts.
The commercial reading is straightforward. Recruitment AI did not lose its high-risk status; it gained two more years to be built properly. Vendors that treated August 2026 as the deadline can now ship a compliant, auditable screening product into a market where a competitor’s rushed one cannot be sold. That is an advantage, not a reprieve.
Pay transparency: the deadline that was missed, and why the miss matters
Directive (EU) 2023/970 required member states to transpose pay transparency measures into national law by 7 June 2026, and EUR-Lex records national transposition measures against that date. The compliance record is poor: only Italy, Lithuania, Malta and Slovakia met the deadline, with Greece finalising legislation shortly afterwards with a 1 November 2026 effective date and Estonia partially implementing some aspects in July. Most member states were still working through draft legislation into the fourth quarter of 2026.
A missed directive deadline is usually a legal problem for governments. Here it is a product problem for vendors and a purchasing problem for employers. The directive’s obligations – pay information available to candidates, reporting on gender pay gaps for larger employers, and joint pay assessments where gaps are unjustified – all depend on one underlying capability: job architecture with a defensible equal-value methodology, and payroll data that can be cut by gender, grade and function without manual reconciliation. Most legacy HR estates cannot do that, because job levelling lives in a spreadsheet and pay data lives in three payroll systems.
The result is a replacement trigger that is not driven by dissatisfaction with the incumbent. Employers facing a reporting obligation they cannot meet with their current system buy a new one. The patchwork pace of transposition spreads that trigger across 2026 to 2028 rather than concentrating it, which is one reason growth in this forecast is spread evenly rather than front-loaded.
The United States: developer duties arrive at state level
Colorado repealed and re-enacted its algorithmic discrimination law in 2026. Senate Bill 24-205 created consumer protections from algorithmic discrimination in consequential decisions; Senate Bill 26-189, signed in May 2026, repeals and re-enacts those provisions with new requirements, effective 1 January 2027.
The design is unusual for the United States, because it regulates developers as well as deployers. A developer of automated decision-making technology used to materially influence a consequential decision must, from 1 January 2027, give the deployer technical documentation describing intended uses, categories of training data, known limitations and instructions for appropriate human review; must notify deployers of material changes; and must retain records demonstrating compliance for at least three years. Deployers must give consumers clear notice at the point of interaction and, where the technology produces an adverse consequential decision, provide a plain-language description of its role within 30 days. Employment is expressly within the definition of a consequential decision.
For an HCM vendor that converts product documentation from a marketing asset into a legal one. A model card and a human-review workflow stop being nice to have and become the deliverable that lets a Colorado employer buy the product at all.
Litigation is the third regulator, and it targets the vendor
The most consequential development for vendor liability is not a statute. In Mobley et al. v. Workday, No. 3:23-cv-00770 (N.D. Cal.), four named plaintiffs allege that Workday’s algorithm-based applicant screening tools discriminated against them and other similarly situated applicants on the basis of race, age and disability. On 22 June 2026 the court granted in part and denied in part Workday’s motion to dismiss the third amended complaint, holding among other things that the plaintiffs had adequately pled a nexus to California for state law claims because the screening technology was designed, developed and operated from Workday’s California headquarters.
Whatever the eventual merits, the structural point is now established at the pleading stage: a vendor of screening software can be treated as a participant in the employment decision rather than as a neutral tool supplier. That reallocation of exposure is what makes auditability a product feature with a price. An employer choosing between two screening products in 2027 has a reason to prefer the one that can produce a defensible record of why each candidate was ranked where they were – and a vendor without that capability carries a liability it cannot price.
What is assumed in the forecast
This report assumes no material compliance-driven acceleration in 2026 and no cliff in 2027. The AI Act deferral removes a deadline many vendors had been building toward, and the pay transparency patchwork spreads demand across three years. Both assumptions push growth later and flatten it, which is why the forecast grows at 10.4 per cent rather than at the 13 to 15 per cent a single harmonised 2026 deadline would have produced. A reader who expects the Commission to enforce the December 2027 date strictly, and member states to converge on pay transparency by 2028, should expect a higher terminal value than the base case.