
Global Coding and Marking Equipment Market Report, Size, Share and Forecast 2026–2033
The date that governs the ink
The Food and Drug Administration's page for the Food Traceability Rule states its compliance date twice, and the two statements do not match. Under the heading "Compliance Date" the page explains that the original date for all persons subject to the recordkeeping requirements was Tuesday, 20 January 2026; that the agency proposed to extend it by 30 months to 20 July 2028; and that the Continuing Appropriations, Agriculture, Legislative Branch, Military Construction and Veterans Affairs, and Extensions Act of 2026 directed the agency not to enforce the rule before that same date. Further down the same page, under "Getting Started", it still reads: "The compliance date is January 20, 2026." (FDA, FSMA Final Rule on Requirements for Additional Traceability Records for Certain Foods)
That contradiction is not a curiosity. It is the shape of the demand. A lot code, a date code and a batch code are the cheapest compliance artefacts in a food supply chain and the only ones applied at production-line speed. The machines that apply them are bought because a third party requires a mark, and the third party is almost always a regulator or a retailer. That makes coding equipment forecastable in a way most industrial capital goods are not, provided you track the dates, and provided you accept that the dates move.
This report sizes that market bottom-up from installed machines rather than asserting a growth rate, and it answers the question a buyer or an investor actually faces in the fourth quarter of 2026: what does FSMA 204 do to demand for coders?
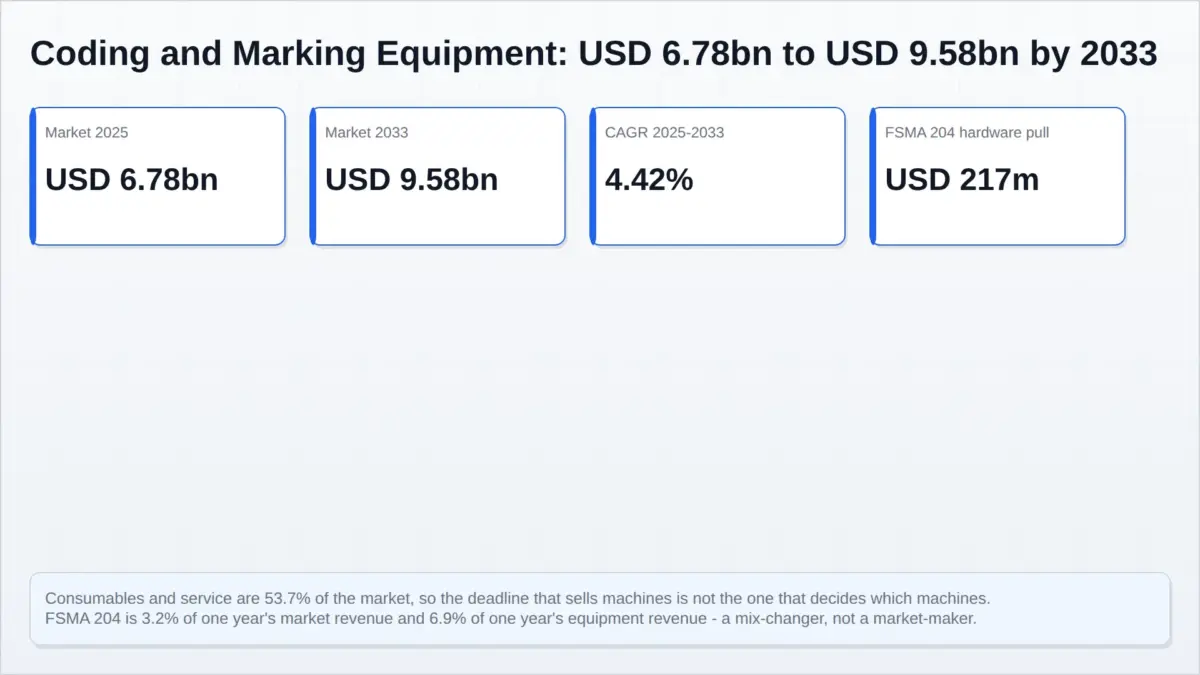
The answer is smaller and far more specific than the marketing around it implies. FSMA 204 is not a market-maker. It is a mix-changer. The rule's total hardware pull is on the order of USD 217 million, spread across roughly 12,000 establishments over three years, which is about 6.9% of one year's global coding-equipment revenue and 3.2% of one year's total market revenue including consumables. What the deadline changes is not how many machines are sold. It is which machines. A human-readable date coder is adequate for an obligation that never existed. A 2D-capable print-and-apply system with vision verification is what a traceability lot code actually asks you to own.
The market, sized in two lines rather than one
A coder purchase is really four purchases: the machine, the consumables, the service contract and the line integration. In a large share of installations the coder arrives as part of a packaging line and never appears as a separate line item in anyone's accounts. Splitting the market into equipment and aftermarket is therefore not a presentational nicety. It is the only way to see what the business is.
| Revenue line | 2025 (USD bn) | 2033 (USD bn) | CAGR | Share of 2025 |
|---|---|---|---|---|
| Equipment: new and replacement machines | 3.14 | 4.34 | 4.14% | 46.3% |
| Consumables, fluids and service | 3.64 | 5.24 | 4.65% | 53.7% |
| Total coding and marking | 6.78 | 9.58 | 4.42% | 100% |
The aftermarket is bigger than the equipment market and grows faster than it. That single fact explains almost every commercial behaviour in this industry: why coders are sold close to cost, why the salesforce is organised around service contracts, why the incumbents have held share for three decades, and why a slipped regulatory deadline does less damage than an outsider expects. An installed base is an annuity, and it does not care whether the customer bought a machine this quarter.
How the number was built
No public figure for this market survives contact with its own definition. Published totals variously mix equipment with aftermarket, include labelling systems that do not compete for the same job, and count case coders and primary-pack coders as one thing. So the size here is constructed from five disclosed parameters, and every one of them is stated so a reader can move it:
- Global installed base: 1,300,000 devices. Anchored on Videojet's own claim of more than 400,000 printers installed worldwide across 135-plus countries and 20-plus industries, which at the observed four-vendor concentration of this market implies a global base in the 1.2 to 1.5 million range. Videojet's share of that base works out to 30.8%.
- Service life: 8 years. Machines are replaced on failure and obsolescence, not on a schedule.
- Installed-base growth: 2.6% a year, tracking global packaging volume plus gradually rising coding penetration in emerging markets.
- Blended equipment price: USD 16,000 in 2025, escalating 1.5% a year as the mix shifts toward 2D-capable and vision-verified systems, partly offset by thermal-inkjet deflation.
- Aftermarket revenue: USD 2,800 per installed device per year - ink, makeup solvent, ribbons, labels, spare parts and service - escalating 2.0% a year.
The resulting volumes are 196,300 machines shipped in 2025 rising to 241,000 by 2033, a 2.60% CAGR. Two independent routes land in the same place. The installed-base model above produces USD 6.78 billion for 2025. Summing the disclosed revenue of the major vendors plus an estimate for the long tail produces roughly the same figure. That convergence is the strongest evidence in this report, and it is still an estimate - the sensitivity band is set out in the risk chapter.
The FSMA 204 number, and the number it replaces
Here is where the market's own marketing fails it. The FDA's final regulatory impact analysis counts 484,124 covered establishments and 323,872 covered firms (FDA, Final Regulatory Impact Analysis summary). Multiply 484,124 by a plausible device price of USD 18,000 and you get USD 8.71 billion. That is 1.29 times the size of the entire global coding market in a single year, and 40 times the demand the rule can actually create.
The error is definitional rather than arithmetic. Most of those 484,124 establishments are retailers, restaurants and warehouses. They receive food and they keep records. They do not print lot codes, because they do not pack. The population that applies a mark is the processors, packers and growers at the front of the chain, and the FDA's own preliminary analysis counts those precisely: 11,557 manufacturing, processing and packing establishments and 22,947 farms, aquaculture operations and growers (FDA, Preliminary Regulatory Impact Analysis summary).
| Step | Value | Basis |
|---|---|---|
| Establishments that actually apply a mark | 34,504 | 11,557 processors and packers + 22,947 farms and growers |
| Share needing a new 2D-capable device | 35%, equalling 12,076 | The balance already print human-readable date codes; the gap is 2D capture and verification |
| Installed cost per device | USD 18,000 | 2D print-and-apply or 2D-capable coder plus line integration |
| Total FSMA 204 hardware pull | USD 217.4 million | 12,076 devices at USD 18,000 |
That is 6.9% of one year's global equipment revenue, spread across a three-year window, which makes it roughly 2.3% of equipment revenue per year. It is a real order book for a dozen specialist suppliers and a rounding error for the category.
Why that is the interesting finding, not a disappointing one
The FDA estimates the whole rule's compliance cost at USD 621 million in present value - USD 570 million domestic, USD 51 million foreign - and that figure is the tell. A hardware bill of USD 217 million would be 35% of the entire rule's cost, which cannot be right if most covered firms were expected to buy machines. The rule does not require a machine. It requires records: a traceability lot code assigned at initial packing, first land-based receiving or transformation (21 CFR Part 1 Subpart S), linked to key data elements at each critical tracking event, and producible as an electronic sortable spreadsheet within 24 hours of a request.
Every one of those obligations can be met with a spreadsheet and a person. What a machine buys is not compliance. It buys the physical link between the lot and the record. Which is why the equipment demand the rule creates is concentrated, specific, and mostly not a coder at all:
- 2D print-and-apply labellers, because a lot code that can be scanned downstream is worth more than one that has to be typed.
- Vision and verification systems, because an unreadable 2D code is worse than no code - it is a false record.
- Case and pallet coding, because FSMA's critical tracking events include shipping and receiving, not only packing.
- Software and connectivity, because a code that never reaches a database is a decoration.
That is also why the announcement of a delay did not collapse demand, and why it did not rescue the challengers who had built a plan around a 2026 retrofit wave. The retrofit wave was always smaller than the slide decks said.
The larger date nobody is pricing: 2027
FSMA 204 is not even the biggest calendar event in this market. GS1's 2D in retail implementation guideline sets out an industry ambition for retail point-of-sale scanning to be globally capable of reading the GTIN from both linear and 2D barcodes by the end of 2027, a programme GS1 US runs as Sunrise 2027. Through the transition every retail trade item can carry both a linear barcode and a GS1 DataMatrix or QR code.
That obligation lands on a far larger population than the Food Traceability List. It reaches every consumer packaged good on a retail shelf, in every category, in every market where the retailer has upgraded its scanners. If roughly 40,000 consumer-goods manufacturing sites worldwide need one to three 2D-capable devices at USD 25,000 including integration, the demand is on the order of USD 1 to 3 billion concentrated into 2026 and 2027 - an order of magnitude more than FSMA 204, arriving a year earlier.
FSMA 204's significance is therefore not volume but specificity. It is the first time a regulator has made the content of a code a compliance obligation in food, which converts coding from a packaging cost into a data-collection cost. The 2027 retail transition supplies the volume. The 2028 traceability deadline supplies the urgency and the specification, and it makes the 2D argument on grounds that a finance director cannot defer - not "richer consumer engagement" but "you cannot comply without it".
The technology mix this actually shifts
| Technology | What it wins | Share of 2025 equipment revenue (est.) | Direction to 2033 |
|---|---|---|---|
| Continuous inkjet (CIJ) | Curved, dusty, wet and non-porous surfaces at line speed; the only technology that prints at a distance from the product | about 33% | Stable volume, mix under pressure |
| Thermal inkjet (TIJ) | Cheap, clean, high resolution, low maintenance; weak on non-porous stock | about 18% | Gaining |
| Laser | Permanent marks, no consumable, no solvent; higher capex, substrate limits | about 13% | Gaining |
| Thermal transfer overprint (TTO) | Flexible film and pouch coding; consumable-led economics | about 14% | Stable |
| Print-and-apply labelling | 2D codes, variable data, verification-ready | about 12% | Fastest growth |
| Large-character case coding | Cases and pallets, secondary packaging | about 10% | Stable to gaining |
The direction of travel is clearer than the shares: spray-and-hope is losing to apply-and-verify. A human-readable best-before date can be wrong and nobody knows until a consumer complains. A 2D code carrying a traceability lot has to be readable at the first critical tracking event downstream, which means the output has to be checked where it is printed. That is why the fastest-growing part of this market is the part that is not really a printer.
The same shift appears in the adjacent categories. Active and intelligent packaging carries the code rather than the printer (Global Smart Packaging Market), and the record that the code points into is increasingly a warehouse and inventory system rather than a ledger (Global Warehouse Management System Market). The coder is becoming the sensor at the front of a data chain, and it is being priced as one.
What a buyer should take from this
Three conclusions follow, and none of them is the one the deadline is sold on.
First, the deadline is a specification, not a volume event. Budget for a 2D device with verification, not for a faster version of the coder you already own. The machine that satisfies FSMA 204 in 2028 is the machine that satisfies Sunrise 2027, and it is not the machine on most lines today.
Second, the consumable contract is where the money is, and it is where the negotiation should be. With the aftermarket at 53.7% of the market and growing faster than equipment, the ink and service agreement over eight years costs more than the machine. A buyer who negotiates only the capital price has negotiated the smaller number.
Third, the delay changed who is exposed, not how much demand exists. The incumbents' consumable revenue was never at risk from a moving date. What moved was the retrofit cycle that distributors and challenger brands had planned an entry around, and a longer evaluation window favours the vendor with the largest service footprint. Regulatory delay, in a razor-and-blades market, is a moat.
Method and its limits
The size is a constructed estimate, not a reported one, and it is offered as such. The installed base of 1,300,000 devices is inferred from a single vendor's disclosed figure plus the observed concentration of the market; the 8-year service life, the 2.6% base growth, the USD 16,000 blended price and the USD 2,800 aftermarket attach are stated assumptions rather than disclosures. The FSMA 204 hardware estimate rests on a 35% replacement share that no published source confirms. Every one of those five numbers is visible above so that a reader who disagrees with one can see exactly what changes. At an installed-base growth of 2.0% the 2033 market is USD 8.98 billion and the CAGR 3.57%; at 3.4% it is USD 10.44 billion and 5.54%. The base case is 4.42%.
Table of Contents
- The date that governs the ink
- The market, sized in two lines rather than one
- How the number was built
- The FSMA 204 number, and the number it replaces
- Why that is the interesting finding, not a disappointing one
- The larger date nobody is pricing: 2027
- The technology mix this actually shifts
- What a buyer should take from this
- Method and its limits
- Value chain: where the margin sits
- Technology and innovation: why apply-and-verify wins
- Competitive landscape: five houses and a long tail
- Regulatory landscape: what the rule actually requires
- Investment activity: the capital is going elsewhere
- Market risk: the seven ways this forecast is wrong
- Frequently asked questions
Competitive Landscape
Five houses and a long tail
Coding and marking is one of the more concentrated niches in industrial capital goods, and it has stayed concentrated through every technology transition of the last forty years. The reason is not patent protection, which is thin. It is the service footprint: a coder that stops at 2am costs a plant a shift of output, so the buying criterion is the distance to a technician with the right part, and that is a fixed cost no challenger can replicate quickly.
On the installed-base estimate in this report of 1,300,000 devices, the concentration is as follows. Shares are Pheonix estimates derived from each vendor’s disclosed revenue base against the modelled total; only the installed-base figure for Videojet is a company disclosure, and it is treated as one.
| Vendor | Owner | Estimated share of installed base | Position |
|---|---|---|---|
| Videojet | Veralto (NYSE: VLTO) | 30.8% (derived from the company’s own 400,000-plus installed claim) | Largest single base; broadest technology range; CIJ-centred |
| Markem-Imaje | Dover (NYSE: DOV) | 18 to 22% | Second scale player; strong in pharmaceutical and industrial |
| Domino | Brother Industries (TYO: 6448) | 12 to 16% | Strong in CIJ and digital printing; UK-based, global reach |
| Hitachi and Keyence | Independent, listed in Tokyo | 8 to 12% combined | Strong in Japan and Asia; Keyence premium-priced on sensors and vision |
| Linx, Matthews, Weber, SATO and others | Various | 10 to 15% combined | Regional and application specialists, labelling-weighted |
| Chinese and Indian challengers | Various, largely unlisted | 15 to 20% combined, and rising | Domestic cost leadership; weak service reach outside home markets |
The margins that define the industry
The clearest public read on the economics comes from Veralto, which houses Videojet inside its Product Quality and Innovation segment alongside Esko, X-Rite and Pantone. For the full year 2025 Veralto reported group sales of USD 5,503 million, of which Product Quality and Innovation was USD 2,182 million at a 25.2% operating margin; in the fourth quarter the segment did USD 550 million at 24.7% with core growth of 1.8% (Veralto, fourth quarter and full year 2025 results). A margin in the mid-twenties on core growth in the low single digits is the entire business model in one line: a high-margin installed base with a slow equipment cycle bolted to it.
That is not a segment-level figure for coding alone, and it should not be read as one. Esko’s packaging workflow software and the X-Rite colour business sit in the same segment, and both have different margin structures from a printer and a drum of solvent. But the direction is unambiguous, and it is confirmed by the structure of every competitor’s P&L: the machine is a customer-acquisition cost and the fluid is the product.
Why the incumbents keep winning
Three barriers do the work, and none of them is technology.
Consumable lock-in is engineered, not contractual. A continuous inkjet printer’s ink and makeup solvent are formulated for that print head, that viscosity range and that charge tunnel. Using a third-party fluid voids the service agreement and, in most formulations, degrades the print head. The aftermarket attach is close to total because the chemistry is part of the machine.
The service network is a sunk cost the challenger has to replicate. Videojet describes direct operations with more than 4,000 team members in 26 countries, plus a distributor and OEM network of more than 400 partners reaching 135 countries (Videojet, global service offering). That footprint was built over six decades. A challenger with a better print head and no technician in Guadalajara does not win the account.
Connectivity is deepening the moat rather than eroding it. Markem-Imaje’s MiVista connected-printer service was built on an IoT platform developed across 17,000-plus software installations and data from more than 4,000 printers in the field (Markem-Imaje). Once a fleet reports its own uptime and its own fluid consumption, the vendor knows more about the customer’s line than the customer’s own maintenance manager does. That is an incumbency advantage that compounds.
The challengers’ real opening
The one genuine gap is not print quality. It is the transition to 2D and verification, because that transition changes what the customer is buying from a printer to a data system, and the incumbents’ installed base is a liability as well as an asset: 400,000 machines that print text and cannot verify a code are 400,000 reasons for a customer to think about someone else.
That is precisely where the Chinese and Indian challengers are strongest, and it is where the specialist vision and labelling vendors are gaining. A 2D code printed and then read back by a camera is a software problem as much as an ink problem, and software is the one part of this stack where the incumbents’ forty-year head start buys them least.
What the consolidation logic implies
Every one of the large players is owned by a diversified parent for which coding is one business among several. Veralto pairs it with water quality. Dover pairs it with pumps, clean energy and imaging. Brother pairs it with printers and machine tools. That structure is stable while margins hold in the mid-twenties and becomes unstable the moment they do not, because a diversified parent will always compare a 4% growth business against a faster one. The article-length version of this argument is set out in The Deadline That Will Rebuild This Market Arrives in 2027, and No Regulator Set It.
Value Chain
The chain begins at a nozzle
The bill of materials for a continuous inkjet printer is short, unglamorous and hard to make well: a nozzle assembly typically 40 to 70 microns across, a piezoelectric drive that vibrates the ink stream into tens of thousands of uniform droplets a second, a charge tunnel, a deflection field and a gutter that recirculates the uncharged drops. The physics has barely changed since the 1970s and the manufacturing tolerance has not loosened at all. A nozzle that is out of round by a fraction prints a legible code with an illegible edge, which is the failure mode that matters once a vision system is deciding whether to pass the line.
That puts the scarce upstream capability in precision fluidics rather than in electronics. Print heads and nozzle assemblies are made in-house by the majors and are the part of the stack most resistant to substitution. Pumps, filters and the cabinet are conventional. The ink is not.
Chemistry is the real product
A food-packaging ink must do four things at once: wet a non-porous substrate, dry in under a second at line speed, survive the retort or the freezer, and remain food-contact compliant. Methyl ethyl ketone is the workhorse solvent for exactly that combination, and it is why a coder consumes solvent whether or not it is printing – the ink evaporates, viscosity has to be held, and makeup fluid is drawn from a reservoir continuously to hold it.
The consequence is that fluid formulation, not machine assembly, is where the technical differentiation actually sits, and it is where regulation bites hardest. Any tightening of food-contact rules propagates straight into the ink laboratory. That coupling runs the other way too: a substrate change driven by packaging sustainability – a switch from a rigid tub to a flexible pouch, a move to mono-material film – can invalidate an ink and a print head setting at the same moment. The Global Smart Packaging Market tracks that substitution from the pack side; this report tracks it from the marking side.
Assembly, then the channel
Coding equipment is assembled in relatively few plants and sold through a mixed channel that is more distributor-led than the incumbents’ brand presence suggests. Videojet alone reports more than 400 distributors and OEMs alongside its direct operations. The OEM route matters more than it looks: a coder specified into a filling or thermoforming line at the factory is a coder the food producer never competitively tenders, which makes the packaging-machinery relationship a genuine point of leverage. The adjacent machinery categories are where that leverage is booked – the Global Extrusion Machinery Market and the Global Twin-Screw Extruder Market both sit upstream of the line the coder is bolted onto.
Integration is the hidden third of the cost
The installed cost of a marking device is routinely well above its list price, because the machine needs a mounting, a conveyor interface, a product-detect trigger, a reject mechanism if it is verifying, and a connection to the plant network if the code is to reach a database. That integration layer is where regional system integrators earn their margin and where the majors are structurally weakest, because integration is a local business and the majors are organised globally.
It is also where the 2D transition creates its demand. A print-and-apply labeller replacing a CIJ coder is not a swap; it is a line change with a reject station attached. That is why the estimate in this report uses USD 18,000 rather than a list price as installed cost per device, and why the equipment revenue in this market understates the spend a customer actually makes.
Service is the annuity, and the figures are disclosed
The aftermarket – ink, makeup, ribbons, labels, spare parts, service contracts and increasingly software subscriptions – is USD 3.64 billion of a USD 6.78 billion market in 2025, or 53.7%, and grows faster than equipment at 4.65% against 4.14%. The mechanics are simple: the installed base grows, each machine consumes fluid in proportion to its running hours, and running hours grow with the customer’s output rather than with the customer’s capital budget.
That is why a diversified parent tolerates a low-growth equipment business. More than half the cash flow does not depend on a purchase decision at all. It depends on a plant staying open, which is a far more stable thing to underwrite than a capital approval.
Where the value chain is being re-cut
Two shifts are visible. The first is that the code is separating from the printer: a GS1 Digital Link QR code carries a URL, and the record behind that URL is served by software the printer vendor may not own. The second is that verification is pulling the vision vendors – Keyence most obviously, but also machine-vision specialists – into a position where they specify the marking device rather than the other way round.
The Global Industrial Automation Market is the better proxy for where that ends up than the coding category itself, because it prices the control layer a 2D-coded line now needs. On current evidence the coder becomes a peripheral of the line controller, and the vendor that owns the controller captures the specification.
Investment Activity
Capital is being allocated away from the coder
The most informative thing about investment in this market is where the incumbents are not spending. Veralto is the clearest case because it is the only pure-ish listed proxy. For 2025 the group reported sales of USD 5,503 million with Product Quality and Innovation – the segment that houses Videojet alongside Esko, X-Rite and Pantone – at USD 2,182 million and a 25.2% operating margin. In the fourth quarter the group did USD 1,396 million, up 3.8%, with core growth of just 1.6%, and generated USD 311 million of operating cash flow against USD 291 million of free cash flow (Veralto, fourth quarter and full year 2025 results).
A cash-generative business growing core at 1.6% has a capital allocation problem by definition, and the way it solves that problem tells you what it thinks of its own end markets. The pattern across the sector is consistent: the coding cash flow is treated as a funder of acquisitions elsewhere, and the acquired businesses are in water, analytics, software and services rather than in marking. That is not a signal that coding is a bad business. It is a signal that it is a mature one, and that the incremental dollar of growth is assumed to sit outside it.
The ownership structure is the real investment story
Every major coder brand is a segment of something larger. Videojet is a segment of a segment inside Veralto. Markem-Imaje is a wholly owned subsidiary of Dover, a diversified manufacturer with revenue above USD 8 billion across five segments including Imaging & Identification (Markem-Imaje). Domino is inside Brother’s Industrial Printing business, which was 15.6% of group revenue of 893.5 billion yen in FY2025, with Domino itself at 14.0% and coding and marking more than 80% of that business (Brother, Industrial Printing business briefing).
That structure has three consequences a buyer or an investor should price. It caps the multiples a coding asset can trade at, because a diversified parent will always be valued on a blended basis. It makes a spin or a sale permanently plausible, and the establishment of Veralto itself is the precedent. And it means the coding business is always being benchmarked against a faster sibling, which is exactly the pressure that produces price increases in the aftermarket rather than in equipment.
Where the M&A actually points
The deals that matter in this cycle are not coder-for-coder consolidations. They are the acquisition of adjacent capability by the owners of the installed base: vision and inspection, packaging workflow software, and consumable chemistry. The logic is that the equipment cycle is slow but the data and the chemistry attached to the installed base are not.
For a challenger, that means the interesting entry route is not a better printer. It is a verification system that sits on top of somebody else’s printer, or a labelling platform that captures the 2D retrofit without asking the customer to change ink supplier. Both are software-led and both are being funded, which is why the Global AI in Manufacturing Market and the Global Industrial Automation Market are better proxies for where capital is flowing in this value chain than the coding category’s own deal flow.
What a buyer should watch
Three markers would change the investment case. An incumbent acquiring a machine-vision business at scale would signal that the industry intends to own verification rather than cede it. A price increase in consumables disproportionate to input costs would signal that the aftermarket is being used to fund a slower equipment cycle, which is the classic late-cycle move in a razor-and-blades business. And any move by a large packaging-machinery OEM to integrate a coder into its own line controller would be the most serious structural threat in this report, because it would take the specification away from the coder vendors entirely. The machinery side of that question is tracked in the Global Extrusion Machinery Market and, at the process end, in the Global Twin-Screw Extruder Market.
Technology & Innovation
Why continuous inkjet survived
Continuous inkjet works by a method that has barely changed in forty years and probably will not change in the next twenty. Ink is pumped through a nozzle and vibrated into a continuous stream of droplets, charged as they break off and deflected electrostatically onto a moving substrate; the uncharged drops are caught and recirculated. That architecture buys three things no competing technology matches simultaneously: it prints on curved, irregular and non-porous surfaces at line speed; it prints at a distance from the product, so a dusty bag of flour or a wet bottle is not a problem; and it does it with a print head that never touches anything.
That is why CIJ still owns the boring, high-volume jobs – best-before dates on food packaging, batch codes on pharmaceutical cartons, cable and pipe marking – and why the table in the overview gives it roughly a third of equipment revenue. It is also why it is the technology most exposed to the 2D transition: a CIJ coder can print a DataMatrix, but it cannot confirm that the DataMatrix is readable.
The challengers, and exactly what each wins
Thermal inkjet is cheap, clean, high-resolution and nearly maintenance-free, and it has taken a large share of secondary-packaging coding. Its limits are substrate and speed: porous stock only, and a print head that has to be close to the surface. It is gaining because a TIJ unit costs a fraction of a CIJ machine and needs no solvent, which is exactly the argument a finance director facing a 2D upgrade wants to hear.
Laser produces a permanent mark with no consumable at all, which inverts the industry’s revenue model: the customer pays more at the capital line and nothing at the consumable line. On a coated carton or a PET bottle it is now cost-competitive on total cost of ownership within two to three years. Its constraints are substrate compatibility and the capital approval.
Thermal transfer overprint owns flexible film and pouch coding, and it is the technology most exposed to the migration from multi-material laminates to mono-material recyclable films, which change the surface energy the ribbon has to bond to.
Print-and-apply labelling is the one category the FSMA and GS1 dates are genuinely pulling, because it is the cheapest way to put a verified 2D code on a case or a pallet. It is growing fastest from the lowest base.
Large-character case coding sits at the shipping and receiving events that FSMA’s critical tracking events explicitly include, which makes it a quieter beneficiary than the 2D narrative suggests.
The real innovation is verification, not printing
The single most consequential change in this market is that the machine now has to read what it wrote. A vision system that grades a code, fails a bad print and triggers a reject is what turns a marking device into a data-capture device, and it is the part of the stack where the coding incumbents are least entrenched and the machine-vision vendors most comfortable.
Once a camera is in the loop, the economics of the print head change. A CIJ coder that produces a 99.5% legible code is fine when a human reads the date. It is not fine when a scanner at the next critical tracking event rejects the pallet. The specification moves from print quality to verified read rate, and verified read rate is a harder thing to sell and a much harder thing to match.
GS1 Digital Link is the quiet structural change
A conventional barcode carries an identifier. A GS1 Digital Link QR code carries a web address built from the same identifier, which means the pack becomes a query. For the marking vendor that is a double-edged development: the code is more valuable to the customer, and the value is captured by whoever serves the page behind it.
That is why the strategic question in this market is no longer which print technology wins. It is who owns the specification. The Global AI in Manufacturing Market is the relevant adjacency here – not because machine learning prints better, but because the defect-detection and read-rate grading that a verified line depends on are trained models, and they are being sold by the automation vendors rather than by the coder vendors.
Patent and innovation intensity: mature, not sleepy
Patent activity in the core print-head art is steady rather than rising, which is the signature of a mature technology: filings cluster around nozzle geometry, fluid formulation and print-head cleaning rather than around new marking physics. Innovation intensity is better read as moderate but commercially decisive, because the incremental work is concentrated exactly where the switching costs are – the fluid, the print head and now the verification loop.
The one genuinely emerging area is the elimination of the consumable. Every solvent-free option – laser, and to a lesser extent the move to pigmented UV-cured inks – attacks the aftermarket, which is the profit pool. The industry has an obvious incentive to slow that transition and no obvious ability to stop it once a customer can buy a permanent mark with no fluid contract attached. That tension, not the regulatory calendar, is the long-run risk to the incumbents’ margins.
Market Risk
1. The deadline moves again, or stops mattering
This is the largest single risk and it is not small. The compliance date has already moved once, by 30 months, and the operative date now rests on a proposed extension plus a congressional directive rather than a consolidated final rule. A second slip is plausible. But the more damaging version is not a slip – it is a rule that binds formally and is enforced thinly. The FDA has limited inspection capacity, the rule is a records obligation rather than a product safety standard, and a firm that believes enforcement is unlikely will buy nothing. This report treats the 2028 date as real because the politics of food traceability are durable, but a buyer should not assume the deadline is a demand guarantee.
2. The substitution that actually threatens the number
The FSMA hardware estimate of USD 217 million rests on a 35% replacement share, and that share is the softest number in this report. Every obligation in the rule can be satisfied with a spreadsheet, a printer and a person. The FDA’s own total compliance cost for the rule – USD 621 million in present value across domestic and foreign entities – is small relative to the industry, and it is small precisely because the agency assumed most firms would comply administratively rather than by capital investment. If the replacement share is 20% rather than 35%, the hardware pull falls to about USD 124 million; if it is 50%, it rises to about USD 311 million. Either way it remains a fraction of the category, which is the finding that survives the uncertainty.
3. Consumable deflation is a structural threat, not a cyclical one
The industry’s profit pool is the fluid. Every solvent-free marking technology – laser most of all, but also the migration to pigmented UV-cured inks – attacks that pool directly. A customer who buys a laser and pays nothing per mark has removed the annuity from the relationship. This will not happen quickly, because CIJ wins on curved and non-porous substrates where laser cannot compete, but it is a slow compressions of the highest-margin revenue line and it is the reason the aftermarket growth rate in this forecast (4.65%) is not higher.
4. Price competition from the long tail
Chinese and Indian manufacturers now supply credible CIJ, TIJ and laser units at a fraction of the incumbents’ prices, and they are strongest exactly where the growth is: in the emerging-market plants that are adding coding capability for the first time. Their weakness is service reach outside home markets, which is the incumbents’ principal defence. If that reach improves faster than expected, blended equipment price escalation of 1.5% a year turns negative, and the equipment segment’s 4.14% CAGR does not survive it.
5. The installed base could be wrong, and everything scales off it
The whole model rests on 1,300,000 installed devices, inferred from one vendor’s disclosed 400,000-plus claim and the observed concentration of the market. If the true base is 1,000,000, the 2025 market is roughly USD 5.2 billion rather than USD 6.78 billion. If it is 1,600,000, it is roughly USD 8.3 billion. The growth rate is more robust than the level, because it is driven by replacement and volume rather than by the base itself. The stated band from installed-base growth of 2.0% to 3.4% a year is 3.57% to 5.54% CAGR against the 4.42% base case, and that band is the honest expression of the model’s precision.
6. Regulatory risk on the consumable, not the machine
Solvent-based inks carry volatile organic compound obligations in most industrialised markets, and food-contact rules constrain formulation. Both are tightening. The exposure is asymmetric: a restriction on a solvent class does not stop coding demand, it forces a reformulation, and a reformulation is a cost the incumbent absorbs while a challenger with a water-based or UV product gains a wedge. Anyone underwriting the aftermarket margin in the mid-twenties should treat this as the most likely route by which that margin narrows.
7. Ownership and channel disruption
Every major brand sits inside a diversified parent, and the establishment of Veralto as a standalone entity is the template for how these assets get separated. A spin, a sale or a merger would not change the physics of the market, but it would change distributor terms, service coverage and the willingness to discount at the equipment line. In a market where the specification is already shifting toward software and verification, a distracted owner is a genuine competitive opening for a challenger.
What is not a risk, though it is often listed as one
A delay is routinely described as a demand risk in this market, and for a razor-and-blades business it mostly is not. Existing lines already have coders, and those coders keep consuming ink and solvent regardless of when a traceability rule binds. What a delay defers is the retrofit cycle – the machines that would have been sold to small and mid-sized producers who needed lot-level coding to comply. The incumbent’s revenue is roughly protected and its equipment growth is deferred. The people hurt are the integrators, distributors and challenger brands who planned an entry around a deadline. In a category where differentiation is solvent consumption, print-head reliability and service response, a longer evaluation window favours the vendor with the largest service footprint. Regulatory delay, on balance, is a moat.
Regulatory Landscape
What the rule actually requires
The Food Traceability Rule sits at 21 CFR Part 1 Subpart S and applies to persons who manufacture, process, pack or hold foods on the Food Traceability List. It is a recordkeeping rule, and that distinction is the whole of its relevance to this market.
It works through three constructs. Critical tracking events are the points at which a food changes hands or state – harvesting, cooling before initial packing, initial packing of a raw agricultural commodity, first land-based receiving of a food from a fishing vessel, shipping, receiving and transformation. Key data elements are the facts that must be captured at each of those events. And the traceability lot code is the thread that ties them together: it must be assigned at initial packing, at first land-based receiving of a fishery product, or at transformation (21 CFR 1.1320), and a firm generally must not mint a new one when it merely ships.
Two consequences follow that bear directly on coding equipment. First, the code must exist before the food moves, which means it must be applied physically or printed on a document at the packing line rather than entered later. Second, the records must be producible to the FDA as an electronic sortable spreadsheet within 24 hours of a request. Neither obligation names a technology, a symbology or a format. Nothing in the rule requires a 2D barcode, and nothing requires that a code be printed on the pack at all.
The foods in scope, and why the list matters
The Food Traceability List is deliberately narrow, and it is narrow in a way that shapes the equipment demand. It covers fresh leafy greens including fresh-cut, fresh melons, fresh cucumbers, fresh peppers, fresh tomatoes, fresh sprouts, fresh herbs, tropical tree fruits, shell eggs, nut butters, soft and semi-soft cheeses including those made from unpasteurised milk, fresh finfish and shellfish, and deli-type salads. Fresh produce, eggs and soft dairy are high-volume, low-margin, short-shelf-life and largely untouched by the pharmaceutical-grade serialisation that already exists in other categories.
That is precisely why the retrofit is not trivial for the firms in scope and is not a windfall for the category. A leafy-greens packer running a clamshell line needs a code on each clamshell and an aggregation step at the case; a soft-cheese producer needs it on a wrapped wheel and a case. Both are real machine sales. Neither is a fleet replacement.
The exemption structure reduces the population further
The rule exempts a set of activities and firms, including certain produce subject to the Produce Safety Rule’s qualified exemption, foods sold directly to consumers, and specific low-risk handling. The FDA’s own counts of covered entities already net these out, which is why this report uses the agency’s establishment counts rather than a top-down estimate of the food industry. The number that matters is 34,504 establishments applying a mark, not 484,124 receiving food.
The calendar, and what the delay legally is
The original compliance date was 20 January 2026, uniform across all persons subject to the rule, a design choice the agency justified on the grounds that information has to be shared across a chain and a staggered date would not work. On 7 August 2025 the FDA proposed a 30-month extension to 20 July 2028, with comments closing 8 September 2025, on the grounds of the time affected entities needed to implement the requirements. Congress then directed the agency, through the Continuing Appropriations and Extensions Act of 2026, not to enforce the rule before that same date, and the FDA states that it intends to comply with the directive.
The distinction between a finalised extension and legislated non-enforcement is legally material and commercially immaterial. Either way, the operative deadline a food producer is planning against is 20 July 2028, which is 21 months from the publication of this report. The compliance obligation itself was not relaxed: the underlying requirements were explicitly not reopened, and the obligation still exists, it has simply been given more time.
The regulatory page as a market signal
The FDA’s page for the rule continues to state both dates. That is not an administrative embarrassment so much as an accurate portrait of a rule in transition, and it is worth understanding why it will not be resolved quickly: the page is describing a proposed extension and a congressional directive that have not been consolidated into the codified compliance date. For a supplier trying to forecast retrofit demand, the practical reading is that the enforcement date is 2028 and that the risk of a further slip is real but not large, because the politics of food traceability are bipartisan and the counterfactual – a major outbreak traced to an untraced lot – is the kind of event that ends a delay.
Everything else on the calendar
FSMA 204 is the largest single date in food, but the same machines sit under four other obligations. Pharmaceutical serialisation in the United States, Europe, the Gulf and much of Asia already requires unit-level coding and is now a data-integrity problem rather than a printing one. GS1’s 2D ambition for retail point of sale by the end of 2027 is voluntary in form and compulsory in effect, because it is enforced by retail buyers rather than by regulators. Retailer-specific pallet and case labelling mandates have always moved faster than any regulation, at the speed of the largest buyer. And packaging sustainability disclosure rules in Europe are pushing more information onto the pack, which is coding demand under another name.
The pattern across all of them is identical: coding is bought because a third party requires a mark, and the third party is a regulator or a retailer. That is what makes this demand forecastable, and it is also what makes it hostage to a calendar that other people control. The Global Smart Packaging Market faces the same regulatory calendar from the packaging side, and the two reports agree on the direction even where they differ on the magnitude.