
Global Infectious Disease Diagnostics Market Report, Size, Share and Forecast 2026-2033: Twenty-Eight Per Cent of Diagnostics and No Vendor Above Twelve
The market, and why it does not sit beside the others
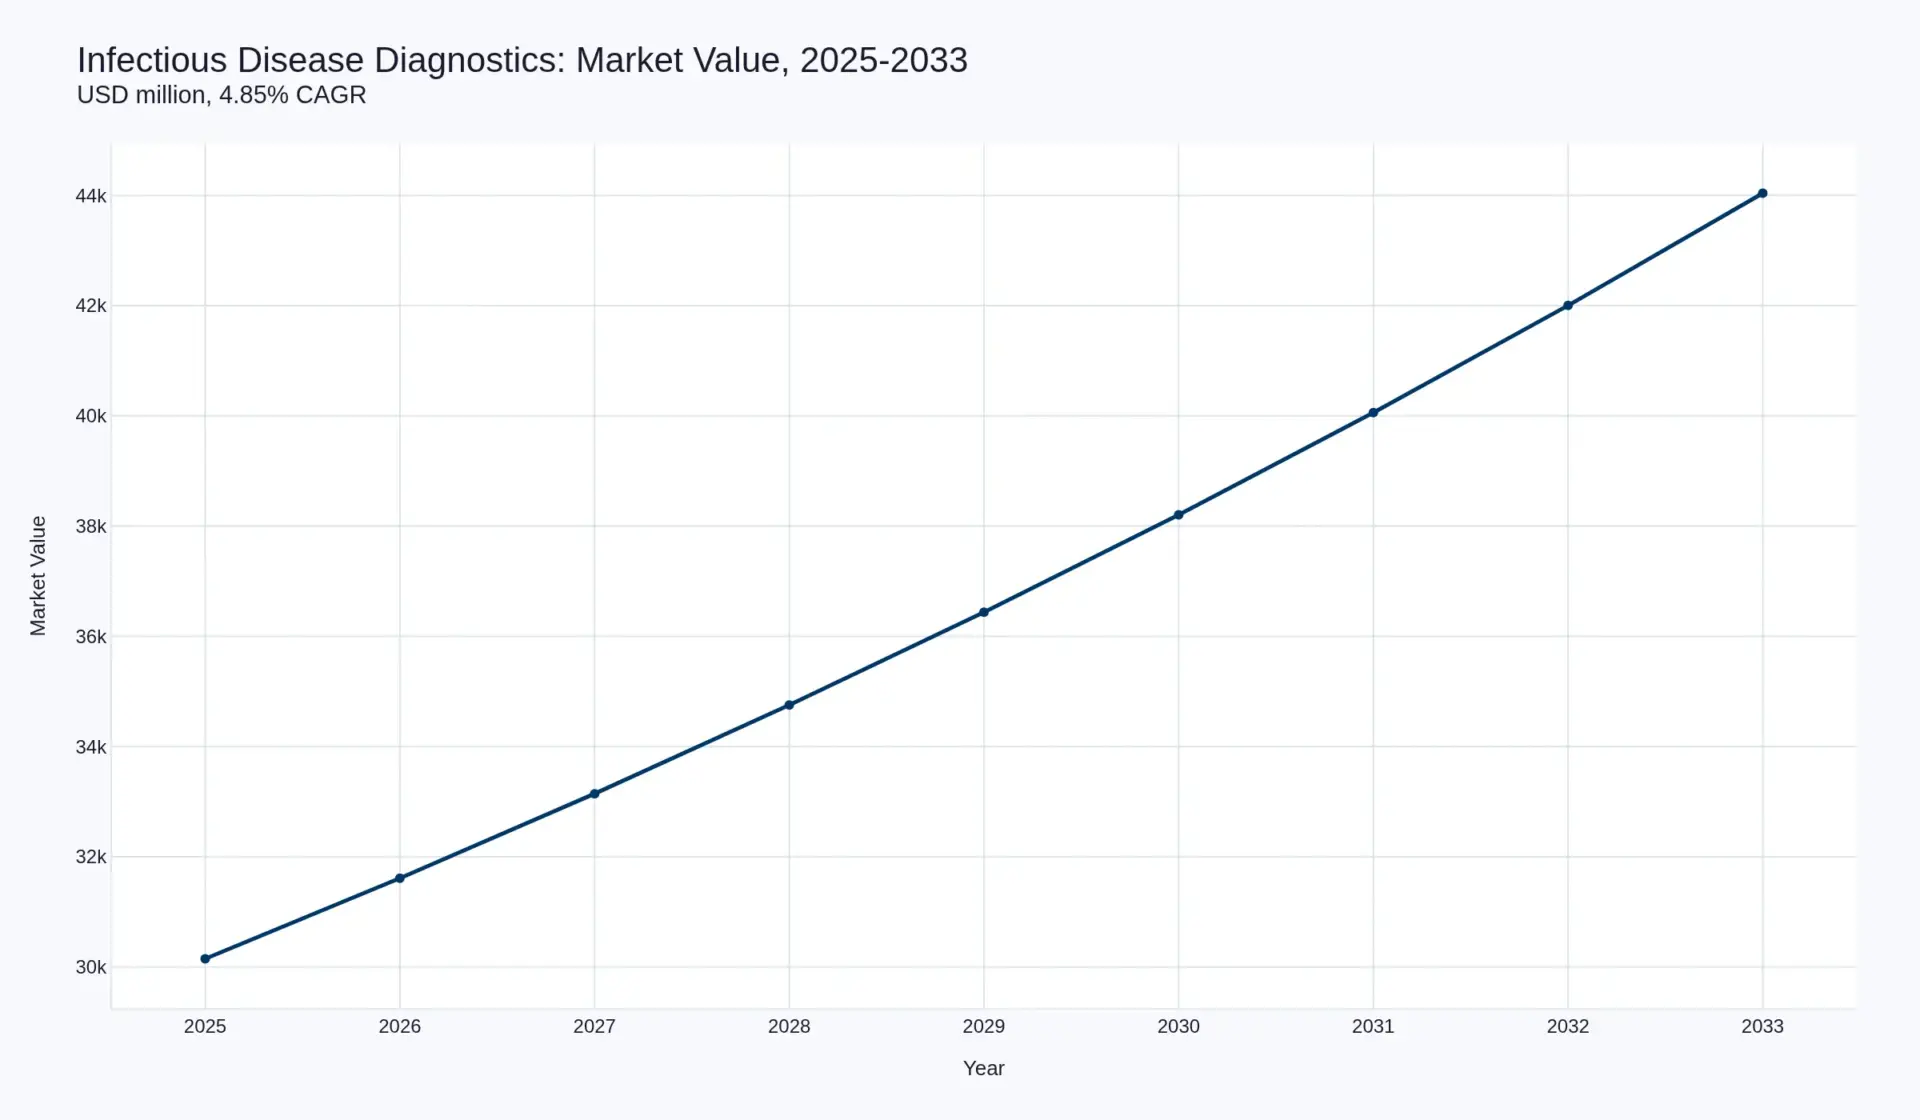
Global infectious disease diagnostics is USD 30,150 million in 2025 and reaches USD 44,040 million in 2033 — a 4.85% CAGR and USD 13,890 million of absolute growth, a 1.46x multiple. Test volume compounds at 5.49%, from 6,000 million tests to 9,200 million. Realised revenue per test falls from USD 5.025 to USD 4.787, down 4.7% across the window and 0.61% a year.
That combination — volume ahead of revenue — is the arithmetic of this field, and it is the exact inverse of microbiology’s. Microbiology was the one discipline in this cluster where revenue per test rose, because a culture was being rebilled as a panel. Infectious disease diagnostics is where the panel is already the product, and where the count is growing fastest in the tests that cost least: a malaria rapid test is sold for cents and a fifteen-target respiratory panel for tens of dollars, and the first is growing in units faster than the second grows in dollars.
Two things follow, and they organise the whole report. The first is that this is the largest application area in in vitro diagnostics — 27.92% of the USD 108.0 billion base, against immunoassay at 24.4%, clinical chemistry at 15.6%, haematology and coagulation at 7.1% and microbiology at 8.2% — and it is the only one no vendor owns. The largest pool in the field is Abbott at USD 3,577 million, or 11.86%, the lowest single-vendor concentration of any discipline in this cluster. The second is that the price of the field is not set by any of those vendors. It is set in pieces, by five different reimbursement categories and by donor procurement, and the pieces are being cut.
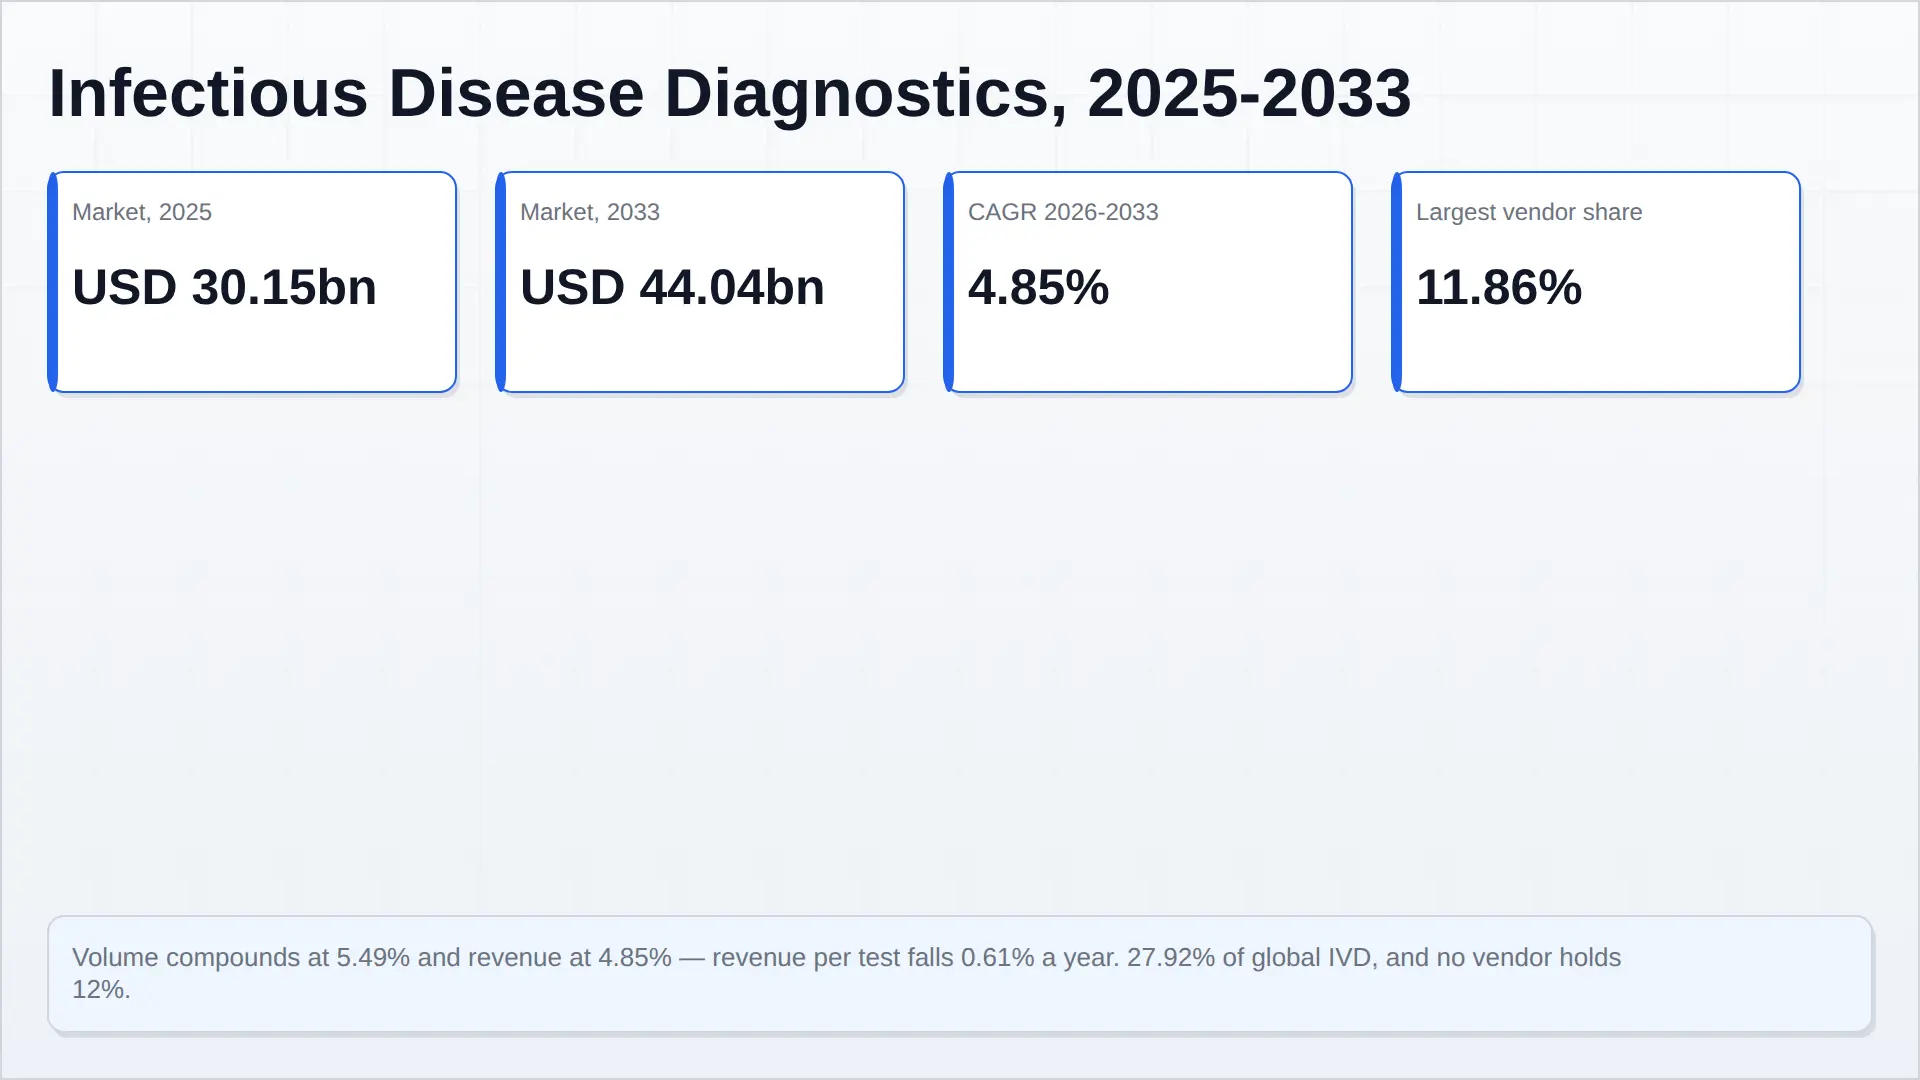
Market snapshot, 2025–2033
| Indicator | 2025 | 2033 | Change |
|---|---|---|---|
| Market value, USD million | 30,150 | 44,040 | +13,890 (1.46x) |
| Implied CAGR, 2026–2033 | 4.85% | — | |
| Test volume, million tests | 6,000 | 9,200 | +53.3% (5.49% CAGR) |
| Realised revenue per test, USD | 5.025 | 4.787 | −4.7% (−0.61%/yr) |
| Constant-menu price trend | −2.10% a year | Mix contribution +1.49 pts | |
| Share of the USD 108.0bn IVD base | 27.92% | 26.09% | −1.83 pts |
| Attributed revenue, thirteen pools | USD 17,984m (59.65%) | Residual 12,166m (40.35%) | |
| Hard disclosure, three companies | USD 6,759m (22.42%) | — | |
| Largest single pool | Abbott, USD 3,577m (11.86%) | Top five 42.27% | |
| Fastest segment | Metagenomic & sequencing-based ID, 14.02% | 1.39% of base | |
| Slowest segment | Rapid antigen & point-of-care ID, 3.12% | 14.26% of base | |
Contents
Key findings
- The field is bigger than any discipline and owned by none. At 27.92% of the IVD base, infectious disease diagnostics is larger than clinical chemistry, but its largest vendor holds 11.86% and its five largest hold 42.27%. Sysmex holds 18.3% of haematology on its own.
- Volume grows faster than revenue and the gap is widening. 5.49% volume against 4.85% revenue, an implied 0.61% annual decline in revenue per test, is the price of a menu that is expanding at the cheap end. Panels raise the average only while they are still displacing single-target tests.
- The COVID base is still unwinding, not gone. Abbott’s COVID-19 testing-related sales fell from USD 747m in 2024 to USD 297m in 2025 and its Rapid Diagnostics line still fell 18.1%. A USD 450 million annual decline in one product family inside one company, two years after the emergency ended, is a base effect the whole field is still absorbing.
- The growth that is real is menu breadth, and it is narrow. Qiagen diagnostic solutions grew 7% on QuantiFERON and QIAstat-Dx; bioMérieux SPOTFIRE grew 84% from a small base. Against that, Danaher’s Diagnostics segment grew 1.5% core and Roche’s Diagnostics 2% at constant rates.
- The administered price is being cut in two places at once. The preliminary CY2027 Medicare fee schedule reduces molecular pathology by 22% and microbiology by 19.3%. Those are the two families in which this field’s results are paid for, and the 15% annual cap through 2029 defers the reduction rather than forgiving it.
Segmentation by test class
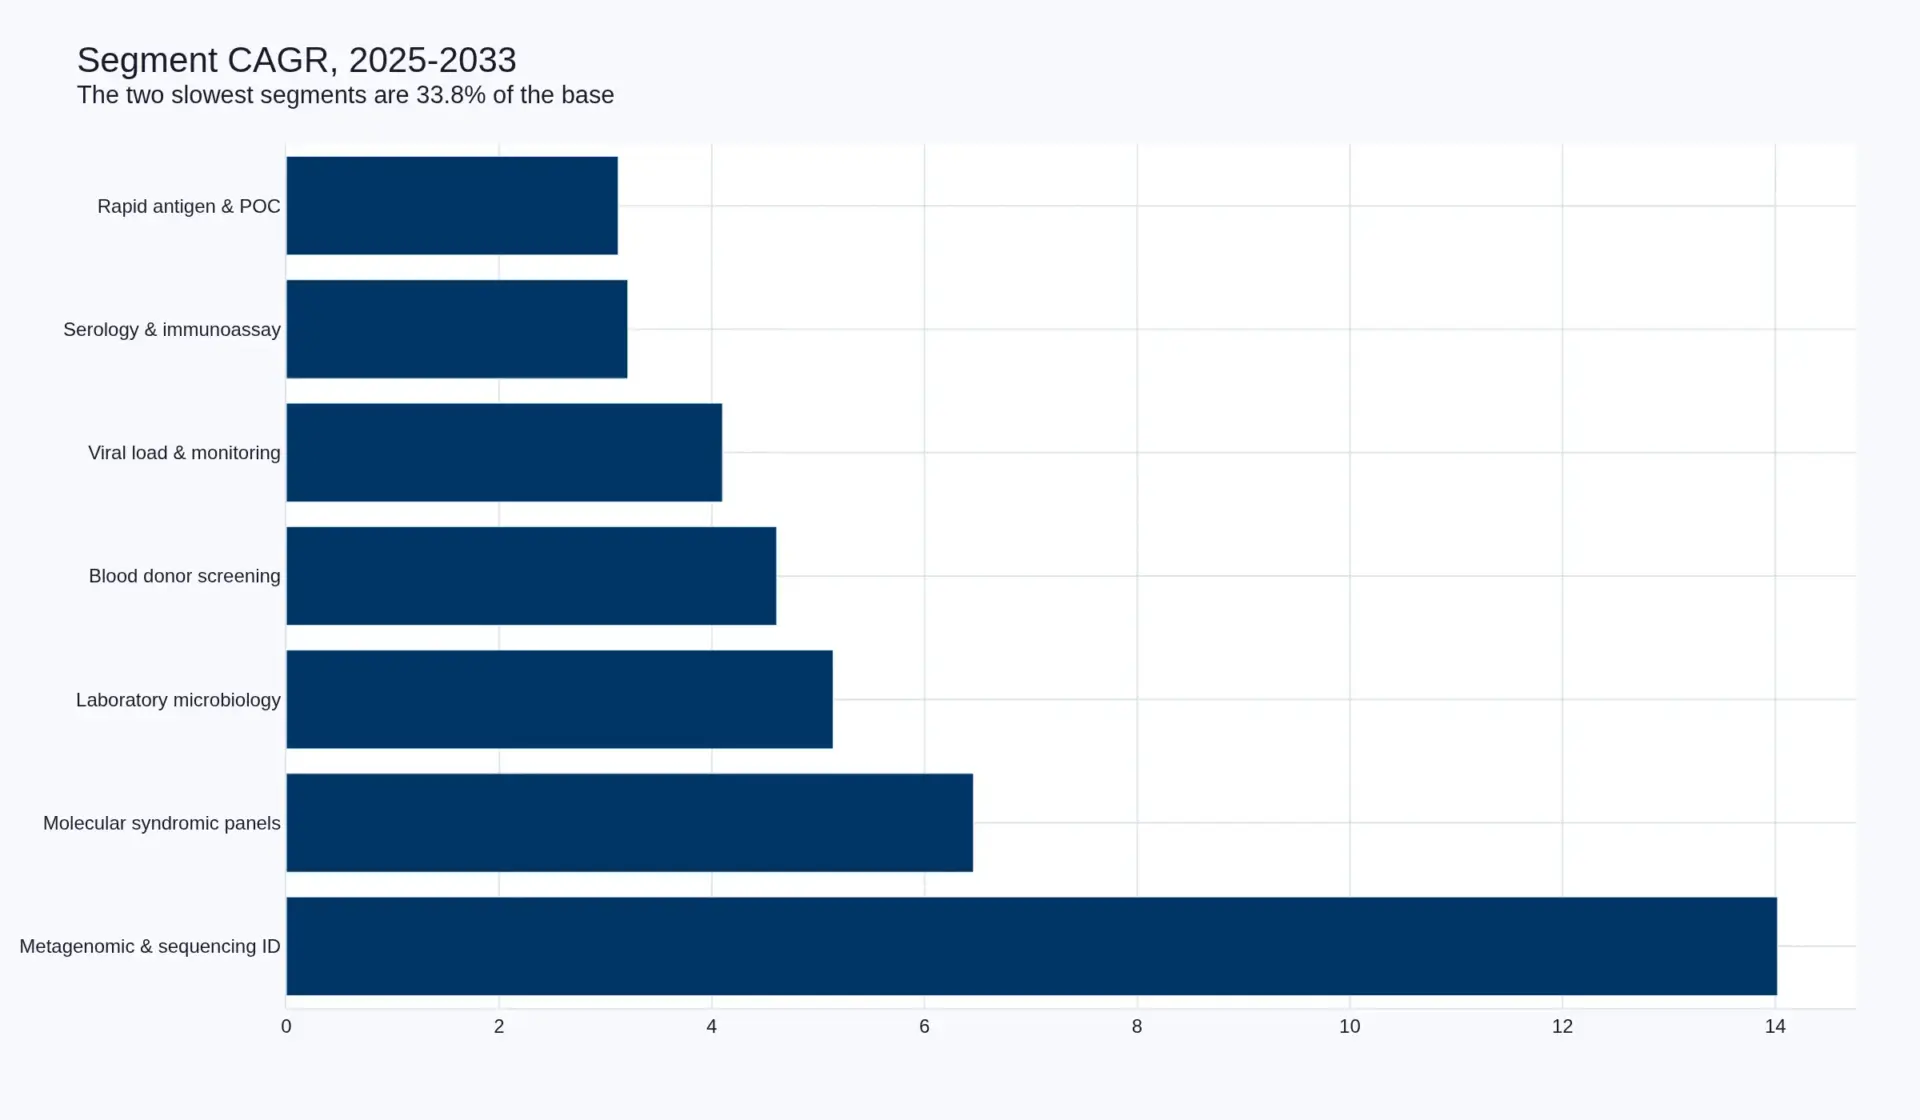
The seven segments sum to the total in both years. They are defined by what the test is asked to answer, not by the instrument it runs on, which is why a single vendor appears in five of them.
| Segment | 2025 (USD m) | 2033 (USD m) | CAGR | Share of base | Share of increment |
|---|---|---|---|---|---|
| Laboratory microbiology — culture, identification, susceptibility | 8,830 | 13,190 | 5.14% | 29.29% | 31.39% |
| Molecular syndromic and multiplex panels | 6,300 | 10,400 | 6.46% | 20.90% | 29.52% |
| Serology and immunoassay pathogen detection | 5,900 | 7,600 | 3.21% | 19.57% | 12.24% |
| Rapid antigen and point-of-care testing | 4,300 | 5,500 | 3.12% | 14.26% | 8.64% |
| Viral load and treatment monitoring | 2,900 | 4,000 | 4.10% | 9.62% | 7.92% |
| Blood donor and transplant infectious screening | 1,500 | 2,150 | 4.61% | 4.98% | 4.68% |
| Metagenomic and sequencing-based identification | 420 | 1,200 | 14.02% | 1.39% | 5.62% |
| Total | 30,150 | 44,040 | 4.85% | 100.0% | 100.0% |
The two slowest segments — serology at 3.21% and rapid antigen at 3.12% — are 33.83% of the base and 20.88% of the increment. The two fastest, syndromic panels and metagenomics, are 22.29% of the base and 35.13% of the increment. That is the same shape every discipline report in this cluster has independently produced, and it has the same cause: the volume is where the money isn’t.
Laboratory microbiology is the exception and it is worth naming precisely, because it is the only segment here that is not losing price. Its 5.14% growth with a rising revenue per test is set out in full in our microbiology diagnostics report; inside this report it is one segment of seven and is not counted twice.
Regional analysis, 2025
| Region | 2025 (USD m) | Share | Character of demand |
|---|---|---|---|
| North America | 11,150 | 37.0% | Highest revenue per test; payer-managed panel coverage; administered fee schedule |
| Europe | 7,240 | 24.0% | Public procurement; IVDR conformity cost; strong microbiology and serology base |
| China | 3,920 | 13.0% | Provincial volume-based procurement; domestic substitution; the price floor of the field |
| Japan | 1,810 | 6.0% | National fee schedule; mature, demographically contracting |
| Rest of world | 6,030 | 20.0% | Donor-funded procurement; 60% of volume on roughly 20% of revenue |
| Total | 30,150 | 100.0% |
The regional split is where the volume–revenue gap becomes visible. North America is 37.0% of revenue and a far smaller share of tests; the rest of the world is 20.0% of revenue and the majority of the volume. Any forecast of this field that does not separate count from price will overstate it in exactly the geographies where the count is growing.
Product and technology split, 2025
| Product class | 2025 (USD m) | Share |
|---|---|---|
| Reagents, cartridges and consumables | 18,090 | 60.0% |
| Instruments and analysers | 6,030 | 20.0% |
| Services, including send-out and reference testing | 3,920 | 13.0% |
| Software, middleware and surveillance informatics | 2,110 | 7.0% |
| Total | 30,150 | 100.0% |
Sixty per cent consumables is the highest reagent share of any discipline in the cluster and it is the reason the field is attractive at the gross-margin line and unattractive at the growth line. Qiagen reports consumables at 90% of net sales and instruments at 10%, falling 2% in 2025; the instrument is a placement decision, the cartridge is the business.
End-market and test setting, 2025
| Setting | 2025 (USD m) | Share | Structural note |
|---|---|---|---|
| Hospital and reference laboratories | 15,680 | 52.0% | Panel-led; highest revenue per test; exposed to the fee schedule |
| Decentralised and point-of-care | 8,140 | 27.0% | CLIA-waived molecular moving into physician offices; fastest menu growth |
| Public health and surveillance | 2,410 | 8.0% | Budget-funded, not reimbursement-funded; genomic surveillance |
| Blood banks and donor screening | 1,810 | 6.0% | Regulated, high-barrier, near-100% NAT penetration in high-income markets |
| Home and self-testing | 2,110 | 7.0% | Post-COVID residue; the only setting that shrank in the base year |
| Total | 30,150 | 100.0% |
Revenue attribution and disclosure
Thirteen named pools, an attributable USD 17,984 million and a stated residual of USD 12,166 million. This is the most fragmented field in the cluster and the table says so rather than smoothing it.
| Pool | Basis | 2025 (USD m) | Disclosure |
|---|---|---|---|
| Abbott Laboratories | Molecular 517 + Point of Care 606 + Rapid Diagnostics 2,454, FY2025 reported lines | 3,577 | Reported segment lines |
| Danaher / Cepheid | Diagnostics segment, Cepheid-weighted; Q4 respiratory ~USD 500m | 3,100 | Estimated |
| Roche Diagnostics | Molecular and point-of-care infectious disease share of the division | 2,510 | Estimated |
| bioMérieux | Microbiology EUR 1,339m + BIOFIRE non-respiratory 598m + SPOTFIRE 168m, at EUR 1.13/USD | 2,379 | Disclosed |
| Becton Dickinson | Diagnostic Solutions, blood culture and identification weighted | 1,180 | Estimated |
| Hologic | Diagnostics segment less cytology and screening | 900 | Estimated |
| Qiagen | Diagnostic solutions net sales, USD 803.1m | 803 | Disclosed |
| Siemens Healthineers | Infectious disease share of the Diagnostics segment | 745 | Estimated |
| Thermo Fisher Scientific | Clinical microbiology and molecular identification lines | 700 | Estimated |
| Grifols | Diagnostic division, donor screening nucleic acid testing | 700 | Estimated |
| QuidelOrtho | Respiratory and molecular product lines | 620 | Estimated |
| Bruker | Microbiology franchise including ELITech | 520 | Estimated |
| Seegene | Company revenue, infectious disease only | 250 | Estimated |
| Attributed | 17,984 | 59.65% | |
| Stated residual | National manufacturers, regional rapid-test producers, in-house laboratory testing | 12,166 | 40.35% |
| Total | 30,150 | 100.0% |
Disclosed means a company publishes a line we can use, not that it publishes the number quoted. Only Qiagen’s diagnostic solutions and bioMérieux’s application lines are close to pure infectious disease. Abbott’s three lines are infectious-disease-dominant but not pure, and the allocation from segment to field is ours. Every pool marked estimated is an allocation, stated as such, and no reader should treat the difference between USD 620 million and USD 700 million here as information.
The concentration finding is the one to carry: no pool exceeds 12% of the field, the top five hold 42.27%, and 40.35% sits with manufacturers we cannot individually name. In haematology two private companies hold 29.7% between them; here the market leader at 11.86% is a diversified health care company for which infectious disease testing is one of four diagnostic lines.
Volume, price and mix
Revenue grows 4.85%. Volume grows 5.49%. The 64 basis point difference is the field’s structural condition, and it decomposes cleanly:
| Component | Annual effect | Mechanism |
|---|---|---|
| Volume | +5.49% | Ageing, AMR burden, LMIC access, panel ordering per admission |
| Constant-menu price | −2.10% | Volume-based procurement, fee-schedule reduction, competitive tendering, donor price ceilings |
| Mix | +1.49% | Syndromic panels and metagenomics taking share of the base |
| Net revenue per test | −0.61% |
The mix contribution is the whole of the field’s pricing power, and it is finite by construction. Panels raise the average only while they are displacing single-target tests. Once a hospital has converted its respiratory and gastrointestinal ordering to panels, the mix effect stops adding and the constant-menu decline is what remains. On our own arithmetic, once syndromic and metagenomic share plateaus at roughly 26–27% of the base, the field’s revenue growth converges on volume growth minus the price cut — in the region of 3.2–3.5%.
Sensitivities
| Scenario | 2033 (USD m) | CAGR | Condition |
|---|---|---|---|
| Rapid substitution | 47,200 | 5.77% | Panels displace culture faster; metagenomics clears coverage; CLIA-waived molecular takes the physician office |
| Base | 44,040 | 4.85% | |
| Fee schedule lands in full | 41,300 | 4.02% | The CY2027 reductions are absorbed rather than deferred into 2030–2032 |
| Funding withdrawal | 39,600 | 3.47% | Donor-funded viral load and tuberculosis testing contracts by a quarter from 2026 |
A 230 basis point band, and two of the four scenarios are government decisions rather than clinical or technological ones. That is the honest description of this field’s uncertainty: it is not a question of whether the tests will be used.
Methodology, sources and disclosure
This report is built on a 70% secondary and 30% primary basis. The secondary construction is a bottom-up attribution from company disclosures, segment by segment, reconciled to a total and with the unattributed remainder stated rather than distributed. The primary programme comprised 38 depth interviews across 11 markets, 24 open-ended interviews conducted through tender and procurement cycles, a 171-respondent laboratory and clinical survey, and four conferences. Primary work is used to establish mechanism — how a panel is ordered, how a laboratory converts an instrument, how a procurement award becomes a price — and never to carry a figure. Every number in this report traces to a disclosed source or to arithmetic on disclosed sources, and every allocation is labelled.
Sources. Abbott Laboratories FY2025 results release; Roche full-year 2025 results; Danaher fourth-quarter and full-year 2025 results; QIAGEN N.V. Form 20-F for the year ended 31 December 2025; bioMérieux FY2025 results; Becton Dickinson FY2025 results and the announced combination of Diagnostic Solutions with Waters Corporation; Bruker FY2025 results; the Centers for Medicare & Medicaid Services preliminary CY2027 clinical laboratory fee schedule; WHO Global Tuberculosis Report 2025; GBD 2021 Antimicrobial Resistance Collaborators, The Lancet; Rudd et al., sepsis burden, The Lancet; WHO 2025 antibacterial pipeline analysis; Regulation (EU) 2017/746 (IVDR); CLSI M47 and EUCAST breakpoint tables.
FX basis: EUR 1.13 and CHF 1.15 per USD, JPY 148 per USD — the same basis carried by the IVD hub and the rest of this cluster, matching the other reports in this cluster so that no figure requires restating between pages.
This report contains no third-party market-research citations. Where an external estimate exists and disagrees with our construction, we have not reconciled to it, because a construction that is adjusted toward someone else’s total stops being a construction.
Articles on this market
- The Largest Application Area in Diagnostics Has No Leader — no vendor above 11.86 per cent, a 40.35 per cent residual, and why the perimeter rather than the technology explains the fragmentation.
- The Pandemic Built the Point-of-Care Channel and the Channel Is Now Repricing — Abbott's COVID sales fall 60.2 per cent, point-of-care becomes the slowest segment at 3.12 per cent, and Roche walks into the channel with a waived molecular test.
- The Two Families Infectious Disease Tests Are Paid In Were Both Cut — molecular pathology at −22 per cent and microbiology at −19.3 per cent cover 61.19 per cent of this field, and the mix that drove the growth is what moved the revenue there.
- The Largest Risk to Infectious Disease Diagnostics Is a Budget Line, Not a Competitor — a 230 basis point scenario band in which the widest downside, 138 basis points, is a donor appropriation rather than a competitive one.
- The Mix Engine in Infectious Disease Diagnostics Stalls at Twenty-Six Per Cent of the Base — panelisation adds 1.49 points of mix against a 2.10% constant-menu price decline, and the two segments that drive it reach only 26.34% of the base by 2033, after which growth converges on 3.2% to 3.5%.
Paysage concurrentiel
Competitive Landscape
This is the most fragmented field in the cluster and the table below is the evidence. Thirteen pools, none above 12% of the market, a top five that holds 42.27%, and 40.35% of revenue with manufacturers who cannot be individually named. By comparison, two private companies hold 29.7% of haematology between them. There is no price leader in infectious disease diagnostics because there is no leader.
What the disclosed lines actually did in 2025
| Company line | 2025 revenue | Growth | What it tells you |
|---|---|---|---|
| Abbott Rapid Diagnostics | USD 2,454m | −18.1% | The decentralised channel is still contracting after the emergency |
| Abbott Point of Care | USD 606m | +3.1% | The professional POC channel grows while the consumer one deflates |
| Abbott Molecular | USD 517m | −0.7% | The largest ID vendor has almost no laboratory molecular position |
| bioMérieux Microbiology | EUR 1,339m | +4% (+6.3% ex-China) | Culture is the stable floor of the field |
| bioMérieux BIOFIRE non-respiratory | EUR 598m | +10% | The panel attached to the culture grows faster than the culture |
| bioMérieux SPOTFIRE | EUR 168m | +84% | Small base; the point-of-care molecular land grab is real |
| Qiagen diagnostic solutions | USD 803.1m | +7% | QuantiFERON and QIAstat-Dx; fastest growing disclosed line in the field |
| Roche Diagnostics (division) | CHF 13,847m | +2% CER (−3% CHF) | Pathology and molecular offsetting Chinese pricing reform |
| Danaher Diagnostics (segment) | not disclosed | +1.5% core | Cepheid respiratory is roughly USD 500m in a single quarter |
The Abbott row is the field’s strategic asymmetry in one number. The largest pool in the market is a rapid-diagnostics franchise at USD 2,454 million and a laboratory molecular business of USD 517 million. Abbott leads this field not by winning the laboratory but by owning the channel where the test is closest to the patient, and that channel contracted 18.1% in a year while professional point of care grew 3.1%. Both facts are true at once, and they describe a channel in mid-transition rather than a business in decline.
Roche: the direction of travel is visible in two launches
Roche’s Diagnostics division grew 2% at constant rates to CHF 13,847 million, with 53 new tests, two instrument platforms and six digital solutions introduced in 2025, and the division’s growth was carried by pathology and molecular against healthcare pricing reform in China. Two of the 53 matter strategically beyond their revenue. The first is cobas liat Bordetella — a point-of-care PCR test cleared by the FDA with CLIA waiver and CE-marked, delivering a result in about fifteen minutes. That is Roche moving molecular testing into the physician’s office, which is Abbott’s territory and where payment is made per test rather than per panel. The second is the expansion of cobas Mass Spec to 39 tests including antibiotic therapeutic drug monitoring — the therapeutic half of the same clinical question, sitting beside the susceptibility result rather than competing with it.
Danaher and Cepheid: the cleanest annuity, and the weather
Danaher’s Diagnostics segment grew 1.5% core in 2025 inside a company that grew 2.0%. Cepheid is the purest expression of the model this field runs on: the instrument is placed rather than sold at margin, and the cartridge carries the entire economics. It is also the most weather-dependent revenue in diagnostics. Cepheid respiratory revenue was roughly USD 500 million in the fourth quarter alone — a seasonal peak that is a large fraction of a full year’s respiratory testing, and a number that moves with the severity of one winter and the timing of one school term.
bioMérieux and Qiagen: the two companies that publish the menu
bioMérieux is the only company in this field that publishes its syndromic lines separately, and the three lines describe the whole substitution: microbiology at EUR 1,339 million growing 4%, the non-respiratory BIOFIRE panel at EUR 598 million growing 10%, and SPOTFIRE at EUR 168 million growing 84%. That is a ladder, and it is this report’s thesis inside one company’s disclosure — though it must be read with the base in mind, because 84% of 168 is a smaller number than 4% of 1,339.
Qiagen’s diagnostic solutions line, at USD 803.1 million and up 7%, is the fastest-growing disclosed infectious disease line in the field, and it rests on two products with almost no overlap. QuantiFERON tests latent tuberculosis, a market with no scaled competitor and a public-health buyer; QIAstat-Dx is a syndromic panel platform with more than 5,200 cumulative placements at the end of 2025. The company’s own framing is that five pillars represented about 72% of 2025 sales and USD 1.5 billion, heading for approximately USD 2 billion by 2028, against an addressable life-science and molecular-diagnostics pool it sizes at about USD 12 billion.
The fourth group: specialists and price players
Two populations sit below the platform franchises, and they are commercially opposite. The specialists — rapid susceptibility, direct-from-blood molecular, metagenomic sequencing, nanopore identification — compete on time-to-answer and carry a capital requirement their revenue per placement cannot yet fund. The price players — Seegene, national manufacturers in India and China, and the regional rapid-test producers inside the 40.35% residual — compete on cost per test and are the reason the constant-menu price of this field falls 2.10% a year. The specialists set the ceiling of what a test can be; the price players set the floor of what it can be paid.
Chaîne de valeur
Value Chain and Margin Capture
The chain runs specimen to payment in six steps, and the value is not distributed evenly across them: it concentrates at the two ends, in the collection device and in the interpretation, and it is thinnest in the middle where the amplification happens.
| Step | Who captures it | Margin character | Structural note |
|---|---|---|---|
| Specimen collection and transport | Collection-device specialists, distributors | High, defensible | Consumable, protocol-bound, rarely re-tendered |
| Extraction | Platform vendors | Medium | Becoming automated and bundled into the cartridge |
| Amplification and detection | Platform vendors | High per unit, falling per test | Where price competition is concentrated |
| Identification and susceptibility | Microbiology incumbents | Highest in the field | Clinically required, re-derived against moving breakpoints |
| Interpretation and reporting | Laboratory, software | Emerging | The step the fee schedule does not pay for separately |
| Reimbursement | Payer | — | Sets the ceiling on everything above it |
Instrument placement, and why the instrument is not the product
Every platform franchise in this field runs the same trade: the instrument is placed at or near cost, and the consumable carries the margin. Qiagen reports the shape explicitly — consumables and related revenue at USD 1,876.4 million, or 90% of net sales, growing 7%, against instrumentation at USD 213.6 million, 10% of sales, declining 2%. That is the whole model in two lines: the placement base is flat to shrinking and the pull-through is growing. The competitive contest is therefore not for the instrument order; it is for the menu that makes the placed instrument worth running.
This is why menu breadth, not instrument performance, is the strategic variable, and why 53 new tests in one year is a more consequential disclosure from Roche than any platform launch. A placed instrument with a thin menu is a stranded asset a competitor can displace at the next capital cycle; a placed instrument with a broad menu is a recurring revenue stream no one displaces, because displacing it means revalidating everything the laboratory reports.
The CLIA waiver is a margin instrument
In the United States the largest determinant of where a test is performed is not its analytical performance but its CLIA complexity categorisation. A waived test can be run by a physician’s office with no laboratory scientist on staff; a moderate- or high-complexity test cannot. The waived test is therefore paid in a different economic frame — a per-visit ancillary charge rather than a laboratory cost centre — and the same assay earns more in the office than in the hospital laboratory. Roche’s waived fifteen-minute Bordetella test and Abbott’s installed ID NOW base are the same strategy executed from opposite ends of the market, and it is why regulatory affairs in this field is a commercial function rather than a compliance one.
The panel as a payment device
A syndromic panel puts fifteen targets on one specimen and one reportable result. The payer does not pay for fifteen answers; it pays for one code. The economics of panelisation therefore depend entirely on the ratio between the code’s payment and the cartridge’s cost, and on whether the payer covers the panel at all rather than requiring single-target tests. That is the value chain’s decisive interface: the vendor’s margin is decided by a coverage policy it does not write.
It also explains the price decomposition. A panel raises revenue per test because it is billed once and priced above a single-target assay, which is the +1.49 point mix contribution. But it does not raise revenue per target — it divides it — so the more targets a panel carries, the more the field’s revenue depends on volume, and volume is where the cheap tests are.
The donor-funded chain, where the volume is
Outside high-income markets the chain is different and longer: manufacturer to distributor to national programme to facility, with procurement funded by a donor rather than a payer, gated by WHO prequalification, and priced at a ceiling the buyer sets. Viral load and tuberculosis molecular testing are almost entirely procured this way. Revenue per test is a fraction of the high-income equivalent and volume is a multiple of it, which is the mechanical reason this field’s revenue per test falls 0.61% a year even as its clinical footprint expands.
The margin in that chain sits with whoever holds the qualification and the distribution, not with whoever holds the assay. It is also the chain with the thinnest buffer: a funding decision made in one capital city can remove volume from three segments of this report at once.
Where the margin actually is
Susceptibility. It is the only step in the chain where the answer must be re-derived against a moving external standard, where the result cannot be substituted by a different technology without revalidation, and where the clinical decision depends on it. That is why microbiology grows at 5.14% with a rising revenue per test while every other segment in this field grows with a falling one. The rest of the field competes on a menu a competitor can copy; susceptibility competes on a standard a competitor must also meet.
Activité d'investissement
Investment Activity
Capital is leaving this field faster than it is arriving, and the movements are reclassifications rather than purchases. Three events in eighteen months say where the field is being placed in the corporate map, and none of them is a bet on infectious disease testing growing.
The BD–Waters combination: the blood-culture leader is being rehoused
Becton Dickinson is combining its Biosciences and Diagnostic Solutions businesses with Waters Corporation, expected to complete around the end of the first quarter of calendar 2026. What remains — “New BD” — is a medical technology company of medication delivery, medication management, pharmaceutical systems, advanced patient monitoring, surgery, peripheral intervention and urology and critical care.
The world’s leading blood-culture franchise will therefore sit inside an analytical-instruments company. That is a statement about which multiple its growth rate supports. A business growing in the low single digits and carrying consumable economics is valued on installed base and recurring revenue, not on menu expansion and pipeline optionality, and the instruments multiple is where that revenue belongs. The commercial consequence for competitors is straightforward: a separation absorbs management attention, disturbs commercial coverage and creates uncertainty in exactly the hospital accounts where a blood-culture contract is decided.
Abbott: the largest pool is the least invested
Abbott Diagnostics fell 4.3% in 2025 while the company grew 5.7%, and Medical Devices grew 12.6%. Within Diagnostics, Rapid Diagnostics fell 18.1% and COVID-19 testing-related sales fell from USD 747 million to USD 297 million. This is the field’s largest single pool, and it is the one segment of a diversified company that is shrinking.
Capital allocation follows that arithmetic without any strategic decision being announced. The question for the next cycle is not whether Abbott exits infectious disease diagnostics — it will not, the channel is too valuable — but whether it continues to fund a rapid franchise whose consumer half has deflated or redirects to the professional point-of-care and molecular lines that grew. Its Point of Care line grew 3.1% and its Molecular line was flat. Those are the two lines not in retreat.
The specialists and the capital gap
The rapid-diagnostics specialists that entered this field with a technological claim have found the same wall: a faster susceptibility answer is not a reimbursed one. The capital requirement is instrument placement at hospital scale, revenue per placement is small until utilisation builds, and the utilisation build requires the laboratory to change a workflow it is not paid to change. The result has been consolidation, delisting and recapitalisation rather than a new entrant at scale. The field’s innovation is now funded either inside platform franchises or by the public purse.
Where the money is actually being spent
| Company | Form of investment | What it buys |
|---|---|---|
| Qiagen | Internal: QIAstat-Dx placements above 5,200 at year-end 2025 | A syndromic installed base against an addressable pool the company sizes at about USD 12bn |
| bioMérieux | Internal: GO.Simple, more than 50 initiatives including automation of about 40% of BIOFIRE pouch manufacturing | 16% organic growth in contributive EBIT on 6.2% sales growth; free cash flow of EUR 462m, up 40% |
| Bruker | External: ELITech (2024), alongside cost-out beyond its earlier range | Menu added to a microbiology franchise while margin is repaired |
| Metagenomic ID | Venture and growth capital | The only segment in the field where new capital still arrives at scale |
The pattern across all four is the same and it is this report’s thesis at the capital line: the return is being sought in menu and in cost per test, not in price per test. bioMérieux delivering 16% organic growth in contributive EBIT on 6.2% sales growth is the clearest statement any company in this field has made about where the money is.
Technologie et innovation
Technology and Innovation
The clinical variable in infectious disease diagnostics is not sensitivity. It is time to answer, and whether the answer changes what is done in the next hour. Every technology shift in this field can be read as an attempt to move a result earlier in a decision, and every commercial failure in it can be read as an answer delivered after the decision was made.
Four technology fronts, and what each is for
| Front | Time to answer | Displaces | Commercial state |
|---|---|---|---|
| Syndromic multiplex PCR | 1–4 hours | Sequential single-target testing | Scaled; the mix engine of this forecast |
| Point-of-care molecular, CLIA-waived | 15–30 minutes | Send-out and batch laboratory testing | Fastest menu growth; per-test payment |
| Genotypic resistance markers | 1–3 hours | Part of phenotypic susceptibility | Growing where the marker is unambiguous |
| Metagenomic sequencing | 24–72 hours | Culture-negative and undiagnosed cases | Small, high-price, reimbursement-constrained |
Why culture survives every technology that was supposed to replace it
The question a clinician asks is not “what organism is this” but “what can I give the patient”. A genotypic marker answers the first question precisely and the second partially: it can say a resistance gene is present, and it cannot say which of the remaining agents will work. Phenotypic susceptibility answers the second question directly and takes 24 to 48 hours after the organism grows. That interval is why blood culture has not been displaced, and why molecular identification has been added on top of it rather than in place of it — the same structural relationship our microbiology report found, seen here from the application side.
The consequence is that the fastest-growing technology does not reduce the number of tests. It adds a test upstream and leaves the downstream one in place. That is why volume in this field compounds at 5.49% while revenue per test falls: the new test is ordered in addition to the old one more often than instead of it, and the new test is priced on a cartridge while the old one is priced on a workup.
Panelisation is a workflow technology, not an analytical one
A fifteen-target respiratory panel is not fifteen times better than a single-target test. It is a different ordering decision: one swab, one accession, one result set, one call to the clinician. Its value is that it removes the sequential test-and-wait loop from a respiratory admission, and its economics are decided by whether the payer recognises one code or fifteen. The technology is mature; the reimbursement question is not. That is the most important thing to understand about the next eight years of this market: the growth is not waiting on an assay, it is waiting on a coverage policy.
The metagenomic frontier, at its real size
Sequencing everything in a specimen and subtracting the host genome is the only technology in this field that answers the question no targeted test can: what is this, when no one has guessed right. It grows at 14.02% in this forecast and it is 1.39% of the base. It is also the technology most exposed to regulation and payment — laboratory-developed, complex, expensive per result, and dependent on a regime that permits it to exist. Its 5.62% share of the increment by 2033 is real growth on a small base and should not be read as a substitution for anything in the other six segments.
Innovation intensity, honestly assessed
This is a highly innovative field at the assay level and a slow-moving one at the platform level. There are hundreds of new tests a year and a handful of new instruments a decade. The instruments that matter commercially are the ones that move a test between settings — into the office, into the emergency department, into the clinic — and the assays that matter are the ones that add a target to a menu that is already placed. That asymmetry is why R&D in this field is concentrated in menu expansion and why the patent estate is defensive rather than generative.
The technology that does not matter
Analytical sensitivity beyond clinical need. A test that detects ten copies when the decision threshold is ten thousand buys nothing, and a test that reports a resistance gene without telling the clinician which drug to use moves the decision without resolving it. A meaningful share of the innovation in this field over the last decade has been sensitivity competition for a market already won at the sensitivity it needed. What is being paid for now is time and menu, not limits of detection.
Risque de marché
Market Risk
Infectious disease diagnostics has near-certain demand and unusually uncertain revenue. Nothing in the risk register threatens the number of tests; four of the six risks threaten what a test is paid.
| Risk | Likelihood | Impact | Transmission |
|---|---|---|---|
| The post-COVID base effect is not finished | High | Medium | Further decline in rapid and consumer channels |
| Public-health funding withdrawal | High | High | Viral load and tuberculosis molecular volume removed outright |
| Fee-schedule reduction | Near-certain | Medium–high | Molecular pathology −22%, microbiology −19.3%, capped at 15% a year to 2029 |
| Panel coverage restriction | Medium | High | An uncovered panel reverts to single-target testing and the mix contribution disappears |
| China volume-based procurement and domestic substitution | High | Medium | Price floor falls; imported share falls faster |
| The drug-pipeline ceiling | Structural | Long-run | A result is worth the decision it changes; WHO counts 90 antibacterial agents in clinical development, 15 innovative and 5 active against a critical-priority pathogen |
The base effect, quantified
Abbott’s COVID-19 testing-related sales fell USD 450 million in a single year, and its Rapid Diagnostics line still fell 18.1% with that reduction already inside the comparison. Two years after the emergency ended, the largest pool in this field is still absorbing the loss of one product family. Any forecast that treats 2025 as a clean base is wrong, and the direction of the residual correction is downward.
Funding withdrawal is the largest single exposure
Viral load and treatment monitoring at USD 2,900 million, and the tuberculosis molecular testing inside the diagnostics the WHO tracks, are procured by donors and national programmes rather than by payers. Those segments are 9.62% of the base and 7.92% of the increment, and the increment is what a forecast is. A quarter reduction in donor-funded volume from 2026 removes roughly USD 900 million from the 2033 endpoint and takes the CAGR from 4.85% to 3.47%. No clinical development, no product launch and no reimbursement decision offsets that, because none of them acts on the same buyer.
The fee schedule, and why the cap is not relief
Molecular pathology codes fall 22% and microbiology codes 19.3% in the preliminary calendar 2027 clinical laboratory fee schedule, with reductions capped at 15% a year from 2027 to 2029. The cap does not forgive the difference; it defers it, and it defers it into exactly the years this forecast treats as its growth period. Because this field’s tests are paid across both families — a syndromic respiratory panel in molecular pathology, a culture and susceptibility in microbiology — there is no code family in which the field is sheltered.
Coverage policy is the risk the industry talks about least
The mix contribution of +1.49 points a year depends on panels continuing to be reimbursed as panels. A payer that requires single-target testing, or covers a panel only for a defined population, converts a fifteen-target cartridge back into one billable result and destroys the price advantage of the format without reducing its cost. This is not hypothetical: it is the normal shape of coverage policy in a decentralised payer system, and it is why the panelisation thesis has a ceiling rather than a horizon.
What is not a risk
Demand. Bacterial antimicrobial resistance was associated with 4.71 million deaths in 2021 and 1.14 million were attributable to it, with projections of 8.22 million and 1.91 million by 2050; sepsis accounted for 48.9 million cases and 11.0 million deaths; tuberculosis produced 10.7 million cases and more than 1.2 million deaths in 2024, with rapid molecular testing reaching only 54% of those diagnosed. The field will not run out of clinical need. The risk is entirely in the price at which that need is met, and in who pays.
Paysage réglementaire
Regulatory Landscape
Three instruments govern this field and they do not point the same way: approval is counted per analyte, payment is counted per code, and procurement is counted per qualification. The gaps between those three counts are where the industry’s economics live.
Approval: the analyte as the unit
In the United States a new infectious disease test reaches market through a 510(k) with a predicate, or de novo where no predicate exists, and the claim defines the population and specimen for which it may be reported. In Europe, Regulation (EU) 2017/746 classifies assays by risk, requires notified-body conformity assessment above Class A, and places the highest-risk assays in Class D with a transition timeline that has consumed notified-body capacity across the industry. For most of this field the burden is documentation rather than a barrier to entry; for the assays at the top of the classification it is a real cost per assay and a real queue.
CLIA categorisation: the commercial regulator
The most commercially consequential regulatory decision in this field is not the clearance but the complexity categorisation that follows it. A waived test can be performed by a physician’s office; a moderate- or high-complexity test cannot. That categorisation determines which buyer can purchase the product, at what price, and under which payment mechanism. Roche’s FDA clearance with CLIA waiver for a fifteen-minute Bordetella PCR test is a regulatory event that is really a channel decision.
Laboratory-developed tests: the regime that permits the frontier
Metagenomic identification and much of the specialist menu in this field exist commercially as laboratory-developed tests under CLIA enforcement discretion rather than as cleared devices. The attempt to bring laboratory-developed tests under device regulation was vacated by a federal court in March 2025, leaving the enforcement-discretion regime in place. That outcome is why a hospital or reference laboratory can offer whole-specimen sequencing at all: without it, the 14.02% segment in this forecast would not exist in its current form, and the field’s only genuinely new diagnostic capability would be confined to cleared, targeted assays.
Payment: the weighted median and its reporting base
Medicare laboratory rates are set under PAMA from the weighted median of private payor rates reported by applicable laboratories. The 2026 reporting cycle covered January to June 2025 and was reported between May and July 2026; 6,411 laboratories submitted, 6,304 survived exclusions, and 1,528 of 1,947 codes produced a weighted median. Hospital laboratories rose from about 1.1% of reporting entities in 2017 to roughly 13.6% now.
That last statistic is the mechanism worth holding. As hospital laboratories come to dominate the reporting base, the private payor rates that determine Medicare’s rates are increasingly other hospitals’ negotiated rates, so administered pricing converges on the lowest hospital contract in a market rather than on an independent laboratory’s commercial price. The preliminary 2027 schedule — molecular pathology −22%, microbiology −19.3%, chemistry −16% — is what that mechanism produces.
Procurement: prequalification as the gate
In donor-funded markets the regulatory gate is not approval but qualification. WHO prequalification and emergency-use listing determine whether a product can be procured at all by the programmes that buy viral load and tuberculosis testing, and national registration in the recipient country determines whether it can be distributed. For a manufacturer outside the platform franchises, qualification is the single highest-value regulatory asset it can hold, because it converts an assay into a tendered line item.
China: registration is not the constraint
NMPA registration is necessary and increasingly insufficient. Provincial volume-based procurement sets the price and determines the volume, and domestic-substitution preferences decide who may bid. For imported platforms the binding constraint is the tender, not the approval, which is why the same catalogue can grow internationally and contract domestically in the same year.
| Jurisdiction | Approval pathway | Price mechanism | Binding constraint |
|---|---|---|---|
| United States | 510(k) or de novo; CLIA complexity categorisation; laboratory-developed tests under enforcement discretion | Medicare CLFS weighted median of private payor rates; 15% annual cap 2027–2029 | Statutory reductions across molecular pathology and microbiology |
| European Union | IVDR 2017/746, notified body, risk-class dependent, Class D transition | Decentralised, payer-negotiated | Notified-body capacity and per-assay conformity cost |
| China | NMPA registration; provincial platform listing | Provincial volume-based procurement | Tender award and domestic-substitution preference |
| Japan | PMDA approval | National fee schedule, scheduled revision | Mature market; demographic contraction |
| Donor-funded markets | WHO prequalification or emergency-use listing plus national registration | Programme procurement against a buyer-set ceiling | Qualification and funding continuity |
The regulatory conclusion
Approval is counted in analytes, payment in codes, procurement in qualifications, and the field’s product strategy is an arbitrage across the three. A panel is many analytes, one code and one qualification, which is precisely why it is the format the industry converged on. The regulatory risk to the forecast is not that approval becomes harder; it is that the code side of the arbitrage closes as coverage policy tightens and the fee schedule falls.