
Global Packaging Market Report, Size, Share and Forecast 2026–2033: Three Mergers Before the Rulebook
The Short Version
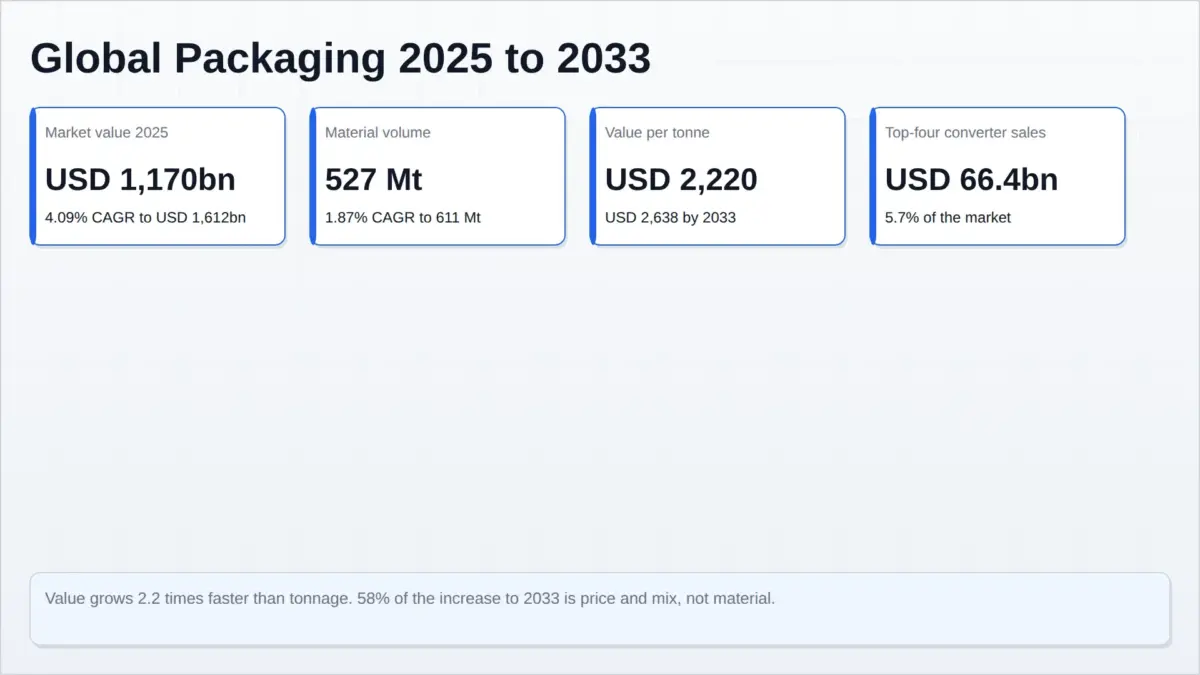
The global packaging market is USD 1,170 billion in 2025, built on 527 million tonnes of material, and reaches USD 1,612 billion in 2033 at a compound annual growth rate of 4.09 per cent. Material volume grows 1.87 per cent over the same window. The two numbers are the report.
Because value compounds at 2.2 times the rate of tonnage, 58 per cent of the USD 442 billion of additional revenue between 2025 and 2033 is price and mix rather than material. Volume adds 84 million tonnes, worth USD 186 billion at 2025 unit values. The remaining USD 256 billion comes from what the tonne is made of and what is printed or encoded on it. Unit value rises from USD 2,220 a tonne to USD 2,638, which is 2.18 per cent a year — a mix effect, not inflation.
Three things happened before the rulebook
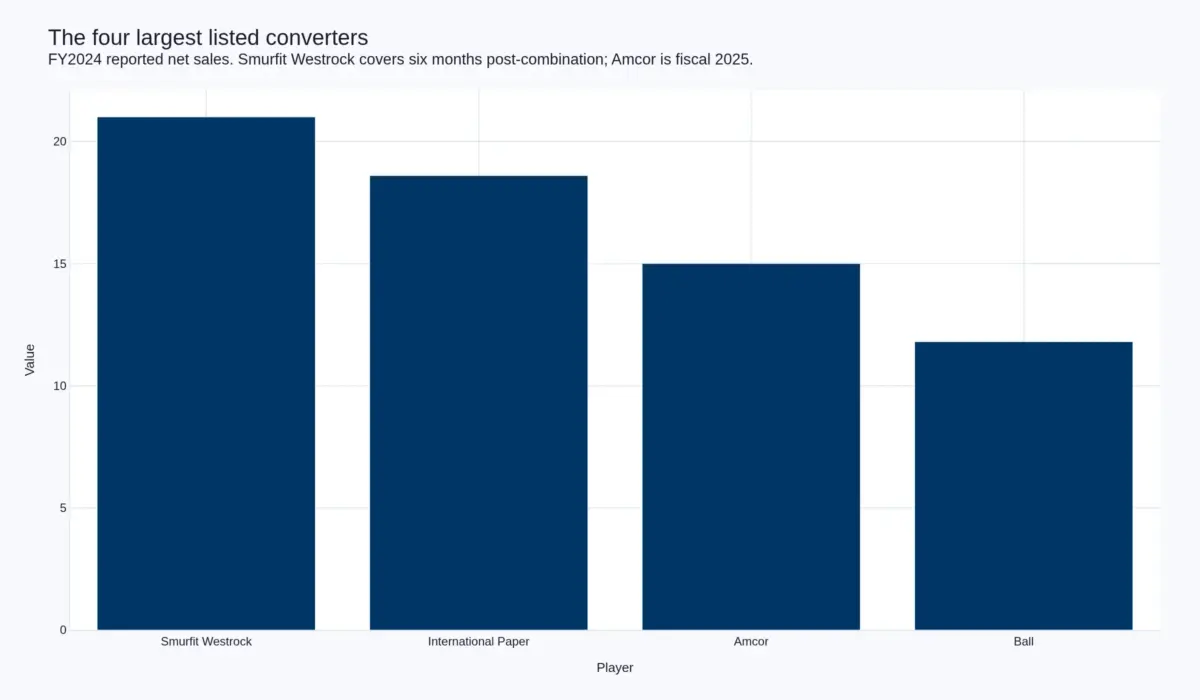
One. The top of this market consolidated in eighteen months, and it did so before the regulation that governs it took effect. Smurfit Kappa and WestRock closed in July 2024 and reported USD 21.0 billion of net sales in the partial year. International Paper closed DS Smith on 31 January 2025 for USD 7.2 billion against USD 18.6 billion of its own 2024 sales. Amcor closed Berry Global at the end of April 2025 for USD 15.2 billion against USD 15.0 billion of fiscal 2025 sales. Ball reported USD 11.8 billion. Those four are USD 66.4 billion, or 5.7 per cent of the market.
Two. The regulation is a design regulation, not a volume regulation. Regulation (EU) 2025/40 applies from 12 August 2026; design-for-recycling and recycled-content thresholds apply from 1 January 2030. It tells you what the tonne must be made of. It does not tell you how many tonnes there will be.
Three. Europe already demonstrates the decoupling. Eurostat puts EU packaging waste at 81.5 million tonnes in 2024, 181.0 kilograms per person, of which 40.8 per cent is paper and board and 19.9 per cent plastic. Plastic packaging recycling reached 42.4 per cent, with Latvia at 71.0 per cent and Denmark at 22.5 per cent in the same legal regime.
The call we would defend
Packaging is no longer a market of packages. It is a market of documented materials. The scarce asset is not converting capacity — there is too much of that — and it is not brand relationships. It is traceable, food-contact-safe, food-grade recycled and certified-virgin substrate, with the evidence attached. Converters who own that will hold price. Converters who own only machines will bid for contracts, which is what they have always done.
What we are least sure of
The 527 million tonne volume base is the weakest number in the report. It is derived from per-capita packaging consumption anchored on European data and scaled across regions, not from a global material census, which does not exist. Our two weakest coefficients are the global average consumption rate and the wood-and-other volume, both of which we state openly in the methodology so a reader can replace them and re-run the arithmetic.
A USD 1,170 billion market that grows twice as fast in value as in tonnes
The world spends USD 1,170 billion a year on packaging and buys 527 million tonnes of it. That is 64 kilograms per person per year and a unit value of USD 2,220 a tonne. Between 2025 and 2033 the value compounds at 4.09 per cent to USD 1,612 billion while the material compounds at 1.87 per cent to 611 million tonnes. Value grows 2.2 times faster than tonnage, and 58 per cent of the USD 442 billion of additional revenue is price and mix rather than an extra kilogram of material reaching a shelf.
That single relationship reframes most of the questions this industry asks about itself. If value is growing twice as fast as tonnage, a converter's growth does not come from winning volume. It comes from raising the unit value of what it already ships: lighter structures with more conversion content, substrate substitutions that command a premium, and the compliance evidence that now travels with the pallet.
Eighteen months that restructured the top
Three combinations closed between July 2024 and April 2025, and they are the reason the competitive landscape chapter of this report looks different from the one it replaced.
Smurfit Kappa and WestRock completed in July 2024. The combined company reported USD 21.0 billion of net sales for the partial year, including USD 7.54 billion in the fourth quarter and USD 319 million of net income, and its chief executive put "value over volume" at the centre of the result. International Paper carried USD 18.6 billion of 2024 net sales — down from USD 18.9 billion in 2023 — into a USD 7.2 billion acquisition of DS Smith that completed on 31 January 2025, with at least USD 514 million of claimed synergies and five European box plants divested to satisfy the Commission. Amcor closed a USD 15.2 billion all-stock merger with Berry Global at the end of April 2025 on top of USD 15,009 million of fiscal 2025 net sales, targeting USD 650 million of synergies by the end of year three. Ball reported USD 11.8 billion after exiting aerospace in February 2024.
Those four reported USD 66.4 billion between them. That is 5.7 per cent of the market. No packaging company on earth holds a double-digit share, and that number is worth sitting with, because the merger wave of 2024 and 2025 is easy to read as consolidation of a concentrated industry. It is not. It is consolidation of a fragmented one, in which the four largest players in the world can still aggregate only a twentieth of it.
The rulebook arrived after the deals, not before
Regulation (EU) 2025/40 has been in force since 11 February 2025 and applies generally from 12 August 2026, with the design-for-recycling condition and the recycled-content thresholds landing on 1 January 2030. The three combinations above closed inside the window between the regulation's political agreement and its application.
That sequencing matters more than any individual deal. Each was justified on cost, footprint and format breadth. None could have been justified on the compliance terms, because the delegated acts that will define recyclability at grade level were not written then and are largely not written now. The industry bought mills and box plants with a view of the substrate, and the substrate is precisely what the regulation is about to re-price.
Europe is the stress test, and it is already running
Eurostat's 2024 release is the closest thing the world has to a measured packaging census: 81.5 million tonnes generated across the EU-27, 181.0 kilograms per person, up 3.2 kilograms on 2023 and 19.6 kilograms on 2014. Paper and board is 40.8 per cent of the total, plastic 19.9 per cent, glass 18.1 per cent, wood 16.2 per cent, metal 4.8 per cent.
Two details in that release are more useful than the totals. First, plastic packaging recycling reached 42.4 per cent across the union, but the spread runs from Latvia at 71.0 per cent, Belgium at 58.2, Poland at 56.0 and Czechia at 53.7 down to Denmark at 22.5, Finland at 26.9 and France at 27.4. A threefold divergence inside one legal framework is the strongest available argument for why the 2025 regulation leans on product design rather than on national collection effort.
Second, the Commission's own framing cited a record 186.5 kilograms per person in 2022 and projected continuous growth without intervention. The revised series now shows 181.0 kilograms in 2024. Both can be true of different years and different methods, and this is not a controversy — but the direction is not monotonic, and a forecast built on the premise that packaging tonnage only ever rises is resting on something the data has already wobbled.
What Europe's paper industry says about where the tonne is going
CEPI's 2024 statistics put European paper and board production at 78.7 million tonnes, up 5.9 per cent, of which packaging grades are 49.6 million tonnes — 62.9 per cent of the total. The sector turns over EUR 95 billion, employs 174,000 people directly and adds EUR 21 billion to EU GDP. Germany makes 24.4 per cent of the tonnage, Sweden 10.2 per cent and Italy 10.1 per cent.
The composition shift inside those totals is the argument. Packaging grades grew 6.7 per cent while graphic papers contracted, and that reallocation is now structural rather than cyclical: a sheet machine that used to make newsprint can, with capital, make containerboard. Where that capital is pointed is the clearest single signal the industry emits, and it is pointed at packaging.
The material split, by volume and by value
| Material | Volume 2025 (Mt) | Share of volume | Value 2025 (USD bn) | Share of value | Value per tonne |
|---|---|---|---|---|---|
| Paper and board | 205 | 38.9% | 390 | 33.3% | USD 1,902 |
| Plastic | 130 | 24.7% | 395 | 33.8% | USD 3,038 |
| Glass | 60 | 11.4% | 95 | 8.1% | USD 1,583 |
| Metal | 25 | 4.7% | 150 | 12.8% | USD 6,000 |
| Wood | 95 | 18.0% | 75 | 6.4% | USD 789 |
| Other | 12 | 2.3% | 65 | 5.6% | n/a |
| Total | 527 | 100% | 1,170 | 100% | USD 2,220 |
Paper and board is the largest material by volume at 38.9 per cent and by value at 33.3 per cent, because it is cheap per tonne and ubiquitous. Plastic is 24.7 per cent of volume but 33.8 per cent of value — the highest-value structural position in the market, which is exactly why it is the most exposed to a regulation that restricts format. Metal is 4.7 per cent of volume and 12.8 per cent of value: a beverage can is the highest-value-per-kilogram object most consumers will ever throw away. Glass is the mirror image, 11.4 per cent of volume and 8.1 per cent of value, heavy and cheap per tonne, and structurally protected wherever a deposit return system now collects it.
How the eight years split
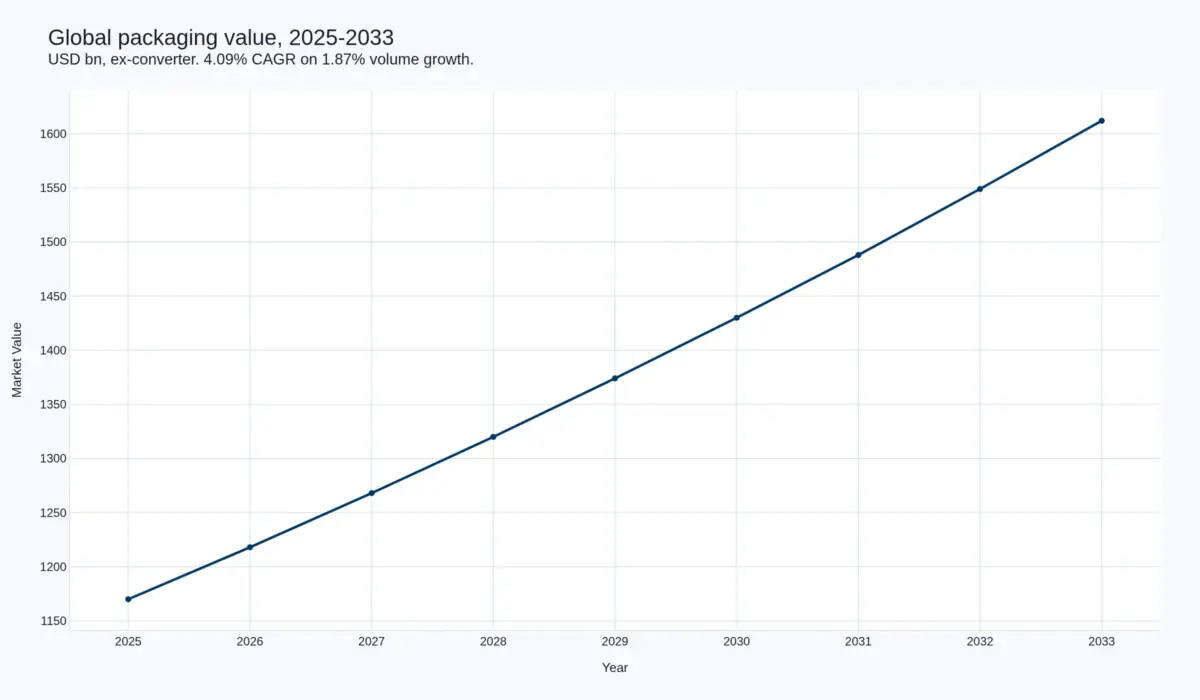
USD 1,170 billion in 2025 becomes USD 1,612 billion in 2033. The path is not a straight line in practice — the substrate cycle will produce at least one bad year inside it — but the trend is a mix effect wearing a growth number's clothes, and the decomposition below is the more honest picture.
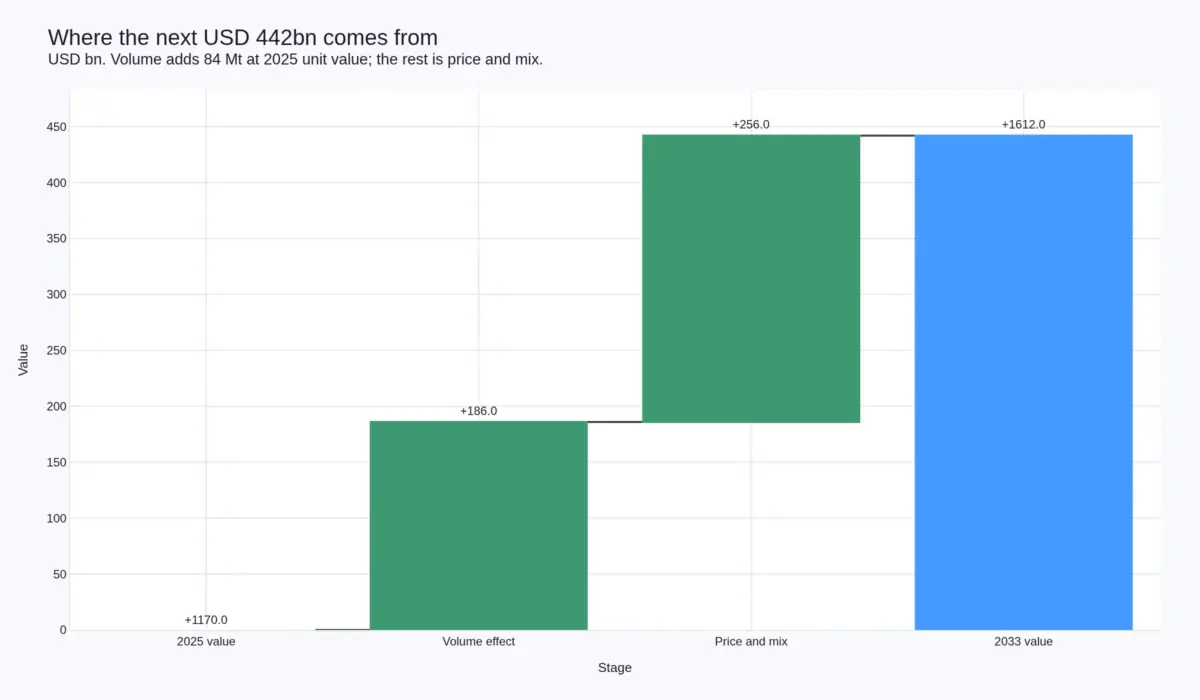
84 million tonnes of additional material at 2025 unit values is USD 186 billion. The remaining USD 256 billion is unit-value growth: from USD 2,220 a tonne to USD 2,638, or 2.18 per cent a year. That is not inflation, because it is measured in constant unit terms; it is the market shifting toward formats that cost more to make per kilogram and carry more information per pack.
Regional shape
Asia-Pacific is the largest region by both volume and value and the source of most of the incremental tonne. Europe is the most valuable region per tonne and the only one where a binding design regulation is already reshaping specification. North America is the most consolidated and the most exposed to a single substrate shock, because its fibre system was built around one grade and one box standard. Latin America and Africa are where the growth rate is highest and where the data is thinnest.
The regional picture inside this cluster is covered in more depth in the reports on Europe's PFAS-free food contact packaging, Europe's monodose formats, Peru's thermoformed market, the CARICOM liner market and the new global cement packaging market, which is the first full test of what a format-specific packaging report looks like at this level of granularity.
Three propositions this report defends
- Value is decoupling from tonnage, permanently. Not because demand is falling but because the regulation and the retailer both reward packaging that is lighter, mono-material and information-bearing. Every one of those is a unit-value increase with a tonnage decrease attached.
- The merger wave was a substrate bet, not a scale bet. Smurfit Westrock bought the North American containerboard system. International Paper bought European box plants. Amcor bought rigid to sit beside flexible. Only one of those is about tonnage, and it is the one with the lowest margin.
- Food-grade recycled substrate is the binding constraint to 2030, not converting capacity. There is more converting capacity in the world than there is compliant material to run through it.
What this report does not do
No purchased market-size figure sits underneath it, and no third-party research estimate is cited, referenced or used as an anchor anywhere in it. The base is built upward from published physical statistics and company filings, with the coefficients stated openly so a reader can replace them and re-run the arithmetic. Where we have modelled, the methodology says so in the same sentence as the number.
The adjacent chemistry and fibre reports in this library carry the substrate detail this report deliberately does not repeat: global pulp and paper, polypropylene and its composites and olefins.
Table of Contents
- Market Snapshot
- Market Definition and the Four Boundary Calls
- Market Size and Forecast
- 3.1 How the 2025 Base Was Built
- 3.2 The Decomposition Is the Finding
- 3.3 The Material Split
- Four Structural Shifts Defining 2026–2033
- 4.1 Value Decoupled from Tonnage
- 4.2 The Top Consolidated Before the Rule Was Written
- 4.3 The Substrate Became a Compliance Asset
- 4.4 The Package Became a Data Carrier
- Market Drivers
- 5.1 E-Commerce Density
- 5.2 Fibre Substitution
- 5.3 Recycled-Content Mandates
- 5.4 Food Safety and Shelf Life
- 5.5 Formalisation of Waste Infrastructure
- Market Restraints
- 6.1 Avoidance and Reuse
- 6.2 Recycled-Content Supply
- 6.3 Substrate Price Volatility
- 6.4 Permitting and Infrastructure Lag
- Segmentation
- 7.1 By Material
- 7.2 By Format
- 7.3 By End Use
- 7.4 By Route to Market
- 7.5 By Reuse Class
- Regional Analysis
- 8.1 Europe
- 8.2 Asia-Pacific
- 8.3 North America
- 8.4 Latin America
- 8.5 Middle East and Africa
- 8.6 What the Geography Says
- Competitive Landscape
- Regulatory Landscape
- Strategic Outlook
- Watch List
- Methodology
- About This Report
Competitive Landscape
Competitive Landscape
This is one of the least concentrated large industries in the world, and the three biggest transactions in its history did not change that. The four largest listed converters reported USD 66.4 billion of net sales between them in their most recent full years. Against a market of USD 1,170 billion that is 5.7 per cent. No packaging company holds a double-digit share, and on our estimate the twenty largest converters together hold less than a fifth of the market. The other 80 per cent is tens of thousands of converting plants, most of them single-site, most of them within a few hundred kilometres of the customer they were built for.
What the three deals actually bought
| Transaction | Closed | Consideration | What was bought | What it is a bet on |
|---|---|---|---|---|
| Smurfit Kappa and WestRock | July 2024 | All-share combination | The North American containerboard system plus European and Latin American converting | Fibre self-sufficiency in the largest corrugated market |
| International Paper and DS Smith | 31 January 2025 | USD 7.2 billion, share-based | European box plants and their customer base; five plants divested for clearance | European corrugated footprint and customer proximity |
| Amcor and Berry Global | End April 2025 | USD 15.2 billion, all-stock | Rigid packaging added to a flexible portfolio | Format breadth in consumer packaging, not substrate |
Read side by side, the logic is not scale. Two of the three are substrate bets and one is a portfolio bet. Smurfit Westrock bought the thing that was scarce in North America in 2022 and 2023, which was linerboard. International Paper bought boxes and the customers attached to them, having simultaneously closed a pulp mill it judged not to be the low-cost asset. Amcor bought the other half of the format menu, which is what a converter does when its growth story is a customer conversation rather than a raw material position.
The claimed synergies tell a similar story. At least USD 514 million from International Paper and DS Smith, USD 650 million from Amcor and Berry by the end of year three. Neither is a technology synergy. Both are duplicate corporate cost, duplicate freight lanes and duplicate mill networks — which is to say they are consolidation of overhead, and overhead synergies do not make a company more innovative.
The Commission’s read is the useful one
The European Commission cleared International Paper’s acquisition of DS Smith only on condition that five box plants in Europe be divested. That single condition is the most precise public statement anyone has made about where this industry’s competitive boundary lies, and it is not the one the industry describes. It is not global packaging. It is not even European packaging. It is regional corrugated converting, because a box costs more to ship than it costs to make and therefore competes within a radius rather than within a market.
That is the correct unit of competition analysis in this sector, and it explains why a 5.7 per cent top-four share coexists with genuinely concentrated local markets. A converter with one plant and one customer may hold 60 per cent of the boxes delivered within 200 kilometres of that plant. Concentration in packaging is a local statistic wearing a global label.
The structure underneath
The market is fragmented at the converting level and concentrated at the substrate level, and the mismatch between those two facts is the industry’s permanent condition.
| Layer | Structure | Where the power sits |
|---|---|---|
| Containerboard and kraft | Concentrated; a small number of large machines | With the machine owner, cyclically |
| Can sheet and glass containers | Concentrated regionally by freight economics | With the regional incumbent |
| Resin | Concentrated upstream, outside this market | With the petrochemical producer |
| Converting | Fragmented to the floor | With the customer, mostly |
| Reprocessing | Consolidating quickly under EPR fee revenue | With whoever holds the permitted capacity |
The four companies we count as tier one are tier one by revenue and by geographic reach, not by share: Smurfit Westrock at USD 21.0 billion, International Paper at USD 18.6 billion before DS Smith, Amcor at USD 15.0 billion, Ball at USD 11.8 billion. That is what tier one means here — the four companies capable of serving a global customer across three continents, not the four companies that set the price. Nobody sets the price.
Where the fight is actually happening
Four contests, and only one of them is about price.
- Mono-material against multi-material. The design-for-recycling condition applying from 1 January 2030 makes the multi-layer laminate structurally difficult to defend unless the layers can be separated. This is a contest between performance and compliance, and compliance is winning because it is written into law.
- Fibre against plastic. Not a consumer preference story. A fee-and-mandate story, where EPR modulation and recycled-content thresholds change the relative cost of a tonne of each.
- Reuse against single-use. Narrow in scope, real in HORECA and beverage, and capable of removing a format from a market entirely rather than swapping its material.
- Evidence against assertion. The least discussed and probably the decisive one. Two converters can offer an identical specification; only one can document the recycled content, the food-contact compliance and the chain of custody to the standard a brand owner’s auditor will accept.
Who is positioned for the 2030 rule set
Three profiles, and the middle is the dangerous place to stand.
The integrated fibre player owns the mill, the box plant and increasingly the recovery route. It wins on substrate cost and loses on flexibility, because a containerboard system is a bet on one material.
The format-agnostic converter with a compliance system owns no fibre, sells every substrate and competes on the data it can produce about each of them. Amcor’s post-Berry shape is the closest listed example of the intent, though not yet of the execution.
The regional specialist owns one plant, one customer base and one format, earns a return on capital that the majors cannot match at that scale, and is permanently available for acquisition at a multiple the majors can afford.
The squeeze is on the company that is too large to be a specialist and too small to own substrate. That company is currently paying more for its board than the integrated player, more for its compliance than the format-agnostic converter, and cannot pass either through. It is the segment of this market most likely to disappear by 2033, and it is the reason we expect the deal count to rise even though the top-four share will barely move.
Value Chain
Value Chain
Packaging is four businesses wearing one word, and the margin sits in a different place in each of them. Fibre, polymer, glass and metal are commodity supply businesses with cyclical rents. Conversion is a competitive manufacturing business with thin, structural margins. Filling belongs to the brand owner. Collection and reprocessing is a regulated utility that barely existed commercially twenty years ago and now sets the price at the front of the chain. Reading the industry as one chain is what causes people to misjudge where the money is.
Stage one: the substrate
The fibre end is the most capital-intensive part of the chain and the slowest to respond. A containerboard machine is a billion-euro decision with a multi-year lead time, which is why CEPI’s 78.7 million tonnes of European paper and board production, of which 49.6 million tonnes is packaging grades, is a number that moves at the speed of capital rather than the speed of demand. Resin is the opposite: raffia, film and injection grades are bought on global markets by converters with no leverage over the price, and the petrochemical cycle arrives in the converter’s cost base whether or not the converter has a view on it. Metal is priced off exchange plus a conversion premium, so the can maker carries aluminium risk it cannot hedge beyond a year with any precision. Glass is the least flexible of all, because a furnace runs a campaign measured in a decade and cannot be turned down without destroying it.
Stage two: conversion, where the revenue is and the margin is not
The published economics of the two largest listed converters are the clearest statement of what conversion is worth. Amcor reported USD 15,009 million of net sales in fiscal 2025 and USD 2,834 million of gross profit, an 18.9 per cent gross margin, converting to USD 1,009 million of operating income — 6.7 per cent — after USD 307 million of restructuring, transaction and integration expense. Strip out the deal costs and the operating margin is 8.8 per cent. International Paper reported USD 18,619 million of 2024 net sales and USD 400 million of adjusted operating earnings, which is 2.1 per cent.
Those two numbers, 8.8 per cent and 2.1 per cent, are the whole argument about vertical integration in packaging. A converter that buys board on the market is running a commodity conversion business and earns a commodity conversion margin. A converter that owns the mill earns the mill’s rent in a tight year and carries the mill’s losses in a loose one.
| Stage | What sets the price | Who holds the margin | Capital intensity |
|---|---|---|---|
| Kraft liner and containerboard | Machine capacity against demand; recovered fibre and energy cost | The mill, cyclically | Very high |
| Resin and film | Global petrochemical and refinery economics | Nobody in the converting chain | High, upstream of this market |
| Aluminium and steel | Exchange price plus conversion premium | The smelter and the can maker, in sequence | Very high |
| Glass | Furnace campaign economics and energy | The container maker, where it is concentrated | Very high |
| Converting | Customer qualification, print complexity, freight radius | The converter, thinly | Moderate |
| Filling and packing | Line speed and downtime | The brand owner | Moderate, at the customer |
| Collection and reprocessing | EPR fee revenue and the price of the bale | The reprocessor, increasingly | High |
Stage three: the mill behind the box plant
Which is why the integrated model exists, and why the three mergers of 2024 and 2025 all moved in the same direction. Smurfit Westrock’s 2024 segment disclosure shows the geometry: USD 4.6 billion of fourth-quarter net sales in North America, USD 2.5 billion in Europe, the Middle East and Asia-Pacific, and USD 524 million in Latin America, each segment described as a system of mills and plants rather than a portfolio of products. International Paper bought DS Smith for European box plants and the customer relationships attached, having in the same year taken a USD 334 million charge to close its Georgetown, South Carolina pulp mill because it was not the low-cost asset. Integration is a hedge on the substrate, not a growth strategy.
Stage four: the filling line is the real customer
Packaging is not bought by the person who drinks from it or the brand manager who approves the artwork. It is specified by whoever owns the machine that fills it, and that machine decides the format long before the marketing brief exists. A converter that qualifies a structure on a brand owner’s line holds that account for the life of the line, which can be a decade. A converter that wins on price against an incumbent whose format is already validated on the line usually loses. This is the single most under-modelled fact about the industry: the switching cost is engineering, not commercial, and it is why the industry sells service and continuity rather than board.
Stage five: the waste end now sets the front-end price
Extended producer responsibility fees are charged to the brand owner per tonne, by material, and modulated by recyclability. That cost never appears on a converter’s invoice, and it is the first mechanism in the history of this industry that transmits a waste-end signal back to substrate choice at the design desk. Where the fee differential between a multi-material laminate and a mono-material structure exceeds the conversion cost difference, the specification changes with no consumer pressure at all. Add the PPWR recycled-content thresholds applying from 1 January 2030 and the waste end stops being a cost centre and becomes a supply chain.
Where the value ends up
Split across the chain, the USD 2,220 that a tonne of packaging fetches resolves into substrate, conversion and freight, with the mill capturing cyclical rent at the top of the cycle and the brand owner passing most of the total through to a consumer who is buying the product. The profit pool is migrating, and it is migrating away from the middle. Three positions capture it: owning the substrate, owning the compliance evidence that says what the substrate is, and owning the reprocessing capacity that turns one into the other. A converter that owns only machines will keep bidding for contracts, because that is what it has always done.
Investment Activity
Investment Activity
The industry is not short of capital. It is redirecting it, and the direction changed in 2024. What the large listed players are doing with cash is now more informative than what they say about growth, because the numbers are unambiguous and the strategy language is not.
The numbers as filed
International Paper generated USD 1,678 million of cash from operations and USD 757 million of free cash flow in 2024, and took a USD 395 million pre-tax charge for restructuring and accelerated depreciation, of which USD 334 million related to closing its Georgetown, South Carolina pulp mill. It published an 80/20 operating strategy, cut about 1,000 jobs in the autumn, and went into 2025 saying it would make significant investments in its box plant network.
Amcor reported USD 120 million of research and development expense against USD 15,009 million of net sales — 0.8 per cent — and USD 307 million of restructuring, transaction and integration expense in the year it absorbed Berry. Smurfit Westrock reported USD 1 billion of operating profit and USD 319 million of net income on USD 21.0 billion of sales in its first partial year, with management framing the result explicitly as value over volume. Ball returned USD 1.96 billion to shareholders through buybacks and dividends in 2024.
Set those four data points side by side and the pattern is the signature of a mature industry with surplus capacity: strong cash conversion, weak reinvestment in primary capacity, heavy capital return, and mergers financed in equity rather than debt.
Where the capital is going
- Reprocessing capacity. Food-grade recycled PET and polypropylene, deinking lines, fibre recovery. This is the binding constraint to 2030 and the only substrate investment that is unambiguously growing.
- Converting line upgrades. New seal layers, barrier coating units and higher line speeds, to run mono-material structures on machines that were specified for laminates.
- Box plant networks. International Paper named this explicitly. The logic is freight radius and service reliability rather than volume — the highest-return capex in corrugated is usually a better box plant, not another paper machine.
- Barrier coating. Fibre-based alternatives to aluminium foil, EVOH and the PFAS chemistry that leaves the food-contact market in August 2026.
- Digital printing. Short runs, versioning and e-commerce economics, which convert a fixed-plate cost into a variable one.
Where it is leaving
Greenfield primary capacity in the developed world. Georgetown is the example with a number attached, but the pattern is broader: graphic paper machines not converted, containerboard capacity retired rather than rebuilt, glass furnaces not relined. The industry is not building the tonnage it already has trouble filling.
Why we set investment_trend_direction to rising, and why that is arguable
Aggregate capital expenditure across this market is a reallocation rather than an expansion: rising in converting and reprocessing, falling in primary capacity. If the field means growth capital, the honest reading is flat to declining, and a reader who prefers that reading should treat this as the one structural field in the report where we chose interpretation over arithmetic. We set rising because the destination of capital has moved toward the end of the chain where the margin now sits, and because the three mergers were financed largely in equity, which leaves the sector’s balance sheet capacity intact for the compliance capital cycle that begins in 2026.
What the equity financing means
That last point is the most under-appreciated fact in the sector. Amcor and Berry was an all-stock transaction. International Paper’s offer for DS Smith was structured so that DS Smith holders ended with roughly 34 per cent of the combined company. Smurfit Kappa and WestRock combined in shares. Three multi-billion combinations and the sector’s aggregate leverage has barely moved, which means the industry has deliberately preserved its borrowing capacity for the period when PPWR thresholds, EUDR due diligence and the PFAS exit all arrive together. That is either the most disciplined capital allocation in packaging for thirty years, or it is consolidation that consumed the industry’s appetite for risk at the exact moment it needs to invest.
The M&A pipeline
We expect the deal count to rise through the forecast window and the top-four share to move very little, because the next wave is not mega-mergers. It is the acquisition of regional specialists and reprocessing assets by companies that need compliant material and permitted capacity. Those transactions are small enough to avoid the kind of regulatory condition that cost International Paper five box plants, and they buy the two things that cannot be built quickly: a customer relationship and a permit.
Technology & Innovation
Technology & Innovation
The most important innovation in packaging is not a package. It is a specification that can be defended to a regulator. That is an unfamiliar claim about an industry whose trade press is full of new materials, but the money and the engineering both point at it.
The numbers explain why. Amcor, the second-largest listed converter in the world, reported USD 120 million of research and development expense against USD 15,009 million of net sales in fiscal 2025 — eight-tenths of one per cent. No converter of that scale is going to invent a polymer. The innovation in this market therefore arrives as reformulation, coating and qualification rather than as discovery, and the pace is set by the substrate suppliers and the machinery makers, who are not in this market and whose economics are different.
Front one: the mono-material forced march
Multi-layer laminates are engineering marvels and recycling failures. A structure with PET, aluminium foil and PE bonded together delivers barrier, stiffness, print quality and heat resistance simultaneously, and cannot be separated in any commercial sorting plant. The design-for-recycling condition applying from 1 January 2030 makes that combination structurally difficult to keep.
The replacement is a mono-PE or mono-PP structure with a barrier coating or an EVOH tie layer at a low enough loading to pass sortation. The cost is performance: oxygen transmission, moisture transmission and heat resistance all degrade, and the pack then has to earn back its shelf life somewhere else — in the filling line, the headspace, the recipe or the secondary pack. That is why this transition is slow at the top of the food-safety chain (wet pet food, ready meals, medical) and fast at the bottom (dry goods, household, personal care).
Front two: the PFAS exit
From 12 August 2026 food-contact packaging may not be placed on the EU market if it contains PFAS at or above 25 parts per billion for any individual targeted substance, 250 ppb for the sum of targeted PFAS, or 50 parts per million including polymeric PFAS, with no sell-off period. That removes the incumbent grease-barrier chemistry from moulded fibre, wraps and coated board at a stroke.
The replacement chemistry is dispensable: starch and alginate coatings, silicone, and a set of acrylic and PVOH systems that work but cost more and are less forgiving on a converting line. The harder problem is not the coating, it is the substrate. Recycled fibre carries legacy fluorinated contamination from decades of prior use, and a total-fluorine test on a moulded-fibre tray made from recovered paper will find it. That single fact connects the PFAS rule to the recycled-content mandate and makes them one problem: the more recycled content you use, the harder food-contact compliance becomes.
Front three: fibre where aluminium and plastic used to be
Barrier dispersion coatings, metallised alternatives and the paper bottle are all attempts to move the barrier from a film to a coating so the whole pack can go into the paper stream. The physics caps how far this goes: grease resistance in a hot, humid oven is a different problem from oxygen barrier in a chilled case, and the formats that have replaced plastic most completely are the ones with the weakest barrier requirement. This is why fibre substitution is fastest in e-commerce secondary packaging, dry food and produce trays, and slowest in beverages and ready meals.
Front four: the machine, not the pack
The largest single lever on material consumption is not a substrate substitution at all. It is the filling line. Higher-speed form-fill-seal, blow-fill-seal for unit dose, in-line inspection that lets a wall thickness come down by a tenth of a millimetre, and digital printing that removes the plate change and the minimum order quantity. Each of those reduces material per unit sold, which is the one mechanism that reliably destroys tonnage while raising value.
Front five: the package as a data carrier
From 12 August 2028, or 24 months after the relevant implementing act, packaging must carry a harmonised label on material composition. From 12 February 2029, reusable packaging must carry a reusable label and provide further information by QR code or standardised open digital data carrier. Add digital watermarking for sortation and the direction is clear: the package is becoming the document that proves what it is made of.
This is where the converter’s margin actually moves. A converter that can generate, hold and warrant that data across every SKU and every customer becomes difficult to replace for a reason that has nothing to do with the price of board. A converter that cannot is selling a box.
The three innovation fields, scored honestly
innovation_intensity_level: moderate. The 0.8 per cent R&D ratio is the quantitative case, and the qualitative case is that the reformulation work is substantial but derivative.
patent_activity_level: low — and this is inferred, not sourced. No patent dataset sits behind this report and we do not cite one. The value is set from the structure of the industry: barriers here are qualification, permit, substrate access and customer relationship, none of which is protected by a patent, and the largest listed converter spends less than one per cent of sales on the activity that produces them. A reader who holds patent data for this sector should overrule us.
technology_maturity_stage: mature. The core processes — corrugating, film extrusion, injection, blow moulding, can forming — are decades old and incrementally improved. What is new is compliance instrumentation, not manufacturing physics.
Market Risk
Market Risk
The largest risk to this forecast is not demand. It is the assumption that compliant recycled material arrives on schedule. Packaging demand is tied to fast-moving consumer goods, which is the most defensive demand base in the industrial economy. The forecast can be wrong by two percentage points on volume and still describe the same industry. It cannot survive a compliance shock, and that is where the risk sits.
| Risk | Severity | The early signal |
|---|---|---|
| Food-grade recycled substrate shortfall against the 2030 thresholds | High | Recyclate premiums over virgin widening through 2027–2028; converters buying reprocessing assets |
| Substitution and avoidance removing the pack rather than changing it | High | Concentrate and tablet formats gaining shelf space in categories that were liquid |
| Substrate price volatility | High | Recovered fibre and resin spreads moving more than 20 per cent inside a year |
| Integration execution across three simultaneous mergers | Moderate | Synergy guidance trimmed at a results announcement |
| Trade and tariff exposure on aluminium, steel and converted goods | Moderate | Section 232 and reciprocal tariff changes reaching can sheet or machinery |
| Regulatory divergence in national EPR implementation | Moderate | Twenty-seven fee schedules with no common modulation basis |
One: the recycled-content shortfall is the binding one
A 35 per cent recycled-content requirement for other plastic packaging from 1 January 2030 is a demand-side mandate imposed on a supply chain that does not yet exist at that scale for food-grade material. Food-contact recyclate requires collection, sortation, washing and a decontamination step, and the permitted capacity for that is concentrated, slow to permit and expensive to build. If the recyclate does not arrive, three things happen in sequence: prices spike, compliance is bought by those who can afford it, and the shortfall becomes a competitive moat rather than a market failure. Two of those three are good for the incumbents and bad for the forecast’s volume assumption.
Two: the competitor that removes the pack
Every analysis of this market assumes the package changes material. The larger risk is that it stops existing. Concentrated refills, solid formats, shampoo bars, tablet detergents and the Annex V restrictions on unnecessary formats all remove a unit rather than convert it. This is where substitution risk is genuinely high rather than rhetorical: a refill pouch is a packaging win, a concentrated tablet is a packaging loss, and both are sold to the consumer as the same environmental gesture.
Three: substrate volatility is structural, not cyclical
Recovered fibre and resin are both priced by forces outside this market. Recovered fibre is set by collection volumes, export policy and the operating rates of the mills that compete for the bale; resin is set by the petrochemical cycle. A converter with no substrate position absorbs both. That is why the integration argument in the value chain chapter is a risk argument too: vertical integration is expensive insurance, and the industry has just paid for a great deal of it.
Four: three integrations at once
Smurfit Westrock, International Paper and Amcor are each absorbing a company of significant size inside the same window in which the compliance calendar begins. The claimed synergies — at least USD 514 million and USD 650 million respectively — are overhead and network savings, and those are the synergies most likely to be delivered and least likely to improve the customer offer. The risk is not that the savings fail. It is that management attention is consumed by integration while the specification changes underneath them.
Five: geopolitical exposure
Aluminium and steel are the two packaging inputs most directly exposed to tariff regimes, and can sheet crosses borders more than once before it becomes a can. Shipping routes matter more to this industry than to most, because empty packaging is cheap and bulky, so freight is a large share of delivered cost and a Red Sea diversion shows up in a converter’s margin within a quarter. We set geopolitical exposure high for those reasons, and because fibre adds a third channel: EUDR makes the origin of wood a compliance question, which turns a supply chain into a documentation chain.
Why the overall risk level is moderate
Against all of that, the demand base is defensive: food, beverage, pharmaceutical and household consumables do not defer purchases in a downturn the way construction does. The market is so fragmented that no single company’s failure is systemic. And the regulation that creates the compliance risk also creates the pricing power that offsets it, because a specification that is hard to meet is a barrier to entry by another name. We set overall market risk moderate and geopolitical exposure high, and we would defend both.
Regulatory Landscape
Regulatory Landscape
Europe replaced a directive with a regulation, and the difference is not semantic. Directive 94/62/EC gave twenty-seven member states room to interpret, which is how plastic packaging recycling reached 71.0 per cent in Latvia and 22.5 per cent in Denmark under the same law. Regulation (EU) 2025/40 is directly applicable. It removes the interpretation and leaves the enforcement.
The compliance calendar
| Date | What applies | Who it costs |
|---|---|---|
| 11 February 2025 | In force; replaces Directive 94/62/EC with transitional provisions | Nobody yet |
| 12 August 2026 | Generally applicable. PFAS limits in food-contact packaging at 25 ppb individual, 250 ppb sum of targeted PFAS and 50 ppm including polymeric, with no sell-off. All packaging must be recyclable. HORECA distributors must allow consumers to bring their own containers | Coated-board and moulded-fibre converters first |
| 12 August 2028 | Harmonised label on material composition, or 24 months after the implementing act, whichever is later | Every SKU, every artwork |
| 12 February 2029 | Reusable packaging labelled, with further information by QR or open digital data carrier | Reuse operators and their customers |
| 1 January 2030 | Design-for-recycling condition, packaging minimisation against Annex IV, recycled-content thresholds, 50 per cent maximum empty space for grouped, transport and e-commerce packaging, Annex V format restrictions | Everyone, and resin converters worst |
The recycled-content thresholds deserve spelling out because they are the most capital-shifting requirement in the package: 30 per cent for PET contact-sensitive packaging excluding beverage bottles, 10 per cent for other contact-sensitive packaging, 30 per cent for single-use plastic beverage bottles and 35 per cent for other plastic packaging, from 1 January 2030 or three years after the implementing act, whichever is later. The 35 per cent general figure is the binding one for the industry, because it applies to the largest volume of material and to the formats where food-grade recyclate is scarcest.
EUDR, which the packaging industry under-discusses
The EU Deforestation Regulation has been in force since 29 June 2023 and covers wood and products made from it, which means fibre packaging is in scope. Application for large and medium-sized operators and traders is 30 December 2026; micro and small enterprises 30 June 2027; newly added products 30 December 2027. The obligation is due diligence with geolocation of the plot of harvest and a digital statement, plus country risk benchmarking.
For a fibre converter this is a chain-of-custody obligation layered on top of the certification schemes it already uses, and it arrives five months after PPWR applies. The two together are the reason we expect consolidation among small converters in 2026 and 2027: not because either rule is impossible to meet, but because both require a compliance function that a single-plant business cannot staff.
EPR fees: the mechanism that actually changes design
National extended producer responsibility schemes charge the brand owner per tonne by material and are increasingly eco-modulated, so that a hard-to-recycle format pays more than a recyclable one. This is the only regulatory instrument in the package that operates continuously rather than at a deadline, and it is the only one that transmits a cost signal to the design desk in a currency the brand owner recognises. Where the fee differential exceeds the cost difference between two specifications, the specification moves. That is faster than any delegated act.
The metal and glass end
CBAM’s definitive phase begins on 1 January 2026 and reaches aluminium and steel, which are the two inputs that matter most to can makers and their customers. Deposit return systems, mandated or permitted under the packaging rules, are the countervailing force for both materials: a can or a bottle collected at 85 per cent is a can or a bottle with a cheap, high-quality feedstock. The metal and glass question in this decade is not whether the material is recyclable, because it is; it is whether the collection infrastructure is universal enough to make the recycled input cheaper than the virgin one.
Where the regulation is silent, and why that is the real risk
Several of the most consequential obligations depend on delegated and implementing acts that define, at grade level, what counts as recyclable and how the thresholds are measured. Until those are adopted, a converter is being asked to invest in 2030 compliance against a specification it cannot read. The dates are fixed. The definitions are not. That gap — not the stringency of the rule — is what makes capital allocation difficult in this industry between now and 2028.
The asymmetry that matters for the forecast
PPWR is a design regulation. It constrains what the tonne is made of, not how many tonnes exist. Its first-order effect is therefore on unit value and mix — on the 58 per cent of growth that comes from price and composition rather than material. A converter that reads this regulation as a volume threat will cut capacity into a market that did not reduce its demand. A converter that reads it as a specification change will invest in the two things that become scarce: compliant substrate and the evidence that it is compliant.