
Global Cement Packaging Market Report, Size, Share and Forecast 2026–2033: 28.9 Billion Bags, and the Silo That Ends Them
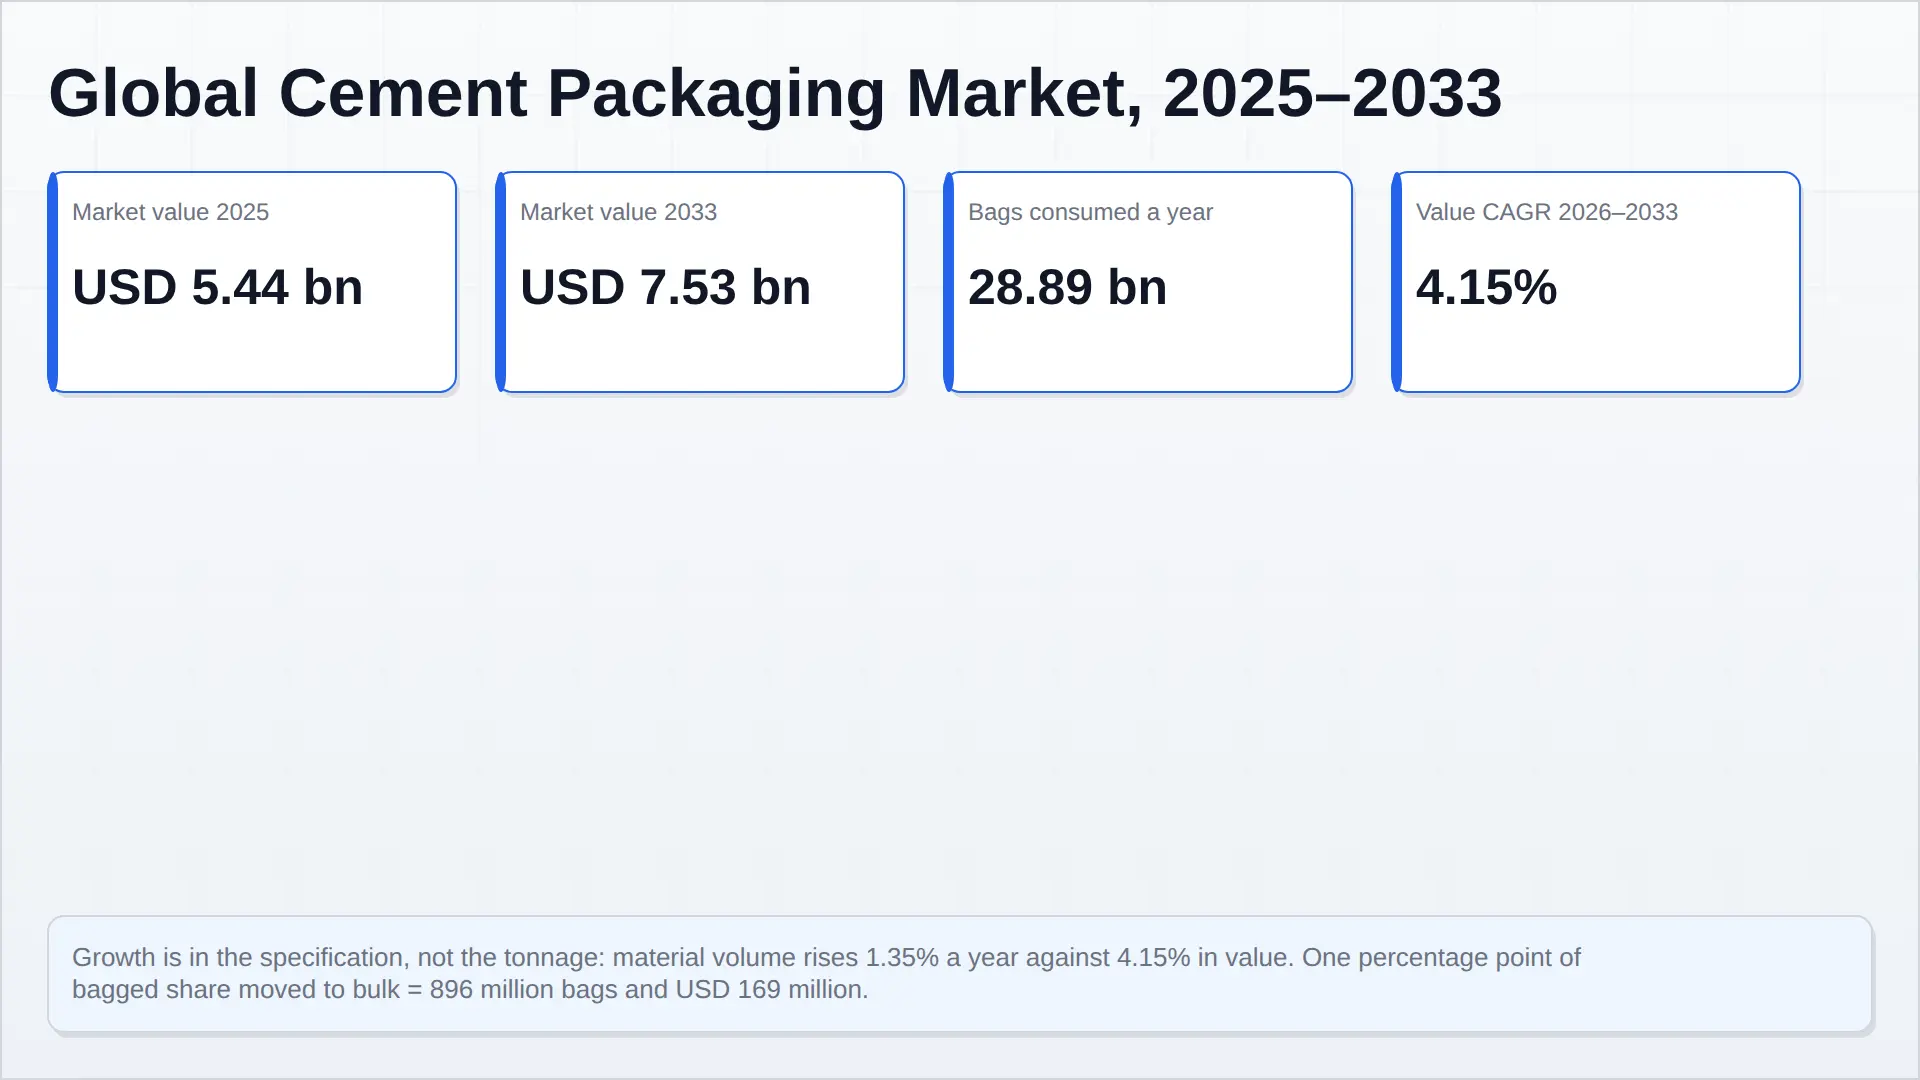
Cement packaging is a USD 5,442 million market in 2025 that is being slowly consumed by the material it carries. Of the 4.0 billion tonnes of cement the world produced in 2024, about 1,300 Mt left the plant in a bag — 32.2 per cent of it — and at a blended 45 kilograms a bag that is 28.89 billion bags, 3,310 thousand tonnes of paper and polypropylene, and USD 5,442 million of converter revenue reaching USD 7,531 million by 2033 at a 4.15 per cent value CAGR.
Volume does not follow value, and the gap is the finding. Bagged tonnage grows 1.11 per cent a year, bag count 1.54 per cent and packaging material only 1.35 per cent, because bags are getting smaller (45 kilograms to 43.5) and lighter (down-gauging costs the material chain about 0.2 points a year). Growth in this market is in the specification — barrier, print, block-bottom filling, traceability — not in the tonnage, and a supplier whose volume is measured in tonnes is structurally exposed to that.
Three numbers fix the economics. It takes 20 bags of 50 kilograms to move a tonne of cement; at USD 0.188 a bag that is USD 3.77 of packaging per tonne; against a mill-gate cement price near USD 90 a tonne, packaging is 4.19 per cent of what the product sells for. A four-dollar item, and the only surface on which a cement brand is visible at the point of sale in the markets where the bag still exists.
The market's real competitor is not another bag. Bulk now takes 20–25 per cent of Indian consumption, up from almost nothing twenty years ago, and 70–75 per cent of US cement never sees a bag at all. One percentage point of global bagged share is 40.34 Mt of cement, 896 million bags and USD 169 million — 3.1 per cent of the entire market — and it is not under the industry's control. Set against that, the material fight between paper and polypropylene is genuine but secondary: woven sacks take 70 per cent of units and 48 per cent of value at USD 0.13, paper takes 24 per cent of units and 38 per cent of value at USD 0.30, and paper earns 1.6 times the value per unit. India's 2026 polypropylene squeeze, which took a cement bag from ₹6–7 to ₹11–12 in two months, is the first time in a decade that comparison has been live.
1. Market Snapshot
Four billion tonnes of cement were produced in 2024, and roughly a third of it left the plant inside a bag. The USGS puts global output at 4.0 billion tonnes, down 2.4 per cent from 4.1 billion in 2023 and the first year below four billion since 2012, with China at 1,900 Mt — 47.5 per cent of the world and, for the first time since 2008, less than half of it — and India at 450 Mt, up 7.1 per cent (Global Cement Top 100 2026, compiling USGS Mineral Commodity Summaries 2025; USGS cement chapter). Cement Europe's own statistics put 2024 at approximately 3.89 billion tonnes, also below four billion for the first time since 2012, and confirm China at 47 per cent of world output (Cement Europe Statistics Report 2025). That tonnage is the top of this market's funnel. Everything below it is a share of it.
| Metric | 2025 | 2033 | CAGR 2026–2033 |
|---|---|---|---|
| Global cement production | 4,034 Mt | 4,560 Mt | 1.55% |
| Cement sold in bags, sacks or small bulk containers | 1,300 Mt (32.2%) | 1,420 Mt (31.1%) | 1.11% |
| Bags consumed | 28.89 billion | 32.64 billion | 1.54% |
| Packaging material consumed (paper and polypropylene) | 3,310 kt | 3,685 kt | 1.35% |
| Market value, ex-converter | USD 5,442 m | USD 7,531 m | 4.15% |
| Average realised price per bag | USD 0.188 | USD 0.231 | 2.57% |
Pheonix sizes the cement packaging market at USD 5,442 million in 2025, reaching USD 7,531 million by 2033, a 4.15 per cent value CAGR. Volume does not follow. Material consumption grows 1.35 per cent a year and the tonnage being wrapped grows 1.11 per cent. The gap is the entire argument of this report: this is not a market where demand for bags is expanding. It is a market where the bag is being asked to do more work per gramme, in fewer units of a smaller size, while the material inside it is migrating to silos in the fastest-growing economies.
Three numbers make the economics visible. It takes 20 bags of 50 kilograms to move a tonne of cement, a ratio Indian cement producers use directly when computing packaging cost. At a blended USD 0.188 a bag, that is USD 3.77 of packaging per tonne. Against a mill-gate cement price in the region of USD 90 a tonne, packaging is 4.19 per cent of what the product sells for. Nothing in the cost structure of cement is smaller and more visible at the same time — which is why a bag shortage in India in early 2026 could move a cement producer's share price, and why a four-dollar item is the subject of this report.
2. Market Definition and the Four Boundary Calls
What is measured. Sacks, bags and small bulk containers filled with hydraulic binder at the cement plant gate, in four format families: sewn open-mouth paper sacks (the three-ply and two-ply workhorse of Africa, the Middle East and parts of Europe); pasted and block-bottom valve paper sacks, which fill and palletise faster and carry a price premium; sewn and laminated woven polypropylene sacks, which carry the vast majority of Indian and South Asian cement; and one- to two-tonne flexible intermediate bulk containers, which substitute for a sack rather than for a tanker. Value is ex-converter — the price a bag plant charges the cement company — because that is where the transaction this market consists of actually happens.
What is excluded, and why each exclusion is a boundary rather than an omission. First, the 25-tonne bulk tanker and the silo are not packaging, and they are this market's principal competitor: every tonne they take is a tonne of bag demand that never exists. Treating bulk as an adjacent market would flatter the forecast and hide the mechanism. Second, dry-mix mortar, gypsum, lime and tile adhesive sacks are not included, although they run on the same machines and often the same plants; they are a separate derived demand with a different growth rate, and their inclusion would inflate the base by roughly the size of the construction chemicals market. Third, FIBCs are included only where they displace sacks. A 25-tonne bulk container is a transport mode, not a package, and the moment a cement producer switches to it the bag market loses the sale outright rather than sharing it. Fourth, freight from the bag plant to the cement packing station is excluded from value but discussed in the value chain, because bags are mostly air by volume and freight is therefore a first-order determinant of where bag plants are built.
The substitutability call. Within the market, competition between paper and polypropylene is a fight over specification and cost. Between this market and bulk, the contest is existential. That asymmetry is why the competitive intensity of the bag industry can be high while the market's structural risk is set by something its participants do not compete with at all — and why substitution risk is scored high while no single converter can do much about it.
3. Market Size and Forecast
3.1 How the 2025 Base Was Built
No purchased market-size figure sits underneath this report. The base is built upward from the USGS cement total, using a regional allocation and bagged shares that Pheonix states openly so a reader can replace them with better ones and re-run the arithmetic.
| Region | Cement 2025 (Mt) | Sold in bags (%) | Bagged (Mt) |
|---|---|---|---|
| China | 1,880 | 5 | 94.0 |
| India | 470 | 78 | 366.6 |
| Rest of Asia-Pacific | 530 | 55 | 291.5 |
| Middle East, Türkiye and CIS | 394 | 45 | 177.3 |
| Africa | 250 | 80 | 200.0 |
| Latin America | 210 | 55 | 115.5 |
| Europe | 190 | 25 | 47.5 |
| North America | 110 | 7 | 7.7 |
| Total | 4,034 | 32.2 | 1,300.1 |
The bagged shares are not uniform guesses: they are anchored where evidence exists and modelled where it does not. India's 75–80 per cent bagged share in 50-kilogram bags, with bulk at 20–25 per cent and rising from almost nothing 20 years ago, is published (World Economic Forum, citing Concrete Action for Climate and BCG; the Cement Manufacturers' Association puts it above 80 per cent with bulk growing at 15–20 per cent a year between 2014–15 and 2019–20, CMA India). Nigeria's 90 per cent bagged share is a published field study (CemNet, citing the Canadian Center of Science and Education). North America's 7 per cent is read the other way round, from USGS reporting that 70–75 per cent of US cement sales go to ready-mixed concrete producers, who take it in bulk. China's 5 per cent is a Pheonix estimate for a market that has been converted to bulk for two decades but retains a retail and repair bag trade. The Rest of Asia-Pacific figure of 55 per cent is the blend of two very different places — Bangladesh, Pakistan and Vietnam, where bags are dominant, and Japan, South Korea and Australia, where they are marginal — and is the single weakest coefficient in the table.
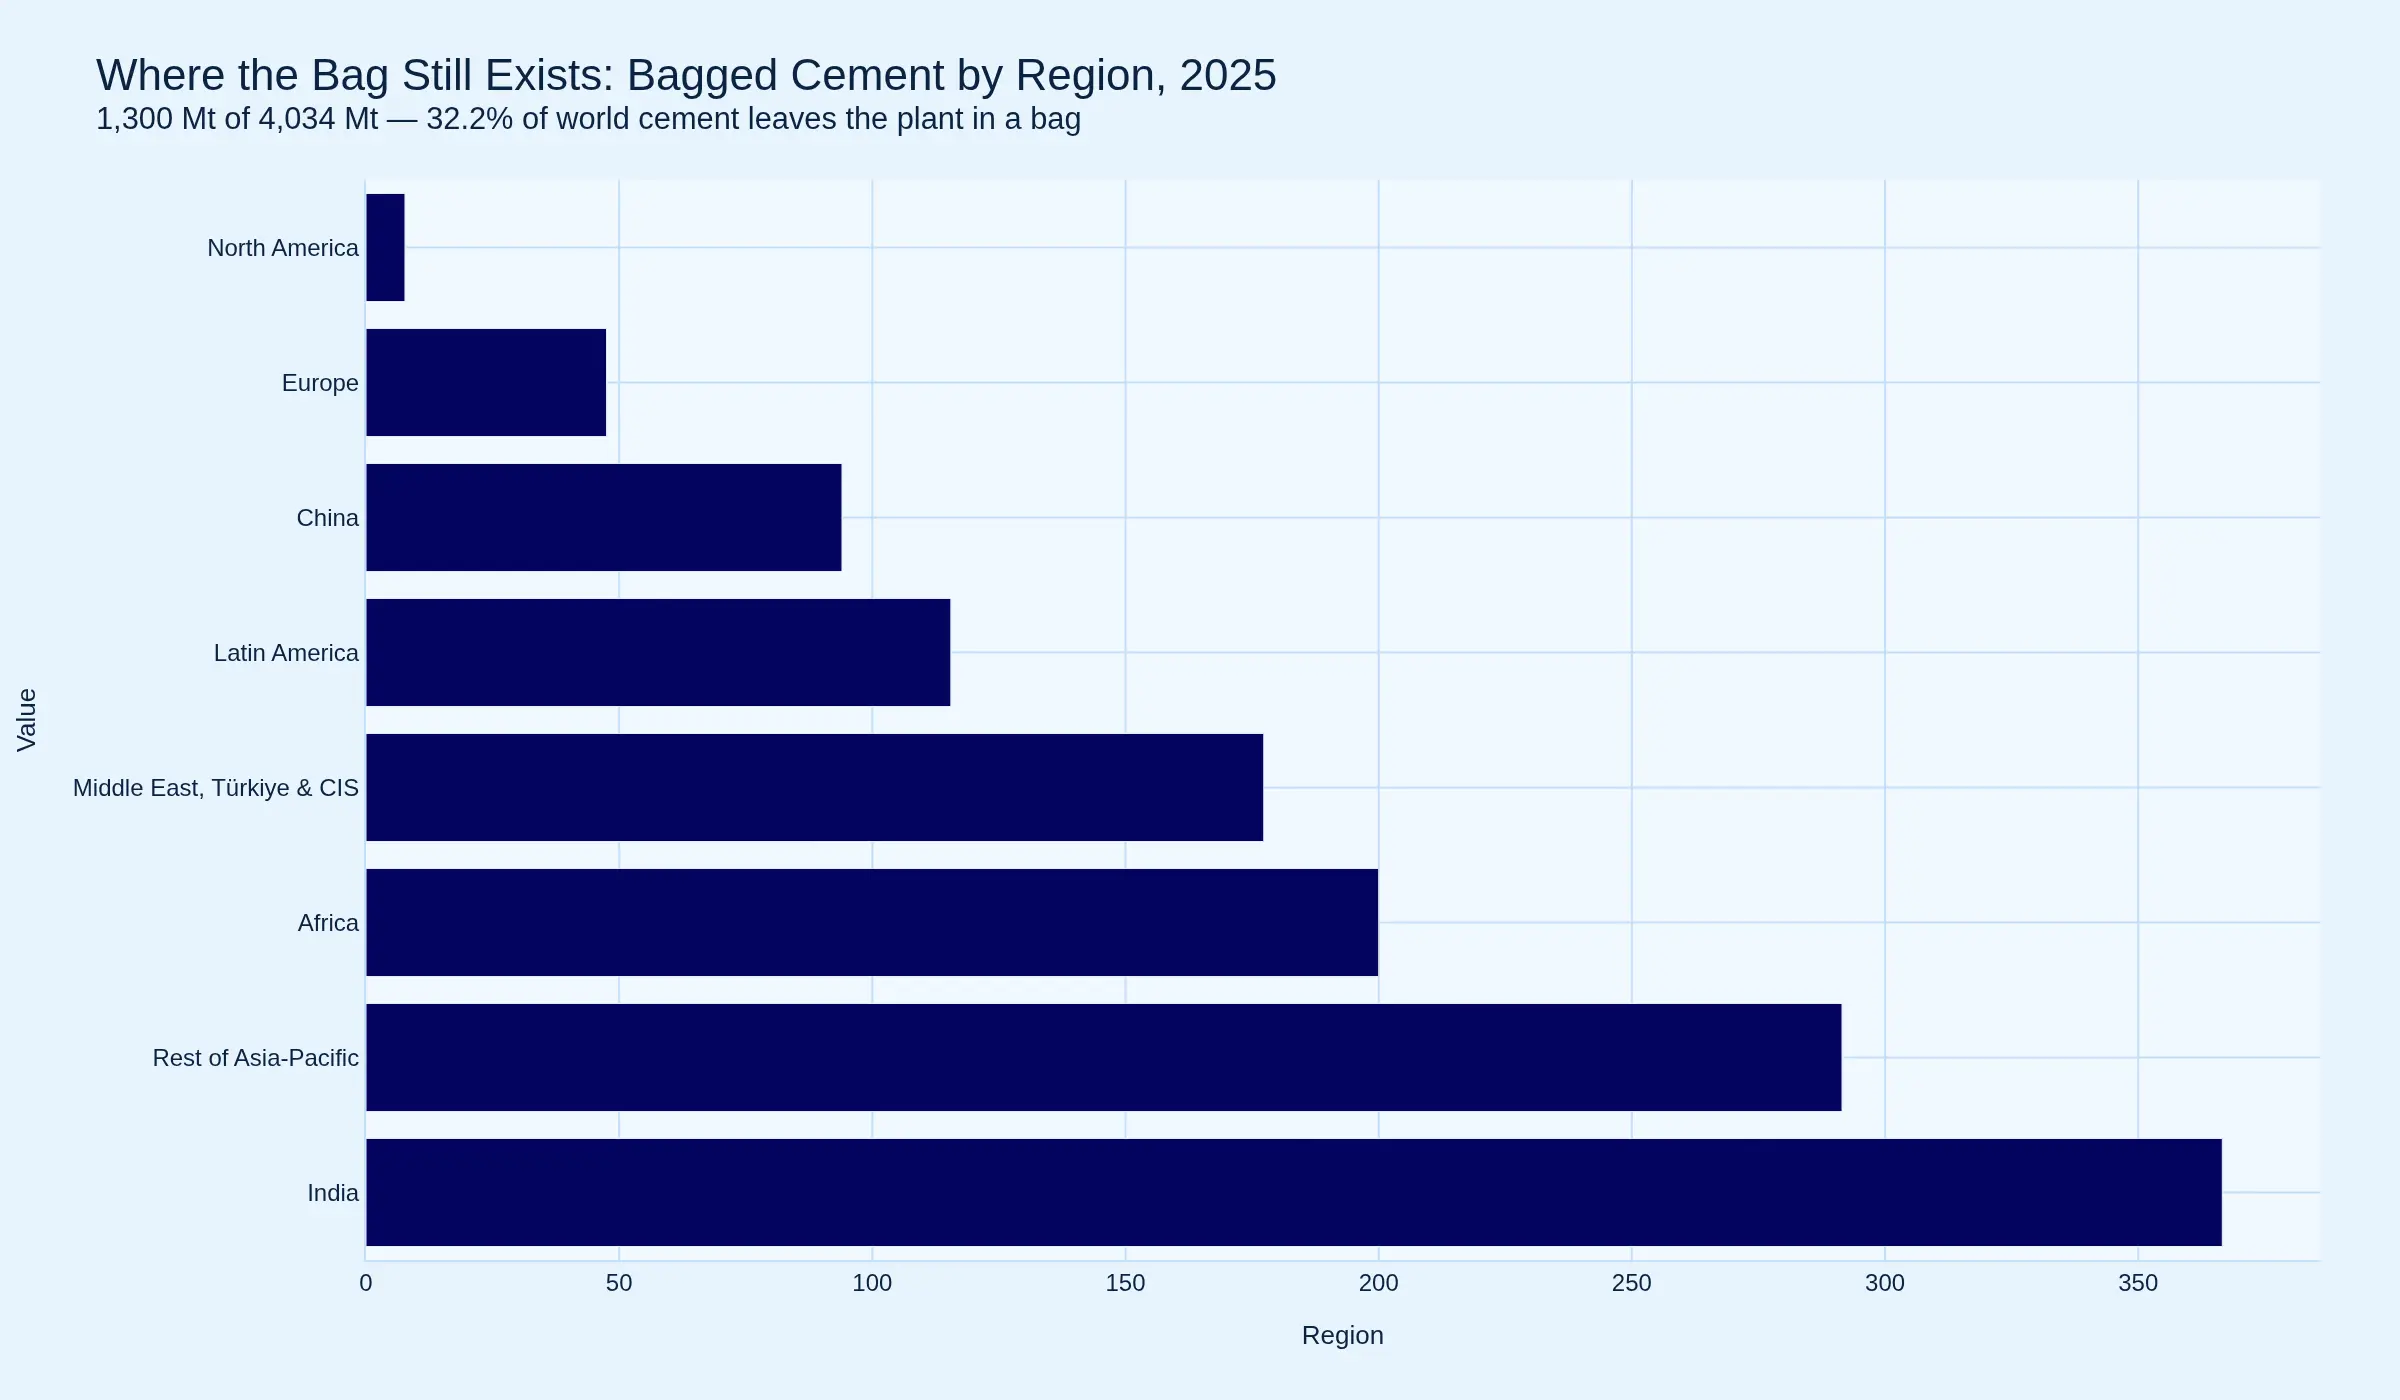
Two cross-checks hold the base together. India's 366.6 Mt of bagged cement at 50 kilograms is 7.33 billion bags, 25.4 per cent of the world's bags from 11.6 per cent of its cement: the arithmetic of a bag-heavy market and an independent confirmation that the regional allocation is not distributing tonnage arbitrarily. And the value side validates against a disclosed price: an Indian woven cement bag cost ₹6–7 until early 2026 and ₹11–12 after the polypropylene squeeze — USD 0.135 at ₹85 to the dollar on the higher figure — which sits inside the USD 0.13 woven price used in this model.
3.2 The Regional Allocation Is the Forecast
Global cement grows 1.55 per cent a year to 2033 in this model, and the bagged share falls from 32.2 per cent to 31.1 per cent. Both moves are slow and both are contested by the data, which is why the forecast is a stated position rather than a consensus. Chinese output is assumed to keep declining, and Chinese bag demand with it, because the Chinese construction market that produced 2.4 billion tonnes at its peak is not coming back. Indian output is assumed to keep compounding at close to its recent rate, which is what makes India the marginal buyer of cement bags for the next decade even as its bagged share erodes. Africa is assumed to grow fastest in percentage terms from the smallest base, and to stay at four in five tonnes bagged, because there is no bulk distribution infrastructure to switch to. If those three assumptions are roughly right, the bagged tonnage is flat to slightly up and the market's value growth has to come from somewhere other than volume — which is where the next section goes.
3.3 The Decomposition Is the Finding
Value growth of 4.15 per cent decomposes into units and realisation. Bag count grows 1.54 per cent a year, from 28.89 billion to 32.64 billion, faster than bagged tonnage because the average bag is getting smaller: 45 kilograms in 2025, 43.5 kilograms in 2033, as 25-kilogram retail packs take share in Europe and in premium Asian retail. Realised price per bag grows 2.57 per cent a year, from USD 0.188 to USD 0.231, carrying both input-cost pass-through and a mix shift toward block-bottom and barrier-sealed formats.
Material consumption grows slowest of all, 1.35 per cent, below the 1.54 per cent unit growth. That is down-gauging: the same bag, or a smaller one, made from less fibre and less polymer per unit. A market can therefore report unit growth, tonnage growth and material growth that differ by a fifth of a percentage point each and mean three different things. The commercial conclusion is the one a converter would reach first: the growth in this market is in the specification, not in the tonnage, and a supplier whose volume is measured in tonnes is structurally exposed to a market whose value is migrating into grades, print, barrier and data.
4. Four Structural Shifts Defining 2026–2033
4.1 Bulk Is the Competitor, and It Is Winning Slowly
The single largest variable in this market is not a packaging question. Bulk cement now takes 20–25 per cent of Indian consumption, having been close to zero twenty years ago, and bulk movement grew at 15–20 per cent a year over the five years to 2019–20 while total cement grew far more slowly (CMA India). In the United States, 70–75 per cent of cement already goes to ready-mix producers in bulk, which is why the world's largest construction market is nearly irrelevant to this report. The mechanism is unglamorous and one-directional: a bulk tanker eliminates bagging and de-bagging labour, eliminates seepage and pilferage, removes the moisture risk, and raises the effective shelf life. Bulk wins wherever projects are large enough to take a silo, and loses wherever a self-builder needs 5 bags on a Saturday.
What makes the shift slow rather than fast is that the buyer is not one buyer. In India, housing takes roughly 65 per cent of cement and individual house builders buy in small lots with no storage and no security — conditions that favour the bag, and conditions that formalisation erodes only gradually. The forecast's 1.1 percentage point decline in bagged share over eight years is therefore a bet that formalisation continues at the pace of the last decade, not at the pace of the last three years. It is the assumption most likely to be wrong in either direction, and it is quantified in the Market Risk chapter at USD 169 million of market value per percentage point.
4.2 The Paper and Polypropylene Comparison Went Live
For twenty years the material fight was settled by arithmetic. A woven polypropylene sack was cheaper than a multiwall paper sack in every bag-heavy market, so paper held Europe and the premium end and polypropylene took everything else. In the first quarter of 2026 that arithmetic was briefly interrupted. Indian converters, receiving only 60–70 per cent of their contracted polypropylene chip volumes as Gulf refiners diverted propane and butane to LPG, saw raw material costs rise nearly 70 per cent in two months; the cost of a single cement bag went from ₹6–7 to ₹11–12, adding ₹60–80 to the cost of a tonne of cement at 20 bags a tonne, and producers reported packaging cost impacts of ₹80–100 a tonne (Mint).
The important thing about that episode is not the price spike. It is that it is the first time in a decade the paper-versus-polypropylene comparison has been genuinely live in India, and it exposed how thin the evidence is on either side. Kraft paper is priced in dollars and euros and imported into India; a resin shock does not make paper cheaper in absolute terms, it narrows the gap and makes the total cost of ownership argument — dust, leakage, palletisation, print, recyclability — worth having. Whether that converts into share is an open question this report does not resolve. What it does establish is that a market whose material choice is decided by a 5–6 rupee spread per bag is a market whose structure can be changed by a feedstock diversion 2,000 miles away.
4.3 The Bag Became a Data Carrier
In bagged markets the bag is the only place where a cement brand is visible at the point of sale, which is why print quality and six-colour flexographic capability are specification items rather than decoration. Two things are being added to that surface now. The first is traceability: batch, plant and date coding, and increasingly a QR code that carries them, because bagged cement is counterfeited at scale in South Asia and the Middle East and the bag is the only available enforcement point. The second is emissions documentation. The EU's Carbon Border Adjustment Mechanism entered its definitive regime on 1 January 2026, and while packaging sits outside CBAM's product boundary — the charge falls on the cement, not the sack — a consignment's embedded emissions have to be asserted per shipment, and for a bagged consignment the bag is where that assertion physically lives.
4.4 Down-Gauging Is a Silent Volume Tax
The bag has been getting lighter for thirty years: three plies to two where strength allows, 80 gsm to 70 gsm, higher-performance extensible kraft doing more work per gramme, woven fabric down-gauged with better tape and stabiliser technology. Each step is a small engineering gain and a small permanent loss of volume to the material supply chain. Across the market it is worth roughly 0.2 percentage points a year of material consumption, which is the difference between the 1.54 per cent unit growth and the 1.35 per cent material growth in section 3.3. Nobody markets down-gauging as a demand destroyer, and it is never the reason a mill closes. It is nonetheless the reason this market's tonnage grows more slowly than its unit count in every year of the forecast.
5. Market Drivers
5.1 Construction Formalisation, Which Cuts Both Ways
Cement demand grows with GDP at roughly 1.2–1.3 times in developing markets, and bag demand grows with the part of that demand that reaches small buyers. The same formalisation that grows total cement — ready-mix concrete, large contractors, smart silos of up to 8,000 tonnes capacity, large infrastructure programmes — is precisely what converts bagged tonnes into bulk tonnes. This is the central tension of the market and it has no resolution: the driver and the restraint are the same variable.
5.2 Moisture, Shelf Life and Tropical Storage
Bagged cement is hygroscopic and loses specification when it takes up water. In markets where a retailer's stock sits in an unairconditioned godown through a monsoon, the barrier property of the bag is a product-quality feature, not a packaging preference. This is what sustains the multiwall paper sack with a polymer dispersion or polyethylene barrier, and what keeps laminated woven constructions — woven fabric plus a coated or laminated layer — in the specification in South Asia. It is also the reason the cheapest possible sack is rarely the one specified.
5.3 The Brand Surface
In a commodity where the product is chemically identical between producers, the bag carries the entire brand. Print coverage, colour consistency and the physical squareness of a palletised stack are sales arguments in a way that would be unintelligible in a bulk market. This is a demand driver for quality, not for volume — which is exactly the shape of growth this report forecasts.
5.4 Packing-Station Automation
Bagging lines are being upgraded for labour cost and dust control, and block-bottom valve sacks run faster and cleaner on automated fillers than sewn open-mouth sacks. Every conversion of a packing line to block-bottom is a mix upgrade of roughly half again on the price of a bag, and it is happening steadily in the Middle East, North Africa and parts of Asia. It is the largest single source of the 2.57 per cent price/mix growth in the forecast.
5.5 Recyclability Compliance
The EU Packaging and Packaging Waste Regulation (EU) 2025/40 requires all packaging to be recyclable, introduces recyclability performance grades from 2030, requires recycling at scale from 2035, and modulates extended producer responsibility fees to reward design for recycling (EUR-Lex summary of Regulation (EU) 2025/40). For cement sacks the practical effect is a slow move away from polyethylene-laminated woven constructions and toward mono-material paper, dispersion-coated paper, and woven constructions that a recycler will actually accept. Compliance is a driver of value per bag and a restraint on polypropylene volume.
6. Market Restraints
6.1 Bulk Substitution
Treated in 4.1 and quantified in the Market Risk chapter. One percentage point of global bagged share is 40.34 Mt of cement, 896 million bags and USD 169 million of market value — 3.1 per cent of the entire market. Bulk substitution is the only variable in this report capable of moving the market by whole percentage points in a single year, and it is not under the industry's control.
6.2 Resin Volatility
Polypropylene is a globally traded commodity and cement bags are a low-margin, price-taker application for it. Resin passes through converter margins within one or two contract cycles, and the 2026 Indian episode showed how fast: 60–70 per cent of contracted chip volumes delivered, raw material up nearly 70 per cent in two months, bag prices up 70–90 per cent at the top of the range. A converter who has quoted a fixed bag price for a year absorbs that or defaults on it.
6.3 Kraft Paper Concentration
Sack kraft is made on a small number of machines owned by a small number of companies, and it is not capacity that can be switched on quickly. When Mondi's Stambolijski mill in Bulgaria burned in September 2024 and was then permanently closed, 100,000 tonnes a year of sack kraft left the European market and 300 jobs went with it; Mondi served customers from Štětí in the Czech Republic, Frantschach in Austria and Dynäs in Sweden instead (EUWID Pulp and Paper). Three mills absorbing a fourth's volume is a supply chain with no slack, and every buyer in Europe knows it.
6.4 Freight and Regionality
A 50-kilogram cement bag weighs 100–150 grammes and occupies 60–70 litres. Shipping empty bags is shipping air, which caps the economic radius of a bag plant at a few hundred kilometres for commodity grades and pushes converters to build next to their customers rather than next to their fibre. That is why the industry's merger logic is customer-following rather than scale-seeking, and why a kraft mill and a bag plant are rarely in the same country.
7. Segmentation
7.1 By Format
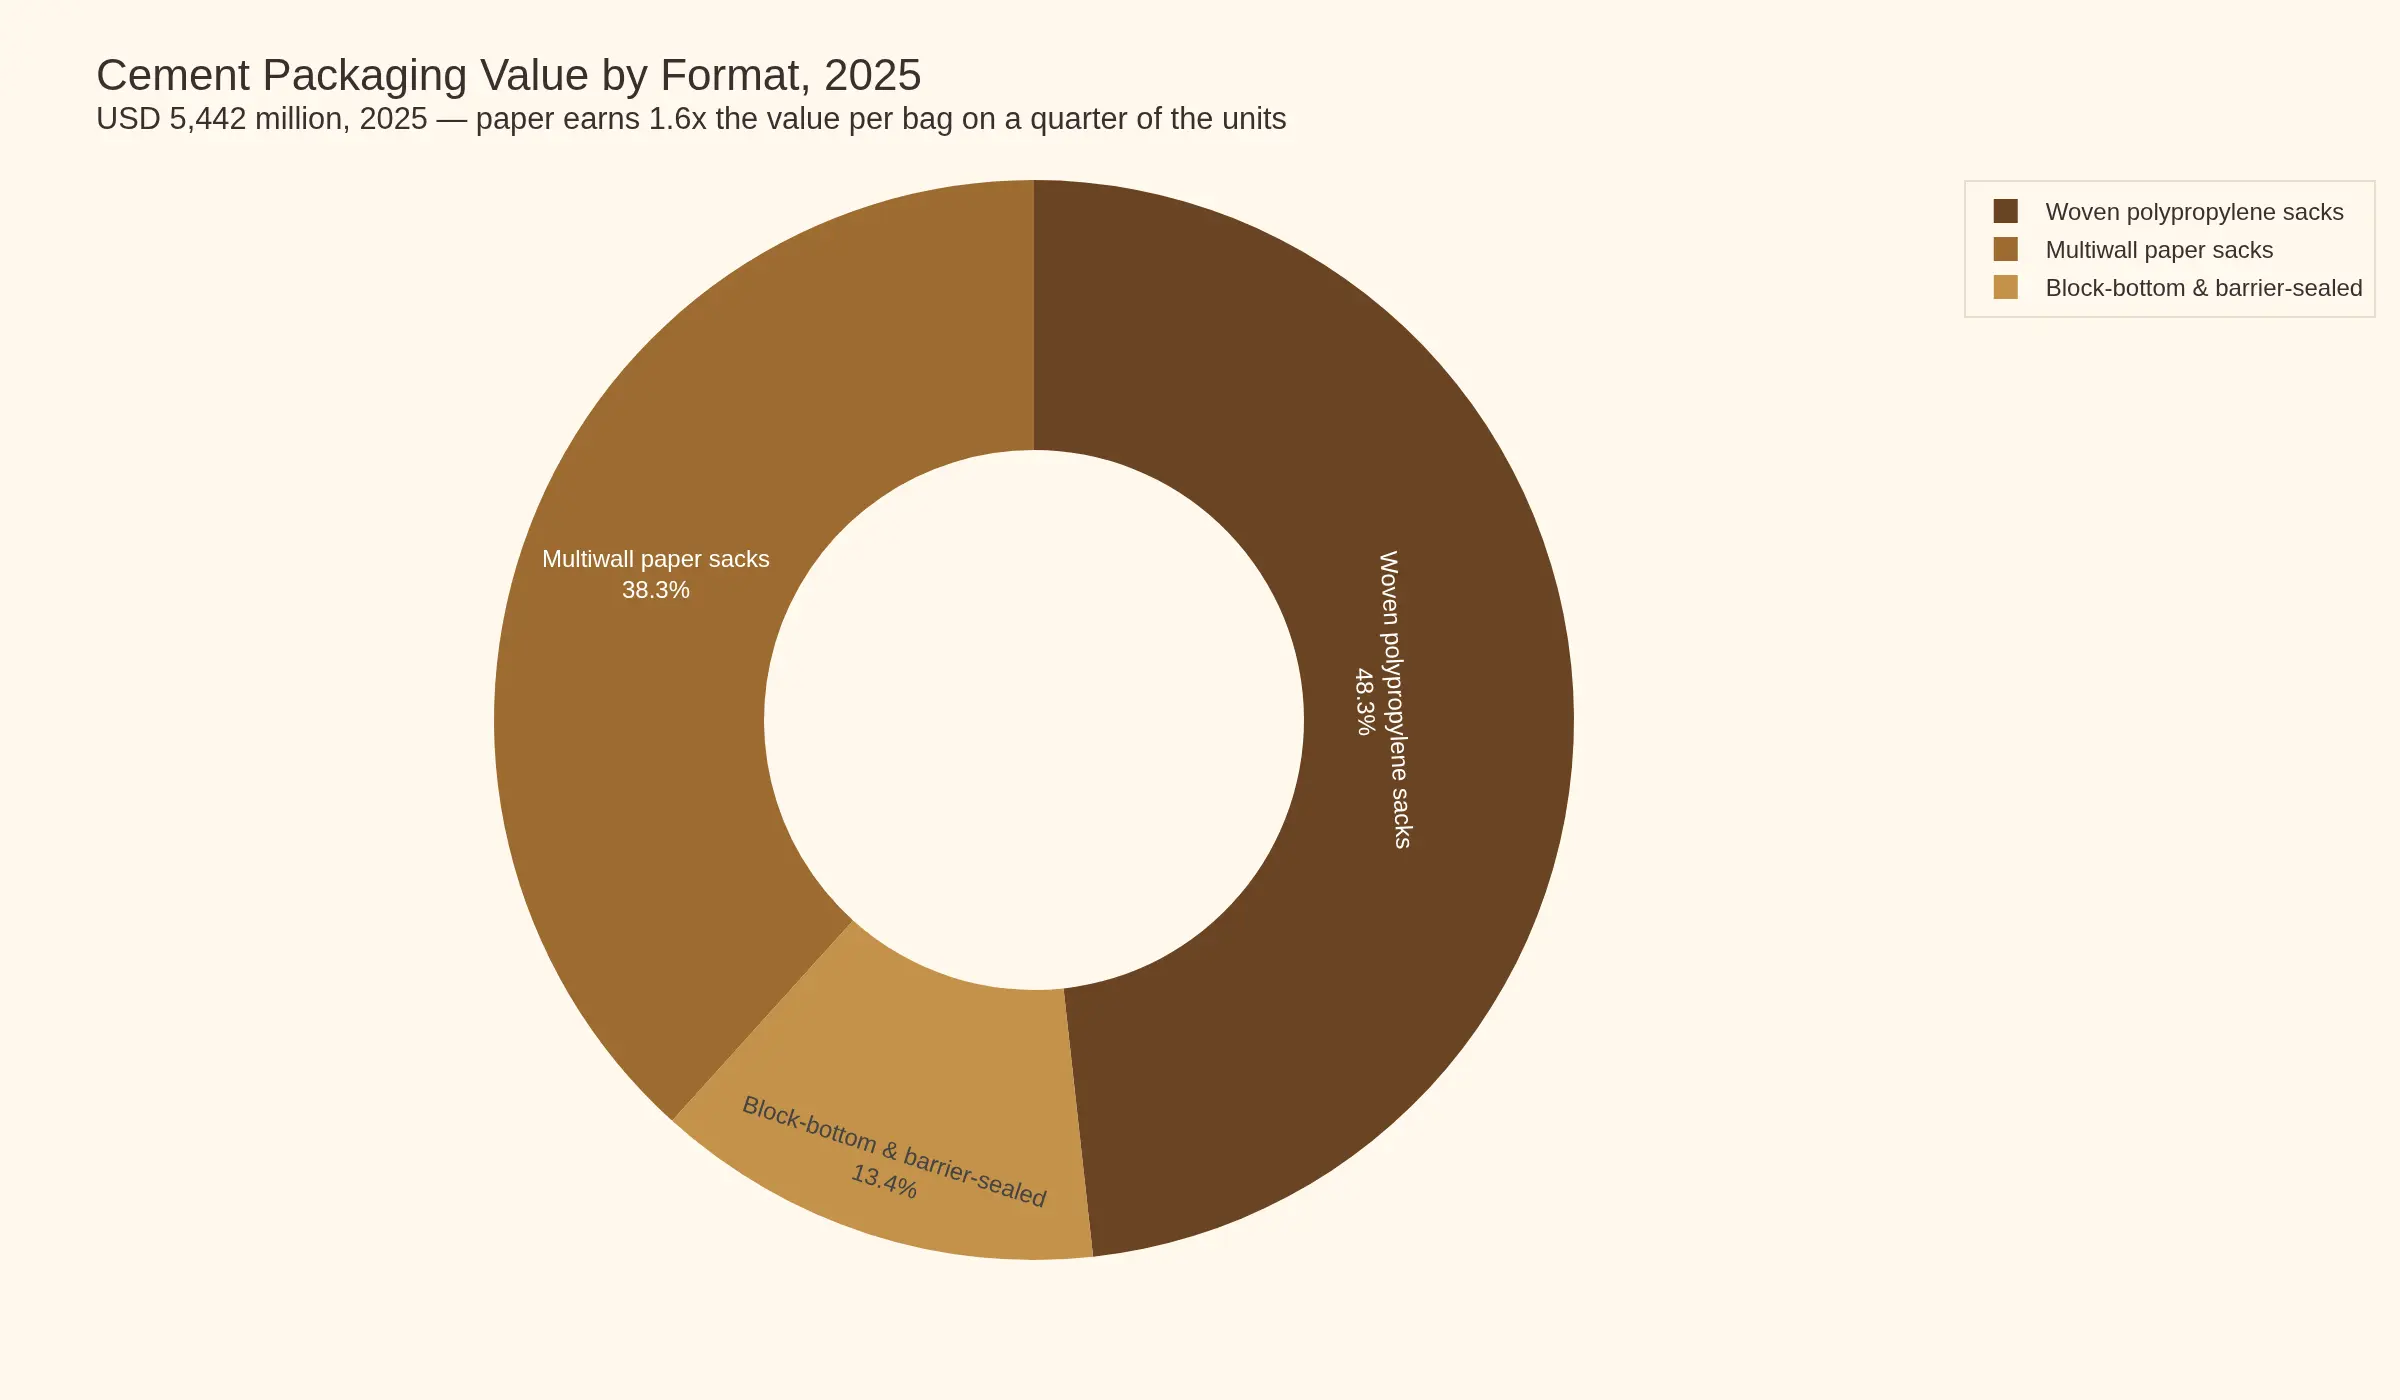
| Format | Units 2025 (m) | Value (USD m) | Share of value | Price per bag |
|---|---|---|---|---|
| Woven polypropylene sacks (sewn and laminated) | 20,200 | 2,626 | 48.26% | USD 0.13 |
| Multiwall paper sacks (sewn and pasted) | 6,950 | 2,085 | 38.31% | USD 0.30 |
| Block-bottom and barrier-sealed (paper and laminated woven) | 1,740 | 731 | 13.43% | USD 0.42 |
| Total | 28,890 | 5,442 | 100% | USD 0.188 |
Woven sacks take 70 per cent of the units and 48 per cent of the value; paper takes 24 per cent of the units and 38 per cent of the value. That inversion — paper earning 1.6 times the value per unit — is the whole commercial case for a material shift, and the reason a resin shock in Asia matters to a kraft producer in Austria.
7.2 By Material Input
Unbleached sack kraft, bleached sack kraft for print-critical white bags, virgin and recycled polypropylene, low-density polyethylene for liners and laminates, and dispersion or extrusion coatings for barrier. The input mix follows the format mix, and the format mix is the forecast.
7.3 By Cement Type and Bag Size
Ordinary Portland, Portland pozzolana, Portland slag and blended cements all pack in the same formats; the differentiation is colour, print and, in some markets, a distinct bag for sulphate-resisting grades. Bag size is the more commercially important cut: 50 kilograms dominates globally, 25 kilograms takes the European and premium Asian retail trade, and 40 kilograms appears in parts of Africa and the Middle East. The drift toward 25 kilograms is one of the two reasons units grow faster than tonnage.
7.4 By Route to Market
Direct supply agreements with cement majors; merchant converters selling to regional cement producers; and import/export flows where bags are made in one country and filled in another. The first carries the volume and the multi-year contract, the second carries the margin, and the third is the most exposed to freight and currency.
7.5 By End Use
Individual and small-contract housing, which is the bag's home market; institutional and infrastructure projects, which is bulk's; and retail and repair, which is small, high-margin and the last to formalise.
8. Regional Analysis
8.1 India: the Largest Bag Market and the Fastest Bulk Transition
India produces 450 Mt of cement and sells 75–80 per cent of it in 50-kilogram bags, which makes it 366.6 Mt of bagged cement, 7.33 billion bags and roughly a quarter of world bag demand. It is also the market where the bulk transition is measurably fastest, from almost nothing twenty years ago to 20–25 per cent today, growing at 15–20 per cent a year in the second half of the last decade. Both statements are true at once, and the forecast has to hold them together: India adds bag demand through volume and removes it through bulk share, and the net is the single largest swing factor in the global total.
8.2 China: 47 per cent of the Cement, 7 per cent of the Bags
China's 1,880 Mt of cement produces only about 94 Mt of bagged product, because Chinese construction has been bulk for two decades. The consequence is that the world's largest cement market is almost irrelevant to this report, and that Chinese cement's decline — from a peak near 2.4 billion tonnes to 1.9 billion — removes bag demand in proportion to a small share. This is the most under-appreciated structural fact in the market: the tonnage that dominates global cement statistics barely participates in global bag statistics.
8.3 Africa: Four in Five Tonnes Bagged, and No Alternative
Africa is the market with the highest bagged share and the least substitution risk, because the bulk distribution infrastructure that would replace bags largely does not exist outside South Africa and North Africa. At 250 Mt of cement and an 80 per cent bagged share, the continent uses 200 Mt of bagged cement — four billion 50-kilogram bags — from a cement base a quarter the size of India's. It is also the market where paper sacks have their strongest position, with Mondi and others building converting capacity in Egypt explicitly to serve local cement producers under long-term agreements. Growth here is the least cyclical and the most population-driven in the report.
8.4 Europe: A Paper Market, a Compliance Market, and a Shrinking One
Europe bags about 47.5 Mt, a quarter of its cement, in a market where paper is the default and compliance is the specification driver. The PPWR's recyclability grades from 2030 and its modulated EPR fees will decide which laminated constructions survive, and the loss of 100,000 tonnes of sack kraft capacity at Stambolijski in 2024 has already tightened the paper side. This is the highest-value, lowest-growth region in the market, and the one where the premium for a compliant bag is easiest to charge.
8.5 Middle East, Türkiye and CIS
394 Mt of cement at a 45 per cent bagged share in a region where block-bottom valve bags are the specification of choice, where export-oriented cement producers in Türkiye and the Gulf bag for shipment, and where polypropylene availability is directly tied to the refinery economics that caused the 2026 squeeze. Russia's market carries an additional constraint on the kraft side, with Segezha's production oriented toward domestic and Asian buyers.
8.6 Latin America and North America
Latin America bags 115.5 Mt, mostly in paper and in 50-kilogram sacks, in a market where Brazil's 68 Mt and Mexico's mid-40s dominate and where bulk is growing from a low base. North America is the report's smallest region at 7.7 Mt of bagged cement, because 70–75 per cent of US cement goes to ready-mix producers in bulk; it matters to this report only as the place where the end-state of a fully formalised construction market can be observed in advance.
8.7 What the Geography Says
The map of this market is a map of construction formalisation, inverted. The most bagged markets are the least formalised, the highest-growth and the lowest-value-per-tonne; the least bagged markets are the richest and the most compliant. Which means the market's centre of gravity moves toward lower prices per bag as it grows, and only specification, print and barrier can offset that. That is a harder commercial position than the volume numbers suggest.
9. Competitive Landscape
The industry is consolidated where fibre is made and fragmented where bags are converted. Three integrated kraft and bag producers — Mondi Group, Billerud and Segezha Group — sit behind most of the world's sack kraft and a large share of its paper bag converting capacity; the woven polypropylene side is thousands of independent converters with no meaningful share and no pricing power. No participant holds a double-digit share of this market. The full analysis, including the customer-side concentration that offsets it, is in the Competitive Landscape chapter.
10. Regulatory Landscape
Four instruments matter: the EU Packaging and Packaging Waste Regulation, the Carbon Border Adjustment Mechanism, national industrial standards for woven sacks in South Asia, and UN certification for flexible bulk containers. Only the first two change what a bag is made of; the others change who may sell one. The detail is in the Regulatory Landscape chapter.
11. Strategic Outlook
Three positions are defensible in this market through 2033. Own the specification: be the supplier whose bag carries the barrier, the print and the traceability that a compliance-driven buyer now has to specify, and earn the 2.57 per cent price/mix rather than the 1.35 per cent tonnage. Follow the customer into bag-heavy geographies: build converting capacity in Africa, India and the Middle East where the cement is bagged, and accept that the fibre will be imported — which is precisely the logic of Mondi's Egyptian acquisitions. Or own the fibre: be one of the few kraft producers whose cost position survives a cyclical price war, and treat the bag plant as a way of capturing the conversion margin on your own paper. What is not defensible is a merchant converter with no fibre integration, no specification capability and a customer list of regional cement producers, selling a commodity sack on price into a market whose tonnage grows 1.35 per cent a year.
12. Watch List
- Indian bulk share. If it passes 30 per cent before 2030, the global bagged-share forecast is roughly halved and USD 500 million or more of 2033 value disappears.
- Polypropylene supply normalisation. Whether the 2026 contracted-volume shortfall resolves in one quarter or three decides whether the paper-versus-woven comparison in India becomes a real share shift.
- European sack kraft capacity. Any further closure, or any restart, in a market of a handful of machines moves European paper sack prices by more than demand does.
- PPWR recyclability grades, applicable from 2030. Which laminated and coated constructions are graded recyclable decides the European format mix for the second half of the forecast.
- Block-bottom conversion rate at packing stations in the Middle East and North Africa, the single largest source of the price/mix growth in this forecast.
13. Methodology
The complete build — every coefficient, every cross-check, and what was not modelled — is set out in the Research Methodology section below. In summary: the market is built upward from the USGS cement total, allocated regionally, multiplied by disclosed bagged shares, converted to units at a disclosed blended bag weight, and priced by format. No third-party market-research estimate is used, cited or referenced anywhere in this report.
14. About This Report
This report covers the global market for cement packaging — multiwall paper sacks, woven polypropylene sacks, block-bottom and barrier-sealed bags, and small flexible bulk containers — measured ex-converter in US dollars, with a 2025 base year and a 2026–2033 forecast. It is published in the Industrial & Transit Packaging segment of the Packaging industry. Related Pheonix research: Global Pulp & Paper for the fibre side, Global Polypropylene and Polypropylene Composites for the resin side, and Global Material and Packaging for the wider packaging frame.
Table of Contents
- Market Snapshot
- Market Definition and the Four Boundary Calls
- Market Size and Forecast
- 3.1 How the 2025 Base Was Built
- 3.2 The Regional Allocation Is the Forecast
- 3.3 The Decomposition Is the Finding
- Four Structural Shifts Defining 2026–2033
- 4.1 Bulk Is the Competitor, and It Is Winning Slowly
- 4.2 The Paper and Polypropylene Comparison Went Live
- 4.3 The Bag Became a Data Carrier
- 4.4 Down-Gauging Is a Silent Volume Tax
- Market Drivers
- 5.1 Construction Formalisation, Which Cuts Both Ways
- 5.2 Moisture, Shelf Life and Tropical Storage
- 5.3 The Brand Surface
- 5.4 Packing-Station Automation
- 5.5 Recyclability Compliance
- Market Restraints
- 6.1 Bulk Substitution
- 6.2 Resin Volatility
- 6.3 Kraft Paper Concentration
- 6.4 Freight and Regionality
- Segmentation
- 7.1 By Format
- 7.2 By Material Input
- 7.3 By Cement Type and Bag Size
- 7.4 By Route to Market
- 7.5 By End Use
- Regional Analysis
- 8.1 India
- 8.2 China
- 8.3 Africa
- 8.4 Europe
- 8.5 Middle East, Türkiye and CIS
- 8.6 Latin America and North America
- 8.7 What the Geography Says
- Competitive Landscape
- Regulatory Landscape
- Strategic Outlook
- Watch List
- Methodology
- About This Report
Competitive Landscape
Competitive Landscape
This industry is consolidated where the fibre is made and fragmented where the bags are converted, and that asymmetry explains almost everything about who earns what. Three integrated kraft and paper producers sit behind the paper side of the market; behind the woven polypropylene side sit thousands of converters, most of them regional, none of them with a share worth defending. No participant in this market holds a double-digit share of it.
The integrated tier
| Entity | Verified position | Why it matters here |
|---|---|---|
| Mondi Group | 1.2 Mt of kraft paper production, 5.6 billion paper bags a year across 41 converting plants, five kraft paper mills; 210,000 t machine at Štětí started December 2024 on a €400m investment | The only participant with scale at both ends of the paper chain and a converting network positioned in bag-heavy geographies |
| Billerud | Swedish kraft and paper producer with sack and kraft paper grades in its portfolio | A fibre-first position: it sells the strength and the sheet rather than controlling the last mile to the cement plant |
| Segezha Group | Around 410,000 tonnes of paper and 1.4 billion paper bags a year; first in Russia and second in the world for sack kraft for multiwall bags | The clearest example of the integrated model outside Western Europe, and the reason Russian and CIS bag supply is self-contained |
Each of these three is a tier-one participant by capacity and integration, not by share of this market. Cement is one application among several for all of them — pet food, chemicals, minerals, animal feed and retail bags sit alongside it — which is a crucial detail: no company’s cement exposure is large enough to make cement its strategic priority, and every company’s cement exposure is large enough to make it defend the account.
The fragmented tier
The woven side has no tier structure at all. The barriers to entry are a tape extrusion line, a circular loom, a laminator and a stitching unit — capital measured in hundreds of thousands of dollars rather than the hundreds of millions a kraft machine costs. What keeps a converter in business is not capacity but customer approval: a cement producer qualifies a bag specification, a print design and a supplier, and switching costs sit in that qualification rather than in the machine. The structural consequence is that woven bag prices converge on resin cost plus a thin conversion margin within one contract cycle, and that consolidation happens through the customer list rather than through the asset base.
Flexible intermediate bulk containers follow a third logic again. They are technical textile products with UN performance-testing and marking obligations, they are sold to a different buyer inside the same cement company, and the competitive set is specialist rather than generalist. They are the segment most likely to consolidate and the least connected to the bag fight.
The buyer is more concentrated than the seller
There are a few dozen cement groups of real size and thousands of bag converters. That imbalance, not the converter landscape, sets the terms. Two are worth mapping because they define the demand side: Holcim and UltraTech Cement, the Indian market leader in a country that uses a quarter of the world’s bags.
The most instructive single transaction in this market shows what that imbalance produces. In 2022 Mondi acquired the paper bag converting lines of National Bag and Egypt Sack — two subsidiaries of Lafarge Cement Egypt, part of Holcim Group — adding 150–180 million bags of annual capacity together with a long-term supply agreement to serve Lafarge Cement Egypt (Mondi, April 2022). A cement major sold its own bag plant to its bag supplier in exchange for contractual security. That is the whole structure of this industry in one deal: the buyer does not want to own converting capacity, and the seller will buy capacity to own the contract.
What this means for pricing power
Pricing power sits at the two ends of the chain and not in the middle. Fibre producers earn cyclical rents when capacity is tight, as European sack kraft was after the Stambolijski closure removed 100,000 tonnes a year. Cement producers, being few and large, pass packaging cost straight through — the 2026 Indian increases of ₹60–80 a tonne were cost pass-throughs, not margin events. The merchant converter in the middle absorbs the cycle. That is a structurally poor position in a market whose material volume grows 1.35 per cent a year, and it is why the defensible strategies in this report require either fibre integration or specification capability, and ideally both.
Value Chain
Value Chain
Two chains converge on the same packing station, and they have almost nothing in common except the customer. The paper chain is capital-intensive, concentrated and cyclical at the fibre end. The polymer chain is capital-light, fragmented and cyclical at the resin end. Both end in a bag that costs about four dollars a tonne of cement and is bought on a multi-year contract by a company far larger than either supplier.
Stage one: fibre and polymer
Sack kraft is made from unbleached softwood pulp on a small number of machines owned by a small number of companies. Mondi produces 1.2 Mt of kraft paper across five mills and brought a new 210,000-tonne machine on stream at Štětí in December 2024; Segezha runs around 410,000 tonnes of paper capacity. This is the stage where the capital sits, where capacity cannot be added quickly, and where price is set by the balance between a handful of machines and a slowly growing demand. The 2024 closure of Mondi’s 100,000-tonne Stambolijski mill is the clearest demonstration of how little slack exists.
Polypropylene is the opposite. Raffia-grade resin is a by-product of refinery and petrochemical economics and is bought on global markets by converters who have no leverage over its price. When Gulf refiners diverted propane and butane toward LPG production in early 2026, Indian bag manufacturers received 60–70 per cent of their contracted chip volumes and saw raw material costs rise nearly 70 per cent in two months. Nothing in the packaging chain caused that and nothing in it could absorb it.
Stage two: converting
Paper converting is printing, valve-forming, pasting or sewing, and it is done in plants that sit near the customer rather than near the mill. Mondi operates 41 paper bag plants against five kraft mills — a ratio that tells you where the assets are cheap and where they are not. Woven converting is tape extrusion, circular looming, lamination or coating, printing, cutting and stitching, and it is a shed with machines in it: hundreds of thousands of dollars, not hundreds of millions, which is why the woven side has no tier structure at all.
| Stage | What sets the price | Who holds the margin |
|---|---|---|
| Kraft paper | Machine capacity against slow-growing demand; energy and wood cost | The mill, cyclically |
| Polypropylene resin | Global petrochemical and refinery economics | Nobody in this chain |
| Paper converting | Customer qualification, print complexity, freight radius | Integrated supplier, modestly |
| Woven converting | Resin cost plus a thin conversion margin, bid per contract | Nobody, structurally |
| Bagging at the cement plant | Line speed and downtime, not bag price | The cement producer, by pass-through |
Stage three: the bag plant is a satellite
A 50-kilogram cement bag weighs 100–150 grammes and occupies 60–70 litres. Shipping empty bags is shipping air, which caps the economic radius of a commodity bag plant at a few hundred kilometres and dictates the geography of the whole industry: converting follows the cement plant, and fibre does not follow either. Mondi’s Egyptian transactions show the logic executed deliberately — in 2022 it bought the paper bag converting lines of National Bag and Egypt Sack from Lafarge Cement Egypt, adding 150–180 million bags a year together with a long-term supply agreement, after buying two lines from Helwan Cement in 2020. The plant moved to the customer, and the customer signed for the output.
Stage four: the packing station, where the real cost lives
At 20 bags a tonne, packaging is about USD 3.77 of a tonne of cement selling near USD 90 — 4.19 per cent. That is small enough to be passed through and large enough to be managed, and the 2026 Indian episode shows both: increases of ₹10–15 a bag were sought to offset resin and fuel, and the per-tonne impact was quoted by producers in the ₹80–100 range. But the number that actually governs behaviour at the packing station is not the bag price. It is throughput. A line that stops because bags are out of specification costs more per hour than the bags cost per day, which is why qualification, consistency and delivery reliability outrank price in every serious supply agreement — and why a cheaper bag from an unqualified converter rarely wins the account.
Where the value ends up
Split across the chain, the four dollars a tonne resolves into roughly half raw material and half conversion, printing and logistics, with the mill capturing cyclical rents at the top of the cycle and the cement producer passing the whole of it through to a customer who is buying cement and not packaging. In a market growing 1.35 per cent in material volume, that distribution is not going to change on its own. It changes when specification changes — and specification is the only lever the converting end of this chain actually holds.
Investment Activity
Investment Activity
The capital in this market is going into fibre and into contracts, not into capacity, and the direction is rising while the intent is defensive. Three commitments tell the story better than any aggregate: a €400 million kraft machine, a 100,000-tonne mill closed permanently, and two acquisitions of other companies’ bag plants.
The largest single commitment is a paper machine
Mondi started up a new 210,000-tonne kraft paper machine at Štětí in the Czech Republic in December 2024 on a €400 million investment, alongside a new extrusion line, consolidating its position in European paper-based flexible packaging and strengthening coating capability (Mondi 2025 investor presentation). At €400 million for 210,000 tonnes, that capital intensity is roughly €1,900 per annual tonne. A bag plant, by contrast, is a shed with printing, pasting and stitching lines. This ratio — three orders of magnitude apart — is the structural reason the fibre end consolidates and the conversion end never does.
Capacity is also leaving
Mondi’s Stambolijski mill in Bulgaria, 100,000 tonnes a year of sack kraft on a single machine, was hit by fire in September 2024 and then permanently closed; 300 employees were affected and supply moved to Štětí in the Czech Republic, Frantschach in Austria and Dynäs in Sweden (EUWID Pulp and Paper, October 2024). The company’s stated reasoning is the one to note: after evaluating repairs and the investment required for the mill to remain competitive, closing and serving customers from the existing network was the better course. In a market where paper demand grows slowly, the cheapest tonne of capacity is always the one already running.
Acquisitions are buying contracts, not assets
Mondi’s Egyptian moves are the template. In 2020 it acquired two paper bag lines from Helwan Cement and signed exclusive supplier agreements with leading Egyptian cement producers; in 2022 it acquired the converting lines of National Bag and Egypt Sack from Lafarge Cement Egypt, adding 150–180 million bags a year and a long-term supply agreement. Both transactions bought converting capacity that was physically inside, or contractually tied to, a cement producer. The asset value is incidental; the contract is the asset.
Where the capital is going geographically
Mondi’s own disclosure of investment across its paper bag plant network names Colombia, Morocco and Mexico, alongside European capacity. That is a map of where cement is bagged and where labour and energy costs allow conversion: North Africa, Latin America and South Asia. It is not a map of where paper is made.
What is not being funded
There is no wave of greenfield sack kraft capacity in Europe: energy costs, permitting and a flat demand curve make a new machine unattractive against debottlenecking an existing one. There is no consolidation wave in woven polypropylene either, because the assets are cheap and the buyers are regional. And there is very little investment in capacity for capacity’s sake anywhere in this market — every commitment is either a cost-position play, a compliance play or a contract play. That is what a 1.35 per cent volume market looks like when it is being invested in properly.
Technology & Innovation
Technology and Innovation
Nothing in this market is technologically new, and that is precisely why the innovation that matters is measured in grammes and seconds. A cement bag is a paper or polypropylene container with a valve, a seam and a print job. The competitive frontier is how little material can hold 50 kilograms, how fast a packing line can fill and palletise it, and how much information can be printed on it.
Strength per gramme
Down-gauging is the largest quiet force in the market. Three plies become two where the strength allows; 80 gsm becomes 70 gsm; high-performance extensible kraft does more work per fibre than the grades it replaced. Woven fabric follows the same curve with finer tape, better stabilisers and stronger seams. The specification that governs all of it is bursting strength — trade specifications for Indian woven cement sacks quote 70–120 kg/cm² — because a bag that fails in transit is a product loss, a dust hazard and a brand event, not a packaging return. The consequence for suppliers is that the customer’s incentive is always to buy less material per bag, never more.
Barrier, and the recyclability constraint
Moisture is the enemy: cement is hygroscopic and loses specification when it takes up water, which matters most in tropical storage. Polyethylene lamination and extrusion coating solved that cheaply and made the bag unrecyclable. The current innovation frontier is the dispersion coating — a barrier applied as a coating rather than a film, that lets the paper be repulped — and, on the woven side, coated and liner-less constructions that keep the moisture out without a second polymer layer. The technology is available; the constraint is cost and the qualification cycle at the cement producer. Regulation is what makes the more expensive answer viable, which is why PPWR’s 2030 grades matter more than any resin price movement in deciding the European format mix.
Filling and palletisation
The block-bottom valve sack is the commercially significant engineering advance of the last two decades in this market. It fills faster, seals tighter, produces a squarer pallet and generates less dust than a sewn open-mouth sack, which matters at a packing station where the real cost of a bad bag is downtime rather than the bag itself. Every conversion of a packing line to block-bottom is a mix upgrade of roughly half again on the price per bag, and it is the single largest source of the price and mix growth in this forecast.
Print, coding and the data layer
In bagged markets the bag is the only brand surface, so flexographic print up to six colours, surface treatment and colour consistency are specification items rather than decoration. Two layers are being added on top: batch and plant coding for traceability, and machine-readable codes — increasingly a QR code — carrying batch, date and, in export markets, the documentation that accompanies a consignment. Bagged cement is counterfeited at scale in South Asia and the Middle East, and the bag is the only practical enforcement point.
The machinery layer
Woven sack capacity is built from tape extrusion lines, circular looms, laminators and printing lines, supplied by a small group of European and Asian machinery builders — Starlinger among them — with Indian suppliers serving the domestic market. The machinery is mature, widely available and cheap relative to kraft paper capacity, which is the technical reason the woven side of this market will never consolidate the way the paper side has.
Why patent activity is low
This is an engineering market, not an intellectual-property one. Formats are old, the underlying processes are commodity processes, and the improvements that matter — a stronger sheet, a better valve, a coating that repulps — are developed inside mills and converters and protected by know-how and customer qualification rather than by patents. Innovation intensity in this market buys cost position and specification premium; it does not buy exclusivity.
Market Risk
Market Risk
The single largest risk to this forecast is not a packaging risk, and it is the one thing in the report that no participant in the market controls. Bulk substitution can move this market by whole percentage points a year while every converter is doing its job correctly.
Risk 1: bulk substitution runs faster than modelled
The forecast assumes global bagged share falls from 32.2 per cent to 31.1 per cent over eight years. That is a gentle slope, and there is a precedent for a steeper one: Indian bulk movement grew at 15–20 per cent a year between 2014–15 and 2019–20, from almost nothing twenty years ago to 20–25 per cent of consumption today. The sensitivity is severe and easy to state. One percentage point of global bagged share is 40.34 Mt of cement, 896 million bags and USD 169 million of market value — 3.1 per cent of this entire market. Two points is more than USD 300 million of 2033 value, and it requires nothing more than a continuation of the Indian trend at the pace India has already delivered.
Risk 2: resin, which is not a packaging market either
Polypropylene is priced by refinery economics, and the 2026 Indian episode is the template for how fast that reaches a cement bag. Converters received only 60–70 per cent of contracted polypropylene chip volumes as Gulf refiners diverted propane and butane toward LPG production; raw material costs rose nearly 70 per cent in two months; the bag went from ₹6–7 to ₹11–12, adding ₹60–80 to a tonne of cement at 20 bags a tonne, with producers reporting ₹80–100 a tonne of packaging cost impact (Mint, March 2026). Woven sacks are 48.26 per cent of this market’s value. A sustained resin shock on that share is a repricing of half the market, and it lands on converters who have quoted annual prices.
Risk 3: kraft paper concentration
The paper side has the opposite problem to the resin side. There are only a handful of sack kraft machines in the world, and when one leaves — as Stambolijski’s 100,000 tonnes did in 2024 — the remaining mills absorb the volume with no slack. European sack kraft prices were already the subject of multiple announced increases through 2024 and 2025 before the closure was confirmed. A paper sack buyer has fewer alternatives than a woven sack buyer and less ability to switch formats mid-contract, because a cement producer’s packing line is configured for one bag type.
Risk 4: contract concentration
Bag volume is won in multi-year agreements with a few dozen cement groups. Losing one major account is a step change in a converter’s utilisation, and winning one requires capital to be in place beforehand. The Mondi–Lafarge Egypt structure — capacity plus a long-term supply agreement — is rational precisely because it converts that risk into a contract, for both sides.
Risk 5: compliance cost arrives before compliance benefit
The EU Packaging and Packaging Waste Regulation requires recyclability, introduces performance grades from 2030 and modulates producer fees. For a converter this means reformulating barriers — moving off polyethylene lamination toward dispersion coatings or mono-material constructions — before any customer is obliged to pay more for the result. The direction is certain; the timing of the revenue is not.
What is not in the risk case
Cement demand collapse is not modelled: the forecast already carries a 1.55 per cent cement growth path with China declining, and a deeper Chinese contraction removes bag demand in proportion to a 5 per cent bagged share, which is small. Nor is a paper-for-polypropylene wholesale switch modelled. The evidence does not support one yet — a resin shock narrows the price gap and makes the total-cost argument worth having, which is not the same as winning share. If that changes, it changes the material mix and the value per bag, not the direction of the market.
Regulatory Landscape
Regulatory Landscape
Four instruments matter and only two of them change what a bag is made of. The rest change who is allowed to sell one, or how it must be tested.
EU Packaging and Packaging Waste Regulation (EU) 2025/40
The regulation sets sustainability and labelling requirements across the whole life cycle of packaging, regardless of material or origin, and it applies to industrial packaging as squarely as to retail. Its operative requirements for a cement sack are these: all packaging must be designed for material recycling and must be capable of being collected, sorted and recycled at scale, with the at-scale requirement entering into force in 2035; a system of recyclability performance grades applies from 2030, with stricter obligations from 2038; producers carry extended producer responsibility covering the full cost of collection, sorting and recycling, with fees modulated to incentivise design for recyclability; and packaging must be designed to minimise weight and volume while maintaining functionality (EUR-Lex summary of Regulation (EU) 2025/40).
Two consequences follow directly. First, the polyethylene-laminated woven sack — a polypropylene bag with an LDPE layer that makes it moisture-proof and hard to recycle — is structurally disadvantaged in Europe over the forecast period. Second, the multiple-material paper sack with a dispersion coating is advantaged, and so is any woven construction a recycler will actually accept. The regulation does not ban formats; it prices them.
Carbon Border Adjustment Mechanism
CBAM entered its definitive regime on 1 January 2026. Importers of more than 50 tonnes a year of covered goods must hold authorised declarant status, buy certificates priced off EU ETS auction values — a quarterly average in 2026 and weekly from 2027 — and surrender certificates against declared embedded emissions, with a deduction where a carbon price was already paid in production (European Commission, CBAM definitive regime; the mechanism was established by Regulation (EU) 2023/956 and simplified and strengthened ahead of the definitive period by Regulation (EU) 2025/2083). Cement is one of the six sectors in scope.
The honest reading for this market is that packaging sits outside CBAM’s product boundary: the charge falls on the cement, not on the sack, and no certificate is surrendered against paper or polypropylene. What CBAM changes is the documentation burden on the consignment. Where cement moves in bags, the bag becomes the physical carrier of the batch identity that the emissions declaration refers to, which is one reason traceability and coding are moving up the specification list rather than down it.
National standards for woven sacks
In India and across South Asia, cement sacks are specified against national standards for woven fabric construction, strength and stitching, and cement producers qualify suppliers against those specifications before a bag is accepted. This is a compliance pathway rather than a compliance cost, and it is the main reason the woven side stays fragmented: the qualification is per product, per plant and per customer, and it is not transferable.
Dangerous goods and bulk containers
Flexible intermediate bulk containers intended for hazardous or UN-classified contents carry performance-testing and marking obligations, which is a meaningful barrier to entry in the technical-textile end of this market and almost no barrier at all in the plain cement sack. It is one of the few places where regulation is a moat rather than a cost.
What regulation does not fix
None of these instruments addresses the thing that decides this market’s volume. Bulk substitution is a commercial and infrastructural choice made by cement producers and their customers, and no packaging rule makes a silo more or less attractive. A converter who assumes the regulatory tailwind is a demand tailwind has misread which risk he is carrying.