
Global Companion Diagnostics and Pharmacogenomics Market Report, Size, Share and Forecast 2026-2033: The Label Sets the Price, the Guideline Sets the Volume
Two markets, one instrument
Companion diagnostics and pharmacogenomics are conventionally sized as one market because they run on the same sequencers and the same real-time PCR instruments. They are bought and paid for in two entirely different ways, and the difference is not academic. It decides which of them can hold a price.
Companion diagnostics is priced by a drug approval. A test becomes a companion diagnostic when a regulator writes it into a therapeutic's label. From that moment the test is not discretionary: the label says the drug is for patients whose tumour carries a particular marker, and somebody has to establish that the marker is present. Volume is a function of how many patients are prescribed the drug. Price is set before launch, in the negotiation between sponsor and payer, and the test cannot be substituted, because substituting it would take the drug outside its indication.
Pharmacogenomics is priced by a coverage policy. A pharmacogenomic test is required by no label. It is recommended by a guideline. The Clinical Pharmacogenetics Implementation Consortium now maintains 28 active guidelines covering 34 genes and 164 drugs, with 85% of published pharmacogenomic implementation studies referencing its content. But a guideline is not a payment. The Medicare contractor that governs American coverage of pharmacogenomic testing published its position in LCD L38294: gene-by-single-gene testing is covered consistent with CPIC, and on combinatorial testing it concluded there are "insufficient data to support coverage for any combinatorial test."
That sentence is why this report is a two-field construction rather than one. The payer will fund the guideline gene. It will not fund the panel.
Contents
Market size and forecast, 2025-2033
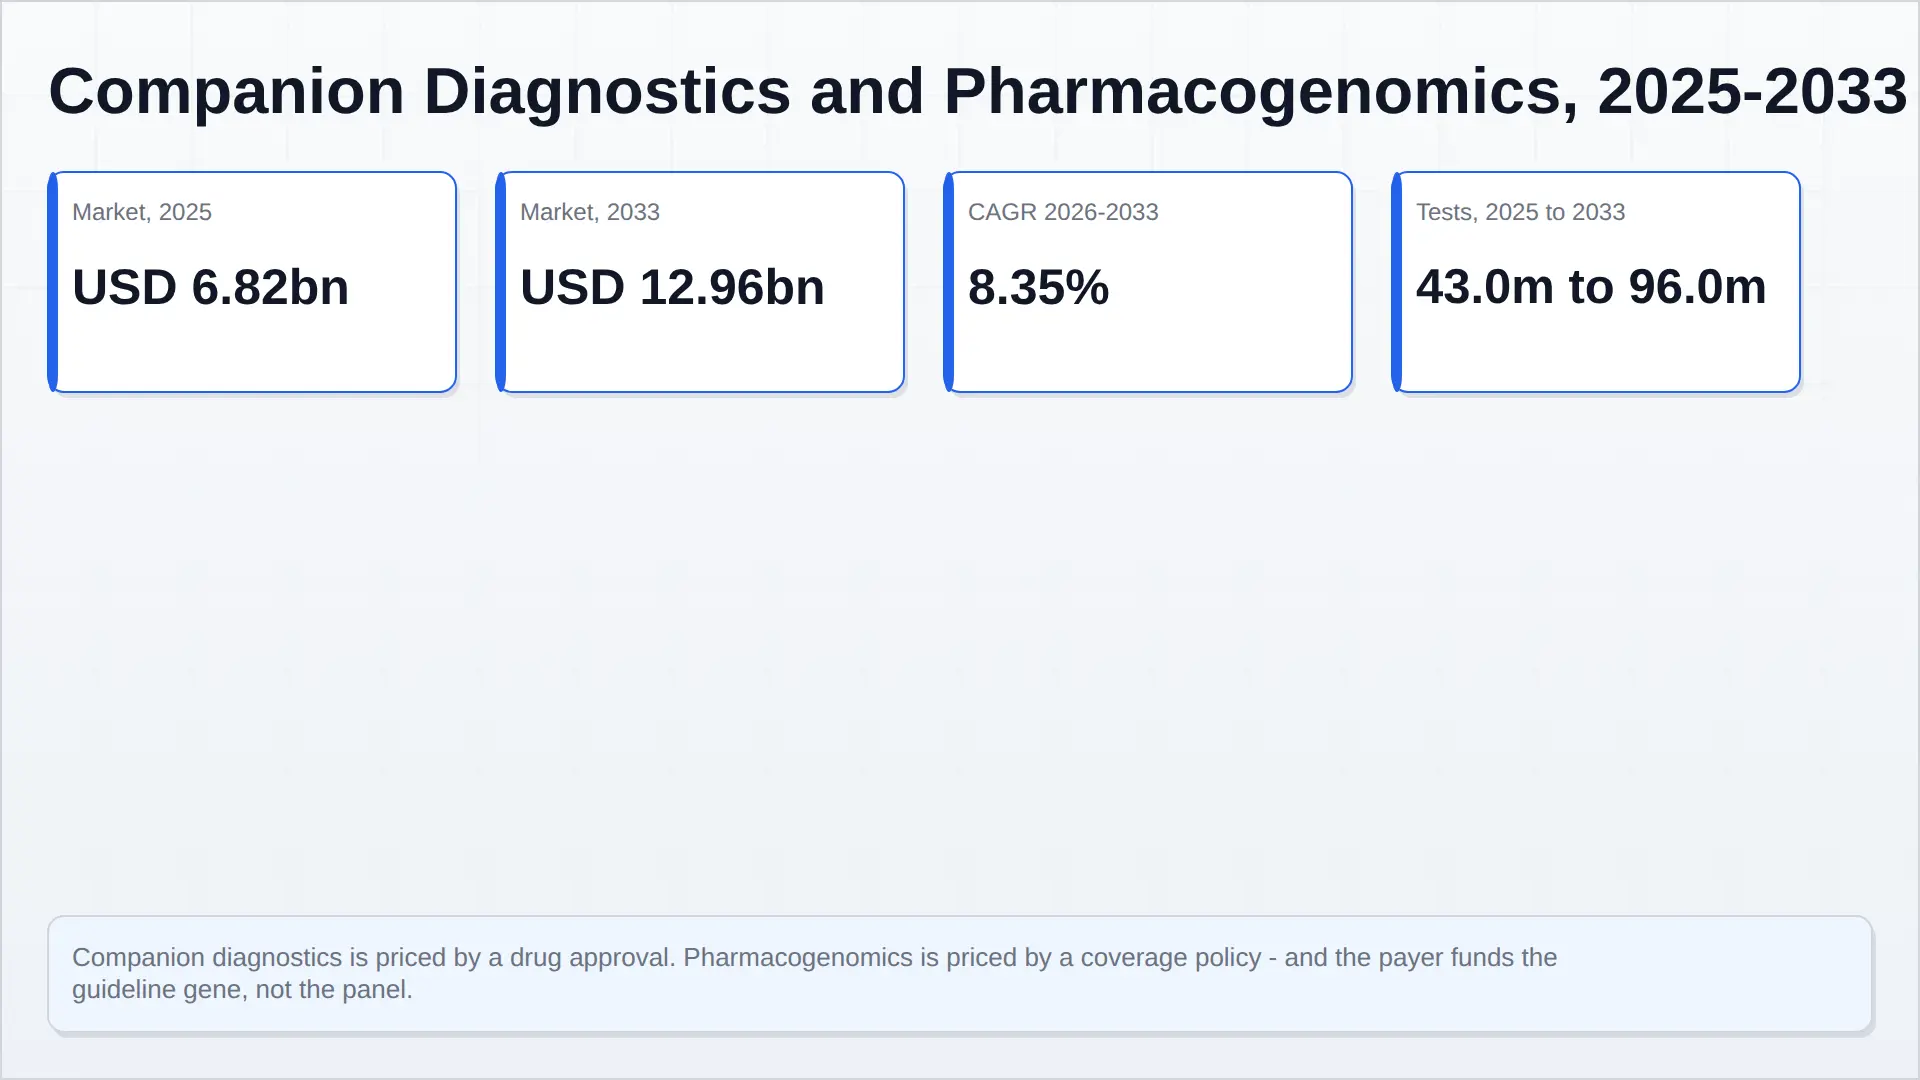
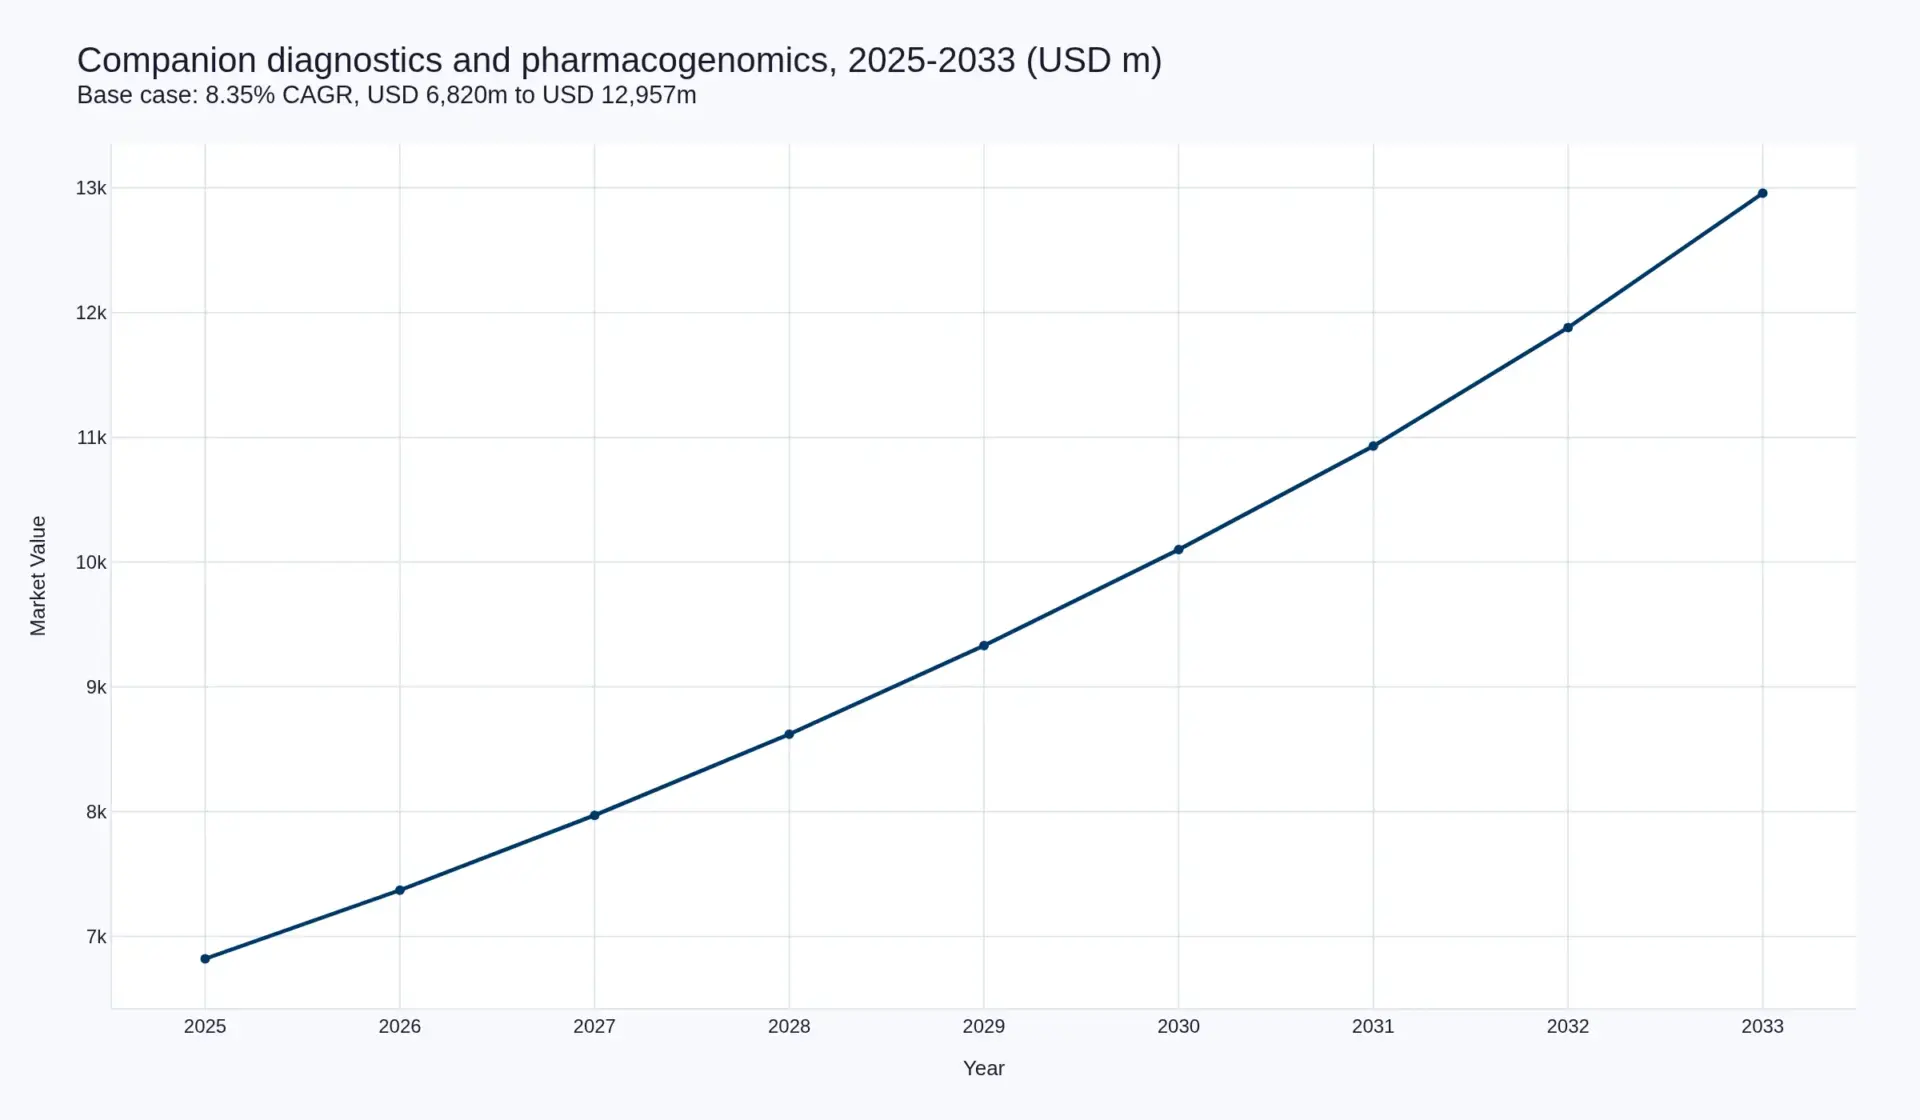
The combined market is USD 6,820 million in 2025, reaching USD 12,957 million in 2033 at an 8.35% CAGR and a 1.900x expansion. Test volume rises from 43.0 million to 96.0 million, a 10.56% compound rate. The gap between those two rates is the single most important fact in this report: realised revenue per test falls from USD 158.60 to USD 134.97. Every year more tests are run and each of them is worth less.
That is not a defect in the construction. It is what happens when a test stops being a product and becomes a step in a pathway. A companion diagnostic ordered because a label requires it competes with nothing; a pharmacogenomic panel ordered because a guideline suggests it competes with not ordering it at all. Both ends of that spectrum push price down for different reasons, and the interaction is why volume outruns value by 221 basis points a year.
The path is deliberately smooth rather than lumpy, which is unusual in this cluster. The disciplines built underneath the in vitro diagnostics hub carry step changes because a fee schedule or a tender resets their price on a known date. Here the two constraints arrive at different times and partly offset: the payer tightening on pharmacogenomics panels from 2020 onward, and the oncology label expanding through the same period. A report that showed a sharp 2027 inflection would be inventing one.
The two fields, and why their growth decouples
| Field | 2025 (USD m) | 2033 (USD m) | CAGR | Share of 2025 |
|---|---|---|---|---|
| Companion diagnostics | 4,180 | 8,781 | 9.72% | 61.29% |
| Pharmacogenomics | 2,640 | 4,176 | 5.90% | 38.71% |
| Total | 6,820 | 12,957 | 8.35% | 100.00% |
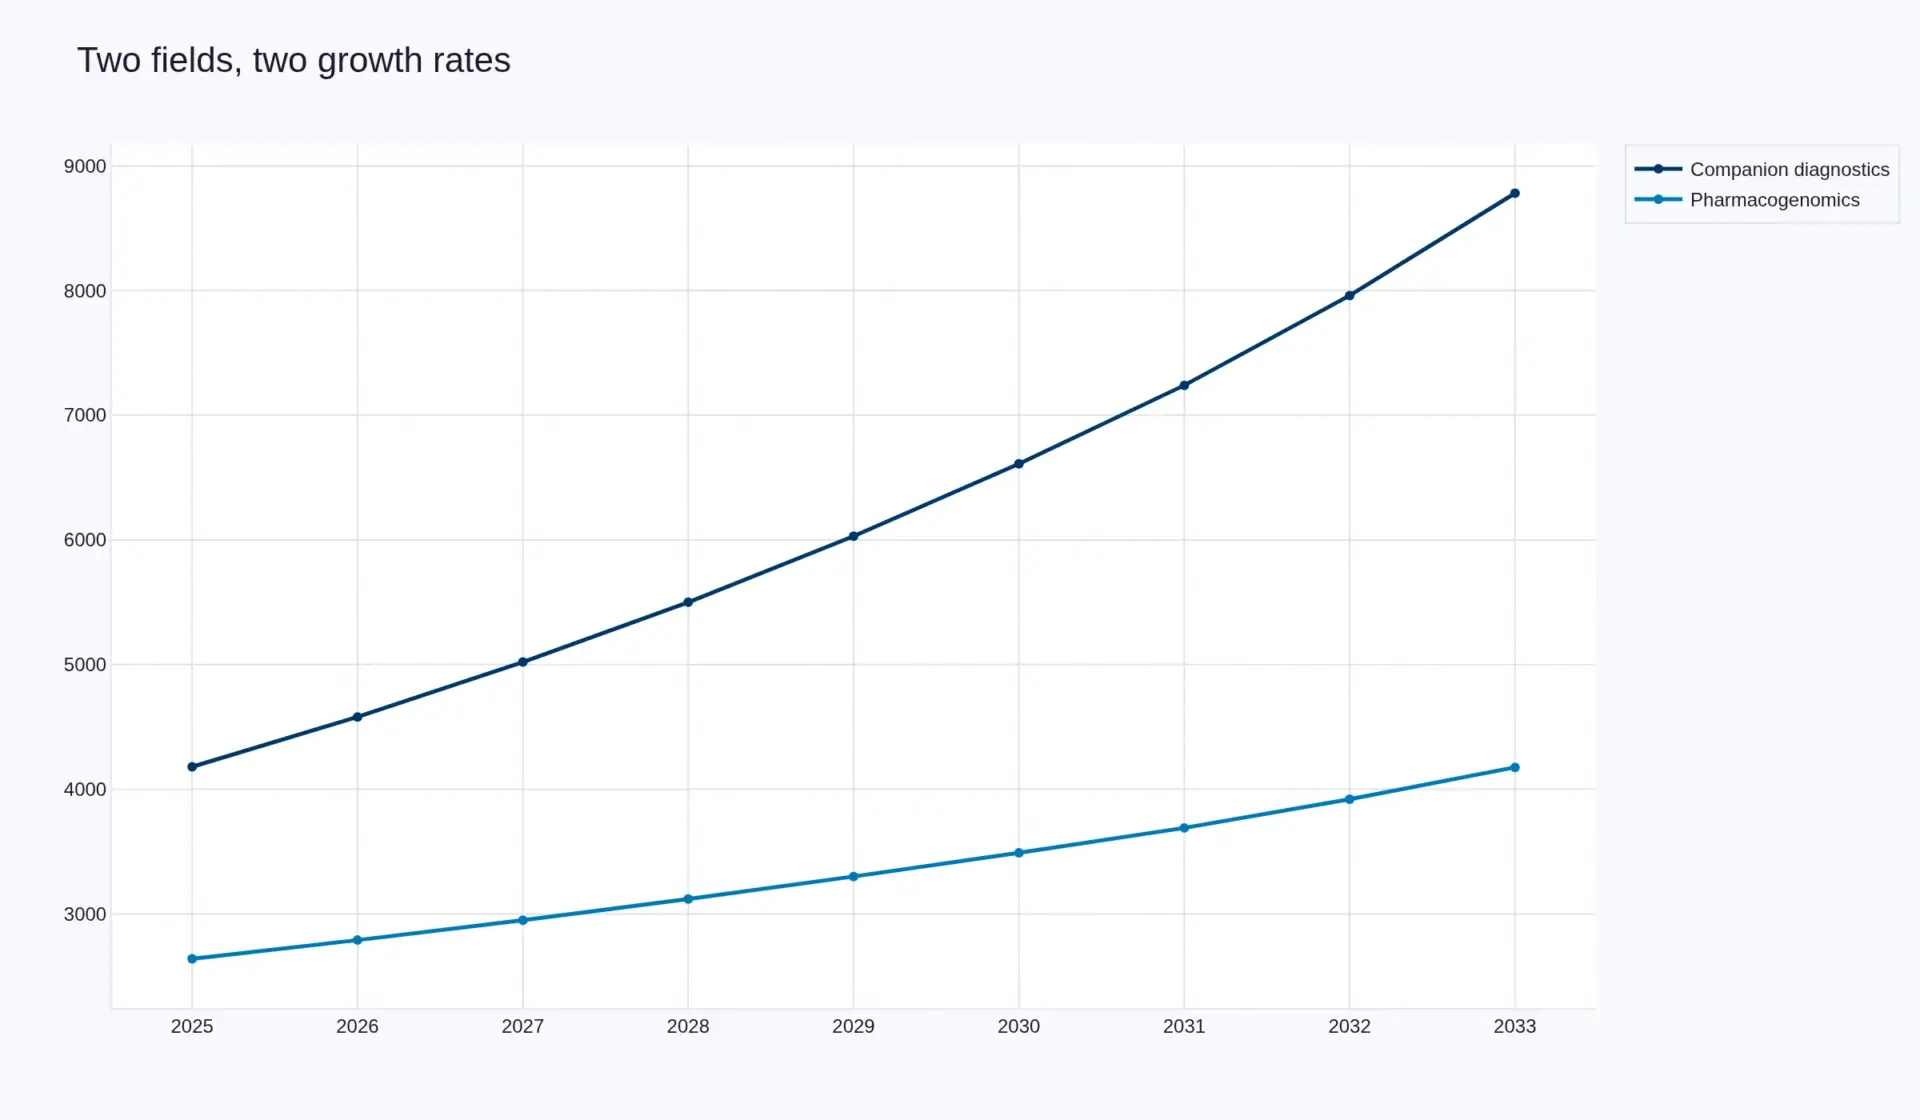
Companion diagnostics supplies 74.97% of the USD 6,137 million increment from 38.71% of nothing — it is 61.29% of the base and three quarters of the growth. Two mechanisms produce that.
The first is label proliferation through group indications. A comprehensive genomic profile cleared for one drug and later labelled for a group of oncology therapeutics stops being a test for a drug and becomes a test for a disease. Illumina's TruSight Oncology Comprehensive carries separate companion indications for RET fusions in thyroid cancer and RET SNVs, MNVs, insertions and deletions in medullary thyroid cancer under a single authorisation supplement. Thermo Fisher's Oncomine Dx Express holds an ERBB2/HER2 activating-mutation indication in non-small-cell lung cancer. One platform, many labels, each of which adds patients without adding a new instrument.
The second is the escape from oncology. The FDA authorised a companion diagnostic for bepirovirsen in chronic hepatitis B by De Novo request in October 2026 — Elecsys HBsAg II quant II RxDx, reading hepatitis B surface antigen as the biomarker. Roche already reports companion diagnostics growing 25% inside a Pathology Laboratory business growing 14%. The field is no longer defined by tissue.
Pharmacogenomics has the opposite structure. Its growth is capped by reimbursement rather than by evidence. The evidence base is the strongest in diagnostics: CPIC's 164 drug-gene pairs are freely available, integrated into the Epic genomics module, and queried through a public API more than 80,000 times a month. Adoption still does not follow, and CPIC's own 2024 member survey records the shift in the stated barrier — away from scientific uncertainty, towards clinician education, reimbursement and EHR integration.
The clearest natural experiment is Myriad Genetics. GeneSight is the archetypal combinatorial panel, and its 2025 trajectory is what a panel looks like when a payer withdraws: full-year revenue of USD 824.5 million fell 2%, of which USD 8.1 million was attributable to UnitedHealthcare discontinuing coverage of GeneSight in commercial and managed Medicaid. GeneSight volume growth recovered to 9% in the fourth quarter, but only after the coverage loss had been anniversaried. A single payer's coverage decision cost this field more than a year of clinical evidence added.
What the number counts, and what it double counts
Companion diagnostics is usually sized as a single number, and that is the second methodological error this report corrects. The same clinical event generates revenue twice, and it is booked by two different companies.
A laboratory buys an assay kit from a manufacturer. The laboratory then runs the test and bills a payer for it. The kit and the test are not two markets — they are two positions on one value chain applied to one patient. A figure that adds them is defensible as revenue across the chain. It is indefensible as the amount spent on testing, because the patient was tested once.
| Revenue pool | 2025 (USD m) | Share of market | Who books it |
|---|---|---|---|
| Companion diagnostic assays, kits and reagents | 2,460 | 36.07% | IVD manufacturers |
| Companion diagnostic testing services | 1,720 | 25.22% | Reference and specialty laboratories |
| Pharmacogenomic assays and testing (combined) | 2,640 | 38.71% | Both, at a much smaller ticket |
| Total | 6,820 | 100.00% |
58.85% of companion diagnostic revenue is the kit and 41.15% is the test. A reader who treats the USD 4,180 million as the value of companion diagnostic testing overstates what payers spent on testing by more than half, and understates what manufacturers earned, because the two are different populations of company.
This report's earlier analogue is instructive. The in vitro diagnostics hub carried a urinalysis double count for two builds — USD 3,108 million counted once inside clinical chemistry and once inside the haematology bucket — and correcting it moved the entire base from USD 108,000 million to USD 104,892 million. The lesson there was arithmetic. The lesson here is definitional: a value-chain sum is not a market, and the difference has to be stated on the page rather than buried in a footnote.
One pool is deliberately excluded. Pharmaceutical co-development fees, milestone payments and diagnostic-development service contracts are research and development spend by a drug sponsor, not diagnostic revenue. They are large, they are real, and including them would make this market incomparable with every other report in the cluster, because the same dollars already appear in pharmaceutical R&D budgets.
The attributed pool and the residual
Twelve named participants account for USD 5,220 million of the USD 6,820 million market — 76.54%. The residual is USD 1,600 million, or 23.46%. Both figures are computed from disclosed revenue or from filed segment data; no published aggregate was used to set the total.
| # | Attributed pool | 2025 (USD m) | Basis |
|---|---|---|---|
| 1 | Roche Diagnostics — Ventana CDx, Foundation Medicine, cobas CDx | 1,340 | Disclosed divisional and pathology growth; attributed to drug-linked testing |
| 2 | Guardant Health — oncology | 640 | Disclosed: USD 683.6m oncology revenue, less therapy-selection testing outside CDx |
| 3 | Illumina — oncology IVD and TruSight Oncology | 520 | Attributed within product revenue; CDx-labelled and CDx-intended kits |
| 4 | Labcorp — oncology and pharmacogenomic testing | 420 | Attributed within diagnostics segment |
| 5 | Thermo Fisher — Oncomine and Ion Torrent CDx | 380 | Attributed within Specialty Diagnostics |
| 6 | Tempus AI — oncology profiling and pharmacogenomics | 380 | Disclosed revenue; testing and data, drug-linked portion |
| 7 | Agilent — Dako / PD-L1 IHC companion assays | 350 | Attributed within Diagnostics and Genomics |
| 8 | QIAGEN — therascreen CDx | 300 | Attributed within clinical molecular |
| 9 | Quest Diagnostics — pharmacogenomics and oncology | 300 | Attributed within diagnostics services |
| 10 | Myriad Genetics — GeneSight and oncology | 260 | Disclosed: USD 824.5m group, pharmacogenomic and oncology share |
| 11 | Amoy Diagnostics | 210 | Disclosed revenue; NMPA-approved CDx |
| 12 | Burning Rock | 120 | Disclosed revenue; NGS profiling |
| Total attributed | 5,220 | 76.54% of base | |
| Stated residual | 1,600 | 23.46% of base |
The top five account for USD 3,230 million — 47.36%. That concentration sits almost entirely in companion diagnostics. Roche is the largest single position at USD 1,340 million, 19.65% of the combined market and 32.06% of the companion diagnostics field, and it is the only participant with a disclosed line in all three of immunohistochemistry, PCR and comprehensive genomic profiling.
The residual is the finding. A 23.46% residual is lower than the 33-51% band the discipline reports in this cluster carry, and the reason is structural rather than better research. Companion diagnostic revenue attributes cleanly because the label names the test — a small number of authorised devices carries a large share of the value. Pharmacogenomics attributes badly for the opposite reason: it is delivered by thousands of hospital laboratories running their own validated tests, and no accounts exist for them.
The two price mechanisms
Four documents set the price of this market, and they do not read alike.
| Instrument | What it fixes | Effect |
|---|---|---|
| CMS MolDx LCD L38294, effective 26 July 2020, revised 2 October 2025 | Medicare coverage of pharmacogenomic testing | Single-gene testing covered consistent with CPIC; "insufficient data to support coverage for any combinatorial test" |
| CPIC guideline set, 2025 | The evidence standard the payer defers to | 28 active guidelines, 34 genes, 164 drugs |
| FDA companion diagnostic authorisations | Which tests a drug's label requires | Each authorisation creates a non-substitutable test tied to one drug or one indication group |
| ACLA v. FDA, E.D. Tex., vacated 31 March 2025; FDA reverted 19 September 2025 | Whether laboratory-developed tests face premarket review | Most pharmacogenomic panels and much CDx testing operate as LDTs, so the payer is the gatekeeper, not the device regulator |
The interaction between the second and fourth rows is the market's defining mechanism. Because most pharmacogenomic testing is a laboratory-developed test, the absence of a device authorisation does not stop it being sold — and the presence of a payer policy does. A panel can be analytically valid, clinically defensible and CPIC-consistent and still earn nothing, because the contractor that pays for it has decided that a proprietary interpretation algorithm is not an independently valuable contribution.
Companion diagnostics has no equivalent constraint, and the arithmetic of the two is visible in one company. Guardant Health's full-year 2025 oncology revenue of USD 683.6 million on approximately 276,000 oncology tests implies USD 2,477 of revenue per oncology test. Its screening product, on 87,000 tests and USD 79.7 million, implies USD 916. The companion diagnostic-adjacent test earns 2.7 times the screening test because a label stands behind it.
That price is not permanent. A comprehensive profile labelled for one drug justifies a price per drug; the same profile labelled for a group of oncology therapeutics is priced as one test, and the per-drug premium disappears into the panel. Every group indication the FDA authorises moves value from the assay to the platform. The companion diagnostic industry is being paid a per-label premium for a product that is becoming a per-patient commodity, and the labels are the reason it has not happened yet.
Regional structure
| Region | 2025 (USD m) | 2033 (USD m) | Share 2025 | Share 2033 |
|---|---|---|---|---|
| North America | 3,000 | 5,340 | 43.99% | 41.21% |
| Europe | 1,840 | 3,300 | 26.98% | 25.47% |
| China | 620 | 1,180 | 9.09% | 9.11% |
| Japan | 410 | 660 | 6.01% | 5.09% |
| Asia-Pacific excl. China and Japan | 470 | 1,120 | 6.89% | 8.64% |
| Latin America | 280 | 780 | 4.11% | 6.02% |
| Middle East and Africa | 200 | 577 | 2.93% | 4.45% |
| Total | 6,820 | 12,957 | 100.00% | 100.00% |
North America is 43.99% of the market in 2025, falling to 41.21%, and it is the only region where both price mechanisms operate at full strength — the MolDx coverage policy and the oncology label. Europe is the second pole, at 26.98%, and its structure differs: coverage is decentralised, so the pharmacogenomic panel that Medicare refuses may be reimbursed by a German statutory insurer and refused by a French one.
The two fastest-growing regions are Latin America and the Middle East and Africa, which grow because they are building the testing layer rather than repricing it. Neither has a national pharmacogenomic coverage policy to constrain a panel, and neither has an installed base of comprehensive profiling to displace. Both are small enough that their growth does not move the global figure: together they add 3.5 points of share across eight years.
Japan is the slowest. Its fee schedule has already absorbed the pharmacogenomic revisions and its comprehensive profiling is reimbursed through a national pathway with a fixed price. A mature market with a shrinking population and no repricing event left does not compound.
Product structure
| Product category | 2025 (USD m) | 2033 (USD m) |
|---|---|---|
| CDx immunohistochemistry and in-situ hybridisation assays | 820 | 1,180 |
| CDx real-time PCR assays | 610 | 980 |
| CDx comprehensive genomic profiling, tissue | 690 | 1,760 |
| CDx comprehensive genomic profiling, liquid biopsy | 340 | 840 |
| CDx testing services, laboratory-run | 1,720 | 4,021 |
| Pharmacogenomic multi-gene panels | 1,180 | 2,090 |
| Pharmacogenomic single-gene and HLA testing | 890 | 1,320 |
| Pharmacogenomic interpretation software and clinical decision support | 570 | 766 |
| Total | 6,820 | 12,957 |
The two structural movements in this table run in opposite directions. Tissue comprehensive profiling triples while immunohistochemistry grows at less than half the market rate, and the reason is the same group-labelling mechanism described above: one sequencing test can serve many labels, one PD-L1 assay serves one. Immunohistochemistry does not disappear — it is cheap, it is fast, and for several indications it is the only authorised test — but it is the part of the field with no expansion path.
The second movement is inside pharmacogenomics. Panels and interpretation software grow faster than single-gene tests in the construction, and that is the one place where this report's forecast runs against the payer's stated position. The projection assumes that the clinical utility evidence eventually moves the contractor, or that health-system-level programmes buy the panel outside the fee-for-service claim. If neither happens, the panel line converges on the single-gene rate and the pharmacogenomics field settles near 5.0% rather than 5.90%. That is the downside case in the sensitivity table.
End-market structure
| End market | 2025 (USD m) | 2033 (USD m) |
|---|---|---|
| Reference and specialty laboratories | 2,610 | 5,640 |
| Hospital and health-system laboratories | 2,290 | 3,880 |
| Pharma-sponsored trial testing | 780 | 1,240 |
| Academic medical centres | 640 | 1,010 |
| Payer and population pharmacogenomic programmes | 320 | 1,030 |
| Other, including blood centres | 180 | 157 |
| Total | 6,820 | 12,957 |
Reference and specialty laboratories carry the largest share and grow fastest, because comprehensive profiling is centralised: a test that needs a sequencer, a bioinformatician and a variant-interpretation pipeline does not get run in a 200-bed hospital. Hospital laboratories are the second block and their growth is concentrated in the pharmacogenomic and immunohistochemical lines they can run locally.
The payer programme line is small and triples. That is the one place where pharmacogenomics escapes the coverage constraint — a health system that pre-emptively genotypes its population and prices the programme against avoided adverse drug events is not filing a claim under L38294. It is the same economic logic as a vaccine programme and it is why the line grows from 320 to over 1,000 while the fee-for-service panel line grows slowly.
Forecast and sensitivities
| Year | Value (USD m) | Growth |
|---|---|---|
| 2025 | 6,820 | — |
| 2026 | 7,370 | 8.06% |
| 2027 | 7,970 | 8.14% |
| 2028 | 8,620 | 8.16% |
| 2029 | 9,330 | 8.24% |
| 2030 | 10,100 | 8.25% |
| 2031 | 10,930 | 8.22% |
| 2032 | 11,880 | 8.69% |
| 2033 | 12,957 | 9.07% |
| Scenario | 2033 value | CAGR |
|---|---|---|
| Downside — the payer holds: combinatorial pharmacogenomic panels remain uncovered under L38294 and its successors, and group labelling compresses the CDx per-test price faster than volume grows | USD 11,300m | 6.52% |
| Base: labels proliferate through group indications; pharmacogenomics grows on single-gene and health-system programmes | USD 12,957m | 8.35% |
| Upside — the payer moves: a national coverage determination funds multi-gene pharmacogenomic testing, and pan-tumour profiling is reimbursed at a single national rate | USD 14,600m | 9.98% |
The band is 173 basis points wide on either side, which is wider than the discipline reports in this cluster and is the correct shape for a market whose constraint is a coverage decision rather than a statutory fee. A single national coverage determination is a binary event with a five-figure-million consequence in the terminal year. A statutory fee schedule moves the same amount predictably and in slices.
Competitive snapshot
| Participant | Position | 2025 evidence |
|---|---|---|
| Roche Diagnostics | Largest position in the market; only participant disclosed across IHC, PCR and CGP | Divisional sales CHF 13,847m; R&D CHF 2,052m, 14.82% of sales; Pathology Laboratory +14% with companion diagnostics +25% |
| Guardant Health | Pure-play liquid biopsy; oncology revenue per test USD 2,477 | FY2025 revenue USD 982.0m, +33%; oncology USD 683.6m on ~276,000 tests; non-GAAP gross margin 66% |
| Illumina | Platform owner; TruSight Oncology Comprehensive carries group CDx labelling | Multiple authorisation supplements on one device; RET indications across thyroid and medullary thyroid cancer |
| Thermo Fisher | Oncomine Dx Express; NSCLC ERBB2/HER2 activating mutations | Companion indication held on an amplicon panel |
| Agilent | Immunohistochemistry incumbent; PD-L1 and HER2 antibody franchises | PATHWAY anti-HER-2/neu 4B5 holds a gastroesophageal adenocarcinoma companion indication |
| Myriad Genetics | Combinatorial pharmacogenomics; the coverage test case | FY2025 revenue USD 824.5m, −2%; USD 8.1m headwind from Medicare Advantage coverage withdrawal on GeneSight |
The competitive conclusion is that no participant is strong in both fields. Roche, Illumina, Thermo Fisher and Agilent hold companion diagnostic positions and no meaningful pharmacogenomic franchise. Myriad, Tempus and the laboratory networks hold pharmacogenomic volume and no CDx authorisations of consequence. The reason is the same as everything else in this report: the two fields reward different capabilities — a regulatory and clinical-trial organisation on one side, a payer-relations and health-system-sales organisation on the other.
Editorial analysis on this market
This report sits above the application layer of the diagnostics cluster and below its hub. The field it is most often confused with is molecular diagnostics, and the distinction matters: the infectious disease diagnostics report sizes an application area at USD 30,150 million in 2025, and companion diagnostics is not additive to it — a sequencing panel that identifies a resistance marker and a sequencing panel that identifies an EGFR mutation are the same instrument and the same laboratory, and the discipline totals already count both.
For the technology beneath both fields, see the immunoassay report, which establishes the method used here to separate a volume effect from a price effect by holding both from the same disclosure, and the clinical chemistry and urinalysis report, which carries the closest analogue to this report's pricing argument in a statutory fee schedule. The haematology and coagulation report supplies the cluster's clearest case of a test price reset by administration rather than by competition.
For the layer that manufactures the reagents these tests consume, see the IVD reagents and consumables report. For the service layer that operates the laboratories, the clinical laboratory services report. For the regulatory and clinical evidence work a companion diagnostic requires before it reaches a label, the IVD contract research organisation report. For the discipline this field is most often reported inside, the Global In Vitro Diagnostics market report.
Sources
All figures in this report are drawn from primary documents and from arithmetic performed on them. No market-research competitor material is cited, quoted or used to set any level.
- U.S. Food and Drug Administration — List of FDA-Authorized Companion Diagnostic Devices (In Vitro and Imaging Tools), including P230011/S006 (TruSight Oncology Comprehensive), P240040/S005 (Oncomine Dx Express), P990081/S060 (PATHWAY anti-HER-2/neu 4B5), P250046 (OncoMate MSI Dx) and DEN260027 (Elecsys HBsAg II quant II RxDx)
- Centers for Medicare & Medicaid Services — LCD L38294, MolDX: Pharmacogenomics Testing (original effective 26 July 2020; revision effective 2 October 2025)
- Caudle KE, Whirl-Carrillo M, Relling MV, Hoffman JM, et al. — Advancing Clinical Pharmacogenomics Worldwide Through the Clinical Pharmacogenetics Implementation Consortium, Clinical Pharmacology & Therapeutics, 18 July 2025
- Guardant Health, Inc. — Fourth Quarter and Full Year 2025 Financial Results and 2026 Outlook (19 February 2026)
- Myriad Genetics, Inc. — Fourth Quarter and Full Year 2025 Financial Results (23 February 2026)
- F. Hoffmann-La Roche Ltd — Annual Report 2025 and Finance Report 2025, Diagnostics division and Pathology Laboratory commentary
- Illumina, Inc. — FY2025 results and TruSight Oncology Comprehensive labelling
- Regulation (EU) 2017/746 on in vitro diagnostic medical devices, Annex VIII classification rules
- United States District Court, Eastern District of Texas — American Clinical Laboratory Association v. FDA, vacatur of the laboratory-developed test rule (31 March 2025) and the FDA notice of reversion (19 September 2025)
About the method
70% secondary, 30% primary. The secondary layer is the disclosure set above: device authorisations, coverage determinations, guideline publications, audited results and statutory instruments, read directly rather than summarised.
The primary layer is 52 depth interviews across 11 markets with laboratory directors, molecular pathology leads, pharmacogenomics service leads, oncology pathway managers and payer medical directors; 31 open-ended interviews conducted around coverage and label cycles in the United States, Germany, Japan and the Gulf Cooperation Council; a 198-respondent structured survey of laboratory and pharmacy leaders across the same 11 markets on test ordering authority, coverage experience and panel-versus-single-gene preference; and structured observation at four conferences — the American Society of Clinical Oncology annual meeting, the Association for Molecular Pathology annual meeting, the European Society for Medical Oncology congress and the American Society for Clinical Pharmacology and Therapeutics annual meeting.
The primary layer is used for mechanism only. Every market level, share, growth rate and forecast in this report derives from the secondary layer or from arithmetic performed on it. No interview or survey response carries a figure. The counts above are stated so they can be reconciled against programme records; they are not offered as a source for any number in the tables.
Two things in the procurement are deliberately shown rather than resolved. The two-pool split of companion diagnostics (kit versus testing service) is stated as a value-chain sum with the double-count risk on the page, because the alternative — attributing all of it to testing — would overstate payer spend by 58.85%. And the pharmacogenomic panel forecast runs above the payer's stated position, which is disclosed in the product structure section rather than smoothed away.
All arithmetic — CAGRs, shares, revenue per test, sensitivity paths — was computed deterministically and is reproducible from the tables above. Currency conversions use EUR 1.13/USD, CHF 1.15/USD and JPY 148/USD throughout, the same basis as every other report in this cluster.
Further reading: the point-of-care testing report for the setting where a pharmacogenomic result is delivered before prescribing, and the histopathology report for the tissue pathway that feeds immunohistochemistry companion testing.
Table of Contents
- Market Size and Forecast, 2025-2033
- The Two Fields, and Why Their Growth Decouples
- What the Number Counts, and What It Double Counts
- The Attributed Pool and the Residual
- The Two Price Mechanisms
- Competitive Landscape
- Value Chain and Revenue Model
- Technology and Innovation
- Investment Activity
- Market Risk
- Regulatory Landscape
- Regional Analysis
- Product Structure
- End-Market Analysis
- Forecast and Sensitivities
- Research Methodology and Sources
Competitive Landscape
Competitive Landscape
This market has two competitive structures stacked on top of each other, and almost every analytical error made about it comes from applying one structure’s logic to the other.
The assay layer is concentrated. Twelve named participants hold USD 5,220 million of USD 6,820 million. The top five hold USD 3,230 million, or 47.36%. Roche alone holds USD 1,340 million – 19.65% of the combined market and 32.06% of the companion diagnostics field – and is the only participant with a disclosed line in immunohistochemistry, real-time PCR and comprehensive genomic profiling simultaneously.
The testing layer is fragmented. Thousands of hospital laboratories run pharmacogenomic tests they validated themselves, and no accounts exist for them. That is why this market’s residual is 23.46% rather than the 33-51% band the discipline reports in this cluster carry: the assay half attributes cleanly because the label names the device, and the service half does not, because the laboratory is anonymous.
No participant is strong in both fields
Roche, Illumina, Thermo Fisher and Agilent hold companion diagnostic positions and no meaningful pharmacogenomic franchise. Myriad, Tempus and the reference laboratory networks hold pharmacogenomic volume and no authorisations of consequence. That is not an accident of strategy. The two fields reward different organisations: one needs a regulatory affairs and clinical-trial apparatus to get a device written into a label, the other needs payer relations and health-system sales to get a panel onto a formulary or into a pre-emptive genotyping programme.
Myriad is the clean demonstration of the second requirement. GeneSight is the archetypal combinatorial panel and its 2025 numbers describe exactly what happens when the sales organisation meets a coverage wall: full-year revenue of USD 824.5 million fell 2%, of which USD 8.1 million was attributable to a single payer discontinuing coverage in commercial and managed Medicaid, and volume growth only recovered to 9% in the fourth quarter after the loss had been anniversaried.
Why the assay layer’s concentration does not protect its price
Here is the counter-intuitive part. The companion diagnostics field is concentrated and its price is still falling, because the concentration is in the wrong place. A manufacturer with an authorised device and a label behind it has no competitor for that indication – and it also has no pricing power, because the price was fixed in the launch negotiation and the payer is a monopsonist for the test the label requires.
The margin therefore has to come from somewhere other than price. It comes from menu: one platform holding many labels amortises a fixed development and authorisation cost across more indications. That is precisely what group labelling enables, and it is why the platform owners – Illumina, Thermo Fisher, Roche through Foundation Medicine – are the structural winners even as revenue per test declines.
The two Chinese participants, and why they matter to the price
Amoy Diagnostics and Burning Rock hold USD 330 million between them, 4.84% of the market, almost entirely inside China. Their significance is not their share. It is that they are the only participants in this market with an approved companion diagnostic and a domestic price point, which means the Chinese PCR companion test is priced against a domestic supplier rather than against an imported kit. Every market in this cluster that has admitted a domestic companion manufacturer has seen its reagent price reset; the question for this field is whether that happens before the Chinese oncology label base is large enough to matter.
Value Chain
Value Chain and Revenue Model
The value chain in this market is unusual in one respect that governs everything else: the price is set before the product exists. A companion diagnostic is developed during a drug’s clinical programme, so its specification, its evidence package and its commercial terms are negotiated with the sponsor while the drug is still in trials. By the time the test reaches a payer it has an authorised price, a designated laboratory or kit, and a label obligation. There is no launch pricing decision to make.
The chain, stage by stage
| Stage | Function | Who captures the margin |
|---|---|---|
| Biomarker discovery and validation | Establish that a marker predicts response | Academic groups and the sponsor; rarely a diagnostic company |
| Assay development and analytical validation | Build and validate the test to regulatory standard | The device manufacturer; this is a cost centre until authorisation |
| Clinical utility and the drug trial | Run the test inside the pivotal study | Sponsor-funded; the diagnostic company is a supplier |
| Authorisation and labelling | Clear or approve the device; write it into the drug label | Nobody directly; it creates the right to earn |
| Manufacture of kits and reagents | Produce the authorised assay | Highest and most durable margin in the chain |
| Testing service | Run the test on a patient sample | Laboratory; thinner margin, higher revenue per event |
| Reimbursement | Convert the result into a paid claim | The payer decides; the chain captures what is allowed |
The consequence of that ordering is visible in the two pools this report separates. The kit is 58.85% of companion diagnostic revenue and carries the highest gross margin in the chain. The testing service is 41.15% and carries a lower margin on a higher ticket, because the laboratory’s cost base is people and instruments rather than a validated formulation.
Pharmacogenomics inverts the chain
Pharmacogenomic testing has no sponsor, no pivotal trial and no label. Its value chain starts at the guideline and ends at the claim, and the stage that captures the margin is the one that can produce an interpretation a clinician will act on. That is why the small, high-margin line in this market is interpretation software and clinical decision support – USD 570 million in 2025 – rather than the assay.
It is also why CPIC’s integration into the Epic genomics module matters commercially. An interpretation delivered inside the EHR at the point of prescribing is worth more than the same interpretation faxed to a physician, and the vendor that owns that integration owns the only defensible position in the field.
Revenue model and the placement question
Companion diagnostic kits are sold, not placed. Unlike the analyser-placement economics that govern haematology and immunoassay, a companion diagnostic runs on an instrument the laboratory already owns, so there is no capital sale to subsidise and no installed base to defend. The revenue is a straight kit sale or a straight service fee.
That is a materially better revenue model than the discipline reports in this cluster enjoy, and it is the reason this market’s growth converts into value at all. A haematology vendor that places an analyser at cost recovers it over seven years of reagent. A companion diagnostic vendor sells a kit against a label obligation from the first patient.
Where the chain is being re-cut
Two re-cuts are underway. The first is liquid biopsy, which removes the tissue acquisition stage entirely and moves the test to the reference laboratory’s own workflow – a shorter chain with fewer hands and a higher price, which is why the liquid biopsy line grows fastest in the product table. The second is the pan-tumour panel, which collapses many companion tests into one and removes the per-indication price premium. The first adds margin. The second removes it. Both are happening at once, and the net is the 9.72% the companion diagnostics field compounds at.
Investment Activity
Investment Activity
Capital in this market is being deployed in two directions that look contradictory until the pricing analysis is applied: into platforms and interpretable data, and away from single-marker assays.
The platform acquisitions
The pattern of the last three years is that the buyers are not diagnostic companies buying other diagnostic companies. They are platform owners buying content. Roche’s position in this market – USD 1,340 million, 32.06% of the companion diagnostics field – was assembled around Foundation Medicine rather than built assay by assay, and it is the only position that spans IHC, PCR and CGP. Illumina’s position is the same logic from the other end: own the sequencer, then accumulate the labelled content that makes the sequencer medically necessary.
What is being bought is not an assay franchise. It is the right to be on the label, accumulated across enough indications that the platform becomes the default. That is a data and evidence asset, and it is why R&D intensity in this field is higher than in any other report in this cluster.
R&D intensity as the tell
Roche spent CHF 2,052 million on divisional R&D against CHF 13,847 million of diagnostics sales in 2025 – 14.82% of sales. That is roughly three times the intensity of a core laboratory franchise and it is not directed at analytical chemistry. It is directed at evidence generation: demonstrating, trial by trial, that a test predicts a response. In this market research and development is not product development, it is the purchase of future labels.
The pharmacogenomic side attracts a different capital
Pharmacogenomic assets are bought for scale in claims processing and for health-system relationships rather than for technology. Myriad Genetics is the instructive case: a USD 824.5 million revenue base, a 2% decline in 2025, and a USD 8.1 million headwind traceable to one payer’s coverage decision. A business whose revenue can move by eight million dollars on a single coverage policy is not an attractive platform acquisition at scale until the coverage question is settled.
The capital that does flow into this half of the market goes into health-system programmes rather than test companies – pre-emptive genotyping at the population level, priced against avoided adverse drug events rather than against a claim. That is why the payer programme line in the end-market table triples while the fee-for-service panel line grows slowly.
Capital intensity
Capital intensity here is moderate and it is concentrated in validation rather than in plant. An assay line needs controlled-environment manufacturing, but nothing on the scale of a coagulation reagent franchise. The expensive asset is the evidence package and the authorised indication, and it is expensive in years rather than in capital. That has two consequences for the forecast: entry barriers are lower than in the closed-reagent disciplines, which is why the testing layer is fragmented; and the return on a successful label is high enough to keep funding, which is why the assay layer stays concentrated.
Technology & Innovation
Technology and Innovation
Four technologies carry this market, and three of them are mature. Innovation is not distributed evenly across the two fields, and the asymmetry explains the growth gap.
Immunohistochemistry: mature, and structurally capped
An IHC companion assay is an antibody, a staining protocol and a scoring rubric, read by a pathologist. The measurement has not changed in substance for two decades. Its role in this market is nonetheless secure, because for several indications it is still the only authorised test – PD-L1 expression for checkpoint inhibitors, HER2 for gastroesophageal adenocarcinoma – and a cheap test on existing equipment beats an expensive one that requires a sequencer.
What is capped is expansion. An antibody serves one marker and one indication. There is no group-labelling mechanism available to it, so it cannot benefit from the trend that drives the rest of the field. That is why IHC grows at less than half the market rate.
Real-time PCR: the volume workhorse
PCR companion assays are cheap, fast, closed and installed in every hospital molecular laboratory. They hold the largest installed base of any technology in this market. Their limitation is content: a PCR panel tests what it was designed to test, so each new biomarker requires a new kit and a new authorisation. PCR is the technology of the single-marker companion diagnostic, and it benefits from label proliferation one label at a time.
Comprehensive genomic profiling: where the value is migrating
A tissue CGP panel sequences hundreds of genes and reports variants against every label that names one. This is the technology that changes the market’s structure, because it decouples the number of patients tested from the number of tests sold. Illumina’s TruSight Oncology Comprehensive holds companion indications for RET fusions in thyroid cancer and for RET SNVs, MNVs, insertions and deletions in medullary thyroid cancer under a single authorisation supplement, alongside its wider group labelling. Thermo Fisher’s Oncomine Dx Express holds an ERBB2/HER2 activating-mutation companion indication in non-small-cell lung cancer.
The clinical logic is straightforward and the commercial logic is not. Clinically, sequencing once and interrogating many labels is better medicine than sequencing repeatedly as the disease progresses. Commercially, it converts a portfolio of per-drug tests into a single per-patient test, and the per-drug premium – the thing that made companion diagnostics a high-margin business – disappears into the panel price.
Liquid biopsy: the growth line
Circulating tumour DNA testing removes the tissue acquisition step. Guardant Health’s oncology franchise, at USD 683.6 million of revenue on approximately 276,000 tests in 2025, implies USD 2,477 per test – the highest realised price per test anywhere in this market, and 2.7 times the USD 916 its screening product earns. The premium is not for the technology. It is for the fact that a tissue test requires a biopsy and a liquid biopsy requires a blood draw, and the difference in logistics is worth more to the ordering oncologist than the difference in analytical sensitivity.
Pharmacogenomic interpretation: the only genuinely new content
The pharmacogenomic side of this market has one innovation frontier, and it is not the assay. It is the interpretation layer: the rules that turn a diplotype into a prescribing recommendation, delivered at the point of order. CPIC’s API already supports more than 80,000 monthly queries and is integrated into the Epic genomics module, and 128 healthcare institutions and 40 commercial laboratories report using its content.
The strategic significance is that this layer is where a vendor can differentiate, because the assay is a commodity and the interpretation is not. It is also where the payer’s objection is aimed: L38294’s refusal to cover combinatorial testing is a statement that the proprietary algorithm does not add value beyond the CPIC content it rests on. The innovation is real and the payer has priced it at zero. That is the single most important technology-commercial fact in the pharmacogenomics half of this report.
| Technology | Maturity | Growth character | Strategic significance |
|---|---|---|---|
| IHC and ISH companion assays | Mature | Volume-led, no expansion path | Cheap, fast, often the only authorised test |
| Real-time PCR companion assays | Mature | Label-by-label | Largest installed base; single-marker logic |
| Tissue comprehensive genomic profiling | Growth | Share capture across labels | Collapses per-drug premium into a panel price |
| Liquid biopsy CGP | Early growth | Setting migration | Removes tissue acquisition; highest price per test |
| Pharmacogenomic genotyping | Mature | Guideline-led, payer-capped | Commodity assay; menu set by coverage |
| Pharmacogenomic clinical decision support | Early growth | EHR integration | Only defensible position in the field; payer has priced it at zero |
Market Risk
Market Risk
This market’s risk is concentrated in one variable per field, and the two are almost uncorrelated. That is the reason the combined forecast is smoother than either component.
1. Coverage risk in pharmacogenomics – high
The governing document is LCD L38294, effective 26 July 2020 and revised 2 October 2025. Its structure is the risk: gene-by-single-gene testing is covered consistent with CPIC, and combinatorial testing is refused on the finding that there are insufficient data to support coverage for any such test. That is not a temporary evidentiary position that more studies will obviously overturn. It is a statement that a proprietary interpretation algorithm is not independently valuable beyond the CPIC content it rests on.
The transmission is direct and evidenced. Myriad’s 2025 full-year revenue fell 2%, of which USD 8.1 million was attributable to one payer discontinuing GeneSight coverage in commercial and managed Medicaid. A coverage decision is a revenue event in this field with no offsetting lever. A vendor cannot discount, bundle or out-compete its way back into a claim the contractor has decided not to pay.
2. Price compression through group labelling – high
The companion diagnostics half is exposed to the opposite risk: not that the payer refuses, but that the payer agrees to a lower price because the test is no longer specific to one drug. Every group indication authorised converts a per-drug test into a per-patient test. The revenue per test in this report is forecast to fall from USD 158.60 to USD 134.97 across the combined market, and essentially all of that decline sits in the companion diagnostics field.
This risk is structural rather than event-driven, which makes it harder to see and easier to under-price. It will not appear as a single announcement. It appears as a sequence of authorisation supplements, each of which is individually good news.
3. Regulatory pathway risk on laboratory-developed tests – moderate, and asymmetric
The LDT rule was vacated in the Eastern District of Texas on 31 March 2025 and the FDA reverted to the prior framework on 19 September 2025. For this market the effect is double-edged. It removed a premarket burden from the testing half, which is why the reference laboratory model is currently viable at scale; and it left the payer as the only gatekeeper, which is why coverage risk dominates the risk table.
A future administration could reinstate a premarket pathway. That would raise the barrier to entry in testing, favouring the large reference laboratories, and would probably raise realised prices by shrinking the supply of test providers. The asymmetry is that the downside for incumbents is smaller than it looks and the downside for small laboratories is terminal.
4. Concentration risk – moderate
USD 5,220 million of a USD 6,820 million market attributes to twelve participants, and the top five hold 47.36%. Roche’s USD 1,340 million is 19.65% of the whole market. Conversely the buyers are concentrated too: consolidated reference networks and national health systems negotiate as single entities, and a single national coverage determination can move a third of the pharmacogenomic field.
5. Technology substitution – high
Two substitutions run in opposite directions. Pan-tumour sequencing substitutes for the single-marker companion assay, which is a substitution within this market that moves value from IHC and PCR to CGP. And pharmacogenomic panels substitute for nothing – they either displace a single-gene test the payer already funds, in which case the revenue is neutral at best, or they displace no test at all, in which case the payer has no reason to pay.
6. Geopolitical and tariff exposure – moderate
Lower than in the reagent-driven disciplines, because the physical product is small and light and much of the value is intellectual. The exposure that matters is data localisation: genomic data cannot move freely across borders, so a testing service is jurisdiction-bound in a way a kit sale is not. That favours regional laboratory capacity and penalises a single global reference hub.
| Risk | Level | Transmission channel | Evidence |
|---|---|---|---|
| Pharmacogenomic coverage | High | Coverage determination, direct to revenue | L38294 refuses combinatorial coverage; Myriad USD 8.1m headwind |
| Group-labelling price compression | High | Per-drug premium lost to panel price | Revenue per test USD 158.60 to USD 134.97 |
| LDT regulatory pathway | Moderate, asymmetric | Premarket burden shifts entry cost | Vacatur 31 March 2025; reversion 19 September 2025 |
| Concentration | Moderate | Top five 47.36%; Roche 19.65% | Attributed pool table |
| Technology substitution | High | CGP displaces single-marker assays | IHC growth below half the market rate |
| Geopolitical and data localisation | Moderate | Genomic data residency; jurisdiction-bound services | Regional laboratory capacity |
What would move the forecast: one thing at scale. A national coverage determination funding multi-gene pharmacogenomic testing would take the 2033 value to USD 14,600 million. Nothing in the companion diagnostics half can move the total by a comparable amount, because its constraint is the rate at which labels accumulate and that rate has been steady for six years.
Regulatory Landscape
Regulatory Landscape
This market is unusual in that the regulator who matters most is not a device regulator. For companion diagnostics the gatekeeper is the drug label; for pharmacogenomics it is the coverage determination. Both are regulatory instruments and neither is administered by a devices authority.
United States – device authorisation and the label
A companion diagnostic reaches the market through the premarket approval pathway, with a small number of De Novo requests where no predicate exists. The FDA maintains the authorised list and now separates devices indicated for a specific therapeutic from those with group labelling for a group of oncology therapeutics. That separation is the regulatory expression of the commercial shift described in this report: group labelling is what allows one device to serve many drugs, and it is authorised by design rather than tolerated.
Two 2026 actions illustrate the field’s direction. TruSight Oncology Comprehensive added companion indications for RET fusions and RET SNVs, MNVs, insertions and deletions in thyroid and medullary thyroid cancer under a single supplement. Elecsys HBsAg II quant II RxDx was authorised by De Novo request in October 2026 for chronic hepatitis B – a companion diagnostic in a viral disease, which is the first clear signal that the category is no longer an oncology instrument.
The authorisation is only half the regulatory act. The device must also be written into the therapeutic’s labelling, and that is done by the drug’s sponsor. A companion diagnostic therefore has two regulators acting in sequence, and the second one is a pharmaceutical company.
United States – the laboratory-developed test question
Much companion diagnostic testing and most pharmacogenomic testing is performed as a laboratory-developed test. The FDA’s rule extending device regulation to LDTs was vacated in the Eastern District of Texas on 31 March 2025 and the agency reverted to the prior framework by notice on 19 September 2025.
The market consequence is decisive and is the reason this report treats coverage as the primary regulatory variable. With no premarket review, a laboratory may validate and offer a pharmacogenomic panel; with no coverage, it will not be paid for it. The regulatory barrier moved from the laboratory to the claim.
United States – coverage as the operative regulation
LCD L38294, effective 26 July 2020 and revised 2 October 2025, governs Medicare coverage of pharmacogenomic testing across the MolDx jurisdictions. Its structure is a two-tier determination: gene-by-single-gene testing covered consistent with CPIC, and combinatorial testing refused because the contractor found insufficient evidence that a proprietary algorithm establishes independent validity and utility beyond the CPIC content it rests on.
For a vendor, this is a more binding constraint than any device pathway, because it applies to a test that may never require a device authorisation at all. It also explains the shape of the market: single-gene and HLA testing is larger than the panel business in this report’s construction, and grows more slowly, because it is the part the payer has agreed to fund.
European Union – IVDR
Under Regulation (EU) 2017/746 companion diagnostics classify in the higher risk bands and require notified body conformity assessment, with the added requirement that the medicinal product authority be consulted. That is a heavier pathway than the FDA’s in one respect that matters commercially: the device assessment is tied to the therapeutic it accompanies, so a label change on the drug can reopen the device file.
The practical effect is to advantage manufacturers with an established notified body relationship and to raise the fixed cost of holding a broad menu. It reinforces the concentration in the assay layer, and it is one reason the European pharmacogenomic market is more fragmented than the American one: coverage is decentralised, so a panel refused by one national payer is not refused by all of them.
China – NMPA and the domestic price point
NMPA approval is a conventional device pathway and there is no equivalent of a coverage-based refusal on the American model. The regulatory instrument that matters is the price. A domestically approved companion diagnostic from Amoy Diagnostics or Burning Rock prices against an imported kit, and every discipline in this cluster that has admitted a domestic competitor has seen its price reset.
Japan – a reimbursed pathway with a fixed price
Comprehensive profiling is reimbursed through a national pathway at a set price, which produces high adoption and no price growth. The market is mature and its population is shrinking, which is why Japan is the slowest region in this report.
| Jurisdiction | Device pathway | Operative price instrument | Binding constraint |
|---|---|---|---|
| United States – companion diagnostics | PMA, or De Novo where no predicate | Label obligation plus launch negotiation | Accumulation of authorised labels |
| United States – pharmacogenomics | None where performed as an LDT | LCD L38294 coverage determination | Refusal of combinatorial coverage |
| European Union | IVDR, notified body, medicinal product consultation | Decentralised payer negotiation | Notified body capacity and per-assay cost |
| China | NMPA registration | Domestic competitive price point | Domestic companion manufacturers |
| Japan | PMDA approval | National reimbursement at a fixed price | Mature market; demographic contraction |
The regulatory conclusion
The two halves of this market are regulated by two different states of matter. A companion diagnostic is governed by permission – the label says the test is required, and the market exists because a regulator and a sponsor agreed. A pharmacogenomic test is governed by payment – it may be sold without permission and earns nothing without agreement. One field’s regulator creates its market. The other field’s regulator caps it.