
Global Quick Commerce & Instant Retail Market Report, Size, Share and Forecast 2026–2033: USD 228 Billion, and Only One Dollar in Seven Moves Through a Dark Store
Executive Summary
Instant retail — a consumer order placed online and fulfilled from local inventory inside a two-hour promise — transacted USD 203.6 billion of goods in 2025 and USD 228.2 billion in 2026. Pheonix Research forecasts USD 598.0 billion by 2033, a 14.42% CAGR, on volume that rises from 14,440 million to 41,935 million orders at 14.26%.
The margin between those two numbers is the first finding, and it is smaller than the industry's own rhetoric implies. 14.26 of the 14.42 percentage points of value growth come from more orders. 0.16 points come from a larger basket. Over eight years the blended order value moves from USD 14.10 to USD 14.26 — eleven cents a year. Instant retail is not becoming a richer channel per transaction. It is becoming a more frequent one, and everything the operator does to widen the basket is being given back in entry-price competition and subsidy.
The market is 62% China, and China is not a dark-store market
China accounted for 62.4% of 2026 value. The Ministry of Commerce Research Institute put Chinese instant retail at RMB 781 billion in 2024, up 20.15%, projected it to break RMB 1 trillion in 2026 and to reach RMB 2 trillion by 2030 at an average 12.6% through the fifteenth Five-Year Plan. That trade is overwhelmingly fulfilled from existing supermarkets and convenience stores through Meituan Instashopping, JD Daojia and Ele.me, not from dedicated micro-warehouses.
The United States is 19.3% and is also store-picked. Instacart alone ran USD 10,528 million of GTV in Q3 2026 across 91.4 million orders, an average order of USD 115.19, on a platform that owns no inventory and leases no dark store.
India is 6.2% of global value and is the only large market where the dark store is the default node. Blinkit ended June 2026 with 2,443 stores and INR 17,132 crore of net order value in the quarter, up 86%, extracting roughly INR 770,000 of order value per store per day. Zepto ran 1,139 stores and Swiggy Instamart 1,143 at the end of FY26. Nowhere else has built the format at this density, and nowhere else has the cost base that goes with it.
That asymmetry is the whole investment question
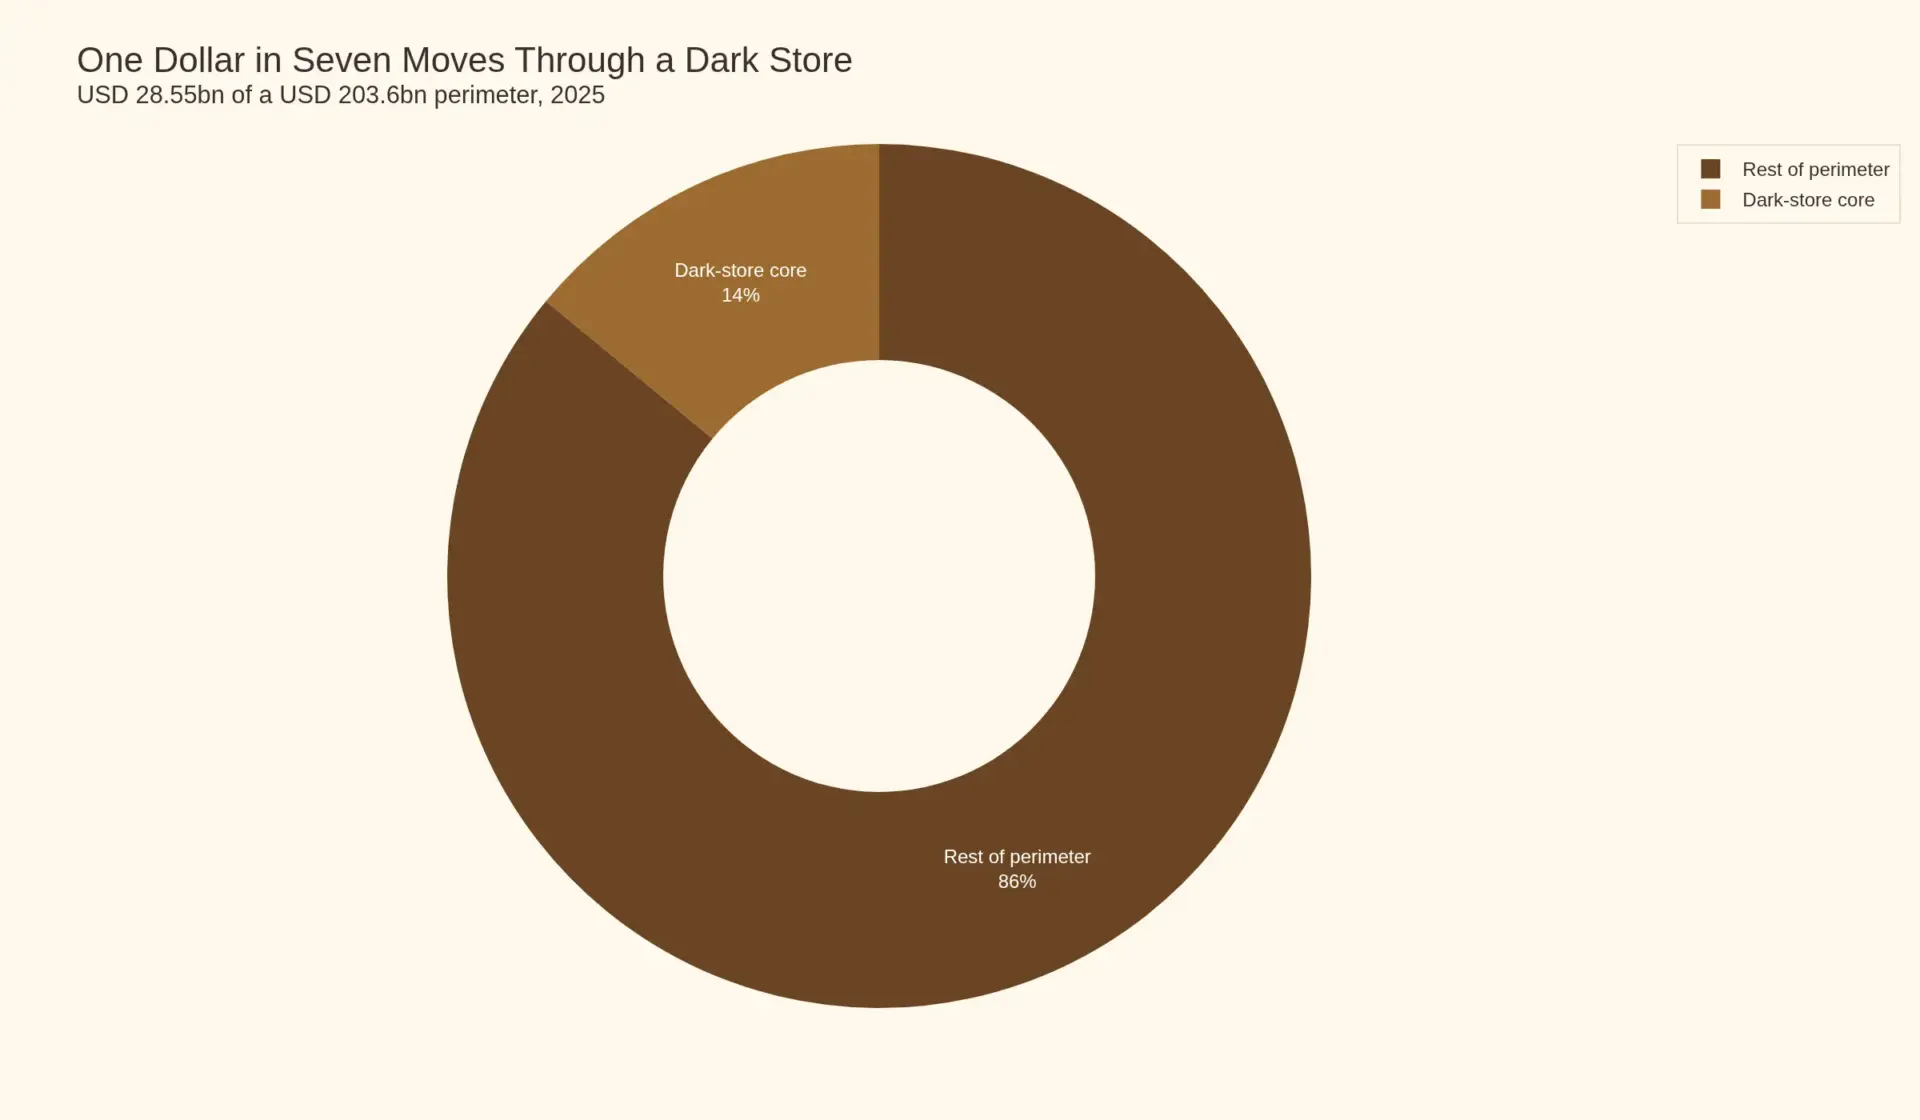
Pheonix Research puts the dedicated dark-store segment — the part of instant retail fulfilled from a node that holds no retail frontage — at roughly USD 32 billion in 2026, 14.0% of the market. One dollar in seven. The other six are picked off a shelf that already existed, by a person already employed, in a building already paying rent.
So the two models do not fail or succeed for the same reasons. Store-picked instant retail is a take-rate and density business: Instacart converts GTV into 10.4% of revenue, of which 3.1 points is advertising, and turns a 3.2% adjusted EBITDA margin on GTV. Dark-store quick commerce is a fixed-asset throughput business: it carries rent, fit-out, cold chain and its own labour before a single order arrives, and it breaks even on orders per store per day, not on take rate.
That is why the category's profit records and its losses sit in the same market. In FY26 Blinkit lost INR 277 crore, Instamart INR 3,511 crore and Zepto INR 5,042 crore on an adjusted EBITDA basis. By the June 2026 quarter Blinkit was at +INR 102 crore, 0.6% of net order value — its fifth consecutive quarter of improvement — while the other two were still structurally negative.
Consolidation has already started at the top of the store-picked market
On 29 October 2026 DoorDash agreed to acquire Instacart in a cash-and-stock transaction valuing the grocery platform at approximately USD 17 billion of equity. The largest neutral instant-retail fulfilment network in the West is being absorbed by the largest restaurant-delivery network in the West. In Europe the reversal completed earlier: Getir and Gorillas withdrew from Germany entirely, leaving Flink — now working closely with REWE — as the only independent rapid-delivery operator of scale, while EDEKA's delivery runs on Picnic's fixed-round model and REWE runs the largest full-range service.
Both outcomes describe the same thing. The format that won is the one that borrowed somebody else's shelf.
What this report forecasts, and what it does not
The USD 598.0 billion 2033 figure is a build of eight regional components, each derived from disclosed platform order value where the platform discloses it and from dark-store count, throughput and basket where it does not. It is not an extrapolation of a published third-party total, and Pheonix Research does not take a published market estimate as an input. Where a national statistician measures the category on a wider perimeter than this report — as China's does, including all store-fulfilled local retail — the difference is disclosed rather than reconciled away.
The single largest risk to the forecast is not demand. It is that the subsidy competition which built the volume is not a permanent feature of the market, and that a market normalised for subsidy grows more slowly than 14.42% and earns more. Both outcomes are modelled; the base case assumes partial normalisation in China from 2027 and continuing competition in India through 2028.
Market Overview and Definition: Two Perimeters, Not One
There is no single number for the size of this market, and the reason is not disagreement about the data. It is disagreement about what the market is. Four figures circulate for the global quick commerce market in a single year, and they differ by a factor of five, because each one counts a different set of transactions and none of them says so on the cover.
This report resolves that by refusing to resolve it. It publishes two perimeters, sizes both, and never adds them together.
The broad perimeter: all instant retail
Instant retail is a consumer order placed online and fulfilled from local inventory inside a sub-two-hour promise. It covers two fulfilment architectures that behave nothing alike:
- Store-picked. The order is assembled by a person walking the aisles of a supermarket, convenience store or pharmacy that was already trading before the order arrived. The platform supplies demand, dispatch and payment; the retailer supplies the inventory and the shelf. Instacart, Meituan Instashopping, JD Daojia, Ele.me, DoorDash's grocery category and Uber Eats' grocery category all work this way. So does almost all of China's instant retail trade.
- Dark-store. The order is assembled in a warehouse with no retail frontage, leased and fitted out by the operator, stocked with its own inventory, staffed by its own pickers, and served by its own rider fleet or a contracted one. Blinkit, Zepto, Swiggy Instamart, Gopuff, Flink and Getir's residual operations work this way. So does almost all of India's.
Both are instant retail. Both compete for the same order. Neither can be run with the other's cost structure, and a market share figure that blends them tells you nothing about who is making money.
The core perimeter: the dark store
Pheonix Research separates out the portion of instant retail fulfilled from a dedicated micro-fulfilment node — no retail frontage, operator-owned inventory. On our build that is approximately USD 32 billion in 2026, or 14.02% of the broad market. Roughly one dollar in seven.
| Core perimeter component, 2026 | USD bn | Basis |
|---|---|---|
| India | 14.1 | Wholly dark-store. At end-FY26 Blinkit operated 2,243 stores, Zepto 1,139 and Instamart 1,143 - 4,525 between them - with Blinkit at 2,443 by June 2026 and Flipkart Minutes and Amazon Now both scaling behind. |
| China | 8.5 | Pheonix estimate. Self-operated inventory arms of the platforms, roughly 6% of the RMB 1,010bn total. |
| United States | 4.5 | Pheonix estimate. Gopuff, Amazon Now and DashMart-format nodes. |
| Europe | 2.4 | Pheonix estimate. Flink, and the residual Getir estate outside the markets it exited. |
| Rest of world | 2.5 | Pheonix estimate. MENA, Latin America, Southeast Asia dark-store operations. |
| Core total | 32.0 | 14.02% of the broad perimeter |
The India line is the only one in that table built entirely from disclosed store counts and disclosed order value. The other four are Pheonix estimates and are labelled as such. They are the weakest numbers in this report and they are also the most important, because the entire debate about whether quick commerce works economically is a debate about the dark store, and roughly six-sevenths of the market does not have one.
The broad market in 2026, by region
| Region | 2026, USD bn | Share | Basis of the figure |
|---|---|---|---|
| China | 142.3 | 62.4% | Ministry of Commerce Research Institute series: RMB 781bn in 2024, projected through RMB 1tn in 2026. Converted at RMB 7.10. |
| United States | 44.0 | 19.3% | Pheonix estimate. Instacart's annualised GTV of USD 42.1bn includes pickup and scheduled orders outside this perimeter, so its sub-two-hour share is modelled at about USD 26bn, plus about USD 18bn for DoorDash, Uber Eats, Gopuff, Amazon and Walmart on-demand. |
| India | 14.1 | 6.2% | Platform disclosed order value for the three listed operators, plus Flipkart Minutes and Amazon Now. |
| Europe | 10.4 | 4.6% | Pheonix estimate. REWE, Picnic, Flink, Amazon Fresh, plus retailer-operated services. |
| Southeast Asia, Japan, Korea, ANZ | 8.0 | 3.5% | Pheonix estimate. |
| Middle East and North Africa | 4.0 | 1.8% | Pheonix estimate. |
| Latin America | 3.6 | 1.6% | Pheonix estimate. |
| Rest of world | 1.8 | 0.8% | Pheonix estimate. |
| Total | 228.2 | 100% |
Two numbers in that table do most of the work. China at 62.4% means this is not a Western category with an Asian tail; it is an Asian category with a Western limb. India at 6.2% means the market that has generated most of the operational literature on quick commerce — the interview quotes, the unit-economics arguments, the dark-store throughput benchmarks — is a small fraction of the volume. Global generalisations drawn from Indian dark-store economics are generalisations from one seventh of the trade.
Forecast 2025–2033
| 2025 | 2026 | 2030 | 2033 | CAGR 2025–33 | |
|---|---|---|---|---|---|
| Value, USD bn | 203.6 | 228.2 | 410.0 | 598.0 | 14.42% |
| Volume, million orders | 14,440 | 16,008 | 28,200 | 41,935 | 14.26% |
| Derived basket, USD | 14.10 | 14.26 | 14.54 | 14.26 | 0.14% |
The basket line is the one to read twice. Over eight years the blended order value moves by sixteen cents. The 14.42% value CAGR decomposes into 14.26 points of more orders and 0.16 points of larger baskets. Instant retail is growing by frequency, not by richness, and the direction of travel in the composition is toward smaller average orders as the mix shifts toward the low-basket Asian markets that are adding most of the incremental volume.
That has a direct consequence for anyone modelling the revenue side. If basket is flat in nominal USD while every operator is adding subsidy, delivery fee competition and coupon depth, then platform revenue per order is under pressure even where gross order value is compounding at double digits. The two lines in the table are not the same business.
What is excluded
- Scheduled and next-day grocery e-commerce. A next-day delivery from a fulfilment centre several hundred kilometres away is not instant retail, even when the same app sells it. Walmart's and Amazon's mainstream grocery operations sit mostly here.
- Restaurant food delivery. Prepared food is a different demand curve, a different cost base and a different regulatory treatment. DoorDash's restaurant business is counted only where it moves retail goods.
- Click-and-collect. The consumer travels; there is no delivery promise to keep.
- B2B and wholesale. Out of scope throughout.
The perimeter matters most at the boundary between the first two items on that list. A platform that fulfils retail goods from a supermarket shelf within 40 minutes belongs here; the same platform fulfilling the same goods from a distribution centre overnight does not, and a single company will do both in a single quarter without distinguishing them in its disclosure. Where that ambiguity is unavoidable, this report takes the narrower reading and says so.
Articles on this market
Eleven pieces of analysis support the six reports in this cluster. Each takes a single finding and argues it.
- China's average order falls 1.22% a year — and that is the model working, not failing.
- Where China put its 2025 subsidy decided its market size — the accounting of where a subsidy lands.
- Europe's advertising line earns more per order than delivery — EUR 1.67 against EUR 1.02.
- Europe is the only market that contracted and then grew — a halving of share that is not weakness.
- 8,400 dark stores and not one is getting busier — the growth decomposition behind the 10.51%.
- The per-store-per-day benchmark does not predict profit — the busiest network, the largest loss.
- 1.69% of the grocery bill as advertising, 2.46% by 2033 — the take rate and what caps it.
- 7.23% against 3.1%: two advertising businesses, two denominators — why the rates are not comparable.
- India's three platforms report three different order values — net, gross, and what includes advertising.
- Zepto pushes 2,140 orders through each store a day — Blinkit pushes 1,357 and makes money.
- Every India estimate agrees on 2025 and splits on 2033 — the gap is three definitions.
Sources
The figures in this report are taken from the primary documents below.
- Eternal Limited, quarterly shareholders' letters — Blinkit net order value, store counts and order counts.
- Instacart (Maplebear Inc.), Form 10-Q for the quarter ended 30 September 2026 — gross transaction value and order count.
- Zepto Limited, UDRHP-I filed with SEBI, June 2026 — net order value, store count and advertising revenue.
- Swiggy Limited, financial results and shareholders' letters — Instamart order value and orders per store.
- Meituan, quarterly results — Instashopping segment disclosure.
- Ministry of Commerce Research Institute, Instant Retail Industry Development Report (2025) — the official Chinese series, published 25 November 2025: RMB 781.0 billion in 2024, up 20.15%, and the RMB 2 trillion 2030 target.
Table des matières
Table of Contents
- Market Overview and Definition: Two Perimeters, Not One
- Market Sizing, Structure and Forecast 2025–2033
- Value Chain and the Fulfilment Node
- Technology, Automation and the Shift to Inventory Ownership
- Competitive Landscape
- Regulatory Landscape
- Investment Activity and Capital Flows
- Market Risk, Substitution and Concentration
- Regional and Country Analysis
- Research Methodology and Sources
Figures are in USD unless stated. Value is retail value of goods transacted (gross or net order value as the operating platform reports it), not platform revenue. Volume is orders. Base year 2025, forecast year 2033.
Paysage concurrentiel
Competitive Landscape
Instant retail is oligopolistic everywhere and nowhere in the same way. Each of the four large markets has resolved into three or fewer operators of scale, but the three are not the same kind of company, do not compete on the same variable, and in two of the four cases have already finished consolidating.
China: three platforms, one subsidy war, and a regulator-arranged peace
Meituan Instashopping, JD Daojia and Ele.me account for effectively all of China’s instant retail trade. All three fulfil from existing retail supply rather than dedicated dark stores, which means they compete on merchant coverage, rider density and price rather than on real estate.
The 2025–26 period was defined by subsidy competition severe enough to move the incumbents’ consolidated profit and loss. Meituan reported a net loss of RMB 6.827 billion in Q1 2026. By Q2 2026, reported on 28 August, the company posted RMB 104.63 billion of revenue, up 14.4%, and RMB 2.155 billion of net profit, with core local commerce revenue of RMB 71.53 billion, up 10.1%, and segment operating profit of RMB 5.668 billion at a 7.9% margin — a sequential swing of nearly RMB 7.7 billion against the prior quarter’s operating loss.
Three things drove that reversal, and all three are structural rather than cyclical. Subsidy intensity fell after regulators guided the industry away from what Chinese policy language calls involutionary competition. Order mix improved as the platforms stopped chasing low-value orders. And Meituan disclosed that per-order profit for non-food instant retail turned positive, with Flash Purchase’s revenue growing faster than its order volume because brands were shifting advertising budgets onto instant retail platforms.
That last point is the most important competitive fact in China. When subsidy is the only differentiator, the platform with the cheapest capital wins. When advertising becomes a material revenue line, the platform with the most traffic and the best search intent wins, and that advantage compounds. The Chinese market is in the middle of that transition and the margin recovery is the evidence.
United States: the shelf is being bought
On 29 October 2026 DoorDash agreed to acquire Instacart in a cash-and-stock transaction with an equity value of approximately USD 17 billion. Instacart’s own Q3 2026 numbers explain why it was available at that price and why the buyer wanted it:
| Instacart | Q3 2025 | Q3 2026 | Change |
|---|---|---|---|
| GTV, USD m | 9,170 | 10,528 | +15% |
| Orders, million | 83.4 | 91.4 | +10% |
| Average order value, USD | 109.95 | 115.19 | +4.8% |
| Advertising and other revenue, USD m | 269 | 331 | +23% |
| Adjusted EBITDA, USD m | 278 | 342 | +23% |
Instacart grew GTV 15% and orders 10% — meaning 4.8% of its growth came from customers buying more per order, not from more customers. In a category where the global basket is flat, that is an outlier, and it is an outlier because grocery inflation was passed through and because the platform’s assortment widened into higher-value categories. Its advertising revenue grew at more than double its transaction revenue, and its adjusted EBITDA grew at exactly the rate of its advertising line.
The consolidation logic is straightforward. DoorDash owns the restaurant-delivery demand and the courier fleet; Instacart owns the grocery shelf and the retail media attached to it. Neither can easily build the other’s. The combined entity would hold the largest instant-retail demand pool outside China, and the deal is a statement that in a mature market the winner is the operator that controls both the demand and the shelf rather than the one that owns the most warehouses.
It also removes a competitor from the store-picked field. Uber Eats, Amazon and Walmart’s on-demand services now face a single larger rival in the United States, and the strategic question for each of them shifts from share gain to whether they need their own platform at all.
India: one profitable operator and two that are not
India is the most intensively disclosed dark-store market in the world and the only one where the three operators publish enough to be compared directly. On Q4 FY26 net order value:
| Operator | NOV, INR crore | Share | Dark stores | Orders, million | Orders per store per day |
|---|---|---|---|---|---|
| Blinkit (Eternal) | 14,386 | 52.0% | 2,243 | 273.9 | 1,342 |
| Zepto | 7,591 | 27.5% | 1,139 | 210.0 | 2,140 |
| Swiggy Instamart | 5,674 | 20.5% | 1,143 | 112.6 | 1,093 |
| Three-platform total | 27,651 | 100% | 4,525 | 596.5 | 1,413 |
The table contains the whole argument of the Indian market. Zepto runs roughly half the store estate of Blinkit but extracts 2,140 orders per store per day against Blinkit’s 1,342, because its average order value is materially lower and its catchments are denser. That is a deliberate strategy and it has a cost: Zepto’s FY26 adjusted EBITDA loss was INR 5,042 crore against Blinkit’s INR 277 crore and Instamart’s INR 3,511 crore. High throughput on a thin basket produces volume without producing contribution.
By the June 2026 quarter the divergence had widened rather than narrowed. Blinkit reported INR 17,132 crore of net order value, up 86%, with adjusted EBITDA of plus INR 102 crore at 0.6% of net order value — its fifth consecutive quarter of improvement — on only 200 net new stores. Growth was coming from throughput, not from the estate.
Behind the three, two challengers with structurally different assets are entering. Flipkart Minutes was adding roughly 100 dark stores a month and expected to reach about 1,200 by June 2026, and Amazon Now had announced plans to exceed 100 cities and 1,000 dark stores. Both have existing e-commerce demand to seed the network and neither has to build the customer from scratch — which is precisely the advantage that took Blinkit, Zepto and Instamart three years and several billion dollars to construct.
Europe: the market already decided, and it decided against the dark store
Europe is the one large market where consolidation is complete and the outcome is unambiguous. Getir and Gorillas withdrew from Germany entirely. Flink survived as the only independent rapid-delivery operator of consequence and now works closely with REWE. EDEKA’s delivery runs on Picnic’s fixed-round model rather than on a rapid promise. REWE operates the largest and most stable full-range service.
The reasons the rapid operators lost are consistent across every post-mortem: personnel costs that were high relative to a small basket, expensive inner-city micro-warehouses, routes too unpredictable to keep capacity utilised, and marketing spend needed to generate spontaneous orders. In short, too little revenue per order against too high a fixed and operating cost base.
The European market that survived is smaller, planned and hybrid: predictable delivery windows, larger baskets, a combination of home delivery and pickup points, and deep integration between the retailer’s stores and its digital channel. It is a real business. It is not the business the sector was built to pursue.
The variable that decides all four
Every one of these markets was decided by the same arithmetic, applied to different cost inputs. The operator that could reach the highest order density per unit of fixed cost won. In India that meant orders per store per day. In China it meant orders per rider-hour at peak. In the United States it meant orders per existing supermarket. In Europe it meant whether the fixed cost base could be paid for at all.
This is why market share in instant retail is a lagging indicator. The leading indicator is throughput against the fixed block, and no operator discloses it directly. It has to be derived, which is what the table above does.
Chaîne de valeur
Value Chain and the Fulfilment Node
The value chain of instant retail has six steps, and the entire economics of the industry is decided at the fourth of them — the pick. Everything upstream is demand generation, which is expensive but variable; everything downstream is delivery, which is expensive but variable. The pick is where a fixed cost becomes a committed cost, and it is the only step where the two fulfilment architectures actually diverge.
- Demand generation. App acquisition, paid media, couponing, membership. Variable, but with a high fixed component in brand.
- Assortment and inventory positioning. Deciding which 2,000, 8,000 or 30,000 lines sit at which node. In a store-picked model this step is largely a data problem — the retailer already holds the inventory. In a dark-store model it is a capital and working-capital commitment.
- Order capture and payment. Low margin, increasingly commoditised, and nationally controlled by UPI in India and by WeChat Pay and Alipay in China.
- Pick and pack. The node. Either a supermarket aisle or a warehouse floor.
- Dispatch and rider assignment. Batching, routing, capacity management against peaks.
- Last mile and returns. The cost that the two-hour promise is actually a promise about.
The store-picked chain: the platform sells access to a shelf it does not own
In the store-picked model the platform never buys the goods. It sells the retailer incremental demand and it sells brands incremental visibility, and it takes a fee on both. Instacart’s Q3 2026 disclosure is the cleanest arithmetic available for this model anywhere in the world:
| Instacart, Q3 2026 | USD m | % of GTV |
|---|---|---|
| Gross transaction value | 10,528 | 100% |
| Transaction revenue | 764 | 7.3% |
| Advertising and other revenue | 331 | 3.1% |
| Total revenue | 1,095 | 10.4% |
| Adjusted EBITDA | 342 | 3.2% |
Read the rows in order. The platform converts USD 100 of somebody else’s groceries into USD 10.40 of its own revenue. Nearly a third of that revenue — 3.1 points of the 10.4 — is advertising rather than transaction fee, and advertising grew 23% against transaction revenue’s 14%. The gross margin on the advertising line is close to total; the margin on the transaction line is not. That is why Instacart’s USD 342 million of adjusted EBITDA exists at all, and why a store-picked operator can be profitable at a 7.3% transaction take that no dark-store operator could survive on.
China runs the same architecture at a completely different scale. Meituan’s core local commerce segment — food delivery plus Instashopping — reported RMB 71.53 billion of revenue and RMB 5.668 billion of segment operating profit in Q2 2026, a 7.9% margin, on revenue that grew 10.1%. The company disclosed that Flash Purchase’s revenue grew faster than its order growth, and attributed part of that to more brands moving advertising budgets onto instant retail platforms. That is the same sentence as Instacart’s advertising line, in a different currency.
The dark-store chain: the platform buys the goods and rents the shelf
In the dark-store model the operator takes on inventory, lease, fit-out, cold chain, packing labour and dispatch capacity before the first order. The node is small — typically 1,500 to 2,500 square feet in the Indian metros — because the promise is not storage efficiency but proximity: a catchment of roughly two to three kilometres, which sets the maximum size of the estate needed to cover a city.
What that node can produce is bounded and measurable. Blinkit’s June 2026 quarter gives the cleanest figure in the public record:
| Blinkit | Q4 FY26 | Q1 FY27 |
|---|---|---|
| Dark stores, end of period | 2,243 | 2,443 |
| Net order value, INR crore | 14,386 | 17,132 |
| Orders, million | 273.9 | not disclosed |
| Orders per store per day | 1,342 | — |
| Order value per order, INR | 525 | — |
| Order value per store per day, INR | 704,850 (derived) | 770,625 |
The last row is computed two ways and the two routes agree within nine per cent. In Q4 FY26, 1,342 orders at INR 525 gives INR 704,850. In Q1 FY27, INR 17,132 crore across 2,443 stores across 91 days gives INR 770,625 directly. Throughput rose while store additions decelerated to 200 net new nodes — which is the single most important operating fact in the Indian market, and the reason Blinkit’s adjusted EBITDA turned positive in the same quarter.
Against that INR 770,000 of daily order value sits a cost base that is fixed at the size of the store, not the volume through it: rent in a metro catchment, four to six staff across two shifts, electricity and cold chain, warehouse management and scanning technology, and rider capacity that has to be available at the 8pm peak whether or not it is used. Because the fixed block does not flex, the profit or loss of a single store is almost entirely a function of orders per day, and every operator’s estate therefore has a distribution of good stores and bad ones rather than an average.
That is why the format closes underperformers within weeks rather than quarters. A store that is not clearing its fixed block is not a slow store; it is a store that will never clear it, because the catchment’s demand is what it is.
The shift that changes the chain: inventory ownership
The most important structural change in the industry in 2026 was not a growth rate. It was Blinkit’s move to a first-party model in quick commerce, disclosed in its Q1 FY27 letter. Adjusted revenue grew 173% year on year, of which like-for-like growth was 66%; the difference is the accounting consequence of the platform now including the full monetary value of goods sold in revenue, where previously it recognised largely marketplace commission.
That conversion does not change the order book, the stores or the customers. It changes what the platform is. A first-party operator is a retailer with a technology layer, and it carries inventory risk, shrinkage, markdown and working capital. A marketplace is a toll road with no inventory at all. The two have different gross margins, different cash conversion, and different failure modes — and a reader comparing Blinkit’s revenue growth to a marketplace operator’s without noticing which is which will conclude something false.
Zepto’s FY26 disclosure gives the other side of the same shift. Revenue from operations of INR 22,624 crore grew 104% while orders grew 93% and advertising revenue grew 151% to INR 1,636 crore, or 7.23% of operating revenue. Advertising is doing more of the work in the profit and loss than transaction economics are, and it is growing faster than either revenue or volume.
What the chain tells you to look at
Four numbers, in this order: orders per store per day, order value per store per day, advertising as a percentage of revenue, and the split between transaction take and advertising take. The first two tell you whether the node works. The last two tell you whether the business works regardless of whether the node does.
On the current evidence, the only architectures that have demonstrated a durable profit are the ones that monetise a shelf they did not have to build. Every operator that built the shelf is still arguing about throughput.
Activité d'investissement
Investment Activity and Capital Flows
The capital cycle in instant retail has turned over twice already and is in the middle of a third turn. The first funded the build. The second punished it. The third is buying the assets the second one broke, at prices that assume the format works only where somebody else owns the shelf.
The valuation that reframes the sector
On 29 October 2026 DoorDash agreed to acquire Instacart in a cash-and-stock transaction valuing the grocery platform at approximately USD 17 billion of equity. Instacart’s own Q3 2026 run rate gives the multiple: USD 342 million of adjusted EBITDA in the quarter annualises to USD 1,368 million, so the deal prices the business at roughly 12.4 times run-rate adjusted EBITDA.
That is a mature multiple for a growth business, and the reason is visible in the growth rates. GTV up 15%, orders up 10%, advertising up 23%. A buyer is not paying for customer acquisition at that price; it is paying for the advertising line and the retailer relationships attached to it. Instacart earned USD 147 million of GAAP net income in the quarter and generated USD 307 million of free cash flow — a real business, priced as one.
India: primary capital, still being raised at growth multiples
Zepto’s updated draft red herring prospectus, filed 8 June 2026, sets out a fresh issue of INR 8,010 crore with named allocations that read as a map of what the format actually costs to operate:
| Zepto IPO use of proceeds | INR crore | Share of named allocations |
|---|---|---|
| Lease rentals | 1,735 | 28.9% |
| New dark stores | 1,629 | 27.1% |
| Technology | 1,325 | 22.0% |
| Acquisition pocket | 801 | 13.3% |
| Marketing | 520 | 8.7% |
| Named total | 6,010 | 100% |
The single largest line is lease rentals, not stores. That is the most revealing number in the document. A dark-store operator raising public money allocates more to paying rent on buildings it already occupies than to opening the buildings it plans to open, because the estate is a fixed obligation while the store rollout is discretionary. Anyone who models quick commerce as a capital-light technology business is contradicted by the issuer’s own prospectus.
The second observation is that new dark stores (INR 1,629 crore) and lease rentals (INR 1,735 crore) together take 56% of the named allocations, while technology takes 22% and marketing 8.7%. The format’s cost structure is property and buildings first, software second, customer acquisition a distant third — the reverse of the ordering the sector’s own narrative suggests.
What a store costs to build
Indian metro dark-store fit-out benchmarks published by fulfilment contractors put the all-in build — civil and electrical work, racking and bins, cold chain, and warehouse management technology — at roughly INR 8 to 15 lakh for a 1,500 to 2,500 square foot node. Applied across Blinkit’s 2,443 stores that is INR 195 crore to INR 367 crore of cumulative fit-out capital.
Set that against the estate’s daily output. At INR 770,625 of order value per store per day, Blinkit’s network is producing roughly INR 1,883 crore of order value a day. The fit-out capital is recovered against turnover in a matter of weeks. The reason the business was ever loss-making is therefore not the capital cost of the store — it is the fixed operating block: rent, staff, cold chain, electricity and rider capacity, all of which recur monthly whether or not the store clears its throughput threshold.
The second turn: what the write-offs bought
The European contraction destroyed more capital than the Asian expansion raised, and it did so in public. Getir and Gorillas exited Germany entirely; the format’s proponents had raised at valuations that assumed national coverage could be bought ahead of unit economics. The post-mortems converge on the same four causes — personnel cost against small baskets, expensive inner-city micro-warehouses, unpredictable routes producing idle capacity, and marketing spend needed to generate spontaneous orders.
The residue is instructive. Flink survived and now works closely with REWE. Picnic built a defensible position through EDEKA on fixed delivery rounds rather than a rapid promise. REWE operates the largest full-range service. The capital that survived went into businesses attached to an existing retail supply chain, and the capital that was destroyed went into businesses that had to build one.
Where the money is going in 2026
Three destination types, in descending order of disclosed size:
- Consolidation of store-picked networks. DoorDash–Instacart at USD 17 billion is the largest single transaction in the sector’s history and is a purchase of a shelf and an advertising business, not a warehouse network.
- Primary equity for dark-store operators in India. Zepto’s INR 8,010 crore issue, following Swiggy’s INR 10,000 crore capital raise for Instamart, is the last large slug of growth capital the format is likely to receive in a single market.
- Secondaries and distressed assets in Europe. Small, largely undisclosed, and concentrated in the transfer of leases and store fit-outs from failed operators to retailers.
Notably absent is large-scale investment in the mechanical automation of micro-fulfilment outside Europe and North America, which is consistent with the payback arithmetic: automation requires a wage rate high enough to justify replacing a picker, and the market adding most of the world’s dark stores does not have one.
What the capital cycle implies for 2033
The USD 598.0 billion forecast does not require another investment boom. It requires the estate that already exists to keep raising throughput, which is the cheapest growth available to any operator in this sector and the only kind that has ever produced a profit. The capital being raised in 2026 is funding lease obligations and inventory, not expansion at the rate the 2021 vintage assumed — and that is a healthier base for a seven-year forecast than the one it replaces.
Technologie et innovation
Technology, Automation and the Shift to Inventory Ownership
Instant retail is not a technology industry that happens to sell groceries. It is a logistics industry whose only defensible asset is the accuracy of a promise, and the promise is expensive to keep because it is short. Everything the sector builds is aimed at one of three problems: knowing what will be ordered, picking it faster, or getting it to the door inside the window without paying for idle capacity.
Problem one: knowing what will be ordered
A dark store holds a fraction of a supermarket’s range. In the Indian metros that range is typically a few thousand lines in 1,500 to 2,500 square feet, against tens of thousands in a full grocery store, so the operator is making an explicit bet on which lines will move in a catchment of two to three kilometres on a given evening. That bet is the whole business. Too narrow and the customer substitutes away; too broad and the working capital and waste eat the contribution.
This is why the category’s genuine competitive advantage is not the app but the forecast: a per-store, per-SKU, per-hour demand model that can be re-fit as a catchment matures. The operators that have improved fastest have done so by narrowing SKUs into what actually sells in that catchment rather than by widening the range, and the improvement shows up as throughput rather than as basket — which is consistent with the sixteen cents of basket growth over eight years recorded in the forecast.
In the store-picked model the same problem exists in a milder form. Instacart does not decide what a supermarket stocks; it decides which of the stocked items to show, in what order, to which customer, and it monetises that ordering directly through sponsored placement. The forecast problem becomes a ranking problem, and the ranking problem has a revenue line attached to it.
Problem two: picking faster
The physical constraint inside a dark store is the pack station, not the shelf. A picker working a well-laid-out store can assemble roughly sixty orders an hour at steady state, which sets a ceiling of fifteen hundred to two thousand orders a day for a two-thousand-square-foot node before the packing benches, not the shelves, become the binding constraint.
Two distinct technology paths address that ceiling, and they are not substitutes:
- Process automation. Pick-path optimisation, handheld scanning with item-level verification, pre-staged fast-mover bays, and dispatch batching. This is software over an unchanged building, it costs almost nothing per store, and it is what the Indian operators have actually deployed. Raising throughput from roughly 700,000 to 770,000 rupees of order value per store per day in a single quarter, on 200 net new stores, is a process result, not a robotics result.
- Mechanical automation. Automated storage and retrieval within a micro-fulfilment centre, goods-to-person shuttles, and tote-based picking. This works, it is proven in grocery, and its payback is a direct function of the local wage rate against the local rent. At Indian picker wages and Indian rents it does not pay back inside a normal lease term. At Northern European wages and Northern European rents it does, which is why automated micro-fulfilment arrived in Europe and the United States first and has not arrived in India at all.
That asymmetry is a durable feature rather than a lag. India’s dark-store model is labour-intensive because Indian labour is cheap relative to Indian rent; Europe’s is capital-intensive because the reverse is true. A single global view of “quick commerce automation” that ignores which of those two regimes a market is in will misprice every equipment opportunity in the sector.
Problem three: the cost of capacity you cannot use
Demand in this category is violently peaked. The same store that runs at a few hundred orders in the morning must be resourced for a multiple of that in the evening, and the rider fleet must exist at the peak because that is when the promise is being tested. The technology answer is batching — assigning several orders from the same store to one rider where the routes align — and batching is worth more than any other single lever in the last mile, because it converts a fixed number of riders into a larger number of deliveries without a wage increase.
Batching is also the main thing separating the two architectures’ delivery costs. A store-picked operator batching three supermarket orders on one route and a dark-store operator batching three nearby apartment drops are doing the same arithmetic on different cost inputs, and both are constrained by the same thing: the geographies where routes align are the geographies where the rent is highest.
The technology that changed the financial statements rather than the operation
The most consequential systems change of 2026 was not in the warehouse. It was the conversion of Blinkit’s quick commerce business to first-party inventory ownership, disclosed in the Q1 FY27 shareholders’ letter. Consolidated adjusted revenue grew 173% year on year against like-for-like growth of 66%, and the gap is the accounting consequence of revenue now including the full monetary value of goods sold rather than marketplace commission.
What that requires underneath is an inventory and margin system the marketplace model never needed: SKU-level cost of goods, wastage and shrinkage accounting, markdown management, supplier terms, and a working-capital cycle that a commission business does not carry. A platform can run a marketplace on dispatch software. A first-party retailer cannot run without a retail ERP, and building or buying one is a materially different programme from optimising a route.
It also changes what “technology investment” means in this sector. On a marketplace perimeter, the capex is servers and the research budget is ranking. On a first-party perimeter, the capex is cold rooms and racking and the research budget is replenishment. The same company can be both in different segments, and the disclosure rarely separates them.
Where the innovation is genuinely thin
Two areas are less developed than the marketing implies. The first is cold chain inside the dark store: most Indian nodes carry a limited chiller and almost no frozen capacity, which caps the fresh and frozen assortment at exactly the categories with the highest basket uplift. The second is returns and substitutions — the operational failure mode that most damages repeat purchase in grocery, and the one with the least disclosed data anywhere in the world.
Neither is a research problem. Both are capital problems wearing a technology label, which is why they persist.
Risque de marché
Market Risk, Substitution and Concentration
The risks that matter in this market are not demand risks. Demand for groceries delivered quickly is real, revealed and growing in every market where it has been offered at a price the consumer does not fully pay. The risks are the price at which it is offered, the assets that were committed to offer it, and the definitional confusion that lets a buyer compare two businesses that are not comparable.
Risk one: the subsidy is the price
Every large instant retail market was built with a price to the consumer that is below the cost of serving them, and the gap was funded by capital. When the capital stopped, in Europe, the format stopped with it. That is not an argument that the format cannot work. It is an observation that the format’s current volumes were bought partly with subsidy and that some of them will not survive its withdrawal.
China is the controlled experiment and it is already reported. Meituan lost RMB 6.827 billion in Q1 2026 and earned RMB 2.155 billion in Q2 on revenue growth of 14.4%, with per-order profit on non-food instant retail turning positive. The volume did not disappear when the subsidy fell; the margin appeared. That is the good version of the transition and it is what the base case assumes for China from 2027.
The bad version is India, where all three platforms are still competing for the same catchments with overlapping price promises. Blinkit has crossed into profit; Zepto lost INR 5,042 crore and Instamart INR 3,511 crore in FY26. Two of the three cannot stop competing without conceding share, and the one that can afford to stop is the one currently winning. That is a stable configuration only as long as the followers can fund it.
Risk two: the lease outlives the catchment
A dark store is a multi-year lease on a building whose value is entirely determined by the density of demand within two to three kilometres. Demand density is not fixed. A competing operator opening two hundred stores inside the same catchment divides the same orders across more fixed cost, and neither can exit the lease.
Zepto’s prospectus allocates INR 1,735 crore — more than any other single use of proceeds — to lease rentals. That is a disclosure of the shape of the risk: the estate is a committed obligation measured in years while the competitive position that justified it is renegotiated every quarter. When the format contracts, it contracts by closing stores and paying leases on the closed ones, which is precisely what happened in Germany.
Risk three: the rider cost is being repriced by statute
Every model of dark-store economics in this report uses a delivery cost that reflects the labour regime the operator actually faces. In India that is a per-drop payment to a contract rider with welfare obligations beginning to attach at state level. In Europe it is employed labour with contributions, now reinforced by a presumption of employment across the bloc. In China it is an employed or contracted rider pool of over ten million active riders, with social insurance broadening.
None of those regimes is stable in the operator’s favour. Delivery is the largest variable cost in the model and it is the line item most exposed to a regulatory decision that has nothing to do with retail.
Risk four: substitution from the shelf that already exists
The strongest competitor to instant retail is not another instant retailer. It is the store the consumer can walk to, and the same store’s own click-and-collect. Europe already demonstrates the outcome: once the rapid promise was removed and replaced with predictable delivery windows, the surviving business was the retailer’s own, attached to inventory it already held.
Two substitutes deserve specific mention. Discounters, which continue to take grocery volume on price in every market and are structurally incompatible with a two-hour promise at a low basket. And next-day grocery e-commerce, which serves the planned weekly shop far more cheaply per order.
What protects instant retail from both is the one thing it genuinely owns: immediacy. Roughly half of orders in the format are for something the consumer wants within the hour, and that demand cannot be served by a planned channel. But immediacy is a smaller category than convenience, and operators that expanded their promise to two hours and their assortment to the weekly shop are competing directly with cheaper substitutes.
Risk five: comparing the incomparable
The most common analytical error in this sector is to take a store-picked operator’s margin and apply it to a dark-store operator’s cost base, or the reverse. Instacart earns 3.2% of GTV as adjusted EBITDA because it owns no inventory and no lease. A dark-store operator with the same revenue take would be deeply loss-making, because it carries both. The sector’s reported “industry margins” are meaningless without the fulfilment architecture attached.
This is a risk to the reader rather than to the market, and it is the reason this report publishes two perimeters and refuses to blend them.
Scenario range, 2033
| Scenario | 2033 value, USD bn | CAGR 2025–33 | Assumptions |
|---|---|---|---|
| Accelerated normalisation | 545 | 13.10% | China subsidy withdraws fully by 2027, India consolidates to two operators by 2028, European dark-store format does not return. |
| Base case | 598 | 14.42% | China normalises from 2027, India competes through 2028, store count growth decelerates and throughput carries the volume. |
| Sustained competition | 640 | 15.39% | Subsidy continues in China and India through 2029, challengers are funded through their expansion, and the dark-store estate grows faster than throughput. |
Note what the scenarios do to margin rather than to volume. The higher-growth scenario is the worse outcome for every participant, because it is bought with subsidy and store openings rather than with throughput. A market that grows at 13.10% and earns a contribution margin is more valuable than one that grows at 15.39% and does not, and the difference between those two outcomes is decided by competitive intensity, not by consumer demand.
What would change the forecast
Three observable events would move the base case materially and are worth monitoring directly:
- An Indian consolidation. A merger, an exit or a funding failure among the top three would move India from a subsidy market to a margin market within two quarters, with the volume effect small and the profit effect large.
- A Chinese re-tightening. A second round of regulatory guidance on subsidy would accelerate normalisation and pull the market toward the 545 case.
- A first-party conversion outside India. If a non-Indian dark-store operator converts to inventory ownership at scale, the accounting and the capital requirement of the format change everywhere, and the investment case for the sector has to be rebuilt from the balance sheet rather than the order book.
None of these is a forecast. They are the three points at which the model is most sensitive, stated so that a reader can price them rather than accept them.
Paysage réglementaire
Regulatory Landscape
Instant retail is regulated by four separate bodies of law that were not written with it in mind: foreign investment rules, planning and licensing rules for physical premises, employment classification of the rider, and competition rules that apply to the platform. In every market, the operator’s cost structure is being decided in a forum that is not the market.
China: the regulator that ended a price war
China is the only market where competition policy has already changed the industry’s profit and loss in a measurable way. The subsidy contest between Meituan, JD and Ele.me through 2025 and into 2026 was severe enough to produce a RMB 6.827 billion net loss at Meituan in Q1 2026. Regulators then guided the industry away from what Chinese policy language calls involutionary competition — destructive competition that leaves every participant worse off — and subsidy intensity fell.
The effect was immediate. Meituan returned to RMB 2.155 billion of net profit in Q2 2026 and disclosed that per-order profit for non-food instant retail had turned positive. Whatever one thinks of administrative guidance as a substitute for competition, the episode establishes something important for anyone modelling this sector: the Chinese instant retail margin is a policy variable as much as an operating one, and a forecast that assumes competitive intensity without a regulatory bound will overstate the losses and understate the margin.
Two further Chinese regulatory strands matter. The Ministry of Commerce Research Institute’s own definition of instant retail — online order, local fulfilment, local supply — is now the working perimeter for national statistics, which means Chinese data will remain structurally wider than any dark-store definition used elsewhere. And rider social insurance, progressively extended across the platforms, adds a real cost per delivery that the earlier subsidy-funded expansion did not carry.
India: foreign investment is the live question
India’s constraint is not planning permission. It is the foreign direct investment rule that separates a marketplace, which may hold foreign capital freely, from an inventory-owning retailer, which may not in multi-brand retail. Dark-store quick commerce was built inside the marketplace perimeter: the platform took a commission, the dark store was nominally a separate entity’s, and the inventory sat off the platform’s own balance sheet.
Blinkit’s move to first-party inventory ownership in quick commerce, disclosed in its Q1 FY27 letter, moves the operating reality toward retail while the structure stays inside a listed Indian entity. That is defensible for domestic capital. It becomes a materially harder question for any operator funded from outside India, and it is the single regulatory fact most likely to determine which of the three platforms can adopt the model that has proved most profitable.
Enforcement has also become visible. Zepto’s founders were summoned by the Directorate of Enforcement in April 2026 under the Foreign Exchange Management Act, with details sought on foreign investments in the company, its shareholding and its business model. That is an inquiry rather than a finding, and it should be read as exactly that — but it signals that the foreign-capital architecture of Indian quick commerce is now under active examination rather than settled.
Below the federal level the burden is operational. Dark stores require shops-and-establishments registration, food licensing, legal metrology compliance for weighing and pricing, and municipal approval that varies by city and often treats a dark store as neither retail nor warehouse. Rider welfare has moved from advocacy to statute in several states, following Rajasthan’s 2023 platform-based gig worker law, which establishes the principle that platforms owe a welfare contribution per worker even where the worker is not an employee. Each of these is small individually and compounding in aggregate.
Europe: employment classification decided first, business model second
Europe regulated the rider before it regulated the store, and that ordering decided the market. Spain’s 2021 rider law required delivery workers to be employed rather than engaged as independent contractors, and the European Platform Work Directive, agreed in 2024 with member-state transposition running through 2026, introduces a presumption of employment across the bloc.
The economic consequence is direct. A dark-store model whose variable cost per delivery depends on a self-employed rider paid per drop becomes a model whose cost per delivery depends on employed labour with hours, contributions and scheduling obligations. That conversion is exactly the gap between a business that can be scaled on venture capital and one that has to be priced to cover payroll every week. Getir and Gorillas exited Germany on cost structures built under the earlier regime; the directive makes the earlier regime unavailable to anyone who tries the format again.
Planning law is the second constraint. A dark store is a retail use in some European jurisdictions and a warehouse use in others, and the difference determines whether it can open on a high street at all. Several cities have used that classification deliberately to limit the format.
United States: competition review, not operating restriction
The United States has no equivalent of the European employment presumption at federal level and no national dark-store planning framework. The live regulatory question is the DoorDash–Instacart transaction announced on 29 October 2026 at approximately USD 17 billion of equity value, which will be reviewed as a horizontal and vertical merger across restaurant delivery, grocery delivery and retail media.
The vertical dimension is the interesting one. Instacart’s advertising business depends on being an independent intermediary that retailers and brands can trust with their data; owned by a competing delivery platform, that neutrality is contestable. Whether a competition authority treats retail-media neutrality as a relevant market is the question that will decide the shape of the merged entity.
What regulation does to this forecast
The 14.42% base case assumes no market closes. That is a strong assumption in the two markets where regulation has already been decisive. In China the policy bound is what turned a loss into a profit within a quarter, and a re-tightening would slow volume without damaging margin. In Europe the employment presumption is what prevents the dark-store format from returning at scale, and it is the reason the European forecast is 4.6% of global value in 2026 and grows more slowly than the global average throughout.
Regulation in this sector does not usually ban anything. It changes the cost of a delivery, and the cost of a delivery is the business.