
Quick Commerce Retail Media Market Report, Size, Share and Forecast 2026–2033: USD 3.4 Billion of Advertising on USD 204 Billion of Groceries
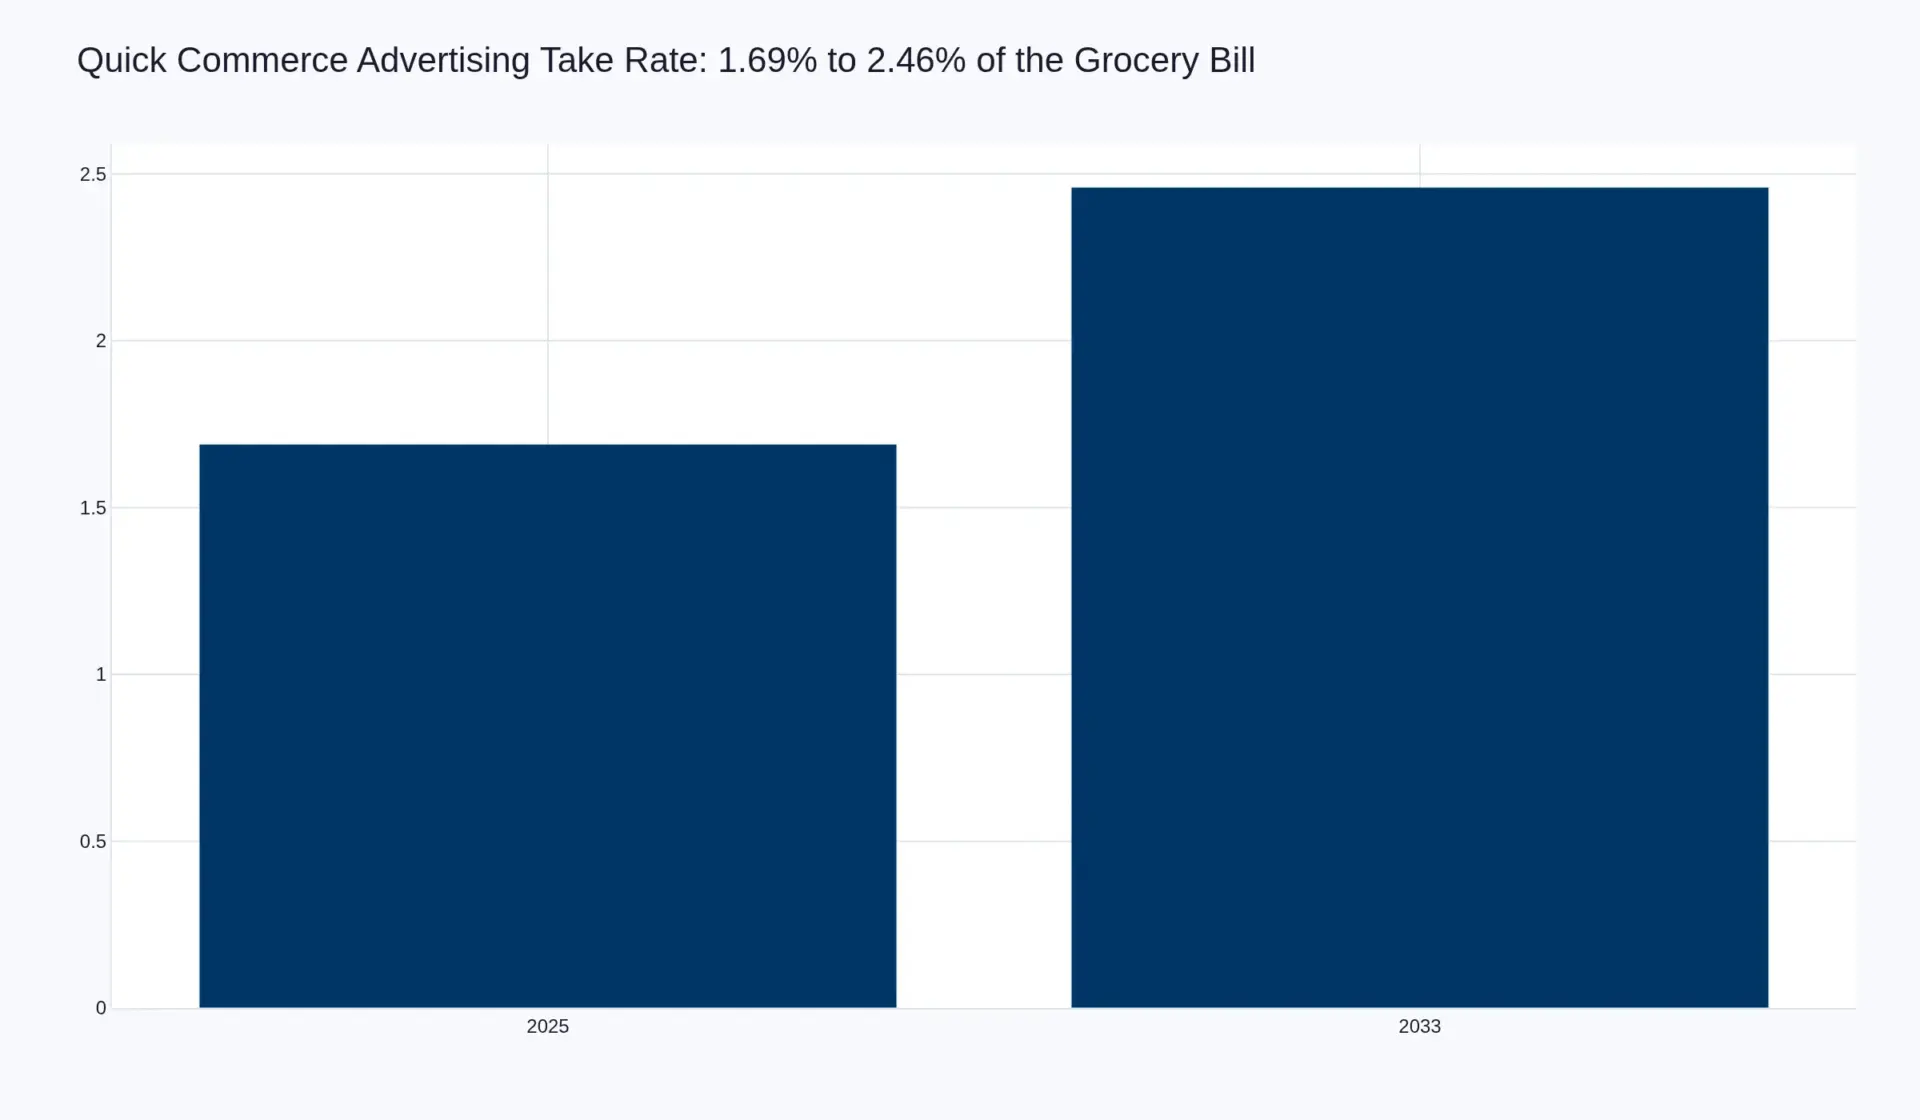
Quick commerce platforms earned US$3.4371 billion of advertising revenue in 2025 against US$203.6 billion of order value — a blended take rate of 1.69%. By 2033 the advertising market reaches US$14.6986 billion on US$598.0 billion of groceries, a 19.92% compound annual rate against 14.42% for the underlying order value. The take rate nearly doubles to 2.46%, and that gap — 5.5 points a year — is the entire investment case for this report.
The reason it is not a rounding difference is visible in two disclosed P&Ls. Instacart's advertising and other revenue was US$1,065 million in 2025 on US$37,224 million of gross transaction value — 28.46% of its total revenue and 97.98% of its adjusted EBITDA. Without the advertising line, Instacart's adjusted EBITDA of US$1,087 million is US$22 million. Zepto earned ₹1,635.7 crore of advertising revenue in FY26 against ₹1,389.1 crore of advertising and promotional spend — it made ₹246.6 crore more from selling ads than it spent on buying customers, and its advertising revenue alone was 7.23% of its ₹22,623.5 crore of operating revenue.
Those two numbers are the report. In quick commerce, the groceries are close to a loss leader and the advertising is the business.
Market size at a glance
| 2025 advertising revenue | US$3.4371 billion |
| 2033 advertising revenue | US$14.6986 billion |
| CAGR, 2025–2033 | 19.92% |
| Blended take rate on order value | 1.69% → 2.46% |
| Order value beneath it | US$203.6bn → US$598.0bn (14.42%) |
| Active brand advertisers | 41,000 → 118,000 (14.13%) |
| Growth advantage over the groceries | +5.50 points a year |
| Currency and scale | USD, billions |
The regional spread is the whole story
A single global take rate of 1.69% hides a range of nearly five to one, and the range is explained by two things: who owns the shelf, and whether brands have anywhere else to go.
| Region | 2025 ads (US$bn) | 2025 take rate | 2033 ads (US$bn) | 2033 take rate |
|---|---|---|---|---|
| China | 1.2227 | 0.90% | 5.0941 | 1.35% |
| United States | 1.3838 | 3.72% | 4.8400 | 4.40% |
| India | 0.4988 | 4.30% | 3.2700 | 6.00% |
| Europe | 0.1410 | 1.50% | 0.3588 | 2.30% |
| Rest of world | 0.1908 | 2.00% | 1.1357 | 2.80% |
| Total | 3.4371 | 1.69% | 14.6986 | 2.46% |
India monetises hardest, at 4.30%, and China least, at 0.90%. That is not a development gap that closes with time. China's instant retail is dominated by marketplace platforms whose merchants are fragmented, price-led and competing on the same few thousand lines — an advertiser base with no brand budget to defend. India's is dominated by two inventory-owning platforms with a national brand landscape desperate for visibility on the only shelf that is growing. The same product, in two markets, monetised four-fold differently because the advertisers are different.
The United States is the reference market and the ceiling. Instacart at 2.86% of gross transaction value is the single largest and most mature advertising business in the channel, with more than 9,000 active brands advertising in the fourth quarter of 2025 against more than 7,000 a year earlier, and its Carrot Ads partner count growing from 220 to more than 310. US blended take rate of 3.72% sits above Instacart's own 2.86% because it includes retailer-owned media sold against instant volume, which monetises higher.
Europe monetises least of the developed markets at 1.50%, and the reason is structural. The surviving European model is a scheduled full-basket grocery business, and a grocery brand does not need to pay for visibility in a slot that the customer chose yesterday. Rohlik's €38.0 million of advertising, trade marketing and retail media revenue grew 66.7% — but at 2.57% of revenue it is roughly half the yield of the equivalent Indian line, on a model where a single order is worth eleven times as much.
What is actually being sold
Four inventory types, in descending order of what they earn.
Sponsored search. Paid placement against a query inside the app. This is the closest analogue to a supermarket shelf fee and it converts because intent is explicit and the catalogue is small. It is the largest single format on every platform that discloses a mix.
Sponsored display and category takeovers. Banner and tile inventory on the home screen and category pages. Instacart's own disclosure is instructive on why the two work together: on average, half of the customers reached by a brand's display ad were not reached by that brand's sponsored product ad, and more than a third of new-to-brand sales from display came from customers the sponsored product ad had not reached.
Trade marketing and retail media off-platform. The line Rohlik groups under "other service revenue" alongside advertising. It includes supplier-funded promotions, price-file support and in-app content, and it is the fastest-growing line in the European P&L precisely because it is closer to trade spend than to advertising — it comes out of a budget that already exists.
Data and measurement. The smallest and the most legally exposed. Basket-level attribution is genuinely valuable to a brand and genuinely constrained by consent rules in Europe and by platform data rules in China.
The five-and-a-half-point gap, and why it probably holds
Advertising grows faster than the groceries for three reasons that are independent of each other.
Take rate rises. A platform that has 800 brands competing for 20 search slots can charge more per slot next year than this year without adding a single order. This is the purest form of pricing power in retail, and every one of the five regions in the table assumes it increases.
Advertiser count rises. Active brand advertisers grow from 41,000 to 118,000, a 14.13% compound rate. That is faster than order value but slower than revenue, which is the arithmetic of a market where the average brand also spends more each year.
Mix shifts to the high-yield markets. India grows value at 21.3% against a global 14.42%, and India is the highest-yield advertising market in the channel at 4.30%. Its share of global order value rises from 5.70% to 9.11%, and every point of that shift carries a take rate more than twice the global average.
Together those produce 19.92% against 14.42%. The forecast's biggest risk is not that the take rate stops rising but that the Chinese number never does: China is 66.73% of the order value in this channel and 35.6% of the advertising, and it is the one region where the advertising yield has a structural reason to stay low.
What is excluded, and one number to be careful with
This report measures advertising and retail-media revenue earned inside instant retail and quick commerce platforms: sponsored search, sponsored display, trade marketing and platform-sold data. It excludes everything earned by the retailer's own media network outside instant fulfilment (Walmart Connect, Amazon Ads and their equivalents, which are far larger and mostly not attributable to a sub-two-hour order), it excludes advertising sold by third-party delivery marketplaces against restaurant demand, and it excludes the brands' own media spend.
The number to be careful with is the Chinese take rate. At 0.90% of order value it looks implausibly low against a market of RMB 971.4 billion, and it is the least directly evidenced figure in this report: none of the Chinese platforms discloses instant retail advertising revenue separately from marketing services group-wide. It is modelled, it is labelled as modelled, and if the true figure is 1.4% rather than 0.9% the global 2025 total moves from US$3.44 billion to about US$4.1 billion and every conclusion in this report survives except the size.
Section index: contents · value chain · technology · competitive landscape · regulation · investment activity · market risk
Articles on this market
- Quick commerce takes 1.69% of the grocery bill as advertising — the take rate, and why it is capped by digital shelf space rather than by advertiser demand.
- Why 7.23% against 3.1% are not comparable — one business books the goods, the other books the cut.
Sources
The take rates in this report are anchored on disclosed advertising revenue divided by a disclosed transaction base.
- Instacart (Maplebear Inc.), Form 10-K for fiscal year 2025 — advertising and other revenue against gross transaction value.
- Zepto Limited, UDRHP-I filed with SEBI, June 2026 — advertising revenue, advertising and promotional spend, operating revenue and net order value.
- Rohlik Group, audited annual report for the year to 30 April 2026 — advertising, trade marketing and retail media revenue against total revenue. This document is held by Pheonix Research; it is not published at a stable public URL, so it is not linked here.
Where no operator discloses a base — China and most of the rest-of-world block — the take rate is modelled and labelled as modelled in the text.
Table des matières
- Overview and market size
- Value chain: what a brand buys and from whom
- Technology and innovation: attribution, bidding, consent
- Competitive landscape: Instacart, Blinkit, Zepto and the rest
- Regulatory landscape: ad disclosure, dominance, data consent
- Investment activity: asset-light growth inside a capital-heavy channel
- Market risk: budget substitution, platform concentration, measurement
- Methodology and exclusions
Paysage concurrentiel
Oligopolistic inside every market, fragmented across them
There is no global quick commerce advertising market. There are five regional ones, each an oligopoly of two to four platforms, and each with a different take rate because each has a different advertiser base. The market structure is oligopolistic and the competitive intensity within each region is high, because the platforms are competing for the same finite pool of brand trade spend.
Tier-one count is six: Instacart in the United States, Blinkit and Zepto in India, Meituan and JD.com in China, and Rohlik Group in Europe. No single platform holds a majority of global advertising revenue, and the largest by a wide margin is Instacart, whose US$1,065 million is 31.0% of the global total.
Instacart is the reference case
Instacart’s disclosures describe the business model everyone else is trying to reach, and it is worth setting out what they show. Advertising and other revenue of US$1,065 million on US$3,742 million of total revenue is 28.46%, and on US$1,087 million of adjusted EBITDA it is 97.98%. The company added more than 2,000 active brand advertisers in a year, taking the count above 9,000 in the fourth quarter, and grew its Carrot Ads partner count from 220 to more than 310.
The strategically important part is that Carrot Ads is sold to other retailers. Instacart monetises its advertising technology on grocery catalogues it does not operate, which converts a delivery business into a software and media business and is the only route in this channel to margins that are not constrained by a rider’s wage.
India is where the take rate is highest and the disclosure is best
Zepto’s draft prospectus is the most detailed advertising disclosure in the channel outside the United States: advertising revenue of ₹1,635.7 crore in FY26 against ₹651.2 crore in FY25 and ₹49.1 crore in FY24 — a 2.51-fold increase in the latest year and a 33-fold increase over two. It names 2,468 brand partners and gives a quarterly figure of ₹542.96 crore for the March 2026 quarter. Blinkit does not break out advertising, and on a net order value of ₹17,132 crore in the June 2026 quarter a mid-single-digit take rate would make it the second-largest advertising business in the channel.
China is the anomaly, and the reason is advertiser structure
Meituan, JD.com and Alibaba all sell advertising inside instant retail, and known of them separates it from marketing services group-wide. The modelled 0.90% take rate reflects a merchant base that is fragmented, price-led and competing on interchangeable lines. A convenience store on a Meituan feed is not defending a brand; it is buying an order. That produces a large advertising absolute on a very large base, and a structurally low yield.
Chaîne de valeur
What a brand actually buys
A brand buying quick commerce advertising is buying the right to be seen at the moment a shopper is filling a basket that will arrive in under an hour. That is a narrow, high-intent moment, and it is why the same impression is worth more here than on a general-purpose feed.
Four parties sit in the transaction. The brand pays, usually out of trade marketing or shopper marketing budget rather than out of media budget — a distinction that matters because it determines which internal team has to approve the spend. The agency or the platform’s own sales team intermediates, and in this channel the platform increasingly does it directly because the inventory is not intermediated by a demand-side platform. The platform sells the placement. The retailer or franchisee whose shelf is being promoted is usually not paid at all, which is one of the quiet tensions in the model.
The transfer that funds the market
Almost none of this money is new. It comes out of the fees a brand already pays a retailer for shelf position, out of in-store promotion, and out of the shopper-marketing line that used to buy end-caps and gondola ends. Quick commerce advertising is therefore best understood as a re-intermediation of trade spend: the budget moves from a physical shelf to a digital one, and the platform captures what the retailer used to.
That has two consequences. It explains why the market can grow at 19.92% while the groceries beneath it grow at 14.42% — the transfer is not yet complete. And it explains why the take rate is so sensitive to advertiser structure: a brand with a physical shelf presence has trade budget to move, and a fragmented merchant with no brand does not.
The measurement loop is the product
The chain closes because the platform can show the brand a basket. Impression, click, order, delivered — all inside one system, with no panel and no modelled lift. That closes the loop that general advertising has never been able to close, and it is the reason retail media as a whole has taken share from display advertising for a decade. Every technical and commercial decision in this market follows from protecting that loop.
Where the margin sits
At the platform. The marginal cost of an additional sponsored slot is effectively zero, so incremental advertising revenue falls almost entirely to contribution. This is why the advertising line in a quick commerce P&L is the only line that improves without any operational change: it needs no rider, no picker, no lease and no refrigeration. The €1.67 of advertising revenue per Rohlik order against €1.02 of adjusted EBITDA is the cleanest statement of that in the data.
Activité d'investissement
The cheapest growth in the channel
Capital intensity in retail media is low and the investment trend direction is rising, which is the most attractive combination in this cluster. A sponsored-search auction, a bidding engine and a reporting dashboard cost a fraction of a dark store and earn a take rate on every order that store processes. The marginal cost of selling one more advertising slot is close to zero, and the marginal revenue is a percentage of somebody else’s basket.
That is why every operator in this report has built an advertising business faster than it has built a profitable delivery business. Zepto’s advertising revenue grew 2.51-fold in a year in which its losses remained substantial. Rohlik’s advertising, trade marketing and retail media revenue grew 66.7% against 32.8% revenue growth. Instacart’s advertising revenue per dollar of gross transaction value — 2.86% — exceeds its adjusted EBITDA per dollar of gross transaction value, which is 2.9% only because the advertising is doing the work.
Where the money is going
Three investment priorities are visible across the disclosures. The first is bidding and auction infrastructure, which is where incremental yield comes from and where the engineering spend concentrates. The second is measurement: closed-loop attribution from an impression to a basket is the product, and it is why platforms guard their transaction data so closely. The third is off-platform extension — selling the advertising stack to other retailers, as Carrot Ads does, and as every large retail media network has done.
Recent M&A activity is recorded as no. Retail media capacity in this channel has been built rather than bought, because the asset is software written against proprietary transaction data and there is nothing external worth acquiring to obtain it. The consolidation in retail media is happening one level up, among the retailer-owned networks that aggregate demand across many grocers, and it does not touch this market’s structure.
The funding asymmetry
The consequence of an asset-light advertising business sitting inside an asset-heavy delivery business is that the advertising line is the only part of quick commerce that a platform can scale without capital. In a market where the delivery side is competing for finite franchise or balance-sheet capital, that asymmetry is a strategic advantage, and it explains why every operator’s investor communications now lead with advertising yield rather than with order growth.
Technologie et innovation
Three systems and one data asset
The technology in this market is not complicated and the moat is not the code. Three systems do the work: an auction that prices each placement, an attribution layer that closes the loop from impression to basket, and a reporting surface that a brand’s agency can act on. What makes them valuable is that they sit on top of a transaction record nobody else has.
A quick commerce platform knows what was in the basket, when it was ordered, which catchment it went to, and what the customer looked at before ordering. That is a more complete signal than a search engine has, because the purchase is in the same system as the impression. It is the reason advertising yields in this channel exceed those of general display at comparable reach.
Bidding and automation
Zepto’s prospectus describes the stack precisely: a cost-per-click bidding engine, automated campaign management and built-in keyword suggestions, sold to 2,468 brand partners. That is the standard architecture, and the differentiator is not the auction mechanics but the quality of the demand signal feeding it. Instacart’s iteration has been toward incrementality — proving that a display impression reached customers a sponsored product ad did not — because a brand that cannot see incremental reach will not pay a premium for it.
Clean rooms and the attribution problem
The technical frontier is doing closed-loop attribution with less joinable data. Clean rooms, differential privacy and modelled conversion all preserve the commercial conclusion while reducing the precision of the underlying match. That work is what keeps the take rate rising in consent-restricted markets and is the main reason the European take rate is forecast to rise from 1.50% to 2.30% rather than hold flat.
Innovation intensity and maturity
Innovation intensity is high and patent activity is low — this is software built on proprietary data rather than on protected invention. Maturity stage is growth. The systems are standard; the yield is not, and the yield is a function of market structure rather than of technology. That is why the same stack earns 4.30% in India and 0.90% in China.
Risque de marché
Four risks, and the first one is a budget question
1. Substitution risk is high because the budget is not new. Quick commerce advertising is largely funded out of trade spend and shopper marketing that already existed, not out of new marketing budget. That makes it a share-taker from supermarket shelf fees, in-store promotion and legacy retail media, and it means its growth is a function of how fast those budgets migrate rather than of how fast the channel itself grows. If a large FMCG resets its trade terms toward a discounter’s loyalty programme, the money leaves this channel at the same speed it arrived.
2. Platform concentration cuts both ways. Because each regional market is an oligopoly of two to four platforms, an advertiser has very little choice and the platforms have unusual pricing power. The same concentration makes the platforms vulnerable to a single advertiser category pulling back. In India, two categories — packaged food and personal care — dominate the sponsored-search auction, and a category-wide budget cut would move the take rate immediately.
3. Measurement integrity. The product is attribution: an impression, a click, and a basket in the same closed system. Every tightening of consent rules and every restriction on cross-context tracking erodes the accuracy of that loop and therefore the price a brand will pay. This is the slowest-moving and least reversible risk in the market.
4. Regulatory treatment of the dual role. A platform that both sells goods and sells the placement of those goods against its own search results is doing something regulators have started to examine. Self-preferencing rules that apply to a large platform can constrain how its own private label competes for sponsored slots, which is a direct reduction in inventory.
What is not a risk
Geopolitical exposure is low: advertising is a domestic service and the technology stack has no chokepoint. Overall market risk is low relative to the rest of this cluster, which is unusual for a market growing at 19.92% — but the low rating is about the shape of the business, not the size of the growth. There is no capital at risk, no property, no rider, and no inventory. The downside is a take rate that stops rising, not a balance sheet that breaks.
Paysage réglementaire
Three regulatory themes, none of them settled
Regulatory complexity is moderate and the approval pathway requires no formal approval at all: there is no licence to sell advertising inside a grocery app. The exposure is conduct-based rather than permission-based, which means it arrives as enforcement rather than as a gate.
Advertising disclosure. Rules requiring that sponsored placement be identifiable as advertising apply across the EU, India and China, and they are enforced unevenly. In practice the constraint is not whether a sponsored tile is labelled but whether the labelling is prominent enough to change behaviour, and enforcement has focused on the labelling’s visibility rather than its existence.
Self-preferencing and platform dominance. This is the theme with the most direct revenue consequence. A platform that sells sponsored search and also owns private-label brands competes with its own advertisers for the same slots using its own data. Digital-market rules in Europe and platform-economy guidance in China both touch this, and the likely remedy — a separation between the ranking function and the commercial function, or a prohibition on self-preferencing — removes inventory or removes a bidder.
Data and consent. Closed-loop attribution depends on joining an impression to a purchase. Consent regimes constrain that join, and the direction of travel is toward less joinable data rather than more. The workaround the industry has adopted — clean rooms, aggregated reporting and modelled attribution — preserves most of the value at lower precision, which is why measurement is the third risk in this report rather than the first.
Consumer-protection spillover. Price-transparency rules applied to delivered grocery have an indirect effect on retail media: if a sponsored placement can be shown to have altered the price a consumer paid, the disclosure obligation becomes a liability rather than a label.
One asymmetry worth noting
The platforms with the highest take rates are in the jurisdictions with the least developed retail-media regulation, and the platforms with the lowest take rates are in the jurisdiction with the most active platform regulation. That is not a coincidence and it is the reason the forecast’s take-rate assumptions are more conservative for China than for India.