
Europe Quick Commerce Market Report, Size, Share and Forecast 2026–2033: USD 9.4 Billion, the Only Region Where the Format Shrank and Then Grew Up
Europe's quick commerce market is US$9.4 billion in 2025 and reaches US$15.6 billion in 2033, a 6.54% compound annual rate — less than half the global rate and the slowest of any market in this cluster. It is the one region where the format was tried at scale, largely retreated, and then grew back as a different business. Its share of world instant retail falls from 4.62% to 2.61% across the same period. In euros, the 2025 market is roughly €8.10 billion.
The finding that matters is the direction of the basket. Value grows at 6.54% while orders grow at only 3.21%, from 209 million to 269 million, so the average order rises from US$44.98 to US$58.00 — up 3.23% a year. That is the second-largest basket contribution in the cluster, behind India's 5.8 points, and it is the exact opposite of China, where the basket falls 1.22% a year. Europe's quick commerce did not survive by getting cheaper and faster. It survived by getting bigger and slower.
The mechanism is visible in the two operators that now dominate. Rohlik Group reported revenue of €1,479.7 million for its financial year to 30 April 2026, up 32.8%, on 22.7 million orders at an average of €68.0 including VAT. Delivery Hero reported European GMV of €9,693.2 million for 2025, up 14.8% like-for-like in constant currency, with group quick commerce GMV above €7.5 billion and guiding toward roughly €10 billion in 2026. Both are full-basket businesses. Neither sells a 10-minute top-up shop.
Market size at a glance
| 2025 market size | US$9.4 billion (about €8.10 billion) |
| 2033 forecast | US$15.6 billion |
| CAGR, 2025–2033 | 6.54% |
| Order volume, 2025 → 2033 | 209m → 269m orders (3.21% CAGR) |
| Average order, 2025 → 2033 | US$44.98 → US$58.00 (+3.23% CAGR) |
| Share of global instant retail | 4.62% → 2.61% |
| Basket contribution to growth | +3.33 points (second to India's 5.8) |
| Currency and scale | USD, billions |
What happened between 2021 and 2025
The first European quick commerce generation promised delivery in ten to fifteen minutes from a network of small urban warehouses, and it was funded as a land grab. That generation is largely gone from continental Europe. The evidence for the retreat sits in the incumbents' own filings rather than in commentary: Delivery Hero's 2025 results exclude operations it exited or divested during 2024 and 2025 — Slovakia, Slovenia, Denmark among them — and its like-for-like growth measure is defined specifically to strip those exits out. A company that has to define its growth rate around a list of departures is telling you what the period looked like.
What survived did so by changing the product. Two things were abandoned. The first was the promise time: fifteen minutes became thirty, then sixty, and in Rohlik's case a fifteen-minute delivery window inside a scheduled slot rather than fifteen minutes from order to door. The second was the assortment: a 2,000-line convenience box became a 16,000 to 25,000-line grocery shop, priced to match the supermarket rather than to beat it.
That is a different business with a different cost curve. A scheduled full-basket model amortises the pick across €68 rather than across €20, which is why it can absorb European labour costs and European rents. A fifteen-minute convenience model cannot, and in most of Europe it no longer tries.
Rohlik's arithmetic, line by line
Rohlik is the most useful company in this market to look at, because it is the only European operator publishing a full P&L for a pure quick commerce business. For the year to 30 April 2026 it reported revenue of €1,479.7 million, gross profit of €517.3 million at a 35.0% gross margin, adjusted EBITDA of €23.2 million against negative €20.0 million a year earlier, and a net loss of €66.1 million, narrowed from €94.3 million. Operating cash flow turned positive at €12.7 million from negative €27.8 million.
On 22.7 million orders that is €65.19 of revenue and €22.79 of gross profit per order, and an adjusted EBITDA contribution of €1.02 per order. Across nine urban agglomerations in five countries, the average fulfilment centre handles 6,910 orders a day, which at a €68 basket is roughly €469,880 of order value per site per day.
Put that against the benchmark in the dark store report in this cluster: an Indian dark store runs about 1,120 to 1,540 orders a day at a basket worth under US$6. Rohlik runs one order in six the volume at eleven times the basket. These are not two versions of the same format. One is a convenience machine that wins on frequency; the other is a grocery machine that wins on density of spend. Europe's market is the second kind, and that is why its growth rate looks pedestrian against India's and its unit economics look survivable.
The two operators, and the gap behind them
Rohlik's €1,479.7 million of revenue against a €8.10 billion European market is 18.26%. Delivery Hero's European segment is 19.70% of its group GMV, and applying that share to group quick commerce GMV of more than €7.5 billion implies roughly €1.48 billion of European quick commerce volume for Delivery Hero. The two together account for something around 36.5% of the market on our estimates.
Neither is a pure quick commerce company. Delivery Hero's European segment is predominantly restaurant delivery, and its €2,486.3 million of European revenue against €9,693.2 million of GMV is a 25.65% revenue-to-GMV ratio that reflects a marketplace take rate, not a grocery margin. Its European adjusted EBITDA was negative €79.2 million, or −0.8% of GMV, while the group as a whole earned €903.0 million. Europe is the region Delivery Hero has to explain, not the one it points at.
Rohlik's growth by market shows where the model transfers and where it is still being paid for: Czech Republic €849.3 million, up 26.0%; Germany €310.7 million, up 42.9%; Hungary €187.4 million, up 35.3%; Austria €87.5 million, up 67.0%; Romania €44.8 million, up 41.3%. The German number is the important one. Germany is Europe's largest grocery market, it is the market where the first generation of quick commerce failed hardest, and a scheduled full-basket operator growing 42.9% there is the strongest single piece of evidence that the surviving model works.
Why the basket rises here and falls in China
Three structural differences produce the sign change.
Labour is expensive and protected. A European rider costs several times a Chinese rider per hour and cannot be flexed the same way. Since the rider is paid per trip, a low basket cannot carry the trip. The format had to move up the basket or stop.
The discounter is the incumbent. In Germany, the Netherlands and much of Central Europe, the reference grocery price is set by hard discount. A convenience format cannot price above it and win a weekly shop, so the surviving operators match the supermarket price and win on time saved rather than on basket top-up. Rohlik states that its prices are comparable to brick-and-mortar grocers; that is a positioning statement, and it is only affordable at a €68 basket.
Density is a constraint rather than an asset. China's instant retail scales on catchments of two to three kilometres containing tens of thousands of households. Outside a handful of European cores, that density does not exist, and a site that cannot reach order density has to reach basket instead. The result is fewer, larger, costlier sites: nine for Rohlik across five countries, against thousands of small ones in India.
The consequence is that Europe's market grows slowly in value but grows healthily in composition. Basket up 3.23% a year, volume up 3.21%, value up 6.54% — a market doubling roughly every eleven years, funded by contribution rather than by subsidy.
How this number was built, and where that is weaker than the rest of the cluster
This is the one report in the cluster whose value base is apportioned rather than built from the ground up. The global hub report establishes the US$203.6 billion 2025 total for broad instant retail; Europe's share of that total is 4.62%, which produces US$9.4 billion. The euro figure converts at 1.16. The order count is then derived from the disclosed order volumes of the two largest operators and a stated assumption about the residual, and the basket is the quotient.
That is a top-down anchor validated by bottom-up operator data, not the reverse, and it is weaker than the other five reports in this cluster for a specific reason: Europe has no equivalent of India's three listed platforms publishing quarterly order counts, and no equivalent of China's official market series. The honest description of the European model is that the total is more reliable than its components.
Two things follow. First, the forecast's error bars are wider on volume than on value. Second, the operator-level figures in this report — Rohlik's and Delivery Hero's — should be treated as the hard evidence, and the market total as the derived frame around them. Anyone using this report to size a single country should go back to the operator disclosures rather than subdividing the €8.10 billion.
Section index: contents · value chain · technology · competitive landscape · regulation · investment activity · market risk
Articles on this market
- Europe's advertising line earns more per order than the delivery does — EUR 1.67 of media against EUR 1.02 of adjusted EBITDA, and why a 6.54% market cannot grow into its fixed costs.
- Europe is the only quick commerce market that contracted and then grew — what survived the 2021–2023 consolidation, and why a halving of global share is not weakness.
Sources
The two operators that publish full financials in this market are the validation for this report's top-down anchor.
- Delivery Hero SE, FY2025 results — European GMV of EUR 9,693.2 million for 2025, European segment revenue and European adjusted EBITDA.
- Rohlik Group, audited annual report for the year to 30 April 2026 — revenue of EUR 1,479.7 million, 22.7 million orders, average order of EUR 68.0, adjusted EBITDA and the retail media line. This document is held by Pheonix Research; it is not published at a stable public URL, so it is not linked here.
Table of Contents
- Overview and market size
- Value chain: basket, pick, trip, slot
- Technology and innovation: automation after the land grab
- Competitive landscape: the survivors and the gap behind them
- Regulatory landscape: labour, planning, packaging
- Investment activity: contribution funding replaces venture funding
- Market risk: density, discount competition, labour cost
- Methodology and exclusions
Competitive Landscape
Two operators, then a long tail
The European market is moderately consolidated at the top and fragmented below it. Rohlik Group’s €1,479.7 million of revenue against a €8.10 billion market is 18.26%. Delivery Hero’s European quick commerce volume, on our estimate of roughly €1.48 billion, is close to 18.2%. Together the two account for something around 36.5%, and no third operator is within reach of either. Tier-one count is six: Rohlik, Delivery Hero, Picnic, Flink, Wolt Market and Glovo, with Amazon’s grocery estate acting as a partner channel rather than a competitor in most markets.
The interesting structural fact is that the top two are not the same kind of company. Rohlik is a vertically integrated grocer that owns the picking, the site and the route, and books goods. Delivery Hero is a marketplace that mostly does not own the shelf and books commission, with quick commerce as one vertical inside a restaurant-led platform. Their revenue-to-GMV ratios differ accordingly: Rohlik’s revenue is close to its order value because it sells the groceries, while Delivery Hero’s European segment converts €9,693.2 million of GMV into €2,486.3 million of revenue, a 25.65% ratio.
The partnership route to demand
The most under-discussed competitive development in Europe is that the surviving operators have stopped trying to own demand. Rohlik’s German business sells through marketplace partnerships with Amazon and Wolt in all three of its German regions, alongside its own channels. For a full-basket operator, that is a rational trade: it owns the difficult part, which is the picking and the route, and rents the demand from platforms that already have the app on the phone. It also means the largest European quick commerce operator is partly a supplier to the largest delivery platforms, which changes what “competition” means in this market.
Why there is no third force
A third national champion has not emerged because the economics do not support a third entrant in any single country. Rohlik reached adjusted EBITDA breakeven only after twelve years and roughly €1.5 billion of revenue; a new entrant in Germany, France or the Netherlands would need to build the same site density, the same buying power and the same technology stack against two incumbents with both. The German buying-power example is instructive: Rohlik joined the Markant alliance in August 2025 specifically to obtain purchasing terms comparable to established German retailers. Access to buying power, not access to capital, is the barrier.
Competitive intensity
Intensity is moderate, not high. Nobody in Europe is currently buying share with delivered price, which is precisely the opposite of the Chinese market in 2025 and the Indian market in 2024. The competitive variable has shifted to availability, slot reliability and basket fill — on-time reliability and complaint-free accuracy are now the metrics operators publish, and both are operational rather than financial measures.
Value Chain
Basket, pick, trip, slot
A European quick commerce order is a scheduled delivery of a large grocery basket from a fulfilment centre, and its economics reduce to four numbers. Using Rohlik Group’s audited year to 30 April 2026 as the reference, on 22.7 million orders and €1,479.7 million of revenue:
| Revenue per order | €65.19 |
| Gross profit per order | €22.79 (35.0% gross margin) |
| Operating cost per order before share-based payments | €24.45 |
| Operating result per order | −€1.66 |
| Adjusted EBITDA per order | €1.02 |
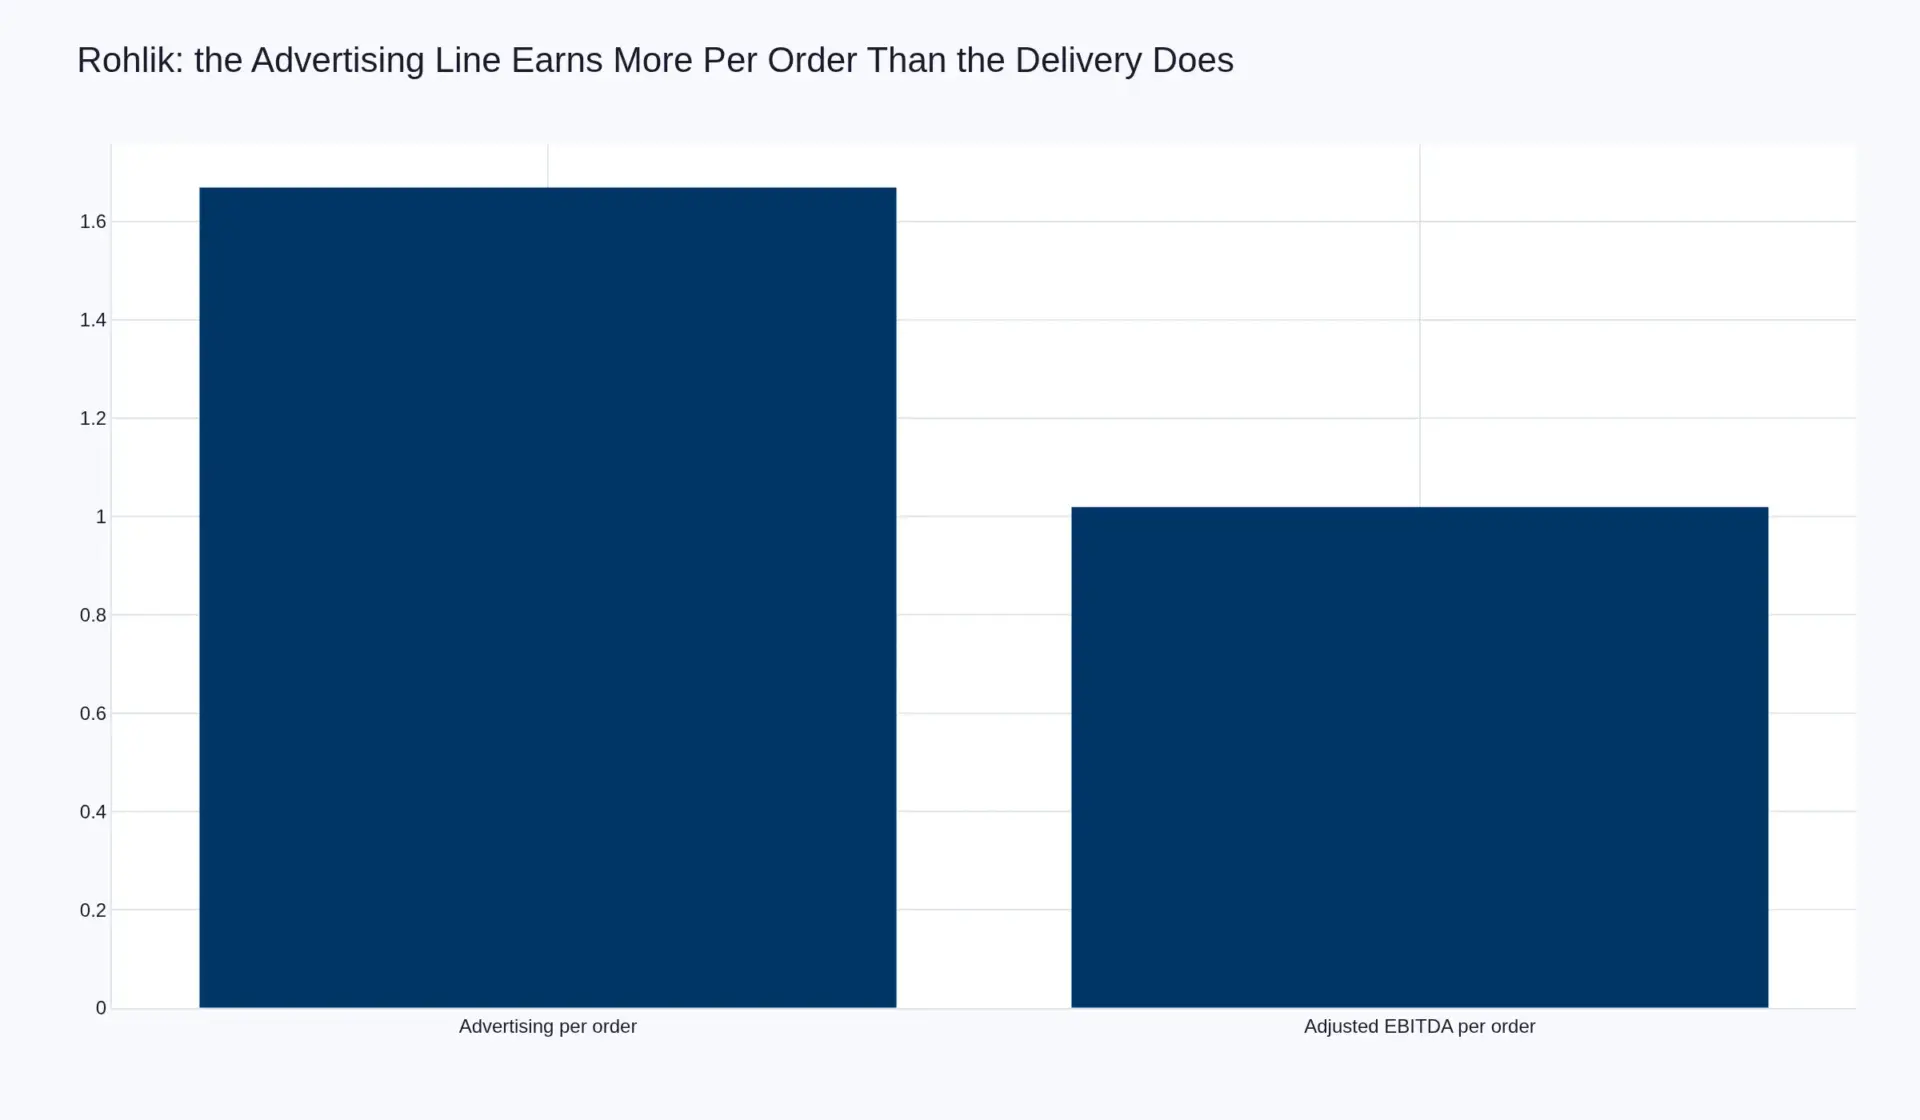
| Advertising, trade marketing and retail media per order | €1.67 |
Two things in that table are worth staring at.
The first is how thin the operating result is. −€1.66 per order on a €65.19 order is a margin of −2.5%. The cost of a single avoided error — a substituted item, a failed slot, a returned crate — is measured in euros, and there are 22.7 million opportunities a year to incur it. This is a business where operational discipline is not a virtue but the entire difference between a going concern and a write-off.
The second is that advertising earns more per order than the business does. €1.67 of advertising, trade marketing and retail media revenue against €1.02 of adjusted EBITDA: the retail media line, at €38.0 million and growing 66.7% a year, is larger than the entire adjusted operating profit of the leading European operator. That is not a curiosity. It is the clearest statement in this cluster of where the profit pool in quick commerce actually sits, and it is the reason retail media has its own report here.
Who is paid, in order
The supplier is paid for the goods and finances the working capital of the shelf. The fulfilment centre is paid for holding, picking and packing, at a labour cost per pick set by productivity. The route is paid per trip, and in Europe the trip is expensive enough that it must be filled. The platform keeps the difference between the basket and those three, which is why the basket must be large. Advertising sits outside the order entirely, paid by a brand for placement, and is the only line in the chain that improves without any operational change at all.
Why the chain forces the model
A €24.45 operating cost per order cannot be carried by a €20 basket at any volume. That single arithmetic fact is why the fifteen-minute convenience model did not survive in Europe and why the scheduled full-basket model did: not consumer preference, but the requirement that the pick and the trip be amortised over at least €60 of goods. Every subsequent feature of the European market — 16,000 to 25,000 lines, slot-based capacity, robotic picking, buying-power alliances — follows from that constraint.
Investment Activity
Contribution funding has replaced venture funding
The European investment trend direction is stable, and stability is itself the story. Between 2020 and 2023 this market absorbed venture capital at a pace that had no relationship to unit economics. Since 2024 the capital has come from three places: retained contribution, existing shareholders defending a position, and development finance.
Rohlik is the clearest case. It raised €160 million during the year to April 2025. After the year to April 2026 closed it took in €50 million of new equity from shareholders plus €30 million of European Investment Bank financing — €80 million in total, alongside a year in which adjusted EBITDA turned positive and operating cash flow turned positive for the first time. That is the profile of a business funding growth from its own operations and topping up its balance sheet, not one funding growth from a venture round.
Delivery Hero’s European segment is not a growth investment; it is a position being defended. European adjusted EBITDA of negative €79.2 million, or −0.8% of GMV, against a group that earned €903.0 million, is a regional loss the group can carry and has chosen to. The investment question in Europe is therefore not whether capital is available but whether an incumbent chooses to spend it, and the disclosed pattern is that it is being spent on selection and coverage rather than on price.
Capital intensity
Capital intensity is high per site and low in aggregate. A European fulfilment centre is a multi-million euro asset with automation, refrigeration and a lease measured in decades; the European network contains tens of them, not thousands. That produces a market where the capital requirement is concentrated in a handful of balance sheets and where a single new site is a material decision, which is the opposite of China’s franchise layer and India’s company-operated estate.
M&A
Consolidation in this market has already happened and has taken the form of exits rather than acquisitions: overlapping capacity left rather than being bought. Recent M&A activity is recorded as yes because the period’s consolidating events were acquisitions of smaller operators by larger ones, but the volume of deals is low and the strategic logic behind the next one is weak. There is no obvious second asset in Europe worth buying.
Technology & Innovation
Automation arrives where the basket justifies it
The European technology story is the opposite of China’s. Where the Chinese format optimises a 200 to 500 square metre shop-warehouse for order count, the European format optimises a large fulfilment centre for picks per hour, because the €68 basket can carry the capital and the €1 of margin per order cannot carry waste.
Rohlik’s German business is the reference case. Robotic picking arms went live in Berlin in August 2025, and Berlin subsequently set the group’s fulfilment productivity record at above 150 units per hour. That number matters more than it looks: at 150 units an hour and a €68 basket, a site’s labour cost per order is a function of items per order divided by 150, and each additional unit per hour of productivity is worth more than a percentage point of gross margin at this scale.
What the technology stack actually is
Four systems do the work. Slot and capacity management decides how many orders a site can accept in each fifteen-minute window, which is the constraint that makes predictable labour scheduling possible — the core advantage of scheduled over on-demand. Demand forecasting at SKU and site level decides wastage, which is the largest controllable cost in fresh grocery. Pick-path and putaway optimisation decides labour. Route sequencing decides the trip, which is the largest single line in the P&L.
None of these is novel technology. The European innovation is integration: the same software stack runs five national brands in five countries, which is how Rohlik operates Rohlik.cz, Knuspr, Gurkerl, Kifli and Sezamo on one platform. That is a software achievement with a direct financial consequence — group operating costs before share-based payments grew 22.3% against 32.8% revenue growth, and the gap is the platform being spread over more volume.
Why innovation intensity is moderate
Innovation intensity is assessed as moderate and patent activity as low. The technology is mature in the specific sense that the hard problems have been solved and the remaining work is cost reduction at the margin. Nobody in Europe is going to win this market with a technology step change; they will win it by being the operator whose automation amortises over more volume. Technology maturity stage is mature.
Market Risk
Four risks, and one of them is structural
1. Catchment density is a fixed constraint, not a temporary one. The format’s cost per order is a function of orders per square kilometre per day. Outside a limited set of European cores, that number cannot be reached at any plausible level of consumer adoption. This is the risk that explains the 6.54% growth rate: the market is not slow because demand is weak but because the number of places where the model works is finite.
2. The discounter sets the price. A full-basket operator matching supermarket prices has no pricing power and a structurally higher cost base. Any deterioration in buying terms — the loss of an alliance membership, a supplier withdrawing terms — moves directly against the €1.02 of adjusted EBITDA per order that the leading operator earns. That is a thin cushion for a strategic risk.
3. Labour cost and classification. The rider is paid per trip and the trip is the largest variable cost in the model. European classification rules and working-time limits are tightening, and every increment lands on a business whose entire operating profit is about one euro per order. This is the highest-probability risk in the market.
4. Planning and land use. Dark stores and urban fulfilment sites are a land-use question in European cities, and several municipalities have restricted them. A refused consent does not raise the cost of a site; it removes the catchment. Regulatory complexity is high for exactly this reason, and it is multi-jurisdictional: the constraint differs by country and often by municipality.
Risks assessed as low
Geopolitical exposure is low: this is a domestic European demand market with a European supply chain and no material trade exposure. Substitution risk is moderate rather than high, because the two substitutes — click-and-collect and the discounter’s own store estate — are the behaviours this model has already coexisted with for four years; the format that failed was the one substituting for a top-up trip, not the one substituting for the weekly shop. Overall market risk is moderate: the surviving model is economically coherent and the market is growing, just slowly and within a bounded footprint.
Regulatory Landscape
Four jurisdictions, four different answers to the same three questions
Europe is not one regulatory environment for this format. Every market asks the same three questions — is the rider an employee, can a warehouse open here, and who pays for the packaging — and answers each one nationally. Complexity is high and the approval pathway is multi-jurisdictional, which is the single largest structural difference between operating in Europe and operating in China or India.
Rider classification. This is the question that decides unit economics. Where riders are classified as employed, the cost per trip rises and the platform absorbs holiday, sick pay and social contributions. Where they are self-employed, the cost is lower and the legal risk is higher. The direction of travel across the EU is toward a presumption of employment with criteria-based derogations, and each member state is implementing it differently. For a model earning about €1 per order, the difference between the two regimes is the difference between profit and loss.
Planning and land use. There is no EU-level rule on dark stores; there are municipal ones. Several cities have restricted new urban logistics consents in residential districts on traffic, noise and nuisance grounds, and the constraint typically arrives as a refusal at the point of expansion rather than as a cost increase. Operators respond by locating at the edge of the catchment, which lengthens the trip and raises the cost per order — the regulation and the unit economics are the same conversation.
Packaging and waste. Extended producer responsibility and packaging rules translate directly into a per-order cost, and a full-basket operator is advantaged here relative to a convenience operator because the packaging cost is spread across €68 of goods rather than €20.
Data and consumer protection. Consent and profiling rules constrain the personalisation that drives both assortment and retail media yield. In practice this is a constraint on the advertising line rather than on the delivery line, and it is one reason the European advertising take rate in this cluster is the second-lowest of the five regions modelled.
The absence of a density cap
No European jurisdiction has imposed a numerical cap on fulfilment site density, which is the rule that would bite hardest. The constraints are consent-based and nuisance-based instead. That matters for forecasting: a density cap would produce a hard ceiling on volume, whereas the current regime produces a soft ceiling that shows up as a rising cost per order as operators are pushed outward.