
Global Woven Polypropylene Sacks Market Report, Size, Share and Forecast 2026–2033: 64 Billion Sacks, and the 35% Recycled Content Nobody Can Supply
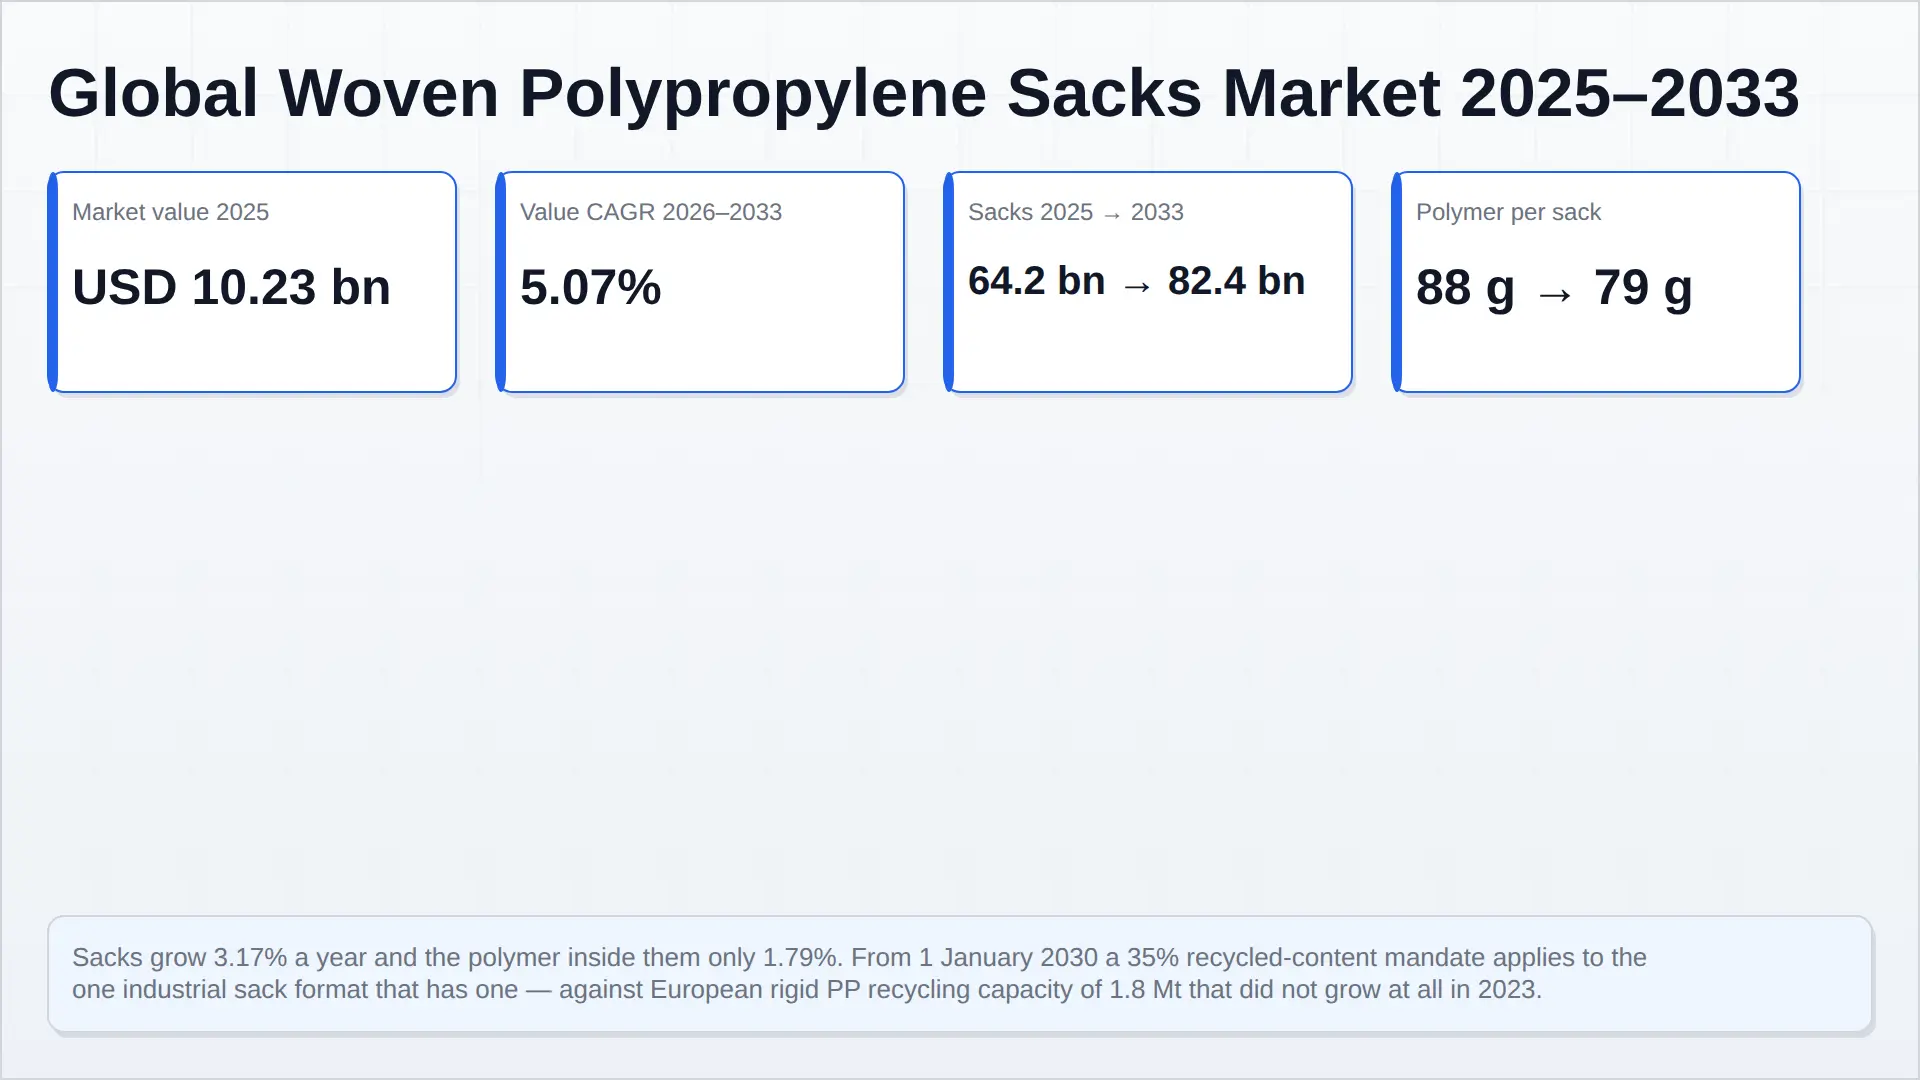
Woven polypropylene sacks are a USD 10,230 million market in 2025 reaching USD 15,190 million by 2033 at a 5.07 per cent value CAGR, on 64.2 billion sacks and 5,650 thousand tonnes of polymer. The headline conceals two very different businesses stacked on top of each other: a 3.17 per cent unit growth rate and a 1.79 per cent polymer growth rate, separated by the average sack falling from 88 grammes to 79. Units supply 58.5 per cent of the value growth and price and mix the remaining 41.5 — a volume market that is becoming a specification market at the margin, not the other way round.
The defining fact is that the only industrial sack format with a mandatory recycled-content obligation is this one. Regulation (EU) 2025/40 requires 35 per cent post-consumer recycled content in plastic packaging from 1 January 2030, rising to 65 per cent from 2040. A cement or fertiliser sack is not contact-sensitive packaging, so it sits in the higher of those two buckets, while paper sacks carry no recycled-content obligation at all. European sack makers alone would need about 227 thousand tonnes of recycled PP — 12.6 per cent of the EU27+3 installed rigid PP recycling capacity of 1.8 million tonnes, a capacity that did not grow in 2023 and that competes with automotive, crates and closures which can pay more per tonne. That is the binding constraint on this industry for the rest of the decade, and it is not yet in anybody's price.
The market is also structurally different from the paper sack market it is measured against. Grain, rice, flour and sugar is 21.1 per cent of value, cement and building materials 20.9, fertilisers and crop inputs 17.9 and feed 14.0 — four applications that are 74 per cent of the market and that track construction, subsidy regimes and food supply chains in Asia, Africa and Latin America rather than European retail specification. Cement is 20.9 per cent of value and supplies only 9.8 per cent of the growth, and by 2033 grain has overtaken it. Asia-Pacific is 44.0 per cent of value and 49.4 per cent of the growth; Europe is 15.0 per cent of value growing at 2.72 per cent.
What has not changed is why the format exists. At 20 sacks to a tonne of cement, a woven PP sack at USD 0.132 adds USD 2.64 of packaging to a tonne of product against USD 6.00 for the multiwall paper sack — 2.93 per cent of the product's value against 6.67, or 2.27 times cheaper. Paper wins where cement is expensive, carbon is priced and the buyer is a multinational. Everywhere else the woven sack still carries the cement, and the compliance burden has now flipped onto the format that was supposed to be losing on environmental grounds.
1. Market Snapshot
Sixty-four billion woven polypropylene sacks a year is the largest packaging market nobody writes about, and the number that matters most in it is not the count. The count grows 3.17 per cent a year. The polymer inside it grows 1.79 per cent. That gap is not a rounding difference — it is the whole economics of the industry, because a sack that carried 88 grammes of polypropylene in 2025 will carry 79 by 2033, and every gramme removed is revenue that leaves the converter and volume that never reaches the polymer producer.
Pheonix sizes the global woven polypropylene sack market at USD 10,230 million in 2025, reaching USD 15,190 million by 2033, a 5.07 per cent value CAGR, on 64.2 billion sacks and 5,650 thousand tonnes of polypropylene.
| Metric | 2025 | 2033 | CAGR 2026–2033 |
|---|---|---|---|
| Sacks consumed | 64.20 billion | 82.40 billion | 3.17% |
| Polypropylene consumed | 5,650 kt | 6,510 kt | 1.79% |
| Average polymer per sack | 88 g | 79 g | declining |
| Market value, ex-converter | USD 10,230 m | USD 15,190 m | 5.07% |
| Average realised price per sack | USD 0.1593 | USD 0.1843 | 1.84% |
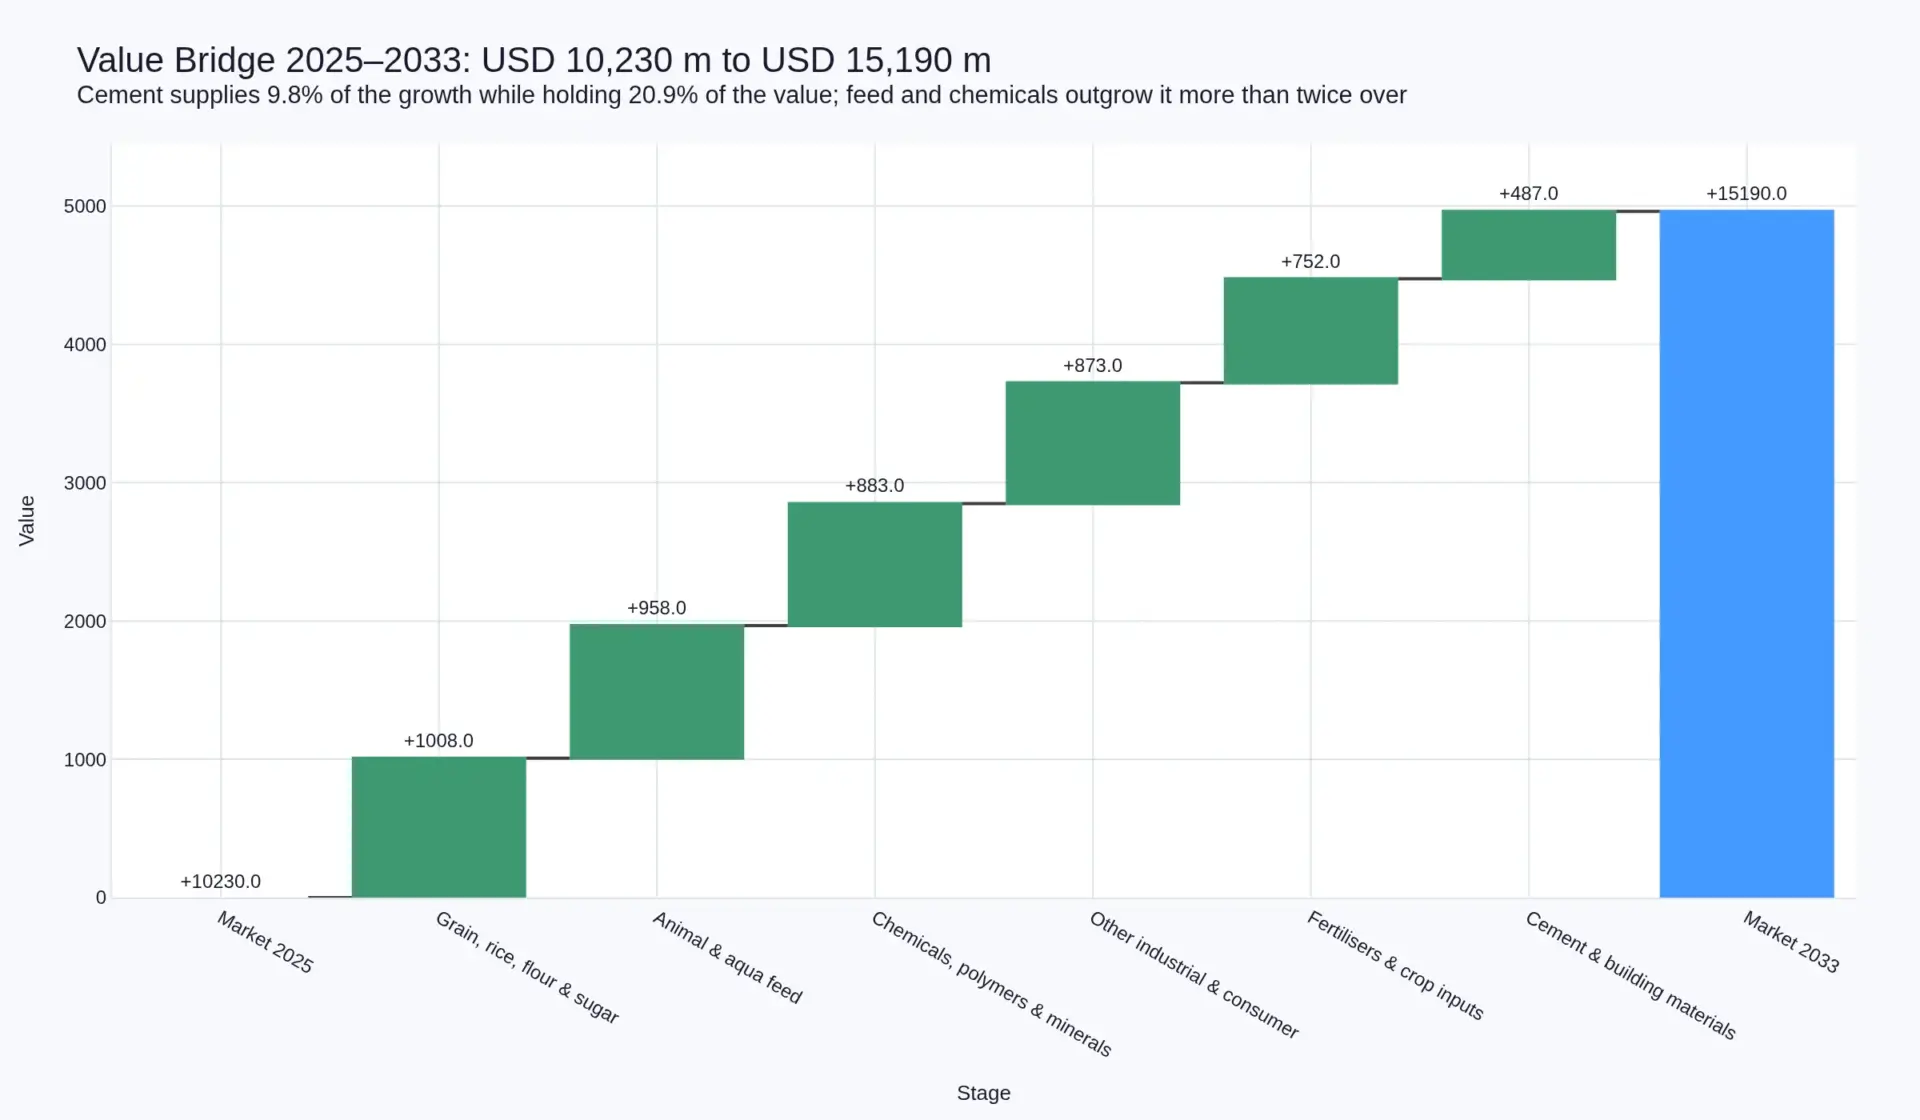
The arithmetic of 5.07 per cent is 3.17 per cent of units and 1.84 per cent of price and mix. Decompose the USD 4,960 million of value growth and 58.5 per cent of it comes from selling more sacks and 41.5 per cent from selling a better one. That is the opposite profile to the paper sack market it competes with, where the same decomposition runs the other way and most of the growth is price. Woven polypropylene is still a volume business. It is becoming a specification business at the margin.
The single most consequential fact in this market is a compliance deadline almost nobody in it is pricing. Regulation (EU) 2025/40 requires any plastic part of packaging placed on the European market to contain a minimum percentage of recycled content recovered from post-consumer plastic waste: 35 per cent for plastic packaging in general from 1 January 2030, rising to 65 per cent from 2040 (EUROPEN, PPWR — all obligations, 2025; European Commission, Packaging and Packaging Waste Regulation briefing). A 50-kilogram sack of cement or fertiliser is not contact-sensitive packaging. It falls squarely into the 35 per cent bucket.
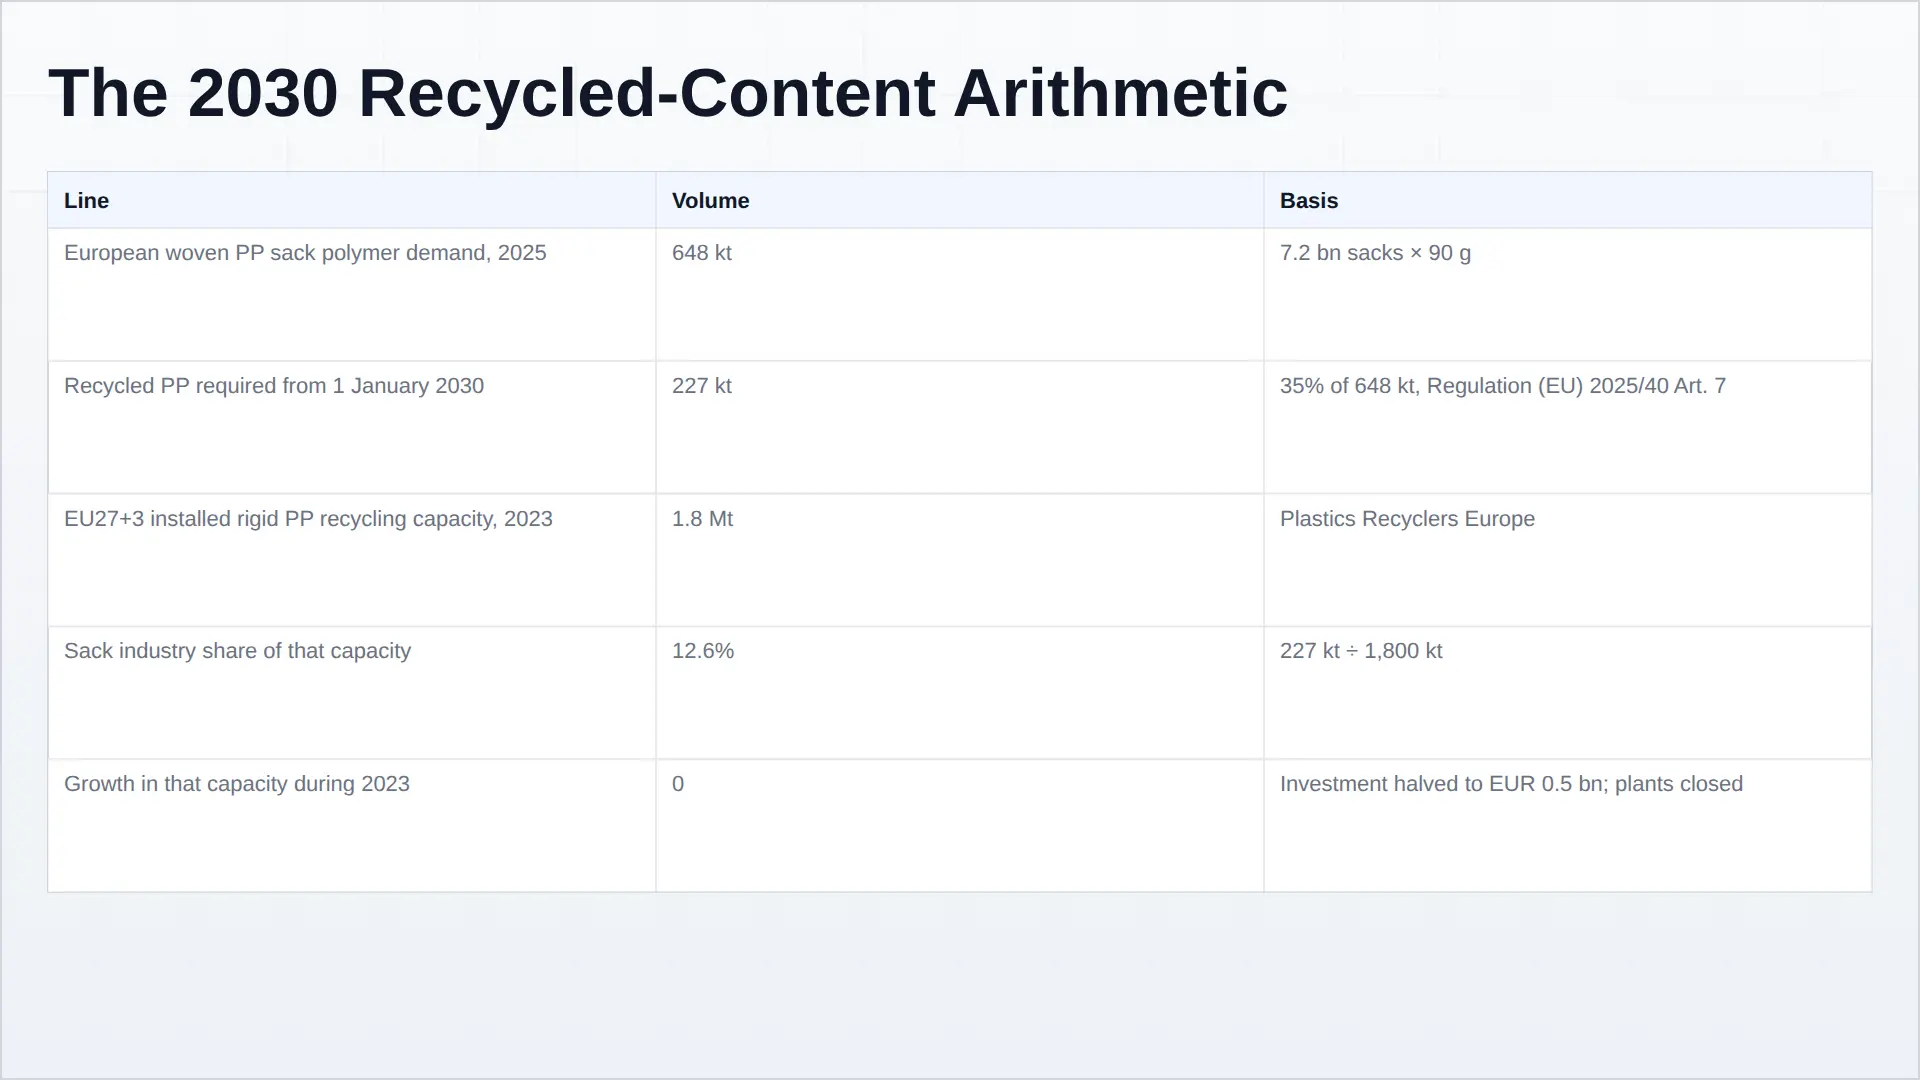
Run that against Europe's own numbers and the market has a problem it has not yet named. European woven PP sack consumption of roughly 7.2 billion sacks at 90 grammes is 648 thousand tonnes of polymer. Thirty-five per cent of it is 227 thousand tonnes of recycled PP. EU27+3 installed rigid PP recycling capacity was 1.8 million tonnes in 2023 — and it did not grow that year, held flat by weak demand, high energy costs and competition from cheaper virgin and imported recyclate (Plastics Recyclers Europe, Rigid Polyolefins Recycling Market Hits Standstill, April 2025; Plastics Recyclers Europe, Plastics Recycling Industry Figures 2023). The European sack industry alone would need 12.6 per cent of the entire installed rigid PP recycling capacity of Europe — while competing for it with automotive, crates, buckets and closures, all of which have their own mandates and can pay.
And the format that has the mandate is the format that spent a decade being told it would lose to paper. The same regulation gives paper sacks recyclability grades but no recycled-content obligation at all; what paper got instead was the EU Deforestation Regulation. For once, the compliance burden sits on the plastic side of the industrial sack argument, and nobody has yet worked out where the recyclate comes from.
The reason the market exists at all is arithmetic that has not changed in thirty years. At 20 sacks to a tonne of cement, a woven polypropylene sack at USD 0.132 puts USD 2.64 of packaging into a tonne of the product; the multiwall paper sack at USD 0.30 puts in USD 6.00 (Pheonix, Global Cement Packaging). Against a mill-gate cement price near USD 90 a tonne, that is 2.93 per cent of the product's value against 6.67. Paper costs 2.27 times what woven polypropylene costs. In markets where cement is expensive, carbon is priced and the buyer is a multinational, paper wins. In the rest of the world — which is most of the world — the woven sack still carries the cement, and it will still be carrying it in 2033.
2. Market Definition and the Five Boundary Calls
What this report counts, and the five places where a different answer would change the market by billions. Every sizing argument in a market this fragmented eventually reduces to boundary calls, so they are stated first rather than buried in the methodology.
2.1 Flexible intermediate bulk containers are out
An FIBC — the one-tonne jumbo bag — is made on the same circular looms from the same tape in the same plants, and it is not in this market. It is a different product with a different buyer: a technical textile carrying UN performance-testing and marking obligations, sold to a logistics or bulk-handling function rather than a packaging buyer, priced per unit at fifty to a hundred times a sack. Including FIBC would roughly double the unit value of the market while adding nothing to the analysis, and it would break comparability with the paper sack and cement packaging reports this one sits alongside.
2.2 The rest of the raffia sector is out
Woven polypropylene technology produces tarpaulins, leno bags for fruit and vegetables, wrapping fabrics, geotextiles and agro-textiles from the same tape extrusion lines. In India alone the raffia sector's installed capacity is about 3 million tonnes across roughly 1,200 firms, 1,500 tape plants and 42,000 looms, and sacks are only part of what that capacity makes (Lohia Corp, Technical Training and Research Centre, Indian raffia sector profile). None of the adjacent products are counted here.
2.3 Polyethylene raffia is inside the count where it substitutes
A minority of industrial woven sacks are made from high-density polyethylene rather than polypropylene, mostly in West Africa and parts of South Asia and mostly where a converter's loom and resin supply favour it. Where such a sack substitutes one-for-one for a PP sack at the same filling line it is inside this count; where it is a distinct product it is not. The polymer tonnage series is PP-dominant, and the report treats it as a PP series.
2.4 Retail and carrier bags are out, and the distinction now matters commercially
The regulatory pressure that has hit thin plastic carrier bags across dozens of jurisdictions over the last decade has not applied to industrial sacks, which are neither single-use in the consumer sense nor substitutable by a paper alternative at the same cost. But the reputational spillover is real, and section 6.5 treats it as a restraint rather than an irrelevance.
2.5 VALUE is ex-converter, VOLUME is polymer consumed
Value is the price a sack converting plant charges the company that fills the sack, in US dollars, excluding freight to the filling plant. Volume is polypropylene consumed by the industry, in thousand tonnes — not filled-product tonnage and not sack count, because polymer tonnage is the quantity that connects this market to a polypropylene market and a sack count does not. Overlap warning: the polymer consumed here sits inside the polypropylene market and must not be added to it (Pheonix, Global Polypropylene and Polypropylene Composites); the sacks sit inside the wider packaging market (Pheonix, Global Packaging) and the cement-driven share of them overlaps the cement packaging report.
3. Market Size and Forecast
3.1 How the 2025 Base Was Built
There is no usable global unit series for woven polypropylene sacks. No trade association publishes one, no customs heading isolates them cleanly, and the industry's own capacity statistics are national and incomplete. The base is therefore built from three physical anchors and a price build, with the coefficients stated so a reader can replace them.
Anchor one is India, the world's largest producer and the only market with usable structural data: roughly 3 million tonnes of installed raffia capacity across about 1,200 firms, 1,500 tape plants and 42,000 looms, with the sector estimated to grow at 5 to 6 per cent (Lohia TT&RC). Stripping out tarpaulin, leno and geotextiles, and converting at the blended 88 grammes, puts Indian sack output in the region of 18 to 20 billion units. That is 29.4 per cent of the global count on 20.6 per cent of the value, which is exactly the profile the country's cost base predicts.
Anchor two is cement, the only end use with a published global tonnage. Global cement production was 4,034 million tonnes in 2025, of which 1,300 million tonnes — 32.2 per cent — left the plant in bags, sacks or small bulk containers (USGS Mineral Commodity Summaries 2025, cement; Pheonix, Global Cement Packaging). At 20 sacks to a tonne that is 26.0 billion bags of all materials, against the 28.9 billion the cement packaging report counts once small bulk containers are included. Of that population, paper takes roughly 10 billion, woven polypropylene takes 16.2 billion including sand, aggregates, gypsum and lime, and PP valve sacks and small FIBCs take the residual. The reconciliation closes, which is the most that can honestly be said for it.
Anchor three is agricultural and feed tonnage. Global compound feed production was 1,396 million tonnes in 2024, up 1.2 per cent, across 142 countries and 28,235 mills surveyed (Alltech Agri-Food Outlook 2025). Most of it moves in bulk or in FIBC, which is why 8.4 billion 25- and 50-kilogram sacks is a small share of the tonnage and a large share of the value: feed is one of the few applications where a woven sack is bought for print, barrier and brand rather than for cost.
Everything else in the base is a Pheonix allocation on top of those three anchors: grain, rice, flour and sugar at 14.6 billion sacks, fertilisers and crop inputs at 11.8, chemicals and polymers at 6.9, and other industrial and consumer applications at 6.3. Price was built by format — USD 0.132 for a plain cement sack, USD 0.108 for an unlaminated open-mouth grain sack, USD 0.207 for a BOPP-laminated printed sack, USD 0.284 for a gusseted construction with a loose liner — and aggregated to the USD 0.1593 average.
3.2 The Regional Allocation Is the Forecast
The regional split is not a share table; it is a statement about where the growth can come from.
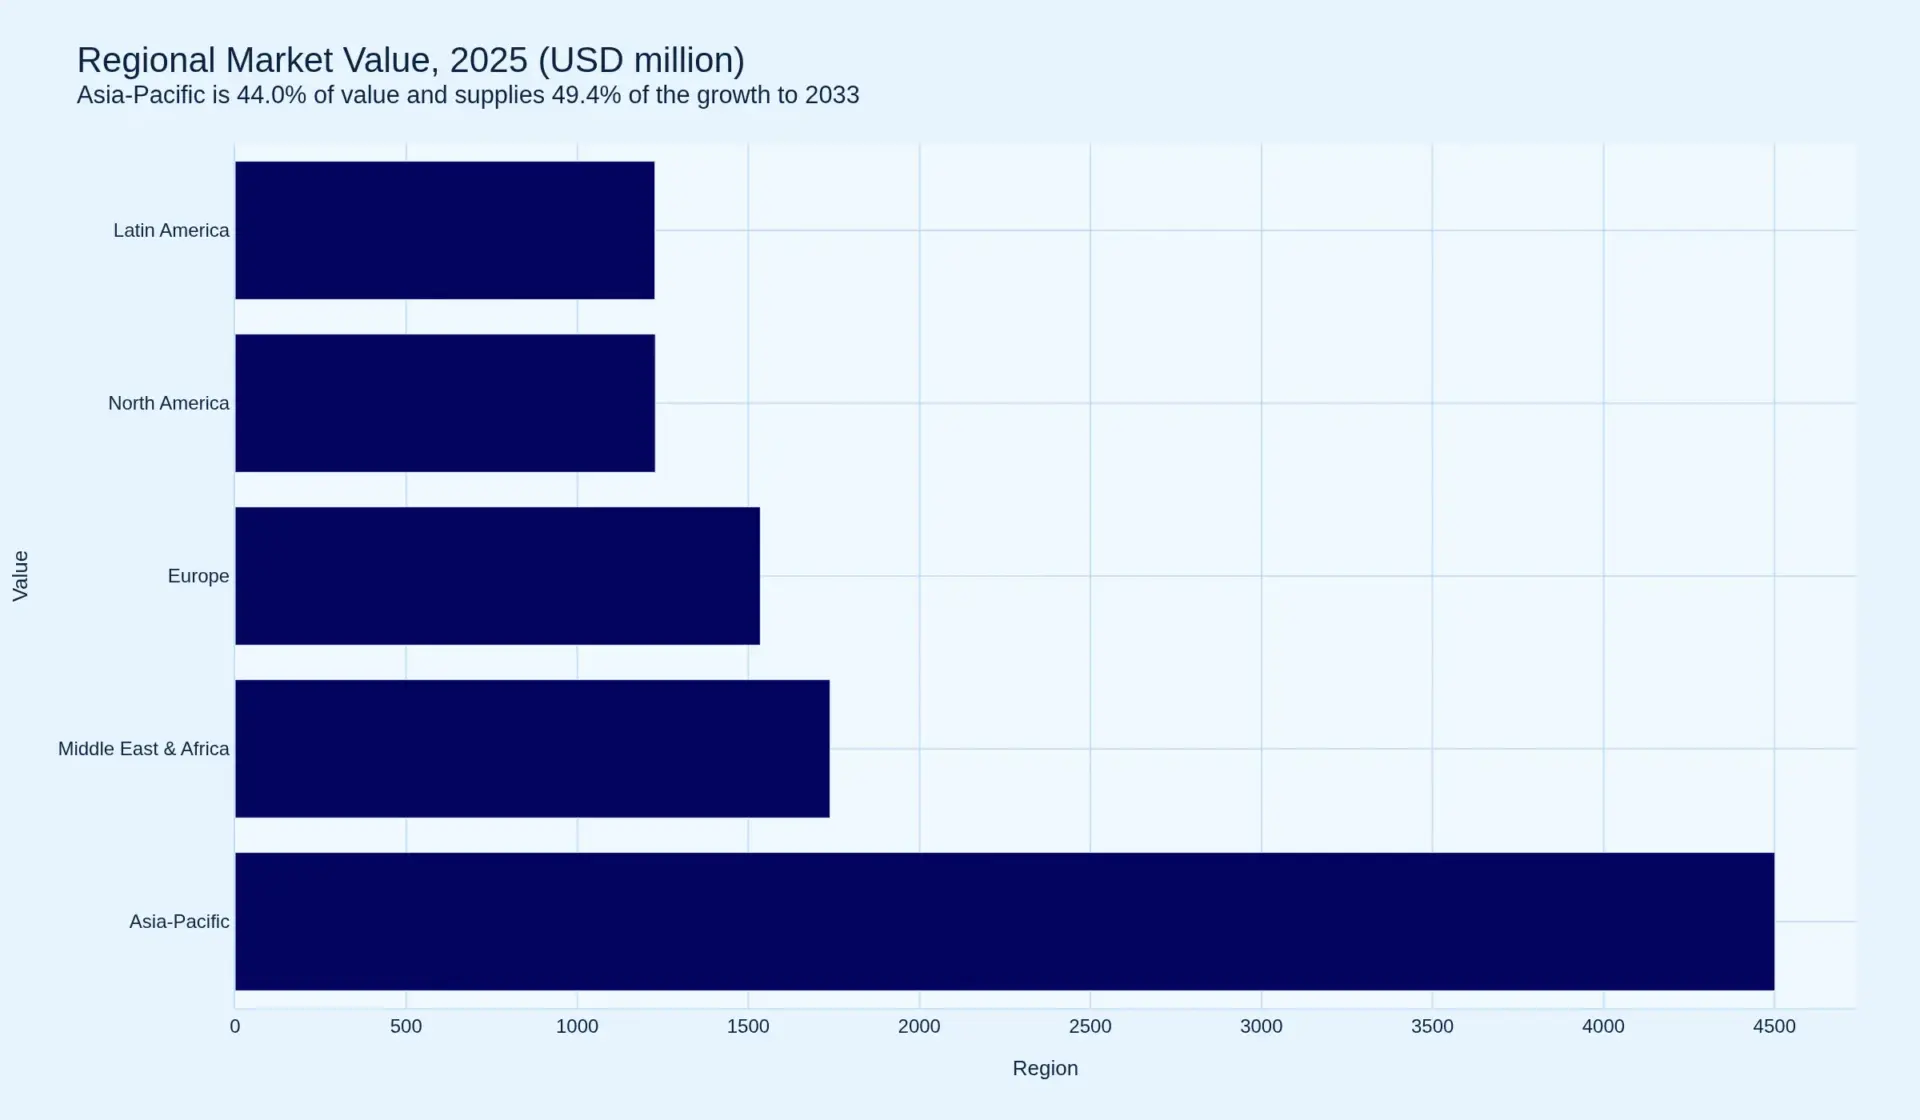
| Region | 2025 value (USD m) | 2033 value (USD m) | CAGR | Share 2025 |
|---|---|---|---|---|
| Asia-Pacific | 4,501 | 6,990 | 5.49% | |
| Middle East & Africa | 1,739 | 2,880 | 6.50% | |
| Europe | 1,535 | 1,900 | 2.72% | |
| North America | 1,228 | 1,640 | 3.68% | |
| Latin America | 1,227 | 1,780 | 4.75% | |
| Total | 10,230 | 15,190 | 5.07% |
Asia-Pacific is 44.0 per cent of the value and supplies 49.4 per cent of the growth. The Middle East and Africa is the fastest-growing region at 6.5 per cent and the least documented. Europe is the slowest at 2.7 per cent and the most regulated — a combination that makes it the region where the specification premium is highest and the volume outlook worst. The forecast's engine is African and Asian construction, and its constraint is European regulation of a market Europe barely consumes.
3.3 The Decomposition Is the Finding
Three growth rates describe this market and they diverge in a way that matters to three different audiences. Sack counts grow 3.17 per cent. Market value grows 5.07 per cent. Polymer volume grows 1.79 per cent. The value growth is 58.5 per cent units and 41.5 per cent price and mix; the gap between unit growth and polymer growth is the average sack falling from 88 grammes to 79.
Four forces produce that fall, and three of them are converter decisions rather than resin decisions. Tape is extruded thinner as line speeds and draw ratios rise. Calcium carbonate filler loading rises, displacing polymer with mineral at a fraction of the cost — the woven sack's equivalent of down-gauging, and a lever the converter pulls precisely when resin is expensive. Lamination film is downgauged or replaced by a coating. And woven construction migrates from heavier to lighter fabric weights as loop strength improves.
Then a fifth force pushes the other way, and it is the one nobody has costed. Recycled polypropylene is not a drop-in at equal denier. Recyclate has a wider molecular-weight distribution and lower and more variable tensile strength, so a tape carrying 35 per cent rPP has to be made heavier to hold the same load, or the fabric has to be woven denser, or the sack fails its drop test. The mass reduction path in this forecast and the recycled-content mandate pull in opposite directions from 2030, and the honest position is that 1.79 per cent polymer growth is the pre-mandate number; the post-2030 number is likely to be a little higher, and the sack count will not be the reason.
For the polymer producer the implication is uncomfortable and specific: your customer's unit volume grows 3.17 per cent, your volume grows 1.79 per cent, and from 2030 a legislated share of what remains is not yours to sell. For the converter the implication is the reverse: the specification premium is 1.84 per cent of price and mix a year, it is the only growth that is not a volume bet, and it is where the margin has to come from in a market with 42,000 looms in one country alone.
4. Four Structural Shifts Defining 2026–2033
4.1 The Recycled-Content Mandate Landed on the Only Format That Has One
For fifteen years the industrial packaging argument ran in one direction: plastic is under pressure, paper is the answer. Regulation has now delivered the opposite of what that argument predicted, in a way that is easy to miss because it is buried in Article 7 of a regulation about packaging waste rather than in anything about industrial sacks.
Under Regulation (EU) 2025/40, from 1 January 2030 any plastic part of packaging placed on the market must contain a minimum share of recycled content recovered from post-consumer plastic waste, calculated as an average per manufacturing plant and per year: 30 per cent for contact-sensitive PET, 10 per cent for other contact-sensitive plastics, 30 per cent for single-use plastic beverage bottles and 35 per cent for plastic packaging other than those categories, rising to 65 per cent from 2040 (EUROPEN, PPWR — all obligations). A cement sack, a fertiliser sack, an aggregates sack and a resin sack are all in the 35 per cent bucket. Paper sacks have no equivalent obligation: paper gets recyclability grades from 2030 and recycling-at-scale from 2035, and recycled-content mandates do not apply to it at all.
So the format that was supposed to be losing on environmental grounds is the one that now has a hard, dated, enforceable material requirement — and it is a requirement the supply chain cannot currently meet. Europe's installed rigid PP recycling capacity is 1.8 million tonnes, flat in 2023, and the industry's own association is blunt about why: weaker demand amid global polyolefin oversupply, high energy costs, and competition from lower-cost imports of both virgin and recycled polymer (Plastics Recyclers Europe, April 2025).
The arithmetic is 227 thousand tonnes of recycled PP needed by European sack makers alone from 2030 — 12.6 per cent of the continent's entire installed rigid PP recycling capacity. Every other rigid PP application with a 2030 obligation is bidding for the same tonnes, and most of them can pay more per tonne than a cement sack converter working on a two-cent conversion margin. This is the defining competitive fact of the next five years in this market, and it is why the winners will be converters who signed recyclate offtake before they needed it rather than converters who waited for the mandate.
4.2 The Unit Count Is a Decoy for the Polymer Industry
A sack is 88 grammes of a commodity that sells for around USD 1,000 to 1,300 a tonne. At that ratio the polymer is roughly 55 to 65 per cent of the cost of an unlaminated sack, which means the converter's entire commercial skill is getting more sacks out of a tonne of resin without failing a drop test.
The industry has become very good at it. Average polymer per sack falls from 88 grammes in 2025 to 79 by 2033 across this forecast, driven by thinner tape, higher filler loading, lighter lamination and the migration of smaller packs to lighter fabric weights. The consequence for anyone selling resin into this market is that a 3.17 per cent unit CAGR converts into a 1.79 per cent polymer CAGR, and the difference is permanent rather than cyclical: it is a capability curve, not a price effect, and it does not reverse when resin gets cheap.
What does reverse is the direction of travel from 2030. Recycled content is heavier per unit of strength than virgin polymer, and it is being mandated rather than chosen. The likely path is a polymer curve that flattens to 1.79 per cent through the late 2020s and then ticks back up modestly after the mandate — not because the industry stopped innovating, but because the law asked it to put material back in.
4.3 This Is a Development Market, Not a Packaging Market
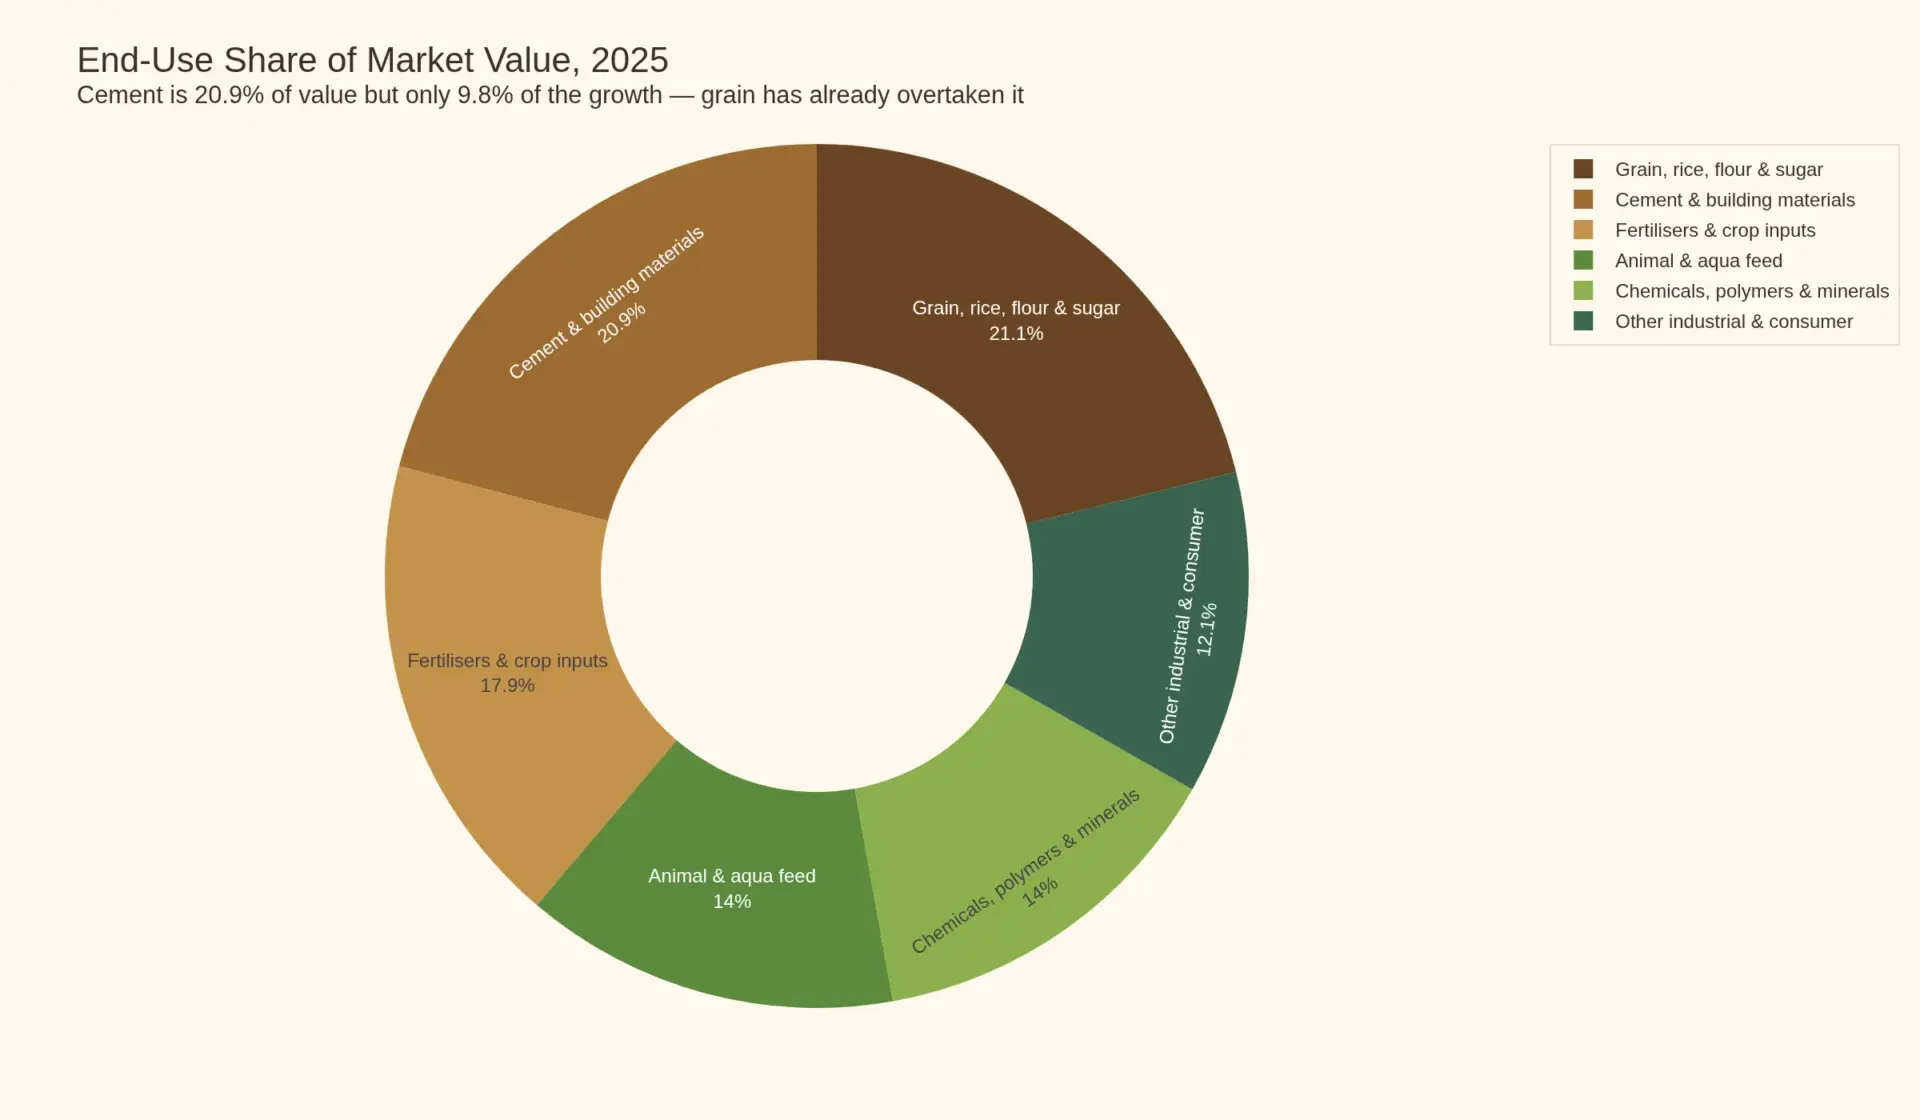
Read the end-use table and the geography falls out of it. Grain, rice, flour and sugar at 21.1 per cent, cement and building materials at 20.9, fertilisers and crop inputs at 17.9, animal and aqua feed at 14.0 — these are the four things a developing economy moves in sacks, and they are 74 per cent of the market.
This is the structural difference between the woven PP sack market and the paper sack market it is compared with. Paper sacks are a European and North American product with a developing-world fringe: 30 per cent of units in Europe and 34 in Asia-Pacific. Woven PP sacks are the reverse. Their demand tracks construction activity in India, Indonesia, Vietnam, Nigeria and Egypt; fertiliser subsidy regimes and food-security stockholding; and the degree to which a country's milling and feed industries are still bagging rather than shipping in bulk.
Two consequences follow. First, this market's growth is a function of infrastructure spending and agricultural policy in countries with weak currencies, which makes it volatile in dollar terms in a way its unit count conceals. Second, the buyers are governments, subsidy agencies and a long tail of regional fillers — not the multinationals whose procurement teams set packaging specification in Europe and North America. That is why specification travels more slowly here, and why the price and mix contribution is 1.84 per cent rather than the 2.10 per cent the paper side achieves.
4.4 The Resin Cycle Is the Market's Real Cycle
The 2021–2022 polypropylene spike is the event this industry actually remembers, and its shape is instructive. Resin roughly doubled, converters on annual fixed-price contracts absorbed the difference, and the industry discovered that a sack maker with no indexation is a leveraged bet on a commodity it does not trade. The 2023 correction then arrived with destocking and weak construction demand at the same time, and by 2025 the polymer market had swung to structural oversupply — the phrase the recycling industry itself uses to explain why recyclate demand collapsed (Plastics Recyclers Europe, April 2025).
That oversupply is good for converters' input costs and bad for the recyclate story, which is the tension at the heart of section 4.1: virgin resin is cheap and getting cheaper, and the regulation is insisting on the more expensive alternative. A market in which the mandated input costs more than the permitted one is a market where compliance is a cost line to be minimised rather than a premium to be earned — until a customer or a public tender makes it a qualification criterion, which is what happened to recyclability in European retail packaging a decade earlier.
5. Market Drivers
5.1 The Bagged-Versus-Bulk Frontier in Emerging Construction
Thirty-two per cent of the world's cement leaves the plant in a bag or a small container, and that share is not a constant — it is a frontier that moves with the maturity of a construction market. Bulk wins where a buyer is large enough to take a tanker and a ready-mix supply chain exists; bags persist where construction is incremental, retail and dispersed. In the United States, 70 to 75 per cent of cement never sees a sack; in India, bagged sales remain a large majority (Pheonix, Global Cement Packaging).
The driver for woven sacks is therefore not rising cement production. It is the persistence of the bagged share in exactly the markets where cement output is growing, and the delay in the ready-mix transition that would remove it. That is a demographic and urbanisation driver, and it is the single largest reason Asia-Pacific supplies half this market's growth.
5.2 Fertiliser Subsidy and Food-Security Stockholding
Fertiliser is the second-largest sack end use by value at 17.9 per cent, and the least market-like. In much of South Asia and parts of Africa, urea and NPK move through subsidy regimes that determine both the volume purchased and the bag in which it is sold — often a subsidised 45- or 50-kilogram bag with a mandated print layout, procured centrally and paid on a government cycle. Global fertiliser use runs at close to 190 million tonnes of nutrients a year and the data series that tracks it is national rather than commercial (IFA, IFASTAT fertilizer consumption; Our World in Data, fertilizer consumption).
Two structural properties make this driver unusually valuable to a sack converter: subsidised fertiliser tends to be bagged rather than bulked because it is sold to smallholders through a retail network, and the specification is set by regulation rather than by price negotiation. It is the most defensible volume in the market, and it is also the most exposed to a fiscal decision nobody in the industry can influence.
5.3 The 50-Kilogram Standard and Mechanical Robustness
The woven PP sack won its share by being the only format that survives the journey a bagged commodity actually makes — stacking, dropping, hooking, sun, rain, port handling and a two-week truck ride on an unmade road. A 50-kilogram sack dropped from 1.2 to 1.5 metres onto concrete, repeatedly, is the test that governs specification, and woven fabric with an 850 to 1,000 denier tape passes it at a cost no paper or film construction can match.
That robustness is why the format holds applications where the product inside is worth far more than the sack: resin bags, carbon black, feed additives, seeds. It is also why the industry's technical trajectory is about maintaining strength at lower mass rather than about increasing it — and why the recycled-content mandate is a genuine engineering problem rather than a procurement one.
5.4 Recycled Content Becomes a Tender Lever Before It Becomes a Cost
In Pheonix's primary work with converters and buyers through 2026, the pattern was consistent: recycled-content capability is being asked about in European and multinational tenders two to four years before the obligation bites, and being priced at zero by the buyer while being asked about at length. That is the classic signature of a specification that is about to become a qualification criterion. The converter who can show a 30 per cent rPP sack with passing drop-test data and a mass-balance or plant-average methodology is answering a question its competitors cannot yet answer.
It is also where the paper-versus-plastic argument gets genuinely interesting again. Paper sacks have no recycled-content obligation but do carry the deforestation due-diligence burden on virgin fibre. Woven PP sacks have no deforestation exposure but carry a recycled-content mandate. Both formats now have a documentation problem, and the buyer's choice will increasingly turn on which file is easier to produce.
5.5 Lamination, Print and the Migration Into Branded Applications
The BOPP-laminated, rotogravure-printed woven sack turned a commodity into a brand surface. Pet food, rice, flour, sugar, seeds, agrochemicals and aquaculture feed are all applications where the sack is the only advertising a product gets, and they price at 0.20 to 0.29 dollars against 0.11 for an unlaminated grain sack. Every share point that migrates from unprinted to laminated is a price-and-mix gain that has nothing to do with volume.
This is the same mechanism that gave the paper sack industry its 2.10 per cent price growth, operating in a market with a much larger base of unprinted volume to convert. It is why the price and mix contribution in this forecast is 1.84 per cent rather than something smaller, and why it is the number a converter should be managing rather than sack count.
6. Market Restraints
6.1 Bulk and FIBC Substitution Remove Demand Rather Than Redistributing It
This is the restraint that matters most and gets modelled least. When a cement plant installs a silo or a customer switches to a one-tonne FIBC, the sack sale does not move to a competitor — it ceases to exist. Twenty 50-kilogram sacks become one jumbo bag or none at all. Every point of bagged share that converts to bulk is removed from this market permanently, and the direction of travel across a development cycle is one-way.
The mitigation is that the same industrialisation that brings silos also brings more construction, more feed milling and more processed food, so the net effect in a growing economy is usually positive. But it is positive by a smaller margin than the tonnage numbers imply, and in a mature market it is negative. It is the reason Europe grows at 2.72 per cent in this forecast rather than at its GDP rate.
6.2 Resin Price Transmission and the Filler Escape Valve
Polypropylene is 55 to 65 per cent of the cost of an unlaminated sack and the converter has almost no pricing power against a buyer who can qualify another supplier. The industry's response is not hedging — it is formulation: calcium carbonate loading rises when resin is expensive, because mineral filler at a fraction of the resin price displaces polymer while maintaining calliper and printability.
Filler loading is the most under-discussed variable in this market. It is why resin demand can fall faster than sack output in a high-price year, and it is why a polymer producer's volume forecast that assumes a stable gramme-per-sack should be treated with suspicion. It is also, quietly, a recyclability problem: a heavily filled tape is harder to recycle back into the same application, which puts the cost-reduction lever in direct conflict with the recycled-content mandate.
6.3 Recyclate Scarcity Is the Binding Constraint, Not the Target
Section 4.1 sets out the arithmetic: 227 thousand tonnes needed by European sack makers, against 1.8 million tonnes of installed rigid PP recycling capacity that did not grow in 2023. Three further facts make it worse. Rigid PP and HDPE together account for slightly more than a quarter of European recycling infrastructure, so the capacity is shared with every other rigid polyolefin application. The recycling industry's investment fell to EUR 0.5 billion in 2023 from EUR 1 billion in 2022, and facilities closed. And chemical recycling, the technology that could lift quality to food and technical grades, stood at about 150 thousand tonnes of installed capacity (Plastics Recyclers Europe, Industry Figures 2023).
The market consequence is a price and availability risk that arrives on a fixed date regardless of whether supply exists. Converters who have not secured recyclate will either pay a premium that a two-cent conversion margin cannot absorb, or fail the requirement, or — the likely short-run outcome — rely on plant-average accounting that satisfies the letter of the rule while changing little about the sack.
6.4 Fragmentation With No Pricing Power
The barriers to entry are a tape extrusion line, a circular loom, a lamination line and a stitching unit — capital in the hundreds of thousands to low millions of dollars, not the hundreds of millions a polymer plant or a kraft machine costs. In India that has produced about 1,200 firms with 42,000 looms. Globally it has produced an industry in which no participant holds a double-digit share and price converges on resin cost plus a thin conversion margin within one contract cycle.
What keeps a converter in business is not capacity but customer approval: a filler qualifies a specification, a print design and a supplier, and switching cost sits in that qualification rather than in the machine. That is a real moat at the level of an account and no moat at all at the level of an industry — which is why consolidation in this market happens through customer lists rather than through assets, and why it barely happens at all.
6.5 Reputational Spillover From Single-Use Plastic Policy
Industrial sacks have largely escaped the carrier-bag regulations that removed billions of thin plastic bags from circulation. But the buyer's environmental team reads the same headlines as everyone else, and an industrial sack that ends up in a ditch after a construction project is a photograph. In Pheonix's primary conversations, the pressure reported by converters was rarely regulatory and almost always reputational and customer-driven: multinational buyers asking whether the format is defensible in five years, in a way they did not ask in 2019.
That is a real restraint on volume in exactly the applications that carry the highest price per sack — chemicals, food, pet food, seeds — and it is why the recycled-content mandate is, on balance, an opportunity for the format rather than a threat. It gives a converter something to show a buyer who is asking a question the paper industry has been answering for a decade.
6.6 The Economics of Shipping Air
A sack weighs 88 grammes and occupies 60 to 70 litres when filled. Empty, a thousand of them compress into a bale the size of a small car and weigh under a hundred kilograms. That makes empty sacks a cheap thing to ship and a cheap thing to make anywhere, which caps the economic radius of a commodity sack plant at a few hundred kilometres and pushes production to wherever electricity, labour and resin logistics are cheapest. India, Vietnam, Turkey and Egypt have built export industries on that arbitrage, and the constraint on it is freight rates and anti-dumping risk rather than cost.
7. Segmentation
7.1 By Format
| Format | Share of units, 2025 | Typical price | Where it competes |
|---|---|---|---|
| Sewn open-mouth sack | 46% | USD 0.108 | Grain, rice, sugar, fertiliser, feed — the volume base |
| BOPP-laminated printed sack | 29% | USD 0.207 | Pet food, flour, rice, seeds, branded agrochemicals |
| Block-bottom valve sack | 13% | USD 0.176 | Cement, chemicals, minerals — high-speed filling lines |
| Gusseted or liner-fitted sack | 8% | USD 0.284 | Hygroscopic and food-grade products requiring a barrier |
| Small FIBC and other | 4% | USD 0.320 | Bulk-transition applications below one tonne |
The valve sack is the format to watch. It is the only construction in this market that requires a filling-line change at the customer, and every such change is a mix upgrade of roughly two-thirds on price. Its 13 per cent of units carries 22.6 per cent of value, and it is the format where the paper sack's specification advantage has been most successfully neutralised.
7.2 By Capacity
Sacks are specified by fill weight, and fill weight determines fabric weight, loom width and seam construction: 5 to 10 kilograms for retail and smallholder products, 10 to 25 for flour, sugar and feed, 25 to 50 for grain, fertiliser and cement, and above 50 for minerals and small bulk. The 25-to-50 band is 58 per cent of units and is where the entire commodity volume of the world sits.
7.3 By Construction and Barrier
Three construction routes divide the market: unlaminated woven fabric for dry, non-hygroscopic products; laminated fabric where print and moisture protection both matter; and liner-fitted constructions for hygroscopic chemicals and food. A fourth is emerging — breathable, micro-perforated fabric for products that must not sweat, and rPP-blended constructions that satisfy a recycled-content claim. The last of these is the only construction route in this market with a legislated demand curve behind it.
7.4 By End Use
| End use | 2025 value (USD m) | Share | CAGR to 2033 |
|---|---|---|---|
| Grain, rice, flour and sugar | 2,161 | 21.1% | 4.9% |
| Cement and building materials | 2,138 | 20.9% | 2.6% |
| Fertilisers and crop inputs | 1,829 | 17.9% | 4.4% |
| Animal and aqua feed | 1,436 | 14.0% | 6.6% |
| Chemicals, polymers and minerals | 1,428 | 14.0% | 6.2% |
| Other industrial and consumer | 1,238 | 12.1% | 6.9% |
| Total | 10,230 | 100% | 5.07% |
Cement is 20.9 per cent of value and supplies only 9.8 per cent of the growth. By 2033 it is no longer the largest end use — grain passes it — and that is the structural inversion in this market: the application that defined the woven sack is growing at less than half the market rate and is being overtaken by the consequences of a growing middle class in Asia.
7.5 By Route to Market
Three routes divide the customer base. Direct supply to large fillers — cement groups, fertiliser companies, mills, feed producers — on annual contracts with qualified specifications, which is where volume and stability sit. Distributor and trading-house supply to the SME and agricultural tail, which is where most of the unit count sits and where credit risk lives. And import, which in Africa, the Middle East and parts of Latin America accounts for a large share of supply and sets a price ceiling that domestic converters cannot exceed.
8. Regional Analysis
8.1 Asia-Pacific — USD 4,501 m, 5.49% CAGR
Asia-Pacific is 44.0 per cent of the value and 29.4 per cent of the units sit in India alone. The region's demand profile is dominated by bagged cement, subsidised fertiliser, rice and milling, which makes it simultaneously the largest and the cheapest part of the market at USD 0.113 a sack on average. The growth is not a packaging story: it is construction, urbanisation and a food supply chain that still moves in 50-kilogram units. China is the swing factor and the least predictable — a large woven sack industry serving domestic and export customers, facing its own packaging regulation and its own construction slowdown.
8.2 Middle East & Africa — USD 1,739 m, 6.50% CAGR
The fastest-growing region, and the one where capacity and demand are least connected. African cement demand is growing, bagged share is high, and domestic converting capacity is thin — which is why Indian, Egyptian and Turkish converters supply much of it. Currency risk is the defining commercial fact: a dollar-denominated resin cost against local-currency revenue means a converted sack can be profitable at 8 cents and loss-making at 12, and the industry's margin is set by the exchange rate rather than by its own efficiency. This is also where the single-use plastic debate is most likely to arrive late, fast and badly.
8.3 Europe — USD 1,535 m, 2.72% CAGR
Europe is 15.0 per cent of value, growing at half the global rate, and the only region where the regulatory framework is a first-order commercial variable rather than a background one. Three pressures operate simultaneously: bulk and FIBC substitution removing demand in the construction end; paper substitution in premium construction and food applications; and the PPWR recycled-content mandate that arrives in 2030 with insufficient recyclate behind it. Europe is where the specification premium is highest and the volume outlook worst, which makes it the region where the right strategy is the narrowest — target the applications that cannot move to paper and cannot move to bulk, and win them on recycled content and print.
8.4 Latin America — USD 1,227 m, 4.75% CAGR
Brazil and Mexico dominate, with a cement and sugar industry that still bags substantially and a converter base that is better integrated than most emerging markets. Pet food is the region's specification frontier — a packaged, branded, print-critical product with growth behind it, and the reason UFlex built an 80 million unit WPP plant in Mexico specifically to serve pet food across the Americas (UFlex, Q2 FY26 investor presentation).
8.5 North America — USD 1,228 m, 3.68% CAGR
The highest specification standards and the lowest bagged share. US cement goes bulk at 70 to 75 per cent, so the sack volume here is concentrated in pet food, feed, seeds, chemicals, minerals and small industrial applications — laminated, printed and priced accordingly. It is the region where the format is least substitutable and smallest, which is the mirror image of Europe.
8.6 What the Geography Says
The centre of gravity of this market is roughly 6,000 kilometres east of the centre of gravity of the paper sack market, and that single fact explains most of their differences: growth rate, specification maturity, regulatory exposure and the identity of the buyer.
9. Competitive Landscape
Three layers, three completely different dynamics. At the bottom sit more than a thousand small converters, 42,000 looms in India alone, no participant with a double-digit share, and pricing that converges on resin cost plus a thin margin. In the middle is a small group of multi-country industrial bag suppliers — Mondi, whose North American Industrial Bags range includes woven polypropylene alongside its paper lines (ISHN, May 2016), and film majors such as UFlex moving into WPP capacity from an adjacent film position. At the top sits the real oligopoly: the machinery. A handful of European and Indian builders supply the tape extrusion and circular loom lines every converter in the world buys, and Starlinger and Lohia are the two names that dominate it.
That structure produces the industry's defining commercial fact: the barriers to entering this market are almost nothing and the barriers to being paid properly in it are almost everything. The full analysis — the three tiers, where pricing power actually sits, and why consolidation happens through customer lists rather than assets — is in the Competitive Landscape chapter.
10. Regulatory Landscape
Four instruments matter and only one of them is about sacks. Regulation (EU) 2025/40 sets the recycled-content obligation at 35 per cent from 2030 and 65 per cent from 2040, recyclability performance grades from 2030 with recycling-at-scale from 2035, and modulated extended producer responsibility fees — this is the instrument that changes what a sack is made of. UN performance testing and marking under dangerous-goods rules and national standards for fabric strength and seam construction decide who may sell into a given filling line at all, and they are the market's only real moat. National single-use plastic rules have so far exempted industrial sacks but shape the reputational environment around them. And extended producer responsibility regimes outside Europe, notably India's, are beginning to attach fees and recycled-content expectations to plastic packaging that industrial converters had assumed were outside the conversation. The detail is in the Regulatory Landscape chapter.
11. Strategic Outlook
Own the recyclate, not the loom. The only scarce input in this market after 2030 is recycled polypropylene of consistent quality. A converter who has signed recycled-content offtake, qualified an rPP tape that passes a 1.5-metre drop test, and can document plant-average compliance is selling a qualification its competitors cannot buy with a purchase order. That is the position worth paying for, and it is available now at a time when recyclate is cheap because demand has collapsed.
Move the mix, not the volume. Price and mix contributes 1.84 per cent a year and the laminated, printed, valve and liner-fitted constructions carry it. Every point of unprinted volume converted to a branded construction is worth roughly 90 per cent more per sack. In a market growing 3.17 per cent in units, mix is the only lever that moves value faster than the market.
Or follow the growth east and south, and accept what it pays. Asia-Pacific supplies 49 per cent of the value growth and 44 per cent of the value; the Middle East and Africa supplies very little value and the fastest growth. Both require a cost position rather than a specification position, and a converter cannot credibly run both strategies from one plant.
What is not defensible is a European merchant converter with no recyclate access, no print capability and a customer list of regional construction fillers, selling a commodity sack into a market whose volume grows 1.79 per cent and whose largest end use is being overtaken by grain.
12. Watch List
- Whether anyone builds European rPP capacity. The 35 per cent obligation arrives on 1 January 2030. Installed rigid PP recycling capacity was flat in 2023, investment halved, and plants closed. The gap between 227 thousand tonnes of demand and available supply is the single most important variable in this report.
- How the mandate is counted. Whether plant-average accounting and mass balance are accepted, and whether chemically recycled content counts, decides whether the obligation changes the sack or only the paperwork.
- The price of virgin polypropylene. Structural oversupply makes the mandated input the expensive one. Any tightening of the virgin market changes both the economics of compliance and the competitiveness of rPP tape overnight.
- India's EPR implementation. The world's largest producing country is extending producer responsibility and recycled-content expectations to plastic packaging. How industrial sacks are treated there matters more to global volume than anything the EU does.
- Bagged-versus-bulk share in Indian and African cement. A one-point shift in the bagged share of global cement is 800 million sacks. It is the largest single sensitivity in this forecast and the least forecastable.
- Filler loading rates. If calcium carbonate loading rises to offset a resin spike, polymer demand falls faster than sack output and every volume forecast built on a stable gramme-per-sack overstates the market.
13. Methodology
The complete build — every coefficient, every cross-check, the primary programme and what was not modelled — is set out in the Research Methodology section below. In summary: the market is built from three physical anchors (Indian raffia capacity structure, global bagged-cement tonnage, global compound feed production), a disclosed regional allocation, a disclosed blended weight of 88 grammes falling to 79, and format-level prices. Primary inputs from structured interviews, conference work, open-ended interviews and a converter survey inform the coefficients where no published series exists and are labelled as Pheonix estimates in-line. No third-party market-research estimate is used, cited or referenced anywhere in this report.
14. About This Report
This report covers the global market for woven polypropylene industrial sacks — sewn open-mouth, BOPP-laminated, block-bottom valve, gusseted and liner-fitted formats — measured ex-converter in US dollars, with a 2025 base year and a 2026–2033 forecast. It is published in the Industrial & Transit Packaging segment of the Packaging industry. Related Pheonix research: Global Industrial Paper Sacks for the format this one competes with and the material-switch economics; Global Cement Packaging for the largest single end market and the bulk-substitution mechanism; Global Polypropylene and Polypropylene Composites for the material itself; Global Olefins for the upstream chain; Global Packaging for the wider frame; and CARICOM Trash Bag for how a bag market behaves when regulation removes a product from circulation.
Table of Contents
- Market Snapshot
- Market Definition and the Five Boundary Calls
- Market Size and Forecast
- 3.1 How the 2025 Base Was Built
- 3.2 The Regional Allocation Is the Forecast
- 3.3 The Decomposition Is the Finding
- Four Structural Shifts Defining 2026–2033
- 4.1 The Recycled-Content Mandate Landed on the Only Format That Has One
- 4.2 The Unit Count Is a Decoy for the Polymer Industry
- 4.3 This Is a Development Market, Not a Packaging Market
- 4.4 The Resin Cycle Is the Market’s Real Cycle
- Market Drivers
- 5.1 The Bagged-Versus-Bulk Frontier in Emerging Construction
- 5.2 Fertiliser Subsidy and Food-Security Stockholding
- 5.3 The 50-Kilogram Standard and Mechanical Robustness
- 5.4 Recycled Content Becomes a Tender Lever Before It Becomes a Cost
- 5.5 Lamination, Print and the Migration Into Branded Applications
- Market Restraints
- 6.1 Bulk and FIBC Substitution Remove Demand Rather Than Redistributing It
- 6.2 Resin Price Transmission and the Filler Escape Valve
- 6.3 Recyclate Scarcity Is the Binding Constraint, Not the Target
- 6.4 Fragmentation With No Pricing Power
- 6.5 Reputational Spillover From Single-Use Plastic Policy
- 6.6 The Economics of Shipping Air
- Segmentation
- 7.1 By Format
- 7.2 By Capacity
- 7.3 By Construction and Barrier
- 7.4 By End Use
- 7.5 By Route to Market
- Regional Analysis
- 8.1 Asia-Pacific
- 8.2 Middle East and Africa
- 8.3 Europe
- 8.4 Latin America
- 8.5 North America
- 8.6 What the Geography Says
- Competitive Landscape
- Regulatory Landscape
- Strategic Outlook
- Watch List
- Methodology
- About This Report
Competitive Landscape
Competitive Landscape
There are three layers in this industry and they operate on completely different economics: a thousand converters with no pricing power, a small group of multi-country suppliers with some, and a machinery oligopoly with all of it. No participant in the sack market itself holds a double-digit share. The two firms that can genuinely influence who can compete are not sack makers at all.
The converter tier: the most fragmented packaging industry there is
The barriers to entry are a tape extrusion line, a circular loom, a laminator and a stitching unit — capital in the hundreds of thousands to low millions of dollars, against the hundreds of millions a polypropylene plant or a kraft paper machine costs. In India that has produced about 1,200 firms, 1,500 tape plants, 42,000 looms and roughly 3 million tonnes of installed raffia capacity (Lohia TT&RC, Indian raffia sector profile). No other packaging format in the world has a capacity structure remotely like it.
What keeps any individual converter in business is not capacity but customer approval. A filler qualifies a specification, a print design and a supplier; switching cost sits in that qualification rather than in the machine; and the qualification is per product, per plant and per customer. The structural consequence is that sack prices converge on resin cost plus a thin conversion margin within one or two contract cycles, and that consolidation happens through customer lists rather than through assets. That is why the industry has not consolidated despite four decades of being told it would.
The mid tier: industrial bag groups and film majors moving sideways
| Entity | Verified position | Why it matters here |
|---|---|---|
| Mondi Group | Industrial Bags range in North America includes woven polypropylene alongside pasted valve, pinch bottom and sewn open-mouth paper constructions; its Louisville plant manufactures WPP industrial bags for food and animal feed (ISHN, May 2016) | The clearest example of a producer positioned on both sides of the paper-versus-plastic argument, which means it can follow the customer rather than defend a material |
| UFlex | 80 million unit a year WPP bag plant under construction in Mexico on an outlay of about USD 50 million, USD 49.7 million already incurred, targeted at pet food across North and South America and scheduled for commissioning in FY26 (UFlex, Q2 FY26 investor presentation) | A packaging film major entering from an adjacent position with balance sheet and existing customer relationships — the most likely source of the consolidation that asset-level competition never produced |
| Emmbi Industries | Fully integrated raffia extrusion at about 2,000 tonnes a month with 180 tonnes a month of extrusion coating capacity (Emmbi Industries) | The integrated Indian model: tape to coating under one roof, which is the only structure in the converter tier that can hold a technical specification |
These are not tier one by share of this market, because nobody is. They are tier one by capability, and the capability that matters is the ability to qualify a specification at a multinational buyer and to document it. That is a different thing from capacity, and it is the reason a 80-million-unit plant in Mexico is a more significant competitive event than a million tonnes of new Indian loom capacity.
The machinery layer: the only real oligopoly
Tape extrusion and circular loom capacity is supplied by a very small group of builders. Starlinger of Austria and Lohia of India dominate the global installed base, and both sell machinery as readily as they will to an incumbent as to a new entrant. That is the paradox at the centre of this industry’s structure: the most concentrated layer of the value chain profits from keeping the least concentrated layer fragmented. Every time sack demand exceeds local capacity, the machinery builders sell lines that remove the scarcity within eighteen months.
The buyer is more concentrated than the seller, but only in two end uses
In cement and fertiliser the buyer is a few dozen groups and state agencies against a thousand converters, and that imbalance sets the terms: annual tenders, thin margins, cost pass-through and specification dictated by the buyer’s filling line. In grain, feed, food and chemicals the buyer is a long tail of mills, feed producers and regional fillers, and there the converter with print capability has genuine leverage. Which end use a converter is exposed to matters more than which country it operates in.
Where pricing power actually sits
At the feedstock and at the specification, and nowhere in between. Resin producers earn cyclical rent when polymer is tight, as they did in 2021–22. Converters with print, lamination, valve capability or a qualified recycled-content construction earn a specification premium that survives a resin cycle. The merchant converter selling a plain 50-kilogram sewn sack into a cement tender absorbs the cycle in both directions and has no mechanism to do anything else.
The strategic conclusion follows directly from the market’s arithmetic. In a market where polymer volume grows 1.79 per cent and unit growth is 3.17 per cent, a converter whose only asset is capacity is competing for a share of a market that grows slower than its own cost base. A converter whose asset is a qualification, a print line or a recyclate supply agreement is selling something else entirely.
Value Chain
Value Chain
Six stages, one of which is expensive and five of which are not. Resin is a global commodity made in plants that cost billions; everything after it happens in sheds that cost hundreds of thousands. That asymmetry — not the number of converters — is what decides who earns money in this industry.
Stage one: polypropylene
Woven sacks are made from polypropylene homopolymer and raffia-grade copolymer, drawn into tape and woven. The resin is the largest single cost in an unlaminated sack at roughly 55 to 65 per cent, and the grade is unremarkable: a standard film or raffia grade with a controlled molecular-weight distribution and a melt flow suited to high-draw extrusion. There is no specification moat in the resin, which is precisely why the resin cycle transmits straight through this chain. A 2021–22 spike that roughly doubled the price of polymer was absorbed by converters on annual fixed-price contracts, and the structural oversupply that followed is now the reason virgin resin is cheaper than the recycled alternative the law requires.
Stage two: tape extrusion, where the cost is designed
Resin and calcium carbonate masterbatch are melted, extruded as a film, slit into tapes and drawn to orient the polymer. Draw ratio and tape thickness are the two levers, and they are pulled in opposite directions: more draw means thinner tape and less polymer per sack, but less margin above the strength needed to survive a drop test. Filler loading is the third lever and the most commercially important, because mineral displaces polymer at a fraction of the price while keeping calliper and printability. This is the stage where a converter’s gross margin is actually determined, and it is the stage where the recycled-content mandate will be won or lost: recycled PP has a wider molecular-weight distribution and lower, more variable tensile strength, so a 35 per cent blend needs a heavier tape, a denser weave, a compatibiliser, or all three.
Stage three: circular weaving
Tape is woven into tubular fabric on circular looms, from four-shuttle machines in older plants to wider, faster installations in new ones. The loom is the entry ticket to the industry and it is cheap: a line is capital in the hundreds of thousands to low millions of dollars. India’s 42,000 looms across about 1,200 firms is what that capital intensity produces at national scale, and it is the structural reason no participant in this market has a double-digit share.
Stage four: lamination, coating and print
Unlaminated fabric is printed and stitched — cheap, breathable and adequate for grain and cement. Laminated fabric carries a thin polypropylene film that provides moisture protection and a surface that takes high-definition print; extrusion coating adds a barrier without a full film. Print is where the value migrates: a BOPP-laminated rotogravure sack prices at almost double an unlaminated one, and the difference is a print job rather than a polymer job. A fully integrated converter illustrates the ratio: Emmbi Industries discloses about 2,000 tonnes a month of raffia extrusion against 180 tonnes a month of extrusion coating (Emmbi Industries, machinery and equipment) — the coating line is an order of magnitude smaller than the extrusion line and it is where the margin sits.
Stage five: conversion to a sack
Cutting, gusseting, bottom seaming, valve insertion, liner fitting and baling. It is labour-intensive, it is where defect rates are set, and it is where the customer’s qualification actually attaches: a sack that bursts on a filling line or a valve that does not seat costs the filler more per hour than the sacks cost per day.
| Stage | What sets the price | Who holds the margin |
|---|---|---|
| Polypropylene resin | Global olefin capacity and the polymer cycle | The producer, cyclically |
| Tape extrusion | Draw ratio, filler loading, energy cost | The converter, if it is integrated |
| Circular weaving | Loom capacity, which is cheap and therefore abundant | Nobody, structurally |
| Lamination and print | Print quality, registration, film downgauging | The converter that owns the press |
| Conversion and stitching | Labour cost, defect rate, qualification | The converter with the customer approval |
| Filling at the plant | Line throughput and reject rate, not sack price | The filler, by pass-through |
Stage six: the sack plant is a satellite
Empty sacks are cheap to ship and cheap to make anywhere, which caps the economic radius of a commodity plant at a few hundred kilometres and pushes capacity to wherever electricity, labour and resin logistics are cheapest. That is why Indian, Vietnamese, Turkish and Egyptian converters supply Africa and the Middle East, and why a cement producer with plants in three countries usually qualifies three local converters rather than importing from one.
Where the value ends up
Across a sack’s price, roughly half to two-thirds is resin and the remainder is conversion, filler, print and freight. The producer captures cyclical rent; the converter captures almost nothing in a commodity construction and a real premium in a laminated, printed or valve one. In a market where polymer volume grows 1.79 per cent a year, the only durable value in this chain sits at the two ends: the feedstock, and the specification.
Investment Activity
Investment Activity
Capital is flowing into this industry, but almost none of it is going where the constraint is. The commitments that have been announced are capacity commitments in cheap assets; the constraint that arrives in 2030 is in recycled feedstock and in machines that can run it, and that is where the money is not going.
Capacity investment is real, cheap and additive
UFlex is building an 80 million unit a year WPP bag plant in Mexico on an outlay of about USD 50 million, of which USD 49.7 million had been incurred, aimed squarely at pet food across North and South America and scheduled for commissioning in FY26 (UFlex, Q2 FY26 investor presentation). Read the ratio: USD 50 million buys 80 million printed, laminated, branded sacks a year. That is roughly USD 0.63 of capital per annual unit of capacity, and it is the reason this industry can add supply faster than demand can absorb it.
At the other end, an integrated Indian converter discloses about 2,000 tonnes a month of raffia extrusion capacity with 180 tonnes a month of extrusion coating alongside it (Emmbi Industries) — the shape of a plant that has bought its way from commodity tape into specification. Neither of these is a large capital commitment by the standards of the packaging industry, which is the point.
The most telling investment in the sector is going to paper
The clearest single commitment in the adjacent material is Mondi’s EUR 400 million, 210,000-tonne sack kraft machine at Štětí, started in December 2024 (Mondi industrial paper bags). That is roughly EUR 1,900 per annual tonne against the woven side’s negligible capital intensity. The asymmetry is the competitive argument: capital intensive fibre consolidates because it has to, and cheap converting never will. Where the industry’s strategic money is currently going is a signal about which format its owners expect to be defending.
Where the money should go, and isn’t
The constraint that arrives on a fixed date is recycled polypropylene of consistent quality for tape. The European recycling industry’s investment halved to EUR 0.5 billion in 2023 from EUR 1 billion in 2022, its turnover fell 12.5 per cent, facilities closed, and installed rigid PP capacity stayed at 1.8 million tonnes while the sector’s own association described market conditions as forcing closures (Plastics Recyclers Europe, Industry Figures 2023). Chemical recycling, the quality route, stood at about 150 thousand tonnes.
So the gap between a mandated 227 thousand tonnes of demand from European sack makers and a supply base that stopped growing is being closed, today, by nobody. The converters who will be compliant on time are those who treat recycled PP as a strategic input and secure it now, while demand has collapsed and prices are low — not those who treat it as a purchasing problem in 2029.
Machinery and the second-order investment
The investment that a mandate actually requires is not a new loom. It is the trial time and the qualification work: drop testing, pilot runs at customer filling lines, incoming recyclate specifications and the documentation behind a plant-average claim. None of it shows up as capex, all of it takes eighteen to thirty-six months, and it is the single most realistic explanation of why some converters will be ready in 2030 and most will not.
The direction of investment in this market is rising and the capital intensity is low, which is precisely the combination that keeps returns thin: an industry where adding capacity is cheap is an industry where capacity is never scarce for long and price is never firm.
Technology & Innovation
Technology and Innovation
Nothing in this industry is new, and the innovation that matters is measured in microns and grammes. A woven sack is tape, loom, film and print. The competitive frontier is how little polymer can carry 50 kilograms to a drop test, how much mineral can be loaded before the tape fails, and how much information can be printed on the outside.
The gramme curve is the technology
Average polymer per sack falls from 88 grammes to 79 across this forecast, and almost none of that comes from a new material. It comes from higher draw ratios producing thinner tape at equivalent tenacity, from wider looms producing less edge trim, from lighter lamination films, and from tighter fabric-weight specification per application. The governing test is mechanical, not chemical: a 50-kilogram sack dropped repeatedly from 1.2 to 1.5 metres onto concrete, plus stacking and hook resistance. Specification practice converges on 850 to 1,000 denier tape for the 50-kilogram band, with UV stabilisation for open storage and a denier reduction for smaller formats.
The commercial consequence is worth stating plainly because it is unusual: the customer’s incentive is always to buy less polymer per sack, and the converter who helps them do it wins the account. That is the mechanism behind 1.79 per cent polymer growth against 3.17 per cent unit growth, and it does not reverse when resin gets cheap.
Filler loading: the quietest lever in the industry
Calcium carbonate masterbatch is blended into the tape at levels that rise when resin is expensive. It lowers cost, raises stiffness and printability, and displaces polymer — which means a converter’s resin purchase can fall while its sack output rises. It is the single largest source of error in any polymer demand forecast for this market that assumes a stable gramme-per-sack, and it is in direct conflict with the recycled-content mandate: a heavily filled tape is harder to recycle back into the same application, and recyclate plus filler plus a thinner tape is a three-way squeeze on tensile strength.
Recycled polypropylene is the real engineering problem
Every other innovation in this market is incremental. Blending post-consumer recycled PP into a 50-kilogram industrial sack is not, because recyclate arrives with a wider molecular-weight distribution, variable melt flow and lower tenacity, and the failure mode is a burst sack on a filling line rather than a slightly worse print job. The technical responses are a heavier tape, a denser weave, a compatibiliser or impact modifier, and a tighter incoming-material specification on the recyclate. All four add cost or mass, which is why the mandate pushes the gramme curve back up after 2030.
This is also where the market’s genuine differentiation now sits. A converter who has qualified a 30 to 35 per cent rPP construction, holds drop-test data at the customer’s specification and can document plant-average compliance is selling a qualification that cannot be bought with a purchase order. Pheonix’s primary work through 2026 found converters at very different stages of that curve — some running commercial rPP volumes, some trialling, many waiting for a customer to ask — and the difference correlated with export exposure rather than with size.
Lamination, print and the information layer
BOPP lamination, extrusion coating and rotogravure or flexographic print are mature technologies that nonetheless define the premium end of this market. Two additions are moving up the specification list: breathable and micro-perforated constructions for products that must not sweat, and the information layer — batch coding, plant identification and machine-readable marks that travel with a bagged consignment. In export markets and under carbon-border documentation regimes, the second of these is increasingly the reason a buyer pays for a printed sack rather than a plain one.
Machinery, and why patent activity is low
Tape extrusion and circular loom capacity is supplied by a small group of European and Indian builders — Starlinger and Lohia are the two names that dominate the sector, and Lohia’s own technical centre publishes the industry’s structural statistics. The machinery is mature, widely available and cheap relative to a polymer plant, which is the technical reason the converting end of this market has never consolidated and never will.
This is an engineering market, not an intellectual-property one. Formats are decades old, the processes underneath are commodity processes, and the improvements that matter — a thinner tape, a better valve, a recyclate blend that passes a drop test — are developed inside plants and protected by customer qualification rather than by patents. Innovation intensity here buys cost position and specification premium; it does not buy exclusivity.
Market Risk
Market Risk
The largest risk to this forecast is not a demand risk and it does not sit in a construction market. It sits in a recycling plant that was not built. Everything else here is a normal cyclical exposure; the recycled-content gap is a dated, enforceable, supply-side problem with no current solution.
Risk 1: the recyclate gap arrives before the recyclate does
35 per cent recycled content becomes obligatory in Europe on 1 January 2030 for plastic packaging including industrial sacks, and European sack makers alone would need about 227 thousand tonnes of recycled PP — 12.6 per cent of the EU27+3 installed rigid PP recycling capacity of 1.8 million tonnes, a capacity that did not grow in 2023 and whose investment halved. Three outcomes are possible and all three are bad for someone: recyclate prices spike and converters absorb a cost their two-cent conversion margin cannot carry; capacity is built and the cost lands on the whole chain; or plant-average accounting and mass balance satisfy the rule while changing little about the sack, in which case the mandate is a paperwork event rather than a material one. This is the only risk in this report with a fixed date.
Risk 2: the resin cycle reverses, and it always does
Polypropylene roughly doubled in 2021–22 and converters on annual fixed-price contracts absorbed it. The current position is the opposite — structural oversupply that has made virgin resin cheaper than recyclate and helped stall recycling investment. A market with 55 to 65 per cent of its cost in a commodity, no indexation in most contracts and no pricing power cannot hedge that. The practical exposure is a converter that quoted a 2027 price in 2026, and every player in this industry does it.
Risk 3: bulk and FIBC remove demand permanently
Cement and building materials are 20.9 per cent of value and the application most convertible to bulk. A silo does not take share from a sack; it deletes the sale, and the transition is one-way. The forecast already carries cement at 2.6 per cent against a 5.07 per cent market, so the risk is not that this is wrong in direction — it is that the pace in India and Africa is faster than modelled. A one-point shift in the global bagged share of cement is roughly 800 million sacks.
Risk 4: currency, freight and trade
This market’s cost base is dollar-denominated resin and its revenue in much of Africa and South Asia is local currency. At an 88-gramme sack and a 12-cent price, a 20 per cent currency move is the entire margin. Layer on freight, which decides whether a Turkish or Indian converter can serve a West African customer, and anti-dumping risk, which has been applied to woven sack imports in several markets and can remove an export channel faster than any demand change. The industry’s exposure here is high and largely unhedged.
Risk 5: reputational spillover and the Indian EPR regime
Industrial sacks have escaped carrier-bag regulation, but not the conversation. The risk that matters is not a ban — it is a multinational buyer deciding that a plastic industrial sack is indefensible in its own sustainability reporting regardless of what the regulation permits. Alongside it, India’s extension of producer responsibility and recycled-content expectations to plastic packaging could impose cost on the largest producing country in this market on a timetable set in Delhi rather than Brussels.
Risk 6: a technical failure that tightens specification across the market
A sack that bursts on a filling line or a valve that does not seat costs the customer more per hour than the sacks cost per day. Recycled content and higher filler loading both increase that risk, and the two interact: filler and recyclate and a thinner tape is a three-way squeeze on tensile strength. One high-profile failure at a major filler would tighten specifications faster than any regulation and would land hardest on exactly the converters who had pushed the gramme curve furthest.
What is not in the risk case
A wholesale displacement of woven PP by paper is not modelled. The cost gap is 2.27 times and paper’s only route into the volume markets is a regulatory cost that has not been imposed on it; the format’s share of bagged cement in India and Africa is not in play on a 2033 horizon. Nor is a polymer shortage: the market is in structural oversupply and that is expected to persist. The honest asymmetry in this report is that its volume risk is concentrated in one end market, cement, while its compliance risk is concentrated in one input, recycled polypropylene — and unlike the paper sack market, where price and volume risks are uncorrelated, here they are both functions of the same regulatory calendar.
Regulatory Landscape
Regulatory Landscape
Four instruments matter and only one of them is about sacks — but that one changes what a sack is made of, and it arrives on a fixed date whether or not the material exists. The others decide who may sell into a filling line, and one of them is an advantage this format holds over paper that almost nobody counts.
Regulation (EU) 2025/40: the recycled-content obligation
The Packaging and Packaging Waste Regulation is the instrument that governs this market’s future material, and its most consequential provision for industrial sacks is Article 7. Any plastic part of packaging placed on the market must contain a minimum percentage of recycled content recovered from post-consumer plastic waste, calculated as an average per manufacturing plant and per year, in two phases: from 1 January 2030, 35 per cent for plastic packaging other than contact-sensitive packaging and beverage bottles, alongside 30 per cent for contact-sensitive PET, 10 per cent for other contact-sensitive plastics and 30 per cent for single-use plastic beverage bottles; and from 2040, 65 per cent for the general plastic packaging category (EUROPEN, PPWR — all obligations, 2025; European Commission, PPWR briefing).
A cement, fertiliser, aggregates, resin or mineral sack is not contact-sensitive packaging. It is in the 35 per cent bucket, and there is no derogation for industrial packaging.
Two structural features of the obligation then determine how much of it is real: the reference is a plant-average, which permits averaging a high-recyclate line against a low one; and the calculation methodology, including whether chemically recycled content counts toward mechanical targets, is subject to harmonised rules and a claim methodology from 2029.
The same regulation sets the recyclability architecture: all packaging must be designed for material recycling and capable of being collected, sorted and recycled at scale, with recyclability performance grades applying from 2030 based on a design-for-recycling assessment, an at-scale phase from 2035 with a 55 per cent recycling-rate threshold for the packaging categories listed in Annex II, and extended producer responsibility fees modulated to reward recyclability (European Commission, PPWR briefing; EUR-Lex summary of Regulation (EU) 2025/40).
Mono-material polypropylene is, in principle, a good answer to all of it. That is the irony: the woven PP sack is recyclable in a way a laminated multi-material construction is not, and it is the format that now has to prove it contains recyclate. A paper sack carries no recycled-content obligation at all.
EUDR: the asymmetry that favours this format
The EU Deforestation Regulation applies to paper and does not apply to polypropylene. For the paper sack industry that means a geolocation obligation on virgin fibre content and a due-diligence file behind every premium certified sack (Cepi guidance on the revised EUDR, October 2026). For this market it means nothing at all. Both formats now carry a documentation burden and they are different burdens — a recycled-content and recyclability file on the plastic side, a deforestation and chain-of-custody file on the paper side. The buyer’s decision increasingly turns on which file is easier to produce, and that is a genuinely new competitive axis that did not exist in 2022.
UN performance testing, national standards and dangerous goods
Sacks sold into industrial filling lines are qualified against national standards for fabric strength, seam construction and stitching, and against UN performance-testing and marking obligations where the contents are classified as dangerous goods — which covers a real share of the chemicals and fertiliser volume in this market. This is a compliance pathway rather than a compliance cost: the qualification is per product, per plant and per customer, it is not transferable, and it is the only durable moat the converter tier possesses.
Carbon Border Adjustment Mechanism: present in the documentation, absent from the invoice
CBAM’s definitive regime began on 1 January 2026 and cement is one of the six sectors in scope. Packaging sits outside CBAM’s product boundary — no certificate is surrendered against a sack — but the emissions declaration attaches to a consignment, and where a product moves in sacks the sack becomes the physical carrier of the batch identity the declaration refers to. That is one reason traceability and coding move up the specification list rather than down it.
National single-use plastic rules and extended producer responsibility
Thin carrier-bag prohibitions across dozens of jurisdictions have so far exempted industrial sacks, and the reputational spillover is treated as a restraint rather than a regulation. The more consequential development is outside Europe: India is extending producer responsibility and recycled-content expectations to plastic packaging, and India is the largest producer in this market. How industrial sacks are treated under that regime will matter more to global volume than anything Brussels does, because Brussels regulates a region that consumes 15 per cent of the market.
What regulation does not fix
None of these instruments addresses the variable that decides this market’s volume. Bulk substitution is a capital and logistics decision made by cement producers and their customers, and no packaging rule makes a silo more or less attractive. A converter reading the recycled-content mandate as a demand tailwind has misread which risk it is carrying: the regulation guarantees that a share of the sacks that are still made will be made from recyclate, and guarantees nothing at all about how many sacks are still made.