
Global Industrial Paper Sacks Market Report, Size, Share and Forecast 2026–2033: 18.1 Billion Sacks, and the Cement Customer Walking Away
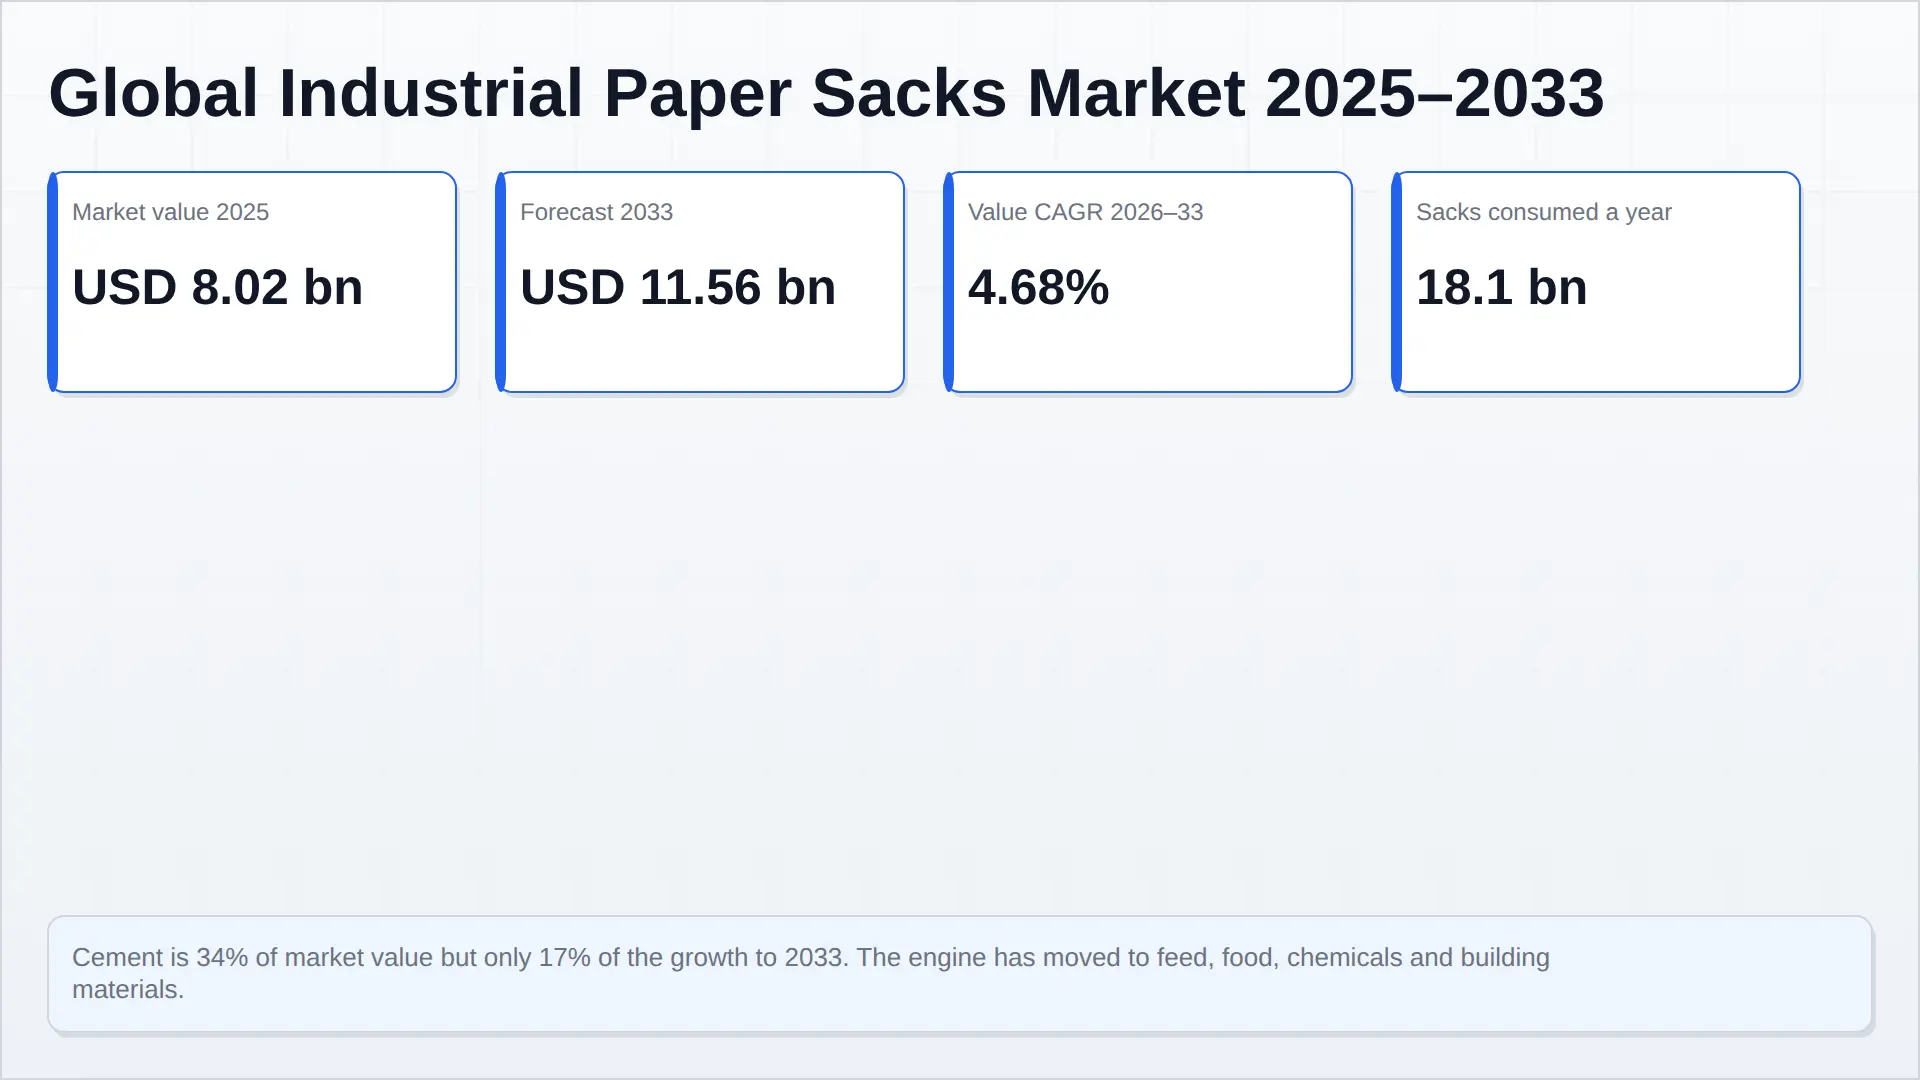
Industrial paper sacks are an USD 8,020 million market in 2025 reaching USD 11,560 million by 2033 at a 4.68 per cent value CAGR, on 18.1 billion sacks and 2,317 thousand tonnes of paper. The headline hides the structure: sacks grow 2.53 per cent a year, price and mix contribute 2.10 and paper volume only 1.60, because the average sack is falling from 128 grammes to 119. Growth in this market is in the specification — valves, barriers, print, chain of custody — not in the tonnage.
The defining fact is that the largest customer is no longer the growth engine. Cement and clinker is 34 per cent of market value and supplies 17.4 per cent of the growth to 2033. Cement and building materials take 57 per cent of European deliveries, and in 2024 every other application in Europe grew — food excluding milk powder 6.8 per cent, animal feed 6.2, chemicals 6.2, building materials excluding cement 3.1 — while cement, milk powder and minerals declined for a third year. The five non-cement segments are 66 per cent of value and 82.6 per cent of the growth.
Two structural findings are new to this edition. Europe is not primarily a sack-consuming region but the industry's factory: it buys around 1.25 million tonnes of sack kraft a year while its own delivered sacks contain about 696 thousand tonnes, converting roughly 1.8 times what it consumes and confirming the balance as 993 thousand tonnes of net sack kraft exports. And the compliance burden has flipped from plastic to paper: the EU Deforestation Regulation exempts recovered fibre while obliging geolocation traceability on virgin content, so the premium certified sack now carries the administrative burden and the recycled sack has the clean file.
The market is also more cyclical than its unit count suggests. European deliveries fell 15.9 per cent in 2023 — about a billion sacks — and had recovered only 2.2 per cent by 2024. Set against that volatility, the economics of the material switch are what decide the geography: at 20 sacks to a tonne, a paper sack at USD 0.30 puts USD 6.00 of packaging into a tonne of cement against USD 2.60 for the woven sack it displaces — 6.67 per cent of the product's value against 2.89 per cent. Paper costs 2.31 times what it replaces, which is why the substitution happens where cement is expensive and carbon is priced, and not where it is not.
1. Market Snapshot
Eighteen billion paper sacks a year is a large number that conceals a small one: the market's biggest customer is not buying more of them. Cement and other building materials take 57 per cent of European paper sack deliveries (EUROSAC Congress 2025, Paris/Stockholm), and in 2024 that customer's deliveries fell again while every other application grew. Food excluding milk powder rose 6.8 per cent, animal feed 6.2, chemicals 6.2 and building materials excluding cement 3.1. Cement, milk powder and minerals declined — more slowly than in 2023, but they declined.
Pheonix sizes the global industrial paper sack market at USD 8,020 million in 2025, reaching USD 11,560 million by 2033, a 4.68 per cent value CAGR, on 18.1 billion sacks and 2,317 thousand tonnes of sack kraft and coated paper. Three growth rates describe the same market and only one of them is the one the industry talks about.
| Metric | 2025 | 2033 | CAGR 2026–2033 |
|---|---|---|---|
| Sacks consumed | 18.10 billion | 22.10 billion | 2.53% |
| Paper consumed | 2,317 kt | 2,630 kt | 1.60% |
| Average sack weight | 128 g | 119 g | declining |
| Market value, ex-converter | USD 8,020 m | USD 11,560 m | 4.68% |
| Average realised price per sack | USD 0.443 | USD 0.523 | 2.10% |
The arithmetic of 4.68 per cent is 2.53 per cent of units and 2.10 per cent of price and mix. That is the whole structure of this market in one line: it is not a volume story with a price story attached, it is a price story with a modest volume story underneath it. Paper consumption grows slower still — 1.60 per cent — because the sack is getting lighter at the same time as the count is rising, from 128 grammes to 119.
The economics of the switch that drives so much of the demand narrative are worth stating plainly, because they explain the market's geography. At 20 sacks to a tonne of cement, a multiwall paper sack at USD 0.30 puts USD 6.00 of packaging into a tonne of cement; the woven polypropylene sack the paper sack is displacing, at USD 0.13, puts in USD 2.60 (Pheonix, Global Cement Packaging). Against a mill-gate cement price near USD 90 a tonne that is 6.67 per cent of the product's value against 2.89 per cent. The paper sack costs 2.31 times what the plastic sack it replaces costs. That single ratio decides where substitution happens — in markets where cement is expensive, carbon is priced and the buyer is a multinational — and where it does not.
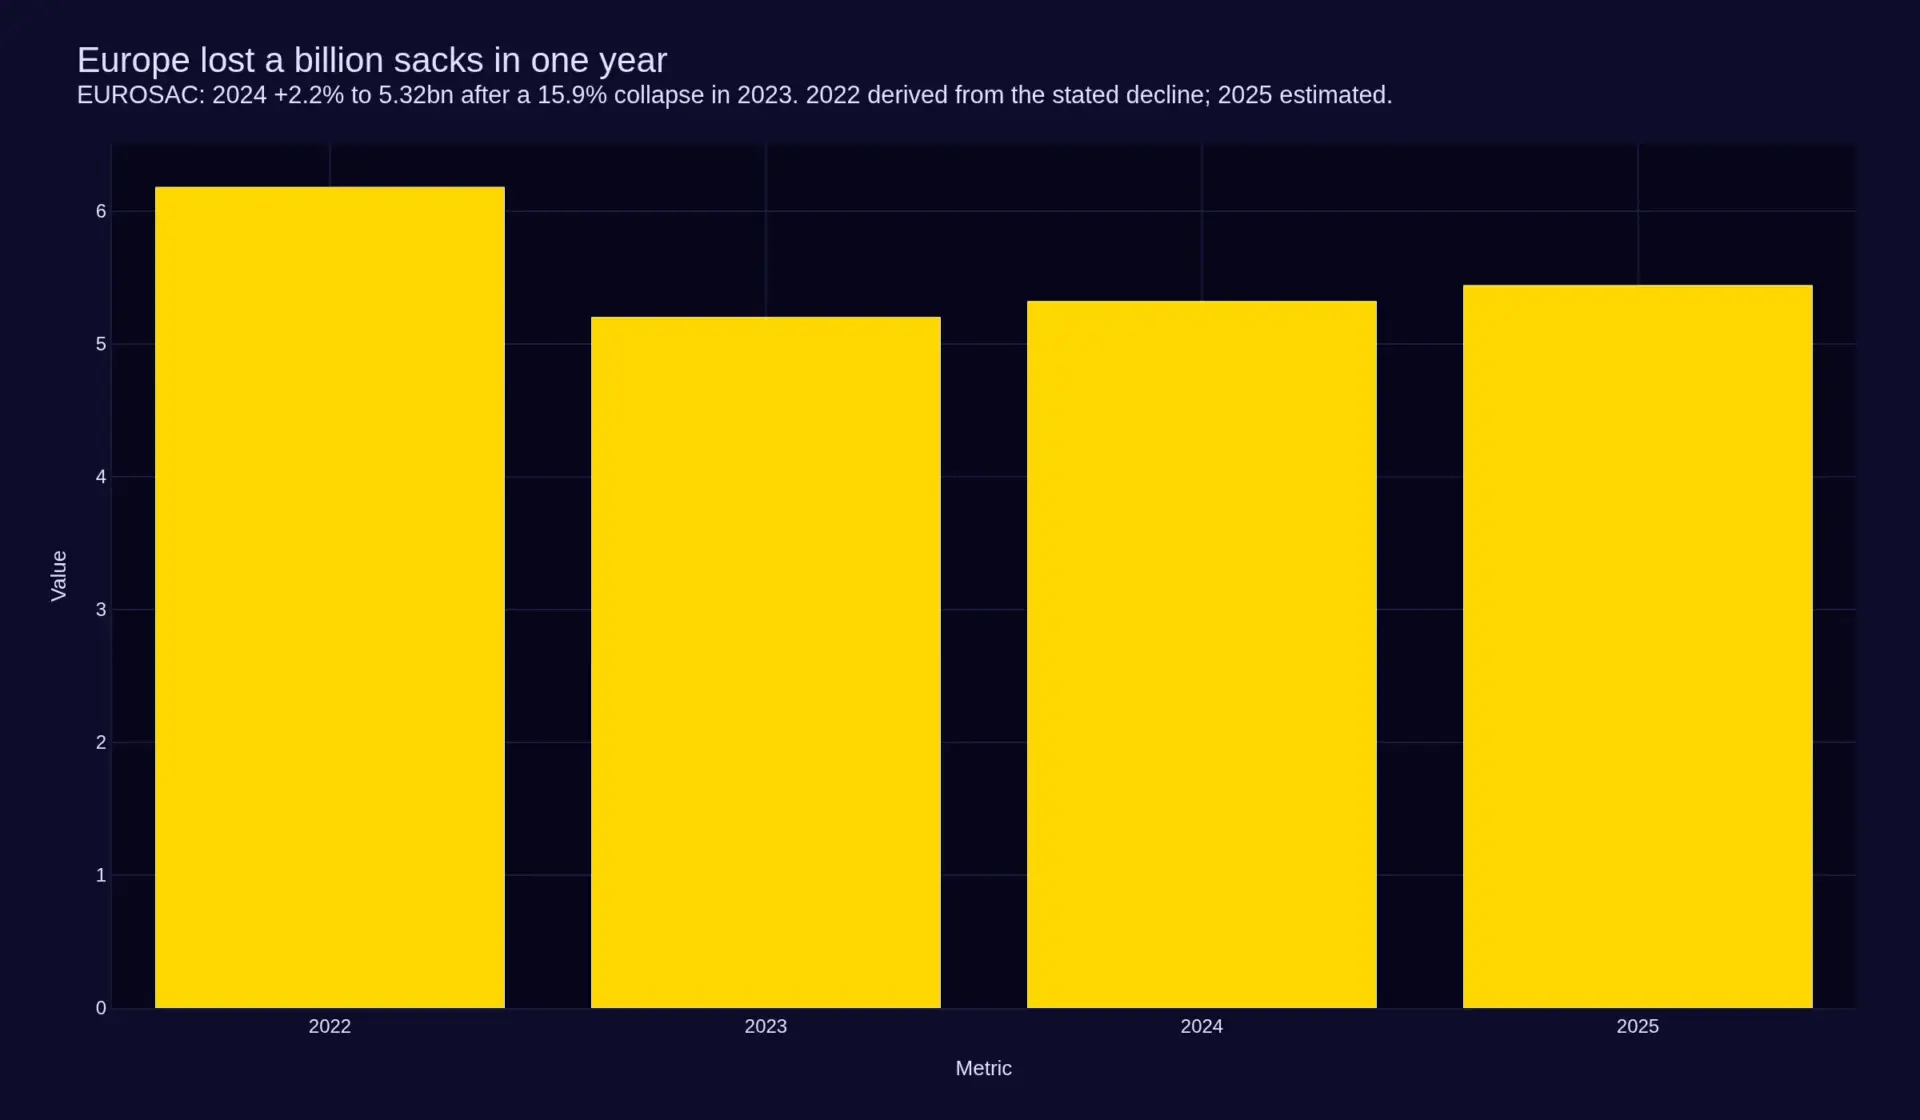
And the market is more cyclical than an 18-billion-unit consumable has any right to be. European deliveries fell 15.9 per cent in 2023, from about 6.18 billion sacks to 5.20 billion, then recovered 2.2 per cent to 5.32 billion in 2024 (EUWID Papier und Zellstoff, July 2025, reporting the EUROSAC annual statistics). This industry lost roughly a billion sacks in a single year and has since recovered about a quarter of them. Any forecast that treats paper sacks as a steady structural-growth market has not read the 2023 line.
2. Market Definition and the Four Boundary Calls
What is measured. Sacks filled on an industrial filling line and sold ex-converter — the price a sack plant charges the company that fills it. Four format families: pasted block-bottom valve sacks, which fill and palletise fastest and carry the premium; sewn open-mouth gusseted sacks, the two- and three-ply workhorse of building materials and minerals; pasted open-mouth and pinch-bottom sacks; and barrier-coated or laminated sacks where moisture, grease or odour has to be held. Value is ex-converter because that is where the transaction this market consists of actually occurs; freight to the filling plant is excluded from value and treated in the value chain, since empty sacks are mostly air and freight therefore shapes where plants are built.
Four exclusions, each a boundary rather than an omission.
First, retail carrier bags and e-commerce mailers. This is the exclusion that matters most commercially, because it is where the growth narrative keeps trying to escape to. A paper mailer is a different product on a different line sold to a different buyer, and the world's largest paper bag producer is expanding into it precisely because it is not the same business — Mondi opened a plant in Pittsburgh in April 2026 with capacity for 300 million bags a year, built around e-commerce mailers and highly automated lines (Mondi, April 2026). That capacity is real, it is paper, and it belongs in a different report.
Second, flexible intermediate bulk containers. A one-tonne FIBC is a transport mode, not a package, and where it replaces 20 sacks the sack market loses the sale outright rather than sharing it. It is discussed here as a substitution route and sized nowhere.
Third, consumer retail packs. A one-kilogram flour bag bought in a supermarket is retail packaging with a retail buyer, a retail print job and a retail margin. The line is drawn at the filling line, not at the material.
Fourth, bulk and the silo. Not packaging at all, and this market's principal competitor. Every tonne that leaves a plant in a tanker is a tonne of sack demand that never exists. Treating bulk as an adjacent market would flatter the forecast and hide the mechanism, so it is treated as the substitution risk it is.
The substitutability call. Within this market, paper competes with woven polypropylene for the same filling line, and that fight is about specification and cost and is being won by paper in the compliant economies. Between this market and bulk, the contest is existential and paper has no lever at all. Those two risks are frequently conflated in industry commentary, and they should not be: the first is a share gain the industry can influence, the second is a deletion it cannot.
3. Market Size and Forecast
3.1 How the 2025 Base Was Built
No purchased market-size figure sits underneath this report. The base is built from four published physical series — European deliveries, European sack kraft demand, cement production and regional industrial output — combined with coefficients Pheonix states openly so that a reader can replace them with better ones and re-run the arithmetic.
| Region | Sacks 2025 (m) | Value (USD m) | Price per sack | Paper (kt) | Share of value |
|---|---|---|---|---|---|
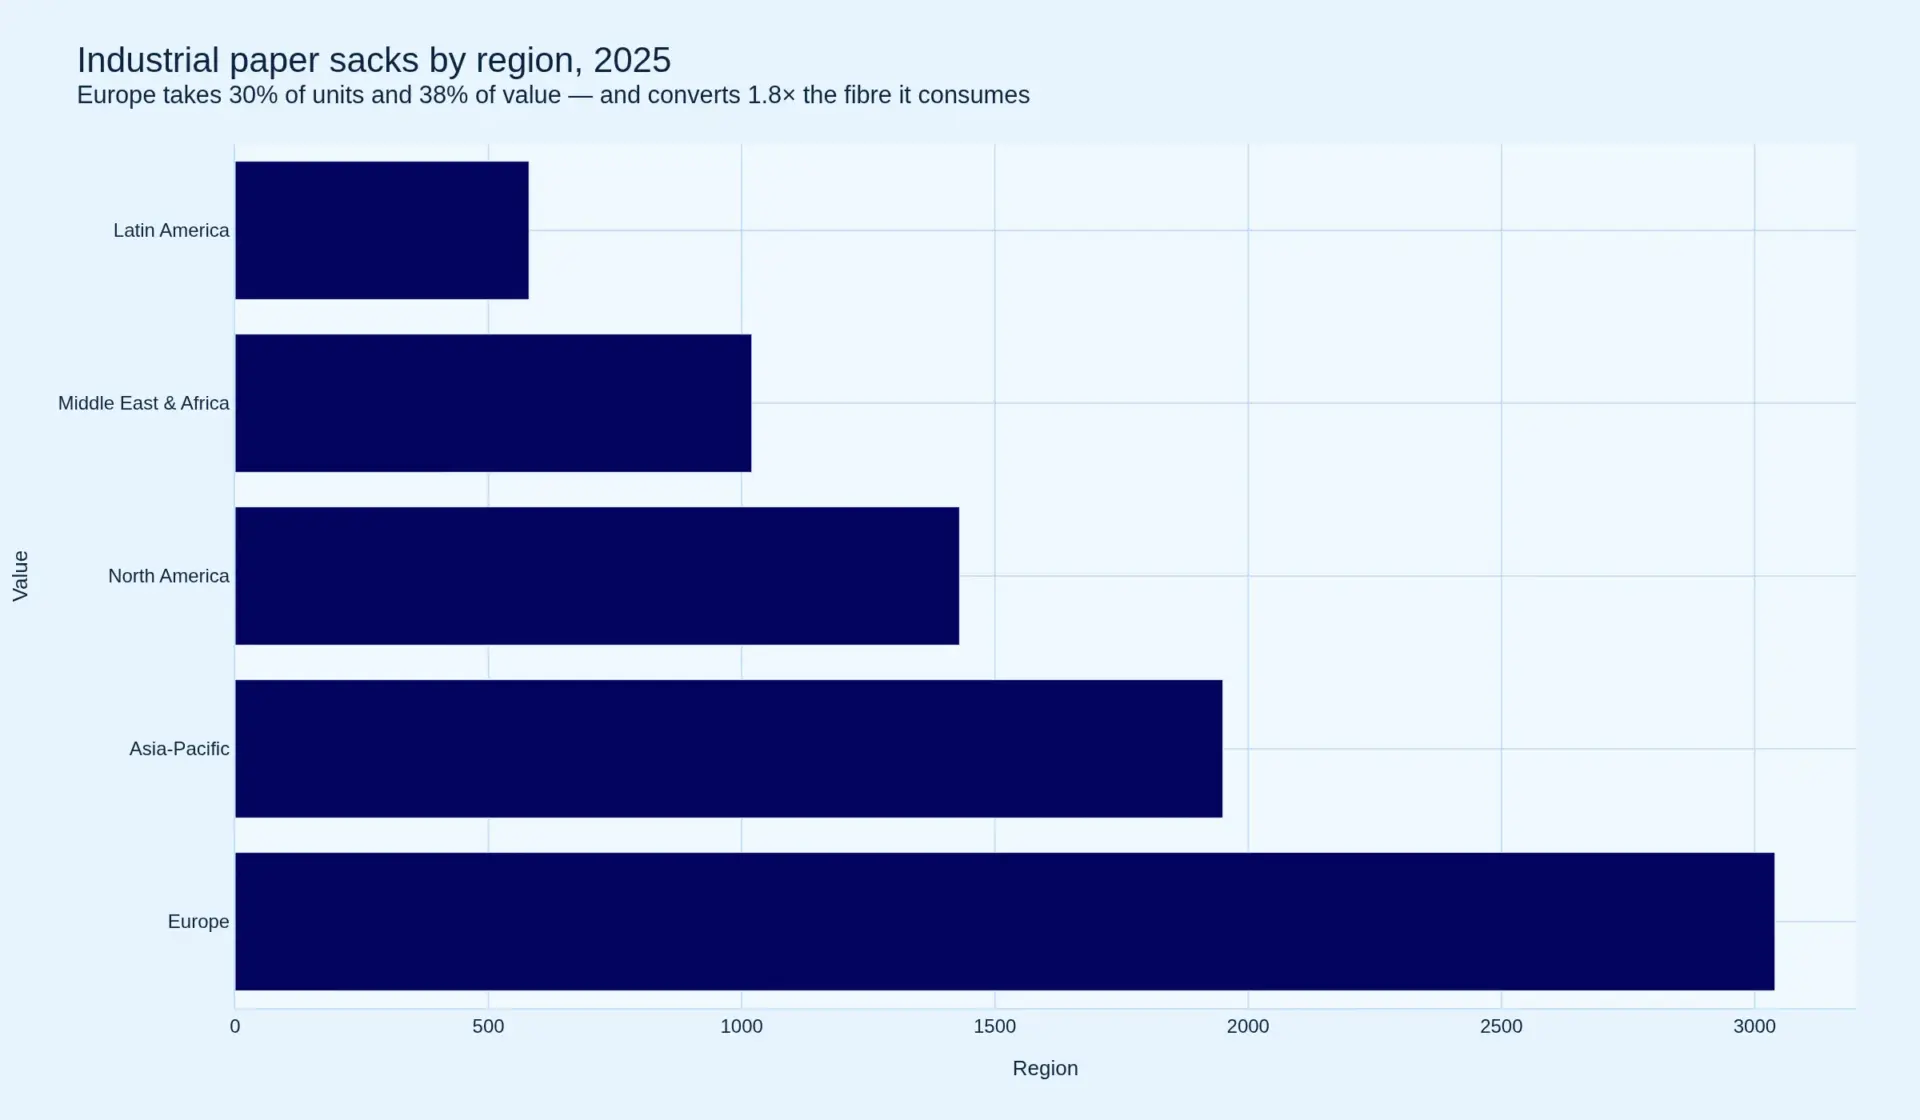
| Europe | 5,440 | 3,040 | USD 0.559 | 696 | 37.91% |
| Asia-Pacific | 6,150 | 1,950 | USD 0.317 | 787 | 24.31% |
| North America | 2,420 | 1,430 | USD 0.591 | 310 | 17.83% |
| Middle East & Africa | 2,670 | 1,020 | USD 0.382 | 342 | 12.72% |
| Latin America | 1,420 | 580 | USD 0.408 | 182 | 7.23% |
| Total | 18,100 | 8,020 | USD 0.443 | 2,317 | 100% |
Europe's 5,440 million sacks is not a model output — it is the EUROSAC series grown one year. Deliveries were 5.32 billion in 2024 and the association reported a first quarter of 2025 with increases across all sectors; 5,440 applies that trajectory. The European paper content of 696 thousand tonnes is 5,440 million sacks at the blended 128 grammes. Set against it, European sack kraft demand was around 1.25 million tonnes in 2025, up 2.8 per cent, with 2.0 to 2.6 per cent growth forecast for 2026 and net exports of 993 thousand tonnes (Fastmarkets, June 2026, interviewing Klabin's head of operations for sack kraft). The gap between those two numbers is not an error. It is the single most important structural fact in this report, and section 4.2 is about it.
The other four regions are a Pheonix allocation, anchored on where industrial filling capacity and cement production actually sit rather than on GDP. Asia-Pacific carries the most sacks and the least value per sack, because paper competes there against a woven polypropylene sack that costs a third as much and against cement that goes bulk or goes into woven bags. North America carries fewer sacks than Europe at the highest price per sack in the report, which is a profile of high labour cost, high automation and a food and chemical mix rather than a construction one.
3.2 The Regional Allocation Is the Forecast
Europe takes 30.06 per cent of the units and 37.91 per cent of the value; Asia-Pacific takes 34 per cent of the units and 24.31 per cent of the value. That inversion is not a curiosity, it is the forecast's engine. Value growth requires buyers who will pay for a valve, a barrier, six-colour print and a chain-of-custody file, and those buyers are disproportionately in Europe and North America. Unit growth requires buyers who need sacks, and those buyers are disproportionately in Asia, Africa and the Middle East.
Whether the market compounds at 4.68 per cent or at 3 per cent therefore turns on a single question: does Asian and African demand move up the specification curve faster than European construction demand moves down it? The forecast says it does, but only just, and it says so through price rather than through volume.
3.3 The Decomposition Is the Finding
Value growth of 4.68 per cent decomposes into 2.53 per cent of sacks and 2.10 per cent of price and mix. Underneath both, paper consumption grows 1.60 per cent — slower than the count, because the average sack falls from 128 grammes to 119 across the forecast. Three forces produce that fall: extensible kraft, which does more work per fibre than the grades it replaced; the migration of small packs toward one- and two-ply constructions; and the steady substitution of a heavier barrier film with a lighter dispersion coating.
The commercial conclusion is the one a converter reaches first: the growth in this market is in the specification, not in the tonnage, and a supplier whose revenue is measured in tonnes is structurally exposed to a market whose value is migrating into valves, coatings, print and documentation. That is a comfortable position for an integrated producer selling a qualified specification and an uncomfortable one for a merchant converter selling a commodity sack into a market whose paper volume grows 1.60 per cent a year.
4. Four Structural Shifts Defining 2026–2033
4.1 Cement Stops Being the Engine, and Nobody Has Replaced It
Cement and clinker is 34 per cent of this market's value. It supplies 17.4 per cent of its growth. That gap is the most important sentence in the report, and it is not a forecast about cement collapsing: global cement production was 3.89 billion tonnes in 2024, below four billion for the first time since 2012, with China at 47 per cent of output and down 182 million tonnes year on year while India expanded (Cement Europe Statistics Report 2025, Cembureau). European cement production was 174.5 million tonnes, down 0.5 per cent, and European consumption fell from 167.5 to 165.1 million tonnes.
The mechanism is not a cement problem; it is a packaging problem. Cement is the most bulk-convertible product in the world: a silo eliminates bagging, de-bagging, dust, pilferage and moisture in one capital decision, and it wins wherever a buyer is large enough to take a tanker. In the United States, 70 to 75 per cent of cement already goes to ready-mix producers in bulk (Pheonix, Global Cement Packaging). The paper sack's largest end market is therefore the one most exposed to a substitution the industry cannot influence, and the growth has to come from somewhere else.
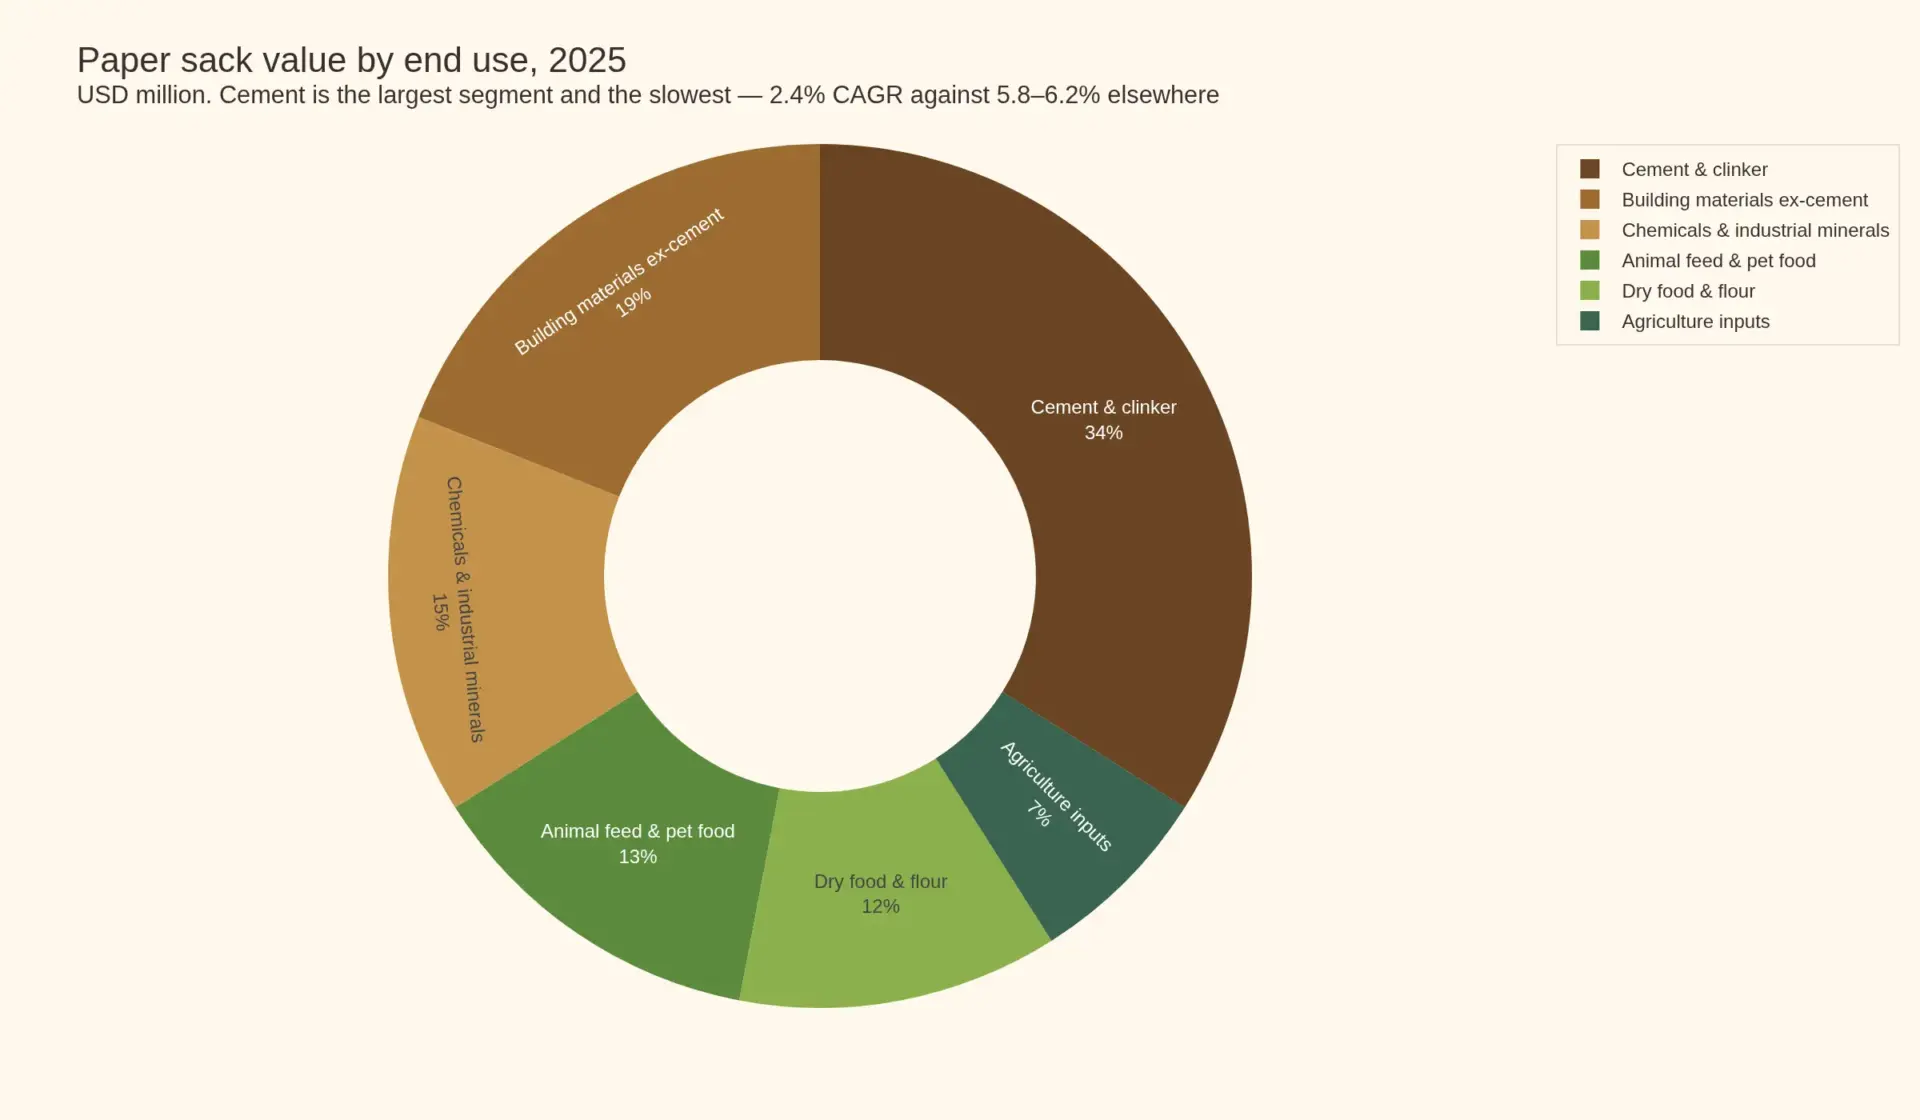
It is coming from somewhere smaller and faster. Feed and pet food grows 6.2 per cent, dry food and flour 6.0, building materials excluding cement 5.8, chemicals and industrial minerals 5.8, agriculture inputs 5.2 — against cement at 2.4. The five non-cement segments are 66 per cent of value and 82.6 per cent of growth. The market's centre of gravity is shifting from a customer who fills 20 sacks a tonne of a commodity into customers who fill one sack with something that has a brand, a specification and a customer complaint attached to it.
4.2 Europe Became the World's Sack Factory, and Is Exposed Because of It
Europe consumes 5.44 billion sacks a year and its converters buy 1.25 million tonnes of sack kraft to do it. Its own delivered sacks contain about 696 thousand tonnes of paper. Europe converts roughly 1.8 times the fibre it consumes in its own market, and confirms the rest as net exports of sack kraft of 993 thousand tonnes. It is not primarily a sack-consuming region; it is the industry's manufacturing base.
That has three consequences that a Europe-only reading of the market misses. It makes European converters a currency and freight play on demand in Africa, the Middle East and Latin America rather than a domestic play on European construction. It exposes them to trade policy — automotive and steel precedents suggest paper packaging is not immune to border measures, and a defensive tariff on a product whose main customers are outside the bloc would land on the converter, not on the mill. And it means the compliance cost of producing in Europe is carried by an industry whose revenue largely leaves Europe.
The industry's capacity base also shrank for reasons that had nothing to do with demand. In February 2023 Segezha Group sold its entire European packaging business — seven mills in Germany, Denmark, the Netherlands, Italy, the Czech Republic, Turkey and Romania with combined capacity of 704 million bags a year — because sanctions made it impossible to supply paper to those plants or to sell their output (Interfax, March 2023). 704 million sacks is 13.2 per cent of the 5.32 billion European deliveries of 2024, removed from the industry in a single transaction, and the buyer was not a competitor. Capacity that leaves for geopolitical reasons does not come back because demand improves.
4.3 The Compliance Burden Flipped From Plastic to Paper
The standard case for paper is that regulation is pushing packaging away from plastic. That is true and it is only half the story. The EU Packaging and Packaging Waste Regulation requires all packaging to be designed for recycling, introduces recyclability performance grades from 2030, requires recycling at scale from 2035 and modulates extended producer responsibility fees to reward design for recyclability (EUR-Lex summary of Regulation (EU) 2025/40). Paper's advantage there is genuine.
But the moment a buyer switches from woven polypropylene to paper, the compliance regime changes rather than disappearing. Paper sits inside the EU Deforestation Regulation, and the way the revised rules landed creates an inversion that most procurement teams have not yet absorbed: recovered and recycled fibre is explicitly out of scope, while any non-recycled content has to be traced back to the plot of origin by geolocation (Cepi guidance on the revised EU Deforestation Regulation, October 2026). A sack made from 100 per cent recovered fibre escapes the regime. A sack made from virgin Nordic kraft carries a due-diligence file, a geolocation dataset and a chain-of-custody obligation, and the guidance is explicit that packaging is only exempt while it is being used to carry another product — the converter who places sacks on the market as products is in scope.
That inverts the usual assumption. The premium, certified, virgin-fibre sack that wins on strength and print is the one carrying the new administrative burden; the recycled-content sack that historically struggled to hit a burst specification is the one with a clean regulatory file. It is a genuine and under-appreciated argument for higher recycled content in industrial sacks, and it arrives at exactly the moment European converters are being asked to document more, not less.
4.4 The 2023 Crash Is the Market's Real Cycle
European deliveries went from about 6.18 billion sacks in 2022 to 5.20 billion in 2023 — a 15.9 per cent fall — then recovered 2.2 per cent to 5.32 billion in 2024. The mechanism was destocking plus a construction contraction plus an energy shock arriving together, and the aftermath is still visible: the fourth quarter of 2025 was described as weaker than the usual seasonal slowdown, and the first quarter of 2026 brought price reductions for brown and white sack kraft grades before producers reversed and pushed for increases from April (EUWID, January 2026; EUWID, April 2026).
What the crash reveals is a structural property that a supply-demand model built on annual averages will always miss: paper sacks are a consumable bought on annual contracts by industrial buyers who manage inventory, so a modest change in end demand produces an amplified change in sack orders, first downward and then upward. A market that loses a sixth of its volume in a year and then recovers at 2 per cent is not a stable market with a volatility problem. It is a volatile market whose average happens to be rising.
5. Market Drivers
5.1 Plastic-to-Paper Substitution, Priced by Regulation
The substitution is real and it is slower than the headlines. Woven polypropylene remains structurally cheaper — roughly 2.3 times cheaper per sack at the cement specification — and no amount of recyclability changes a purchasing director's arithmetic unless the regulation attaches a cost to the alternative or a customer attaches value to the paper. What regulation does is price the difference: modulated EPR fees, recyclability grades from 2030 and at-scale recycling obligations from 2035 turn a specification preference into a line in a cost model. That is a driver of value per sack rather than of sack count, and it is why the paper side of this market grows its price faster than its volume.
5.2 The Long Tail Is Doing the Growing
Animal feed, dry food, chemicals, industrial minerals, seeds and building materials excluding cement are individually smaller than cement and collectively faster. Feed and pet food is a specification market: extrusion, moisture, freshness, print for a brand that is sold on a shelf. Chemicals and minerals are a compliance market: UN marking, dangerous goods documentation, moisture barriers. Dry food and flour is a hygiene market. Each has a regulatory and brand logic that cement does not, which is precisely why each pays for a better sack. In Pheonix's conversations with converters and with buyers at filling companies through 2026, this was the most consistently repeated commercial observation: the willingness to pay for a better sack rises as the product inside it becomes less of a commodity, and the buyers who argue hardest about a tenth of a cent per sack are the ones filling it with cement.
5.3 Packing-Line Automation and the Valve Sack
Block-bottom valve sacks run faster and cleaner on automated fillers than sewn open-mouth sacks: tighter seal, squarer pallet, less dust, fewer rejects. Every conversion of a filling line to valve filling is a mix upgrade of roughly half again on the price of a sack, and it is the largest single source of the 2.10 per cent price and mix growth in this forecast. Valve formats are 38 per cent of value on 32 per cent of units. The driver behind it is labour: a filling station that needs fewer people per shift and produces fewer rejects pays for a more expensive sack very quickly, and that calculation has become more favourable every year as labour costs have risen.
5.4 Print and the Brand Surface
In markets where the sack is the only place a brand is visible at the point of sale, print quality is a specification item rather than decoration. Six-colour flexo, register consistency and surface treatment are specified by feed, flour and pet food brands and largely ignored by cement. This is a quiet but reliable driver of value per sack: the same sheet, printed better, sold to a buyer who cares, at a price the buyer does not contest.
5.5 The E-Commerce Adjacency
Paper mailers for e-commerce are the fastest-growing paper bag product in the world and they are not in this market. Mondi's Pittsburgh investment is explicitly built around them, and its MailerBAG capacity is being expanded across Europe and the US (Mondi 2025 investor presentation). The adjacency matters to this report for one reason: it is competing for the same kraft paper, the same converting labour and the same mill investment as industrial sacks, and it pays a better return. That is a driver of capacity allocation away from this market even as it is a driver of paper demand into it.
6. Market Restraints
6.1 Bulk Substitution
Treated in 4.1 and quantified in the Market Risk chapter. It is the only variable in this report capable of moving the market by whole percentage points in a single year, and no participant in the industry can influence it. Where cement goes to a silo, or where a one-tonne FIBC replaces 20 sacks, the demand does not transfer — it is deleted.
6.2 Kraft Concentration and a Price Cycle That Reverses
Sack kraft is made on a handful of machines, and it is a more specialised market than the rest of packaging paper: its price has historically tracked kraftliner and no longer does (Fastmarkets, June 2026). Supply has been tightened by the permanent closure of Mondi's Stambolijski mill in Bulgaria — 100,000 tonnes a year of sack kraft, gone after a fire in September 2024 — and by European energy costs, with operating rates expected to stay at 87 to 90 per cent. Prices have been volatile in both directions within eighteen months: unbleached extensible 78–85 g list, fob Brazil, rose 5.83 per cent in May 2026 to BRL 5,300–5,600 (USD 1,024–1,082) a tonne; in Europe, first-quarter 2026 brought reductions, then mills sought increases of 8 to 12 per cent from April as the Middle East conflict raised costs, leaving sack producers squeezed between paper and polymer inflation simultaneously (EUWID Packaging Markets, July 2026).
6.3 Freight and Regionality
A 50-kilogram sack weighs about 150 grammes and occupies 60 to 70 litres. Shipping empty sacks is shipping air, which caps the economic radius of a commodity sack plant at a few hundred kilometres and pushes converters to build next to their customers rather than next to their fibre. It is why the industry's geography is a map of filling plants and not a map of forests, and why a kraft mill and a sack plant are rarely in the same country.
6.4 Down-Gauging Is a Silent Volume Tax
Three plies to two where strength allows, 80 gsm to 70, extensible grades doing more per fibre, coatings replacing films. Each step is a small engineering gain and a small permanent loss of paper volume. Across the market it is the difference between 2.53 per cent unit growth and 1.60 per cent paper growth, and it means the paper industry's best customer for a tonne of kraft is a mill that has not yet improved its sheet.
6.5 Qualification Lock-In
A sack is qualified against a filling line, a product and a customer's specification, and requalifying a second supplier takes months and a trial run. That restrains switching, which protects incumbents, and it restrains entry, which is why the converting tier stays fragmented but rarely changes hands on price alone. It is a restraint on the market's ability to reprice quickly in either direction, and it is the reason a kraft price spike takes two contract cycles rather than one to reach a sack price.
7. Segmentation
7.1 By Format
| Format | Sacks 2025 (m) | Value (USD m) | Price per sack | Share of value |
|---|---|---|---|---|
| Pasted block-bottom valve sacks | 5,870 | 3,048 | USD 0.519 | 38.0% |
| Sewn open-mouth gusseted sacks | 5,840 | 2,085 | USD 0.357 | 26.0% |
| Pasted open-mouth and pinch-bottom sacks | 4,210 | 1,684 | USD 0.400 | 21.0% |
| Barrier-coated and plastic-free coated sacks | 2,180 | 1,203 | USD 0.552 | 15.0% |
| Total | 18,100 | 8,020 | USD 0.443 | 100% |
Valve sacks take 38 per cent of value on 32 per cent of units; the barrier-coated family takes 15 per cent of value on 12 per cent of units at the highest price in the table. The two open-mouth families together are 59 per cent of the units and 47 per cent of the value, which is where the industry's volume sits and where its price competition is decided. The mix shift toward valve and coated formats is worth roughly half a percentage point a year of the market's value growth on its own.
7.2 By Ply and Strength
One- and two-ply constructions dominate food, seed and small chemical packs; three-ply dominates cement, minerals and anything filled at 25 kilograms and above. The engineering variable that governs the whole market is bursting strength, because a sack that fails in transit is a product loss, a dust hazard and a brand event rather than a packaging return. Pheonix's primary work with converters repeatedly surfaced the same point from the other direction: the constraint on down-gauging is not the mill's ability to make a lighter sheet, it is the filling line's tolerance for rejects, and buyers will not accept a gramme saving that costs them a pallet.
7.3 By End Use
| End use | Value 2025 (USD m) | Share | CAGR 2026–2033 |
|---|---|---|---|
| Cement and clinker | 2,727 | 34.0% | 2.4% |
| Building materials excluding cement | 1,524 | 19.0% | 5.8% |
| Chemicals and industrial minerals | 1,203 | 15.0% | 5.8% |
| Animal feed and pet food | 1,043 | 13.0% | 6.2% |
| Dry food, flour, sugar and milk powder | 962 | 12.0% | 6.0% |
| Agriculture inputs: seed, fertiliser, agrochemical | 561 | 7.0% | 5.2% |
| Total | 8,020 | 100% | 4.68% |
Building materials excluding cement is the segment to watch: mortar, gypsum, lime, tile adhesive, aggregates and insulation run on the same machines as cement and are growing three times faster, because they are sold in smaller lots to smaller buyers and are far less bulk-convertible. It is a genuine substitution of one construction application for another inside the same customer relationship, and it is the most plausible route by which a cement-focused converter replaces lost volume.
7.4 By Material and Coating
Unbleached extensible sack kraft is the volume grade; bleached white kraft is the print-critical grade and the one where capacity is being added, with Segezha planning to triple white sack paper output at its Segezha mill to 150,000 tonnes a year from 50,000 and targeting a fifth of the world market for it (Interfax, August 2025). Coatings are where the format competition now sits: polyethylene lamination is the cheap moisture barrier and the recyclability problem, and the plastic-free dispersion coating is the answer the regulation wants and the customer has not yet agreed to pay for. Billerud's own position is instructive — it now offers brown and white sack papers with a plastic-free coating (Billerud Annual and Sustainability Report 2024). Recycled content is the wildcard, and after the EUDR clarification in 4.3 it is a compliance advantage as well as a cost decision.
7.5 By Route to Market
Multi-year direct agreements with industrial majors; merchant converters selling into regional producers; and export flows where sacks are made in one country and filled in another. The first carries the volume and the qualification, the second carries the margin, and the third — which is most of Europe's output — is the most exposed to freight, currency and trade policy.
8. Regional Analysis
8.1 Europe: 30 Per Cent of the Sacks and 38 Per Cent of the Value
Europe is the industry's centre of gravity and its most complicated market. 5.44 billion sacks, 696 thousand tonnes of paper, a price per sack of USD 0.559 that is the second highest in the report, and a customer mix where cement and building materials take 57 per cent of deliveries even as that customer declines. European production is 174.5 million tonnes of cement, essentially flat, with consumption falling from 167.5 to 165.1 million tonnes and construction stabilising rather than recovering — Euroconstruct output grew 0.3 per cent in 2025 against GDP growth of 1.3, with 2.4 per cent forecast for 2026 (Cement Europe Statistics Report 2025).
The European industry's real bet is not on European construction. It is on the 993 thousand tonnes of sack kraft it exports and the sacks it converts for other regions, on a compliance regime that rewards paper over plastic, and on being the place where a specification is invented. That is a defensible position and a thin one: it depends on open trade for a product whose main markets are outside the bloc.
8.2 Asia-Pacific: The Volume, Not the Value
6.15 billion sacks and USD 1,950 million — 34 per cent of the units and 24.31 per cent of the value, at USD 0.317 a sack. The reason is structural rather than developmental: in India and much of South Asia a woven polypropylene sack at roughly USD 0.13 carries cement, and at 20 sacks to a tonne the difference between paper and woven is the difference between USD 6.00 and USD 2.60 of packaging in a tonne of cement selling near USD 90. No recyclability grade closes that gap. Paper's Asian market is therefore concentrated in export-oriented food and chemical production, in multinational-owned plants that specify to a global standard, and in Japan and Korea where paper has held the specification for decades. The consequence for the forecast is that Asian volume growth arrives in sacks priced closer to the woven alternative than to the European paper standard.
8.3 North America: Fewer Sacks at the Highest Price
2.42 billion sacks at USD 0.591 — the highest price per sack in this report and the most automated filling base. The regional mix is food, feed, chemical and mineral rather than construction, and the capacity being built is aimed at e-commerce and at reshoring rather than at cement: Mondi's Pittsburgh plant, 300 million bags a year after ramp-up, consolidates two older Pennsylvania and West Virginia sites and targets e-commerce, food, feed, building materials and chemicals (Mondi, April 2026). North America is where the fully formalised end-state of a construction market is already visible — and where the paper sack has already lost that argument and found others.
8.4 Middle East and Africa: Highest Growth, Most Bulk-Exposed, Least Compliant
2.67 billion sacks at USD 0.382 in a region that builds fastest and specifies simplest. Cement consumption grows with population and infrastructure, filling lines are being upgraded from sewn to valve formats, and the compliance driver that dominates Europe is largely absent — which means the region buys on cost and strength, not on recyclability. It is also where European converters' export business concentrates, which makes it the most important region for the European industry and the least visible in European statistics.
8.5 Latin America: Klabin's Home Market and a Kraft Powerhouse
1.42 billion sacks at USD 0.408, against a regional fibre position that is stronger than the sack count implies. Brazil's largest packaging paper producer is a reference point for the global price of the grade, and the observation from its sack kraft operation is the one that frames this market's supply side: sack kraft has stopped tracking kraftliner and has become a specialised market with its own fundamentals (Fastmarkets, June 2026). A region that exports fibre sets a floor under the price that a region which only converts has to pay.
8.6 What the Geography Says
The map of this market is a map of specification, inverted. The regions with the most sacks have the lowest price per sack and the fastest volume growth; the regions with the highest price per sack have the least volume growth and the most regulation. That means the market's value growth and its unit growth come from different places and are driven by different things, and a strategy optimised for one will underperform on the other. It also means the industry's centre of gravity moves toward lower-value sacks as it grows — and only valve conversion, barrier and print can offset that.
9. Competitive Landscape
The industry is consolidated where paper is made and fragmented where sacks are converted. Four producers sit behind the paper: Mondi Group, which runs 5.6 billion paper bags a year across 41 converting plants and 1.2 million tonnes of kraft paper capacity on five mills; Billerud, the world's fourth-largest sack paper producer by capacity and a fibre-first specialist; Klabin, the Brazilian integrated producer whose sack kraft operation sets the tone for the global grade; and Segezha Group, which is now a Russian-domestic business after selling its European mills in 2023. No participant holds a double-digit share of this market, and the buyer is far more concentrated than the seller. The full analysis is in the Competitive Landscape chapter.
10. Regulatory Landscape
Three instruments matter. The EU Packaging and Packaging Waste Regulation sets recyclability grades from 2030 and modulated fees, and it is the reason dispersion coatings exist. The EU Deforestation Regulation applies to paper rather than plastic and — counter-intuitively — exempts recovered fibre while obliging geolocation on virgin content. And national standards plus UN performance marking govern who may sell a sack into a given filling line at all. Only the first two change what a sack is made of; the third changes who is allowed to make it. The detail is in the Regulatory Landscape chapter.
11. Strategic Outlook
Three positions are defensible through 2033. Own the specification. Be the supplier whose sack carries the valve, the barrier, the print and the due-diligence file, and earn the 2.10 per cent price and mix rather than the 1.60 per cent tonnage. This is the only position that works in a market where the largest end use is shrinking and the fastest end uses are small.
Follow the customer into the long tail. The cement customer is 34 per cent of value and 17 per cent of growth. Feed, food, chemicals and building materials excluding cement are 59 per cent of value and most of the rest. A converter whose order book is a list of cement plants is holding the wrong list, and the migration requires different print, different barriers and a different sales conversation rather than new machines.
Or own the fibre. Be one of the few kraft producers whose cost position survives a cycle, and treat converting as a way of capturing the margin on your own paper. The capital intensity gap explains why this works: a new 210,000-tonne kraft machine at Štětí cost EUR 400 million, roughly EUR 1,900 per annual tonne, against a bag plant that is a shed with printing, pasting and stitching lines in it. The fibre end consolidates because it must; the converting end never will.
What is not defensible is a merchant converter with no fibre integration, no coating capability and a customer list of regional cement producers, selling a commodity sack into a market whose paper volume grows 1.60 per cent a year and whose biggest customer is installing silos.
12. Watch List
- The European delivery series for 2025 and 2026. EUROSAC reported a stronger first quarter of 2025 across all sectors. If the full year confirms it, the 4.68 per cent value CAGR is conservative; if 2025 slipped back toward 5.2 billion, the recovery thesis is a destocking artefact.
- Whether cement's decline in Europe stabilises. Cement, milk powder and minerals have now declined for three consecutive years. Building materials excluding cement grew 3.1 per cent in 2024 and cannot carry the construction book alone forever.
- Sack kraft price direction through 2026–27. First-quarter 2026 reductions followed by April demands of 8–12 per cent is a market arguing with itself. Operating rates of 87–90 per cent and no spare machine mean the next move is upward, but a demand stall would leave converters holding expensive paper.
- The EUDR delegated act and its application. Whether the geolocation obligation lands on sack converters as placed-on-market products, and how recycled content is evidenced, decides a real cost differential between fibre strategies.
- PPWR recyclability grades from 2030. Which coated and laminated constructions are graded recyclable decides whether the plastic-free coating becomes the European standard or a premium niche.
- Further capacity leaving Europe for non-market reasons. The Segezha exit removed 13.2 per cent of European deliveries in one transaction. A second such event would change the supply balance more than any demand forecast in this report.
13. Methodology
The complete build — every coefficient, every cross-check, the primary programme and what was not modelled — is set out in the Research Methodology section below. In summary: the market is built from the EUROSAC European delivery series, European sack kraft demand, regional cement and industrial output, a disclosed regional sack allocation, a disclosed blended weight of 128 grammes falling to 119, and format-level prices. Primary inputs from interviews, conference work and buyer conversations inform the coefficients where no published series exists and are labelled as Pheonix estimates in-line. No third-party market-research estimate is used, cited or referenced anywhere in this report.
14. About This Report
This report covers the global market for industrial paper sacks — pasted block-bottom valve, sewn open-mouth gusseted, pasted open-mouth and pinch-bottom, and barrier-coated formats — measured ex-converter in US dollars, with a 2025 base year and a 2026–2033 forecast. It is published in the Industrial & Transit Packaging segment of the Packaging industry. Related Pheonix research: Global Cement Packaging for the largest end market and the bulk-substitution mechanism, Global Pulp & Paper for the fibre side, Global Polypropylene and Polypropylene Composites for the material this market is displacing, Global Packaging for the wider frame, and CARICOM Trash Bag for the bag-market dynamics of a regulated small market.
Table of Contents
- Market Snapshot
- Market Definition and the Four Boundary Calls
- Market Size and Forecast
- 3.1 How the 2025 Base Was Built
- 3.2 The Regional Allocation Is the Forecast
- 3.3 The Decomposition Is the Finding
- Four Structural Shifts Defining 2026–2033
- 4.1 Cement Stops Being the Engine, and Nobody Has Replaced It
- 4.2 Europe Became the World’s Sack Factory, and Is Exposed Because of It
- 4.3 The Compliance Burden Flipped From Plastic to Paper
- 4.4 The 2023 Crash Is the Market’s Real Cycle
- Market Drivers
- 5.1 Plastic-to-Paper Substitution, Priced by Regulation
- 5.2 The Long Tail Is Doing the Growing
- 5.3 Packing-Line Automation and the Valve Sack
- 5.4 Print and the Brand Surface
- 5.5 The E-Commerce Adjacency
- Market Restraints
- 6.1 Bulk Substitution
- 6.2 Kraft Concentration and a Price Cycle That Reverses
- 6.3 Freight and Regionality
- 6.4 Down-Gauging Is a Silent Volume Tax
- 6.5 Qualification Lock-In
- Segmentation
- 7.1 By Format
- 7.2 By Ply and Strength
- 7.3 By End Use
- 7.4 By Material and Coating
- 7.5 By Route to Market
- Regional Analysis
- 8.1 Europe
- 8.2 Asia-Pacific
- 8.3 North America
- 8.4 Middle East and Africa
- 8.5 Latin America
- 8.6 What the Geography Says
- Competitive Landscape
- Regulatory Landscape
- Strategic Outlook
- Watch List
- Methodology
- About This Report
Competitive Landscape
Competitive Landscape
This industry is consolidated where the paper is made and fragmented where the sacks are converted, and that asymmetry explains almost everything about who earns what. Four producers sit behind the paper side. Behind the converting side sit hundreds of plants, most of them regional, none of them with a share worth defending. No participant holds a double-digit share of this market.
The integrated tier
| Entity | Verified position | Why it matters here |
|---|---|---|
| Mondi Group | 1.2 Mt of kraft paper on five mills; 5.6 billion paper bags a year across 41 paper bag plants; new 210,000 t sack kraft machine at Štětí started December 2024 on EUR 400 million; Stambolijski (100,000 t) permanently closed after the 2024 fire | The only participant with scale at both ends of the paper chain and a converting network positioned across Europe, North Africa and Latin America |
| Billerud | Fourth-largest sack paper producer in the world by capacity; SEK 3,240 million of sack paper net sales in 2024; brown and white sack papers with plastic-free coating; around 3 Mt of total capacity across six mills | A fibre-first position: it sells the strength and the sheet, and increasingly the coated sheet, rather than controlling the last mile to the filling line |
| Klabin | Brazil’s largest packaging paper producer; sack kraft operated as a specialised business with its own pricing fundamentals | The clearest example of the integrated model in the southern hemisphere, and the supplier whose cost position sets the export price into Europe |
| Segezha Group | Sold its seven European mills (704 million bags a year) in February 2023; retains Russian mills with 878 million bags of capacity; tripling white sack paper at the Segezha mill to 150,000 t a year from 50,000 | The demonstration that capacity can leave a market for reasons that have nothing to do with demand — and that it does not come back |
Each is tier one by capacity and integration, not by share of this market. Industrial sacks are one application among several for all of them — pet food, chemicals, minerals, seed and consumer bags sit alongside — which produces a specific strategic behaviour: no company’s industrial sack exposure is large enough to make it the priority, and every company’s exposure is large enough to make it defend the account.
The fragmented tier
Converting has no tier structure at all. The barriers to entry are a printing line, a pasting or valve-forming line and a stitching unit: capital in the low millions, not the hundreds of millions a kraft machine costs. What keeps a converter in business is not capacity but customer approval, and switching costs sit in the qualification rather than in the asset. The structural consequence is that sack prices converge on paper cost plus a thin conversion margin within one or two contract cycles, and that consolidation happens through the customer list rather than through the asset base.
That is also why the fragmented tier has not been the mechanism of consolidation in this market. The one big structural change of the decade — the removal of 704 million bags of European capacity in 2023 — happened through a forced divestment, not through competition. The buyer was a financial vehicle, not a rival, so no competitor gained scale from it; the industry simply lost 13.2 per cent of European deliveries and the market tightened.
The buyer is more concentrated than the seller
There are a few dozen industrial groups buying sacks in volume and hundreds of plants making them. That imbalance, not the converter landscape, sets the terms. It produces a characteristic pattern in which the buyer does not want to own converting capacity and the seller will buy capacity to own the contract — Mondi’s Egyptian transactions are the clearest example, in which converting lines physically inside a cement producer were acquired together with long-term supply agreements.
Pricing power
Pricing power sits at the two ends of the chain and not in the middle. Fibre producers earn cyclical rent when capacity is tight, as European sack kraft was after 100,000 tonnes left in 2024 and with operating rates expected to hold at 87 to 90 per cent. Fillers pass packaging cost straight through. The merchant converter in the middle absorbs the cycle — and in a market whose paper volume grows 1.60 per cent a year and whose largest end market is shrinking, absorbing the cycle is not a business model. The defensible positions require fibre integration or specification capability, and ideally both.
Value Chain
Value Chain
This chain has one unusually expensive stage, one unusually cheap one, and a customer at the end of it who is far larger than anyone in the middle. Fibre is where the capital sits, converting is where the labour sits, and the filling line is where the decision is actually made — and none of those three is in the same country as the others, which is why European paper is converted into sacks for customers in Africa and the Middle East.
Stage one: fibre
Unbleached extensible sack kraft is made from softwood pulp on a small number of machines. It is the stage where the capital sits and where capacity cannot be added quickly: Mondi’s new 210,000-tonne machine at Štětí in the Czech Republic started up in December 2024 on a EUR 400 million investment, which is roughly EUR 1,900 per annual tonne. Billerud runs around three million tonnes of total capacity across six Swedish and Finnish mills, with sack paper as one of six product lines and SEK 3,240 million of sack paper net sales in 2024 (Billerud Annual and Sustainability Report 2024). Klabin, Brazil’s largest packaging paper producer, is the other reference point, and its operation is the source of the clearest statement of how this market now behaves: sack kraft has stopped tracking kraftliner and has become a specialised market with its own fundamentals (Fastmarkets, June 2026).
When a machine leaves, the balance moves more than demand does. Mondi’s Stambolijski mill in Bulgaria, 100,000 tonnes a year of sack kraft, burned in September 2024 and was then permanently closed, with supply moving to Štětí, Frantschach in Austria and Dynäs in Sweden. European operating rates are expected to hold at 87 to 90 per cent, and the assessment from the trade is blunt: overcapacity is not the problem in Europe, and a newcomer would find it a difficult operation because the investment is capital-intensive and demands good-quality softwood (Fastmarkets, June 2026).
Stage two: paper to sack
Converting is printing, valve forming, pasting or sewing, and it is done in plants that sit near the filling lines rather than near the mill. The ratio tells the story: Mondi runs 5.6 billion bags of capacity across 41 paper bag plants against five kraft paper mills (Mondi 2025 investor presentation). Eight converting plants for every mill is what a business looks like when the heavy asset is in one place and the customer relationship is in another.
| Stage | What sets the price | Who holds the margin |
|---|---|---|
| Sack kraft paper | Machine capacity against slow-growing demand; energy and softwood cost; a specialised market no longer tracking kraftliner | The mill, cyclically |
| Coating and barrier | Which construction a recyclability grade will accept | The converter that got there first |
| Converting to sack | Specification, print complexity, qualification, freight radius | Integrated supplier, modestly |
| Filling at the plant | Line speed and reject rate, not sack price | The filler, by pass-through |
| Retail or project sale | The brand on the outside of the sack | The brand owner |
Stage three: the sack plant is a satellite
A 50-kilogram sack weighs about 150 grammes and occupies 60 to 70 litres. Shipping empty sacks is shipping air, which caps the economic radius of a commodity sack plant at a few hundred kilometres and dictates the geography of the entire industry: converting follows the filling plant, and fibre does not follow either. Mondi’s disclosed investment across its bag network — Colombia, Morocco and Mexico alongside European capacity — is a map of where industrial filling happens, not a map of forests.
Freight also governs the export model described in section 4.2. Europe converts roughly 1.8 times the fibre its own delivered sacks contain, and the surplus leaves as sacks rather than as paper. That is only economic because a 50-kilogram sack is light and stacks densely; the moment the freight-to-value ratio moves, the model does, which is why European converters are more exposed to shipping rates than their domestic order books suggest.
Stage four: the filling line, where the real cost lives
At 20 sacks to a tonne of cement, packaging is USD 6.00 of a tonne selling near USD 90 — 6.67 per cent. That is small enough to pass through and large enough to manage, and it is why the paper-versus-woven argument is settled by regulation and customer preference rather than by the purchasing department alone.
But the number that actually governs behaviour at the filling station is not the sack price. It is throughput. A line that stops because sacks are out of specification, or that produces rejects because a sack burst, costs more per hour than the sacks cost per day. This is the point our primary interviews returned to most often and from both sides of the table: buyers will pay a premium for consistency, delivery reliability and a valve that seats every time, and a cheaper sack from an unqualified converter rarely wins the account on price alone. It is also why down-gauging is negotiated gramme by gramme rather than specified by the mill — the buyer’s tolerance for rejects, not the papermaker’s capability, is the binding constraint.
Where the value ends up
Across a sack’s price, roughly half is paper and the rest is conversion, coating, print and freight. The mill captures cyclical rent when capacity is tight — which is the position European sack kraft has been in since 100,000 tonnes left the market in 2024 — and the converter absorbs the cycle in between. The filler passes the whole of it through, because the sack is a cost line in a product the customer is buying for what is inside it.
In a market whose paper volume grows 1.60 per cent a year, that distribution does not change on its own. It changes when specification changes, and specification is the only lever the converting end of this chain actually holds. Every successful converter in this market is, in the end, selling a qualification rather than a sack.
Investment Activity
Investment Activity
The capital in this market is going into paper machines and into coatings, not into sack capacity, and the direction is rising while the intent is defensive. Three commitments tell the story better than any aggregate: a EUR 400 million kraft machine, a 100,000-tonne mill closed permanently, and a bag plant built around a product that is not in this market at all.
The largest single commitment is a paper machine
Mondi started up a new 210,000-tonne sack kraft paper machine at Štětí in the Czech Republic in December 2024 alongside a new extrusion line, on a EUR 400 million investment, aimed at growing demand for paper-based flexible packaging, consolidating its position in European pet food packaging and strengthening coating capability (Mondi 2025 investor presentation). At EUR 400 million for 210,000 tonnes that is roughly EUR 1,900 per annual tonne. A sack plant is a shed with printing, pasting and stitching lines in it. The ratio between those two numbers — three orders of magnitude — is the structural reason the fibre end consolidates and the converting end never does.
Note what the machine is aimed at. Pet food, not cement. The biggest single investment in this industry’s supply chain in the forecast period is justified by a small, fast-growing, premium, print-heavy application, which is the investment case for this market stated by the people making it.
Capacity is also leaving, and for two different reasons
Mondi’s Stambolijski mill in Bulgaria, 100,000 tonnes a year of sack kraft on a single machine, was hit by fire in September 2024 and then permanently closed, affecting 300 employees, with supply served from Štětí, Frantschach and Dynäs. The stated reasoning is the one to note: after evaluating repairs and the investment required to remain competitive, closing and serving customers from the existing network was judged the better course.
The second reason is not commercial at all. Segezha Group sold its entire European packaging business — seven mills with 704 million bags a year of capacity — in February 2023, because sanctions made it impossible to supply paper to those plants and customers refused to buy from a Russian-owned supplier (Interfax, March 2023). Nothing about European demand caused that; the capacity simply left, and the buyer was not a competitor building scale.
Where the new capacity is being built
Mondi’s own disclosure of investment across its paper bag plant network names Colombia, Morocco and Mexico alongside European capacity, and its newest plant — Pittsburgh, opened April 2026, heading for 300 million bags a year after ramp-up — consolidates two older US sites and targets e-commerce, food, feed, building materials and chemicals (Mondi, April 2026). That is a map of where filling happens and where labour and energy allow conversion: North Africa, Latin America, South Asia and the United States. It is not a map of where paper is made.
On the paper side, the capacity being added is white and coated rather than brown and commodity. Segezha is modernising its Segezha mill to triple white sack paper output to 150,000 tonnes a year from 50,000 from 2026, with the stated ambition of a fifth of the world market for white sack paper (Interfax, August 2025). White grades are the print-critical ones, which is consistent with the market’s value migrating toward branded, specification-heavy end uses rather than construction.
What is not being funded
There is no wave of greenfield brown sack kraft capacity in Europe: energy costs, permitting and a flat demand curve make a new machine unattractive against debottlenecking an existing one, which is why the sector’s operating rate is expected to sit at 87 to 90 per cent rather than at the levels that would justify one. There is no consolidation wave in converting, because the assets are cheap and the buyers are regional. And there is comparatively little investment in capacity for capacity’s sake — every commitment in this market is a cost-position play, a compliance play or a contract play, which is what a 1.60 per cent volume market looks like when it is being invested in properly.
The one investment category that is genuinely new is coating. Dispersion coating lines, plastic-free barrier development and the qualification work around them are the only place in this chain where a converter can build a position a competitor cannot copy with a purchase order, and it is where the difference between a commodity sack plant and a specification supplier is now being decided.
Technology & Innovation
Technology and Innovation
Nothing here is new, and that is exactly why the innovation that matters is measured in grammes and seconds. A paper sack is a sheet formed into a tube with a valve, a seam and a print job. The competitive frontier is how little fibre can hold 50 kilograms without failing on a filling line, how fast a line can fill and palletise it, and how much information can be carried on its surface.
Strength per gramme: extensible kraft
Down-gauging is the largest quiet force in this market. Three plies become two where the strength allows; 80 gsm becomes 70; extensible kraft does markedly more work per fibre than the grades it replaced, which is why the average sack in this model falls from 128 grammes to 119 across the forecast while still carrying the same load. The governing specification is bursting strength, because a sack that fails in transit is a product loss, a dust hazard and a brand event rather than a packaging return.
The commercial consequence is uncomfortable for the paper industry and worth stating: the customer’s incentive is always to buy less paper per sack, never more. That is the mechanism behind the 1.60 per cent paper growth against 2.53 per cent unit growth, and no amount of volume growth in Asia fully offsets it.
Barrier, and the plastic-free coating
Moisture is the enemy: cement, flour, feed and most mineral products lose specification when they take up water, and the problem is worst in tropical storage where a retailer’s stock sits through a monsoon. Polyethylene lamination and extrusion coating solved it cheaply and made the sack unrecyclable. The current frontier is the dispersion coating — a barrier applied as a coating rather than a film, which lets the paper be repulped — and the industry has moved on it faster than most of its customers have. Billerud now offers brown and white sack papers with a plastic-free coating, and its ConFlex HeatSeal took the public choice award at the EUROSAC Grand Prix in 2025 (Billerud Annual and Sustainability Report 2024; EUROSAC Congress 2025).
The technology is available; the constraint is cost and the qualification cycle at the filler. That is why the EU Packaging and Packaging Waste Regulation matters more than any resin price movement in deciding the European format mix: it is the instrument that makes the more expensive answer viable rather than merely available.
Filling speed and the valve sack
The block-bottom valve sack is the commercially significant engineering advance of the last two decades in this market. It fills faster, seals tighter, produces a squarer pallet and generates less dust than a sewn open-mouth sack, which matters at a filling station where the real cost of a bad sack is downtime rather than the sack itself. Every conversion of a line to valve filling is a mix upgrade of roughly half again on price, and valve formats now carry 38 per cent of this market’s value on 32 per cent of its units. It is the single largest source of the 2.10 per cent price and mix growth in this forecast, and it is a conversion that is driven by labour cost and dust regulation rather than by packaging fashion.
Print, coding and the data layer
Where the sack is the only brand surface, flexographic print up to six colours, register consistency and surface treatment are specification items rather than decoration — and the specification is set by feed, flour and pet food brands, not by cement. Two layers are being added on top of the print: batch and plant coding for traceability, and machine-readable codes carrying batch, date and consignment documentation. In export markets that second layer is increasingly the point, because a bagged consignment’s documentation has to travel with the physical goods.
Machinery and why patent activity is low
Sack converting capacity is built from printing, pasting, valve-forming and stitching lines supplied by a small group of European and Asian machinery builders. The machinery is mature, widely available and cheap relative to kraft paper capacity — which is the technical reason the converting end of this market has never consolidated and the fibre end always does.
This is an engineering market, not an intellectual-property one. Formats are old, the processes underneath them are commodity processes, and the improvements that matter — a stronger sheet, a better valve, a coating that repulps — are developed inside mills and converters and protected by know-how and customer qualification rather than by patents. Innovation intensity here buys cost position and specification premium; it does not buy exclusivity, and that is why the same three or four producers keep appearing at the top of the industry’s award lists rather than a rotating cast of specialists.
Market Risk
Market Risk
The largest risk to this forecast is not a packaging risk, and it sits in the end market rather than in the supply chain. Cement is 34 per cent of this market’s value and the most bulk-convertible product in the world. A silo does not take share from a sack; it deletes the sale.
Risk 1: cement converts to bulk faster than modelled
The forecast already carries cement growing at only 2.4 per cent and supplying 17.4 per cent of the market’s growth from 34 per cent of its value. That is a deliberate under-weighting, and it can still be wrong. Global cement production was 3.89 billion tonnes in 2024, below four billion for the first time since 2012, and European consumption fell to 165.1 million tonnes. Where a market formalises, it converts: 70 to 75 per cent of US cement never sees a sack at all, and the European end-state is visible in advance. Every percentage point of cement sack volume that moves to bulk or to a one-tonne FIBC is removed from this market rather than redistributed within it, and the cement segment’s USD 2,727 million of 2025 value is the exposure.
Risk 2: a kraft price cycle that reverses within eighteen months
The paper side has a supply problem and a timing problem at once. Supply is tight because 100,000 tonnes left Europe in 2024 and operating rates are expected to hold at 87 to 90 per cent. Timing is worse: the fourth quarter of 2025 was described as weaker than the usual seasonal slowdown, the first quarter of 2026 brought price reductions for brown and white grades, and then mills sought increases of 8 to 12 per cent from April as Middle East conflict costs hit energy and logistics, leaving sack producers squeezed by paper and polymer inflation simultaneously (EUWID Packaging Markets, July 2026). A converter who has quoted an annual sack price absorbs that or defaults on it. Sack kraft is the largest single input cost in a paper sack, which is why this risk transmits straight to margin rather than being absorbed somewhere in the chain.
Risk 3: the European export model
Europe converts roughly 1.8 times the fibre its own delivered sacks contain and confirms the surplus as 993 thousand tonnes of net sack kraft exports plus sacks converted for customers outside the bloc. That makes a region whose domestic construction market is flat dependent on demand in Africa, the Middle East and Latin America, and on trade remaining open in both directions. It is the least discussed and most consequential exposure in this report: a tariff or a freight shock lands on an industry whose revenue has already left home. The Segezha divestment is a reminder that capacity can be removed from Europe for reasons unconnected to demand, and that it does not return.
Risk 4: the demand cycle is real and was demonstrated
European deliveries fell 15.9 per cent in 2023 — about a billion sacks — and recovered only 2.2 per cent in 2024. That is not a modelling artefact; it is the observed behaviour of a consumable bought on annual contracts by industrial buyers who manage inventory, which amplifies end-demand movements in both directions. A forecast built on annual averages will always understate this. The practical implication is that a single bad year can undo three good ones, and that the 4.68 per cent value CAGR is an average across a path that will not be smooth.
Risk 5: compliance cost arrives before compliance benefit
Recyclability performance grades apply from 2030 and recycling at scale from 2035 under the EU Packaging and Packaging Waste Regulation, and the EU Deforestation Regulation puts a geolocation obligation on virgin fibre. A converter has to reformulate barriers and build due-diligence systems before any customer is obliged to pay more for the result. The direction of travel is certain; the timing of the revenue is not, and the interim is funded from margin in a market where paper volume grows 1.60 per cent.
Risk 6: qualification failure and reject costs
The downside risk that gets least attention is the one with the shortest time constant. A sack that bursts on a filling line, or a valve that does not seat, stops a line that costs more per hour than the sacks cost per day. Down-gauging and coating substitution both increase that risk, and the buyer’s tolerance rather than the papermaker’s capability is the binding constraint. A single high-profile failure at a major filler would tighten specifications across the market faster than any regulation.
What is not in the risk case
A wholesale paper-to-plastic reversal is not modelled, because the regulatory direction runs the other way and the cost gap is already 2.31 times in paper’s favour on price. Nor is a collapse in kraft availability: the capacity that exists is modern, well invested and running at 87 to 90 per cent. The honest asymmetry in this report is that its volume risk is concentrated in one end market, cement, while its price risk is concentrated in one input, sack kraft — and the two are not correlated, which is the only reason the forecast can be presented with a moderate overall risk rating rather than a high one.
Regulatory Landscape
Regulatory Landscape
Three instruments matter, and the most important one does not mention packaging at all. The first sets what a sack is made of, the second sets what has to be proved about where it came from, and the third decides who is allowed to sell one into a given filling line.
EU Packaging and Packaging Waste Regulation (EU) 2025/40
The regulation sets sustainability and labelling requirements across the whole life cycle of packaging, irrespective of material or origin, and it applies to industrial packaging as squarely as to retail. Its operative requirements for a paper sack are these: all packaging must be designed for material recycling and capable of being collected, sorted and recycled at scale, with the at-scale requirement entering into force in 2035; a system of recyclability performance grades applies from 2030 with stricter obligations from 2038; producers carry extended producer responsibility covering the full cost of collection, sorting and recycling, with fees modulated to reward design for recyclability; and packaging must be designed to minimise weight and volume while maintaining functionality (EUR-Lex summary of Regulation (EU) 2025/40).
Two consequences follow directly. First, the polyethylene-laminated sack — paper with a film that makes it moisture-proof and hard to repulp — is structurally disadvantaged in Europe over the forecast. Second, the dispersion-coated sack and any mono-material construction a recycler will actually accept are advantaged. The regulation does not ban formats; it prices them, and the plastic-free coating has moved from a marketing claim to a cost of doing business.
EU Deforestation Regulation: the burden that flipped
This is the instrument this market has not yet priced correctly. Paper sits inside the EU Deforestation Regulation while woven polypropylene sits outside it, and the way the revised rules landed creates an inversion worth stating precisely.
Recovered and recycled fibre is explicitly out of scope. A product made entirely from material that has completed its lifecycle — household and supermarket paper for recycling, printshop offcuts, converting scrap repulped in the same mill — is exempt. Where a product contains non-recycled material, the non-recycled component must be traced back to the plot of origin by geolocation by the operator first placing it on the market. And on packaging specifically: material and containers used exclusively to support, protect or carry another product are outside scope while being used for that purpose, but where such articles are placed on the market as products in their own right the obligations apply (Cepi guidance on the revised EU Deforestation Regulation, October 2026).
Read that against this market and the conclusion is uncomfortable. The premium, certified, virgin-fibre sack that wins on strength, print and food contact is the variant that must carry a due-diligence file and a geolocation dataset; the recycled-content sack that historically struggled to hit a burst specification is the one with a clean regulatory file. The compliance burden has moved from the plastic conversion to the paper conversion, and within paper it favours the recycled grade over the premium one. That is a genuine argument for higher recycled content in industrial sacks that did not exist two years ago, and it is the single most under-discussed regulatory development in this market.
Carbon Border Adjustment Mechanism
CBAM entered its definitive regime on 1 January 2026, and cement is one of the six sectors in scope. The honest reading for this market is that packaging sits outside CBAM’s product boundary: the charge falls on the cement, not on the sack, and no certificate is surrendered against paper. What CBAM changes is the documentation burden on the consignment. Where a product moves in sacks, the sack becomes the physical carrier of the batch identity the emissions declaration refers to, which is one reason traceability and coding move up the specification list rather than down it. A paper sack’s indirect benefit is larger: the carbon argument for paper over plastic is a marketing asset in a CBAM world even where no certificate is due, and Billerud’s own claim that its sack paper can cut CO2 emissions by 30 per cent against plastic sacks is aimed squarely at that argument (Billerud Annual and Sustainability Report 2024).
National standards and UN performance marking
Sacks sold into industrial filling lines are qualified against national standards for fabric or paper construction, strength and stitching, and against UN performance-testing and marking obligations where the contents are classified as dangerous goods. This is a compliance pathway rather than a compliance cost, and it is the main reason the converting end stays fragmented: the qualification is per product, per plant and per customer, and it is not transferable. It is also the one place where regulation is a moat rather than an expense, which is why a converter with a decade of qualifications is worth more than its machinery.
What regulation does not fix
None of these instruments addresses the variable that decides this market’s volume. Bulk substitution is a commercial and infrastructural choice made by fillers and their customers, and no packaging rule makes a silo more or less attractive. A converter who reads the regulatory tailwind as a demand tailwind has misread which risk it is carrying — the regulation guarantees that paper gains share of the sacks that are still made, and guarantees nothing at all about how many sacks are still made.