
Global Crop Protection Market Report, Size, Share and Forecast 2026–2033
Executive Summary
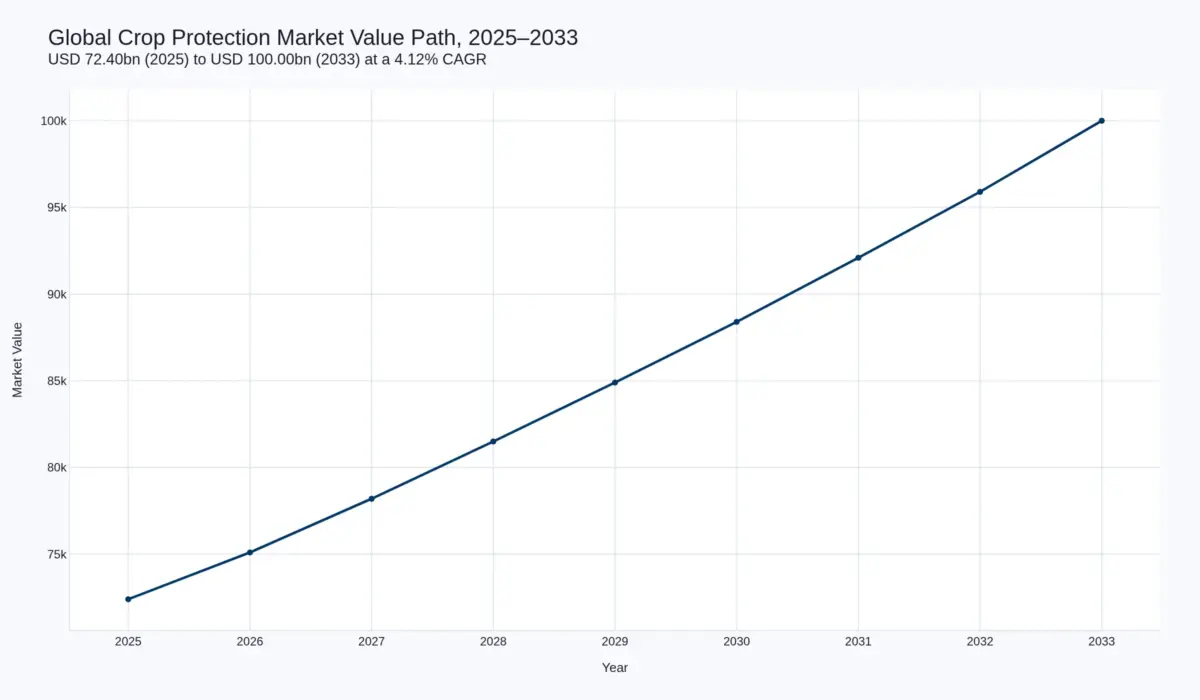
The global crop protection market — herbicides, fungicides, insecticides, nematicides, biologicals and other plant protection chemistry, valued at manufacturer selling prices — was worth USD 72.40 billion in 2025 and reaches USD 100.00 billion by 2033, a 4.12% compound annual growth rate. Volume moves from 4.05 million to 4.70 million tonnes of active ingredient, or 1.88% a year, so roughly 46% of the growth is tonnage and 54% is price and mix. Value per kilogram of active ingredient rises from about USD 17.88 to USD 21.28.
Those look like unremarkable numbers. The reason they are not is the three years that precede them. This is the only major agricultural input market we cover in which the value of the category has fallen while the volume of it has risen.
FAO's pesticide domain puts global agricultural use at 3.92 million tonnes of active ingredient in 2024 — up 5% on 2023, up 18% in a decade and more than double the 1990 level. Over the same 2015–2024 window, the volume of internationally traded pesticides rose 53% while their value rose 35%. Those two sentences are the whole thesis of this report. The world is applying more crop protection than it ever has, and paying less for it per unit than it did a decade ago, because the marginal molecule is now made in China, India or Brazil rather than discovered in Ludwigshafen, Leverkusen or Basel.
That has three consequences a reader should hold onto. First, crop protection is not a demand story, which is why a forecast built on feeding ten billion people will be wrong by a wide margin. Second, the four Western innovators are not losing the market; they are losing the price of the market, while their own revenue lines held up in 2025 through a mix shift into proprietary chemistry. Third, the balance-sheet risk in this industry has migrated from the manufacturer to the distributor, and the manufacturer is now underwriting it.
Market Snapshot
| Base year market value (2025) | USD 72,400 million |
| Forecast year market value (2033) | USD 100,000 million |
| CAGR, 2025–2033 | 4.12% |
| Base year volume (2025) | 4,050 thousand tonnes of active ingredient |
| Forecast year volume (2033) | 4,700 thousand tonnes of active ingredient |
| Volume CAGR, 2025–2033 | 1.88% |
| Value per kg of active ingredient, 2025 → 2033 | USD 17.88 → USD 21.28 |
| Largest product class (2025) | Herbicides, 47.0% |
| Fastest-growing product class | Biologicals, 10.68% CAGR |
| Largest region (2025) | Latin America, 29.1% |
| Fastest-growing region | Asia-Pacific, 5.45% CAGR |
| Slowest-growing region | Europe, 2.21% CAGR |
| Top four suppliers' crop protection revenue (2025) | USD 40.94 billion, about 56.6% of the market |
| Largest single company | Syngenta Crop Protection, USD 13.70 billion |
| Global active ingredient used, 2024 | 3.92 million tonnes (FAO) |
Research Methodology and Scope
No licensed study sits underneath this number, and given the state of the published range that is a feature rather than a limitation. Credible published estimates for 2025 crop protection span roughly USD 50 billion to USD 88 billion. That is not a disagreement about arithmetic. It is a disagreement about what the market is, and almost all of it comes down to three boundary decisions: whether post-patent technical material sold by Chinese and Indian producers to formulators is inside or outside the count; whether seed treatment and biologicals belong to crop protection or to seeds; and whether value is measured at the manufacturer, the distributor or the farm gate.
The 2025 base year is triangulated from three directions that do not share a data source.
Direction one, bottom-up from disclosed segments. Five companies report a crop protection line cleanly enough to use. Syngenta Crop Protection reported USD 13.70 billion for 2025. Bayer's crop protection — core crop protection of EUR 7,934 million plus glyphosate-based herbicides of EUR 2,552 million, so EUR 10,486 million — converts at EUR/USD 1.13 to USD 11.85 billion. BASF's fungicides, herbicides and insecticides of EUR 6,986 million convert to USD 7.89 billion. Corteva reported USD 7.50 billion. FMC reported USD 3.47 billion. The five total USD 44.41 billion.
Direction two, share reconciliation. That total represents roughly 60–64% of the manufacturer-level market once the generic tier is counted, which is consistent with a four-firm concentration that has drifted from above 60% a decade ago to the mid-50s as Chinese and Indian producers took share. Applying that band to USD 44.41 billion implies a market of USD 69.4–74.0 billion.
Direction three, volume cross-check. FAO puts global agricultural active ingredient use at 3.92 Mt in 2024, which at a 2023–24 growth rate carried forward implies about 4.05–4.11 Mt for 2025. A USD 69–75 billion market divided by that tonnage implies an average realized value of USD 17,000–18,500 per tonne of active ingredient, which sits inside the range that a herbicide-weighted, post-patent mix would produce.
The three directions converge on a band of USD 69.5–75.5 billion. The midpoint, USD 72.40 billion, is taken.
What is inside and what is outside. Inside: herbicides, fungicides, insecticides, acaricides, nematicides, molluscicides, rodenticides, fumigants, plant growth regulators and biological crop protection products, at manufacturer selling prices, before distributor margin. Outside, deliberately and stated on the page: seed treatment, which is sized separately in our Seeds coverage and would add roughly USD 6–7 billion if folded in; fertilisers, which belong to a different industry with a different cost curve; biostimulants and biofertilisers, which are frequently bundled into “biologicals” by other houses and are not pest control; and seed-applied trait fees, which are a licensing charge on germplasm rather than a crop protection product.
Company results are converted at EUR/USD 1.13 and INR 85.0/USD for 2025. Volume is expressed in thousand tonnes of active ingredient, not formulated product, because formulated tonnage is not additive across product classes — a kilogram of a 200 g/L emulsifiable concentrate and a kilogram of an 80% water-dispersible granule describe nothing comparable. The active-ingredient basis is the only one on which a tonnage aggregate is analysis rather than arithmetic, and the consequence is that the value-per-kilogram series is a derived indicator of mix and pricing rather than an observable transaction price. It is presented as such.
Entity mappings were verified individually against the Wikidata API before assignment rather than assumed: pesticide Q131656, Bayer CropScience Q812131, Syngenta Group Q114634360. Two identifier errors were caught in the process and are worth recording, because both would have silently corrupted the record: the commonly circulated QID for “pesticide” resolves to carcinogen, and the QID used for BASF in several internal notes resolves to a German chemist who died in 1942. Neither error would have produced an error message. Both would have produced a wrong graph edge.
Market Overview and Definitions
3.1 Why the Definition Matters More Than the Forecast Here
In most markets we cover, a reader can take a published size, adjust the growth rate and be roughly right. Crop protection is the exception. The gap between the low and high published estimates for the same year is wider than the entire forecast growth of the decade, which means the definitional choice is worth more than the modelling.
The divergence has a specific cause. Crop protection is the only major agricultural input with a large, mature, legally legitimate post-patent manufacturing tier. When a molecule goes off patent, the technical material can be made by any qualified producer, and roughly two-thirds of the world's active ingredient tonnage is now made by companies that did not discover it. Whether you count that tier — and at what price point — is the difference between a USD 50 billion market and an USD 80 billion one. Counting only branded, innovator-sold product measures the pricing power of four companies. Counting manufacturer-level revenue including generics measures the market.
This report measures the market. That choice makes the number larger than most published figures and the growth rate lower than most published forecasts, and the two are the same decision.
3.2 The Ex-Factory Boundary
Value is recorded at the point the manufacturer sells into the channel. Distributor margin, retail mark-up and application service revenue are excluded. This matters enormously in Latin America, where the distribution layer is long, credit-financed and, as Section 6.3 sets out, currently the most fragile part of the chain. A farm-gate measure of Brazilian crop protection would be materially higher than the manufacturer-level figure and would also be measuring something a supplier cannot book as revenue.
3.3 Segmentation Framework
The market is cut four ways: by product class (herbicides, fungicides, insecticides and nematicides, biologicals, other crop protection); by crop type (cereals and grains, oilseeds and pulses, fruits and vegetables, cotton, rice, turf and ornamental, other); by mode of action and formulation (conventional chemistry, biological, and the premix/co-pack trend that is quietly changing the unit of sale); and by channel (distributor and dealer, direct to grower, and co-operative or public programme).
3.4 Forecasting Assumptions (2026–2033)
Four assumptions carry the forecast, and each is falsifiable.
Volume grows 1.88% a year. This is anchored on FAO's measured decade, which ran at 1.7% a year compound from 2014 to 2024. We assume slight acceleration because Latin American and South Asian intensity is still rising, partially offset by precision application reducing rates per hectare and by regulatory withdrawal of high-rate actives.
Price and mix add 2.20% a year. Two-thirds of that is structural — the shift of volume into proprietary chemistry, premix formulations and biologicals, all of which carry higher value per kilogram than the molecules they displace. Roughly 0.6 percentage points is cyclical repair from the 2024–2025 trough. Strip the repair out and the structural rate is nearer 1.6%, which is the more honest number for anyone modelling beyond 2033.
Regulatory attrition removes 0.3 percentage points a year. This is not a guess about future politics; it is the observed rate at which registered actives are withdrawn or restricted in the OECD, and it is embedded in the product-class growth rates rather than applied as a separate adjustment.
No currency view is taken. The 2025 base is a dollar translation of reported results and the forecast is in constant 2025 dollars. Bayer's Crop Science sales fell 2.9% in 2025 reported but rose 1.1% currency-adjusted; the 4-point gap is translation, not trade, and forecasting it would be forecasting the dollar.
Market Dynamics
4.1 Market Drivers
4.1.1 Resistance Is the Demand Engine Nobody Prices
Resistance is the most reliable demand driver in this industry and the least discussed in forecasts, because it is a driver of replacement rather than of growth. Every major herbicide mode of action now has documented resistance somewhere in a major crop, and the practical consequence is that a grower who once applied one active applies a premix of two or three, then rotates. The tonnage barely moves. The value per hectare does. This is why herbicide value has held up in a period of collapsing herbicide price: the product changed, even though the problem did not.
4.1.2 Latin America's Intensity and Asia's Volume
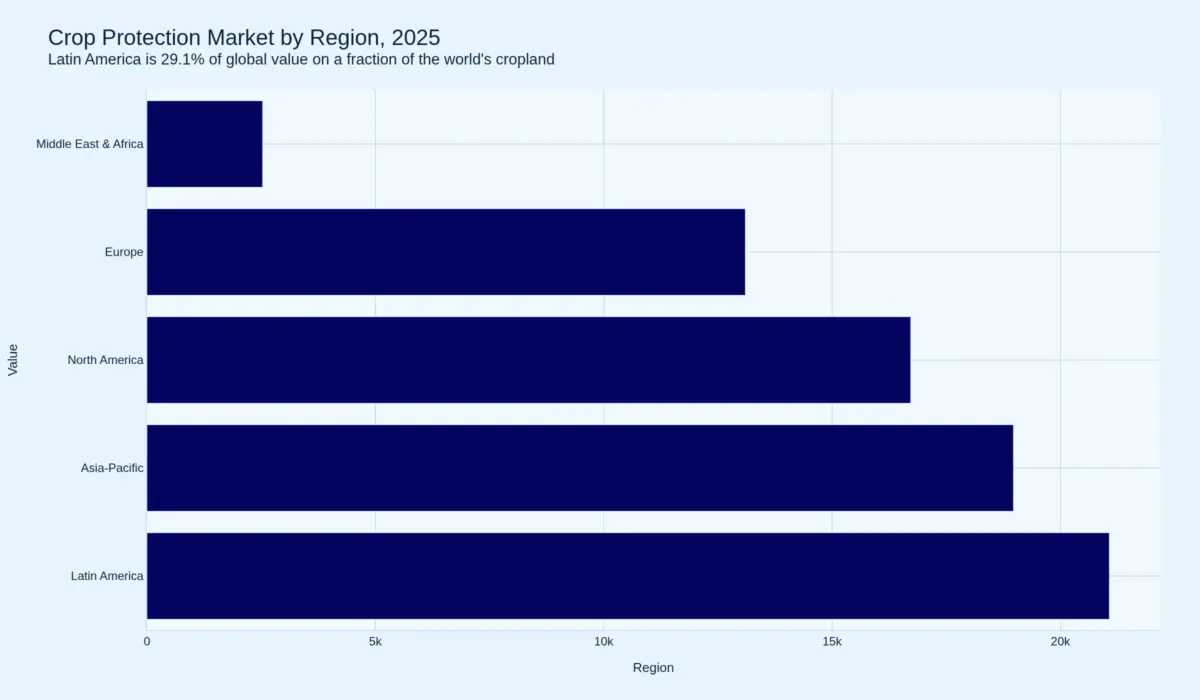
The two regions that drive this market drive it in opposite ways. Latin America is 29.1% of 2025 value on a far smaller share of the world's cropland, because Brazilian and Argentine soybean and cotton systems are the most input-intensive in the world and because disease pressure in a tropical growing system is continuous rather than seasonal. Asia-Pacific is 26.2% of value on a much larger area, and grows nearly twice as fast because intensity is catching up from a low base. The consequence for a supplier is unkind: the region with the highest value per hectare is growing at 4.34%, and the region with the fastest volume growth is growing at 5.45% but at a fraction of the price per hectare.
4.1.3 Approval Volume as a Growth Lever
Syngenta Crop Protection received more than 1,800 approvals in 2025, counting re-registrations and label extensions. Corteva's three newest active ingredients — fluindapyr, Isoflex and Dodhylex — reached approximately USD 200 million of sales, up 54%. Bayer launched glufosinate-P-ammonium in North America through BASF's portfolio and expanded non-glyphosate herbicides in Latin America. Registration throughput is now a leading indicator of revenue in a way it was not twenty years ago, because the number of actives a company can sell determines the premix combinations it can offer, and the premix is where the value sits.
4.1.4 Biologicals Moving From Niche to Portfolio
Corteva discloses biologicals separately and reported USD 519 million in 2025, up 9% on 2024 and 6.9% of its crop protection revenue. That disclosure is the most useful single data point in the category, because it is audited, segment-level and defensible. Biologicals are 4.6% of this market and grow at 10.68% to reach 7.5% by 2033. They are a real growth vector and they are also the single most over-claimed segment in agricultural market research, where “biologicals” frequently includes biostimulants, biofertilisers and anything with a microbe in it.
4.1.5 Farm Economics Set the Ceiling
Crop protection is a residual purchase: it is bought after the seed decision and it is funded out of margin that the grower may not have. When the average US corn acre returned minus USD 118.08 after total costs in 2025, as covered in our Corn Seed report, the grower does not stop buying fungicide, but he trades down, buys generic where he can and defers the discretionary application. That trading-down is precisely what the volume-up, value-down statistic measures.
4.2 Market Restraints
4.2.1 Post-Patent Deflation Is Structural, Not Cyclical
Between 2023 and 2025 the industry treated falling prices as an inventory cycle that would clear. It cleared. Prices did not recover to prior levels. Chinese pesticide production capacity added during the 2021–22 shortage has not been retired, and the incentive to run it at high utilisation to cover fixed costs is stronger than the incentive to withhold volume and defend price. Syngenta reported that pricing pressure “remained, notably in Brazil and Latin America” while volumes grew. Bayer reported Crop Science volume +1.2% and price minus 0.1% for the year, with fungicides down 4.8% and insecticides down 12.2%. BASF reported volumes +3.0% and prices –1.2%.
4.2.2 The Channel Is the Balance Sheet Now
Brazilian input distribution, the largest single channel in the world's largest single country market, broke in 2024 and 2025. AgroGalaxy filed for judicial recovery in September 2024. Lavoro agreed an extrajudicial recovery with creditors in June 2025 after cutting guidance on “significant tightening in inventory financing conditions” and reporting a USD 48.2 million first-quarter loss. Corteva's own filing attributes part of its SG&A increase to higher compensation and bad debt. When the intermediary cannot finance the working capital, the manufacturer finances it or loses the sale.
4.2.3 Regulatory Withdrawal Is Now a Revenue Line, Not a Risk Factor
Two 2024 events cost the two largest players hundreds of millions in a single year, and both were judicial rather than legislative. On 6 February 2024 the US District Court of Arizona vacated the registrations for over-the-top dicamba products XtendiMax, Engenia and Tavium; the EPA's existing-stocks order of 14 February limited the damage to one season but the products did not return to the market on the old basis, and Bayer's soybean and cotton seed and traits revenue both fell sharply as a result. Separately, the expiry of Bayer's Movento registration in Europe cut insecticides revenue 12.2%. Neither event was forecastable from a trend line. Both were larger than the forecast growth of the affected product class.
4.3 Market Opportunities
Three openings are large enough to matter and none of them is a volume opportunity. Premium formulation — premixes, co-packs and ready-to-use systems — converts a commodity active into a differentiated product and is where the innovator tier is deliberately concentrating. Biological integration, meaning biologicals sold into a conventional programme rather than as a substitute for it, is the only credible route to value growth in a deflationary chemistry market. And the replacement of withdrawn actives in Europe, where 2024’s regulatory attrition created a defined list of agronomic problems with no chemical solution and therefore a defined market for the first company to register one.
Global Crop Protection Market Size and Forecast (USD Million), 2026–2033
5.1 Market Revenue Analysis
| Year | Value (USD mn) | Volume (kt AI) | Value per kg AI (USD) |
| 2025 | 72,400 | 4,050 | 17.88 |
| 2026 | 75,100 | 4,140 | 18.14 |
| 2027 | 78,200 | 4,235 | 18.47 |
| 2028 | 81,500 | 4,330 | 18.82 |
| 2029 | 84,900 | 4,425 | 19.19 |
| 2030 | 88,400 | 4,520 | 19.56 |
| 2031 | 92,100 | 4,615 | 19.96 |
| 2032 | 95,900 | 4,655 | 20.60 |
| 2033 | 100,000 | 4,700 | 21.28 |
5.2 CAGR Analysis
4.12% is below the median of published estimates, most of which cluster at 5.4–6.1%. The gap is not conservatism for its own sake. It is the difference between modelling revenue growth and modelling tonnage growth with a price recovery assumption built in. Anyone forecasting 6% here is forecasting either a return to 2022 pricing — which would require the Chinese capacity that caused the decline to be retired, and there is no mechanism for that — or volume growth of 4–5%, which no measured decade of FAO data supports.
5.3 Demand-Supply Trends
Supply is structurally long in technical material and structurally short in registered, differentiated formulations. China exported 2.303 million tonnes of pesticides in 2025 worth RMB 126.83 billion, up 12.2% in volume and 11.9% in value — the value growth slightly behind the volume growth, which is the definition of a market where supply is chasing rather than leading demand. In the first half of 2025 the same data showed 2.24 Mt and USD 8.519 billion, up 17.5% and 14% respectively. Meanwhile the number of new active ingredients reaching market globally in any year remains in single digits.
5.4 Pricing Analysis
Glyphosate is the price index for the whole category because it is the largest single active by volume and the most commoditised. Ninety-five percent technical traded at RMB 26,101 per tonne on 28 November 2025, down RMB 1,000 in a month, with port reference prices at USD 3,700–3,730 per tonne FOB. In January 2025 the same grade was offered at RMB 24,000–24,300. So glyphosate spent 2025 recovering modestly from a trough and then rolled over again in the fourth quarter, on rising producer utilisation and accumulating inventory. That pattern — a floor that holds and a ceiling that does not — is what a market with structurally excess capacity looks like.
5.5 Investment Trends
Capital is going into three places and avoiding one. It is going into biologicals, where Corteva’s disclosure is the only clean one and where the acquisition multiples have run ahead of the revenue. It is going into manufacturing footprint reduction: FMC launched Project Foundation to exit high-cost production sites and moved two active ingredients to lower-cost locations in 2025, explicitly to compete “in the post-patent market”. And it is going into Latin American routes to market: FMC built a direct sales and technical service organisation to sell straight to large Brazilian corn and soybean growers, calling it a potential multi-hundred-million dollar opportunity. The place capital is not going is new capacity for off-patent actives.
5.6 Future Market Outlook
By 2033 this is a USD 100 billion market that behaves more like a specialty chemical industry than like the agriculture business it is usually grouped with: two-thirds of its value concentrated in four suppliers, one-third of its tonnage in a fragmented generic tier, a price level set at the margin by Chinese capacity utilisation, and a growth rate that is majority price and mix. That is a defensible business for a company with proprietary chemistry and a poor one for a company selling molecules its competitors can also make.
Three Structural Shifts Defining 2026–2033
6.1 Shift One: Deflation by Volume
6.1.1 The Statistic That Explains the Decade
FAO records that between 2015 and 2024 the volume of pesticide exports rose 53% while their value rose 35%. Eighteen points of divergence over ten years, in the most authoritative dataset available, across the entire traded market. Read it the other way and it says the average traded pesticide lost about a quarter of its value per unit in a decade, in nominal dollars, before adjusting for anything.
6.1.2 Why 2022 Obscured It
The 2021–22 supply shock pushed agrochemical prices to a peak, and the industry read that peak as a new normal rather than a shortage. Capacity was added against it. When the shortage ended, the capacity did not: Chinese producers kept running because fixed-cost recovery dominates price discipline, and the price fell below pre-pandemic levels by 2024. The three-year shape — peak, collapse, floor — is fully visible in the glyphosate series, but it is happening in every major off-patent active at different speeds.
6.1.3 What It Means for the Forecast
Deflation is not a phase to be survived; it is the operating condition. Any forecast above roughly 4.5% for this market is implicitly assuming that the generic tier stops adding capacity. Nothing in the 2025 evidence suggests it has.
6.2 Shift Two: The Portfolio Is Being Rebuilt Faster Than It Is Being Sold
6.2.1 Innovation Is Real and It Is Not Enough
The pipeline is not the problem. Syngenta’s PLINAZOLIN reached US EPA approval for five insecticide products after twelve years of research and over 3,000 US trials, and TYMIRIUM gained registrations in Canada, Australia, the US and Brazil. BASF describes a pipeline targeting more than EUR 7.5 billion of sales from products launched by 2034. Corteva’s three newest actives grew 54%. These are genuine, differentiated, patent-protected assets.
6.2.2 The Reference Price Is Set Somewhere Else
The problem is that a new active ingredient does not arrive into a vacuum. It arrives into a market where the grower’s alternative is a generic version of the molecule it was designed to replace, at a fraction of the price. Innovation therefore earns a premium over the generic price, not over the previous branded price, and that premium is smaller than the industry’s historical pricing model assumes.
6.2.3 Premixes Are the Response
The strategic answer has been to stop selling actives and start selling systems. A premix of two proprietary actives, or a co-pack of a chemical with a biological, is a product the generic tier cannot copy at the same specification, and it carries the value per kilogram that a single off-patent active cannot. This is why approval count has become a revenue driver: each registration is a new combination the company is permitted to sell.
6.3 Shift Three: The Channel Became the Risk
6.3.1 Two Bankruptcies in the World's Largest Market
Brazil is the single largest national crop protection market on earth and its distribution tier went through a genuine solvency crisis in 2024–25. AgroGalaxy entered judicial recovery in September 2024. Lavoro, listed on Nasdaq, agreed an extrajudicial recovery with creditors in June 2025, having cut its own guidance after describing a “significant tightening in inventory financing conditions” across the sector. Both had expanded rapidly through acquisition on borrowed money into a falling commodity price environment and then met a high interest rate cycle.
6.3.2 Bad Debt Is Now in the Manufacturer's P&L
The clean piece of evidence is Corteva’s own language: its SG&A increase is attributed to higher compensation and bad debt. That is a distributor problem appearing as a supplier cost. FMC’s exit from its Indian commercial business, announced in July 2025, was justified partly on “substantial working capital requirements” — the same constraint, seen from the other side.
6.3.3 Why It Changes the Competitive Map
A manufacturer that sells through a distributor sells a product. A manufacturer that has to finance the channel is selling credit, and credit is a business with a different cost of capital and a different set of competitors. The companies best placed for 2026–2033 are those with either a direct route to large growers or a balance sheet strong enough to carry a distributor through a bad season. That is a structural advantage for the four largest and a structural problem for everyone in the second tier — which is exactly what FMC’s 18% revenue decline and its strategic reset are telling you.
Market Segmentation Analysis (USD Million), 2026–2033
7.1 By Product Class
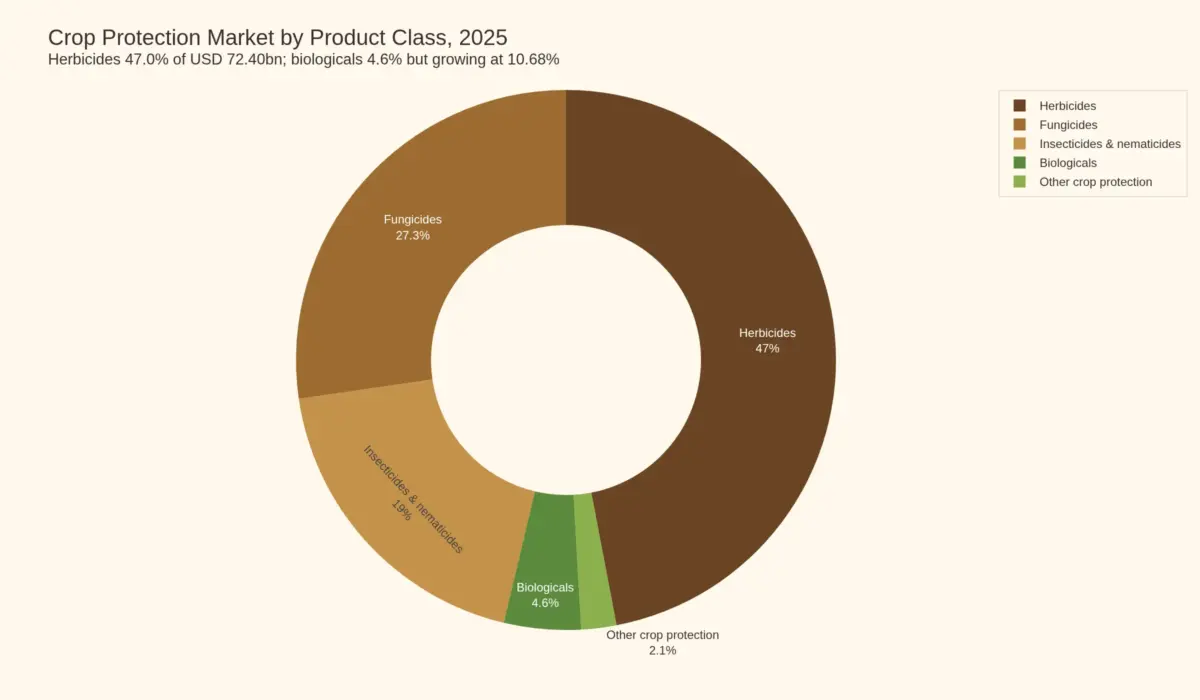
| Product class | 2025 (USD mn) | Share | 2033 (USD mn) | CAGR |
| Herbicides | 34,028 | 47.0% | 43,600 | 3.15% |
| Fungicides | 19,765 | 27.3% | 28,300 | 4.59% |
| Insecticides and nematicides | 13,756 | 19.0% | 19,200 | 4.26% |
| Biologicals | 3,330 | 4.6% | 7,500 | 10.68% |
| Other crop protection | 1,521 | 2.1% | 1,400 | –0.98% |
| Total | 72,400 | 100.0% | 100,000 | 4.12% |
7.1.1 Herbicides
Herbicides are 47.0% of value and the slowest-growing class at 3.15%, for a reason that is structural rather than cyclical: they are the most commoditised, the most exposed to glyphosate and glufosinate pricing, and the class where generic substitution is fastest. They are also the class most exposed to the dicamba withdrawal in the United States, which removed a whole over-the-top system rather than a single product.
7.1.2 Fungicides
Fungicides grow at 4.59% and are the class where the innovator tier is strongest, because fungal control in tropical systems is continuous and because resistance management drives rotation into newer chemistry. Bayer’s fungicides fell 4.8% in 2025 on pricing pressure and lower North American and Asia-Pacific volumes; BASF’s fell 5.8%. Both declines are price and weather, not structural loss of the category — which is why the forecast is positive despite a bad base year.
7.1.3 Insecticides and Nematicides
Insecticides grow at 4.26% from the weakest possible starting point. Bayer’s insecticides fell 12.2% in 2025, almost entirely because the Movento registration expired in Europe, while BASF’s fell 1.2% and Corteva’s fell 2.7%. Nematicides are the fastest-growing sub-class within it, because root-knot nematode damage is largely invisible until yield loss is already banked and because TYMIRIUM-class products have given the category a genuinely new mode of action.
7.1.4 Biologicals
Biologicals are 4.6% of the market and reach 7.5% by 2033 at 10.68%. The basis is Corteva’s audited disclosure of USD 519 million rather than a research estimate, extrapolated across a market where only one of the four majors breaks the line out. That is a deliberate choice to understate rather than overstate: several published figures for “biologicals” are larger than this market’s entire insecticide class and are counting biostimulants as pest control.
7.1.5 Other Crop Protection
Plant growth regulators, fumigants, molluscicides and rodenticides decline at 0.98%, driven almost entirely by fumigant phase-out under the Montreal Protocol and its replacements being lower-volume, higher-value products.
7.2 By Crop Type
7.2.1 Cereals and Grains
Cereals take the largest share of global area and a disproportionate share of herbicide volume, but a below-average share of value per hectare outside Europe. Wheat and barley systems are the most price-sensitive in the market and the most exposed to generic substitution.
7.2.2 Oilseeds and Pulses
Soybean is where this market is most concentrated and most contested. The Brazilian soybean system alone consumes more crop protection value per hectare than any other crop on earth, and the Roundup Ready technology that underpins it is now fully off patent, which is why soybean is simultaneously the largest opportunity and the fastest-deflating one.
7.2.3 Fruits and Vegetables
Fruits and vegetables carry the highest value per hectare and the highest regulatory risk, because the products used on them face the tightest residue limits in the OECD and because the crops are high-value enough to justify premium-priced, low-volume, specialty registrations.
7.2.4 Cotton
Cotton is the most insecticide-intensive major crop and therefore the most exposed to the insecticide classes, and it is also the crop most directly damaged by the US dicamba vacatur in 2025.
7.2.5 Rice
Rice is the largest herbicide opportunity in Asia by area and the smallest by value per hectare, which is precisely why the direct-seeding transition covered in our Rice Seed report matters here: a change in establishment method changes the weed spectrum and the tonnage applied.
7.2.6 Turf, Ornamental and Other
The non-crop segment is small in tonnage, high in margin, and notably the segment Bayer reclassified in 2025 when it moved its Industrial Turf & Ornamental business outside the United States into the glyphosate-based herbicides line — a reminder that segment boundaries inside these companies are management decisions, not natural categories.
7.3 By Mode of Action and Formulation
The most important segmentation in this report is not the one most readers expect. It is the drift of value from single active ingredients into premixes and co-packs, which is invisible in a product-class table but explains most of the value-per-kilogram increase in the forecast. A premix commands a premium that neither of its components can hold alone, and it locks the grower into a supplier’s programme rather than a molecule’s price.
7.4 By Distribution Channel
Distributor and dealer channels carry the majority of global value, but the split is diverging fast: Brazil is moving toward direct-to-grower as distributors fail, North America is consolidating at the retail level, and Asia remains dominated by small independent dealers with limited credit. Channel is not a detail in this market. It is the mechanism through which the price is transmitted.
Regional Market Analysis
| Region | 2025 (USD mn) | Share | 2033 (USD mn) | CAGR |
| Latin America (largest) | 21,070 | 29.1% | 29,600 | 4.34% |
| Asia-Pacific (fastest) | 18,970 | 26.2% | 29,000 | 5.45% |
| North America | 16,720 | 23.1% | 22,000 | 3.49% |
| Europe | 13,100 | 18.1% | 15,600 | 2.21% |
| Middle East and Africa | 2,530 | 3.5% | 3,800 | 5.22% |
| Total | 72,400 | 100.0% | 100,000 | 4.12% |
8.1 Latin America (Largest Market)
Latin America is 29.1% of global value and grows at 4.34%. Brazil is the single largest national market in the world for crop protection and the most competitive: Syngenta’s crop protection sales in Brazil and Latin America declined 1% and 3% respectively in 2025 despite growth everywhere else, explicitly on generic pricing pressure. Bayer grew Latin American Crop Science 4.5% currency-adjusted. Corteva grew Latin American crop protection 4% organically, with a price decline driven by “competitive market dynamics in Latin America” partly offset by North American price increases. Every one of those sentences describes the same market: volume fine, price under attack. The region’s distribution crisis, set out in Section 6.3, is the reason its growth rate is below Asia-Pacific’s despite carrying twice the value per hectare.
8.2 Asia-Pacific (Fastest-Growing Market)
Asia-Pacific is 26.2% of value and grows at 5.45%, the fastest of the major regions. It is also the most internally heterogeneous: China at roughly 8% growth for Syngenta, India the most price-destroyed major market in the world, Japan a high-value low-volume mature market, and Southeast Asia a fast-growing but credit-constrained one. The two most important facts are that China is now both the largest producer of active ingredient and a growing consumer of it, and that India is where generic competition is most destructive to price — destructive enough that FMC exited its Indian commercial business entirely in 2025.
8.3 North America
North America is 23.1% of value and grows at 3.49%. It is the most legally exposed region: the dicamba vacatur removed an entire herbicide-tolerant system in February 2024, and the resulting damage showed up not only in Bayer’s herbicide line but in its soybean and cotton seed revenue, which is the clearest illustration in this report of how tightly chemistry and germplasm are now coupled. It is also the region where the premium-biological and direct-to-grower models are most developed.
8.4 Europe
Europe is 18.1% of value and grows at 2.21%, the slowest of any region, and the reason is policy rather than agronomy. The Commission withdrew its Sustainable Use Regulation proposal on 27 March 2024, leaving Directive 2009/128/EC as the operative framework and the Farm to Fork target of a 50% reduction in pesticide use and risk by 2030 still formally in place without a binding instrument to deliver it. The practical effect is not a single dramatic cut but a continuous attrition of approvals, active by active, which is exactly the 0.3 percentage points a year of regulatory drag baked into the forecast.
8.5 Middle East and Africa
At 3.5% of value, this is the smallest region and the second fastest at 5.22%. It is also the least served: FAO reports Africa used only 6% of the global total between 2015 and 2024 while holding a far larger share of the world’s arable land. The constraint is not agronomic need but distribution, credit and registration infrastructure — the same three constraints that broke the Brazilian channel, present at a much earlier stage of market development.
Competitive Landscape
The full competitive analysis, including the FY2025 results table, the generic tier, R&D productivity and strategic developments, is set out in the Competitive Landscape section of this report. Four numbers frame it: the top four suppliers hold about 56.6% of the market on crop protection revenue of USD 40.94 billion; Syngenta Crop Protection is the largest single business at USD 13.70 billion; the generic tier holds roughly a third of value and a larger share of tonnage; and concentration is drifting down for the first time in thirty years.
Future Outlook and Strategic Recommendations
12.1 Price Against the Generic Reference, Not the Branded One
The single most common strategic error in this industry is benchmarking a new active ingredient against the product it replaces at branded price. The grower’s alternative is the generic, and the premium is measured from there. Companies that price from the generic reference and defend a real, demonstrable agronomic delta will hold share. Companies that price from history will lose volume and then lose the registration investment.
12.2 Buy Distribution Before Building It
FMC’s decision to build a direct sales organisation in Brazil and exit India is a bet that owning the last mile is worth more than owning a broader portfolio. It is the right bet in a market where the intermediary cannot finance itself, and the wrong one in a market where the intermediary can.
12.3 Treat Biologicals as a Component, Not a Category
Biologicals grow at 10.68% and reach 7.5% of value, and the companies capturing that growth are selling them into conventional programmes as resistance-management and residue-reduction tools, not as organic substitutes. Anyone positioning biologicals as a replacement for chemistry is competing for a share of 4.6% instead of a share of 100%.
12.4 Prepare for the Next Judicial Withdrawal
Both 2024’s largest revenue shocks were court rulings, not legislation, and neither appeared in a forecast. The mitigation is portfolio redundancy rather than regulatory monitoring: no single active should carry a product class.
12.5 Long-Term Outlook (2033+)
Beyond 2033 the arithmetic gets harder rather than easier. Volume growth is asymptotic to area growth plus intensity gains, and intensity gains in the OECD are being deliberately regulated away. The market can continue to grow at 3–4% only for as long as the value-per-kilogram series rises, and that series rises only through mix. A crop protection industry that stops inventing is a two percent industry.
Watch List
- Chinese capacity retirement. The single variable that would change this forecast most. There is currently no mechanism for it.
- Brazilian channel solvency. Whether the post-recovery distributor landscape can finance a normal season.
- Glyphosate re-registration politics in the EU and US. A withdrawal would be larger than the dicamba event.
- India generic pricing. Whether the most price-destructive major market stabilises after FMC’s exit.
- Biologicals disclosure. If Bayer and Syngenta begin breaking the line out, the 4.6% base will need restating upward.
- Premix approval throughput. The leading indicator of value-per-kilogram growth.
- Latin American interest rates. The channel crisis was a rate event as much as a commodity event.
Appendix
Currency conversions: EUR/USD 1.13 and INR 85.0/USD, 2025 averages as applied to reported segment results. Volume is active-ingredient equivalent in thousand tonnes. Company segment figures are as reported by each company for the full year ended 31 December 2025, except UPL, whose fiscal year ends 31 March 2025. FAO pesticide use and trade data are for 2024, the latest available release. Segment shares for the four majors are drawn from disclosed product lines and expressed in a common currency basket; they are used to calibrate the global mix, not as a direct measure of it.
About Pheonix Market Research and Disclaimer
This report was produced by Pheonix Market Research using its VALUE intelligence platform. The base year is triangulated from primary company disclosures, government statistics and trade data rather than licensed from a third-party study, and the method is disclosed in full so that a reader can disagree with it precisely. Figures are estimates and are not investment advice. Company results are as reported and have not been restated. Where a source could not be independently verified, the report says so rather than filling the gap. Pheonix Market Research accepts no liability for decisions taken on the basis of this document.
Further reading: Pesticide Volume Rose 53 Per Cent in a Decade and Value Rose 35 — the FAO trade divergence behind this report's 4.12 per cent CAGR — and Three of the Largest Crop Protection Businesses Held Margin in the Worst Pricing Year in a Decade, on the FY2025 margin split across Bayer, BASF, Corteva and FMC.
Table of Contents
- Executive Summary
- Research Methodology and Scope
- Market Overview and Definitions
- 3.1 Why the Definition Matters More Than the Forecast Here
- 3.2 The Ex-Factory Boundary
- 3.3 Segmentation Framework
- 3.4 Forecasting Assumptions (2026–2033)
- Market Dynamics
- 4.1 Market Drivers
- 4.1.1 Resistance Is the Demand Engine Nobody Prices
- 4.1.2 Latin America’s Intensity and Asia’s Volume
- 4.1.3 Approval Volume as a Growth Lever
- 4.1.4 Biologicals Moving From Niche to Portfolio
- 4.1.5 Farm Economics Set the Ceiling
- 4.2 Market Restraints
- 4.2.1 Post-Patent Deflation Is Structural, Not Cyclical
- 4.2.2 The Channel Is the Balance Sheet Now
- 4.2.3 Regulatory Withdrawal Is Now a Revenue Line, Not a Risk Factor
- 4.3 Market Opportunities
- 4.1 Market Drivers
- 5. Global Crop Protection Market Size and Forecast (USD Million), 2026–2033
- 5.1 Market Revenue Analysis
- 5.2 CAGR Analysis
- 5.3 Demand-Supply Trends
- 5.4 Pricing Analysis
- 5.5 Investment Trends
- 5.6 Future Market Outlook
- 6. Three Structural Shifts Defining 2026–2033
- 6.1 Shift One: Deflation by Volume
- 6.1.1 The Statistic That Explains the Decade
- 6.1.2 Why 2022 Obscured It
- 6.1.3 What It Means for the Forecast
- 6.2 Shift Two: The Portfolio Is Being Rebuilt Faster Than It Is Being Sold
- 6.2.1 Innovation Is Real and It Is Not Enough
- 6.2.2 The Reference Price Is Set Somewhere Else
- 6.2.3 Premixes Are the Response
- 6.3 Shift Three: The Channel Became the Risk
- 6.3.1 Two Bankruptcies in the World’s Largest Market
- 6.3.2 Bad Debt Is Now in the Manufacturer’s P&L
- 6.3.3 Why It Changes the Competitive Map
- 6.1 Shift One: Deflation by Volume
- 7. Market Segmentation Analysis (USD Million), 2026–2033
- 7.1 By Product Class
- 7.1.1 Herbicides
- 7.1.2 Fungicides
- 7.1.3 Insecticides and Nematicides
- 7.1.4 Biologicals
- 7.1.5 Other Crop Protection
- 7.2 By Crop Type
- 7.2.1 Cereals and Grains
- 7.2.2 Oilseeds and Pulses
- 7.2.3 Fruits and Vegetables
- 7.2.4 Cotton
- 7.2.5 Rice
- 7.2.6 Turf, Ornamental and Other
- 7.3 By Mode of Action and Formulation
- 7.4 By Distribution Channel
- 7.1 By Product Class
- 8. Regional Market Analysis
- 8.1 Latin America (Largest Market)
- 8.2 Asia-Pacific (Fastest-Growing Market)
- 8.3 North America
- 8.4 Europe
- 8.5 Middle East and Africa
- 9. Competitive Landscape
- 9.1 Market Share Analysis
- 9.2 Competitive Benchmarking
- 9.3 Strategic Developments
- 9.4 The Generic Tier
- 9.5 R&D Productivity and the Cost of a New Active
- 9.6 Portfolio Concentration by Crop
- 9.7 Channel Ownership as a Competitive Weapon
- 9.8 Pricing Power by Product Class
- 9.9 Consolidation and the Divestment Cycle
- 9.10 Competitive Outlook to 2033
- 10. Company Profiles
- 10.1 Syngenta Crop Protection
- 10.2 Bayer CropScience
- 10.3 Corteva Agriscience
- 10.4 BASF Agricultural Solutions
- 10.5 FMC Corporation
- 10.6 UPL Limited
- 10.7 The Chinese Technical Tier
- 10.8 The Indian Generic Tier
- 10.9 Biologicals Specialists
- 10.10 The Distributor Layer
- 11. Strategic Intelligence and Pheonix AI Insights
- 11.1 Crop Protection Demand Forecast Model
- 11.2 Active Ingredient Price Monitor
- 11.3 Regulatory Attrition Tracker
- 11.4 Channel Solvency Monitor (Latin America)
- 11.5 Automated Porter’s Five Forces Analysis
- 12. Future Outlook and Strategic Recommendations
- 12.1 Price Against the Generic Reference, Not the Branded One
- 12.2 Buy Distribution Before Building It
- 12.3 Treat Biologicals as a Component, Not a Category
- 12.4 Prepare for the Next Judicial Withdrawal
- 12.5 Long-Term Outlook (2033+)
- 13. Appendix
- 14. About Pheonix Market Research and Disclaimer
Competitive Landscape
Competitive Landscape
9.1 Market Share Analysis
The four largest crop protection businesses generated USD 40.94 billion of crop protection revenue in 2025, about 56.6% of this market. Syngenta Crop Protection is the largest single business at USD 13.70 billion, followed by Bayer at USD 11.85 billion, BASF at USD 7.89 billion and Corteva at USD 7.50 billion. Adding FMC at USD 3.47 billion takes the top five to USD 44.41 billion, or 61.3%.
That concentration is high in absolute terms and it is falling. The four-firm share exceeded 60% a decade ago. The drift is not the result of the leaders losing their products — all four grew or held revenue in 2025 on a constant-currency basis. It is the result of the generic tier growing faster than the branded tier, because the marginal tonne of active ingredient is being made by companies that did not discover it and are not carrying the discovery cost.
9.2 Competitive Benchmarking: FY2025 Crop Protection Results
| Company | CP revenue 2025 | Growth | Margin signal |
| Syngenta Crop Protection | USD 13.70bn | +4% (+3% CER) | Volumes up, pricing pressure in Brazil and LatAm |
| Bayer Crop Protection | EUR 10,486m (USD 11.85bn) | Core CP –4% cpa | Crop Science EBITDA margin 19.4%, held flat |
| BASF Crop Protection | EUR 6,986m (USD 7.89bn) | Vol +3.0%, price –1.2%, FX –3.9% | Ag Solutions EBITDA +7.4% on –2.2% sales |
| Corteva Crop Protection | USD 7,503m | +2% (+3% organic) | EBITDA USD 1,350m, +6%, margin +70bp |
| FMC | USD 3,470m | –18% (–8% ex-India) | Adjusted EBITDA USD 843m, –7% |
| UPL | INR 466.4bn (c. USD 5.49bn) | +8% | EBITDA INR 81.2bn, +47%, margin 17.4% |
Four things in that table are worth more attention than the headline growth rates.
Bayer’s product line moved further than its total did. Core crop protection fell 4% currency-adjusted, but within that fungicides fell 4.8% to EUR 2,888 million and insecticides fell 12.2% to EUR 1,369 million, while non-glyphosate herbicides rose 0.5% to EUR 5,279 million and glyphosate was flat at EUR 2,552 million. The insecticide collapse was almost entirely one registration: the expiry of Movento in Europe. One regulatory event removed more revenue than the division’s entire growth.
BASF made more money on less revenue. Volumes rose 3.0% and prices fell 1.2%, with currency taking another 3.9%. Yet EBITDA before special items rose 7.4% to EUR 2,081 million, attributed to reduced manufacturing cost and the launch of glufosinate-P-ammonium. That is what a well-run portfolio does in a deflationary market: it substitutes volume for price and lets cost come out.
Corteva’s mix is the most defensible. Volume +5% against price –2% is the healthiest volume-price spread of the group, and it came with herbicides at USD 3,730 million, insecticides at USD 1,669 million, fungicides at USD 1,140 million, biologicals at USD 519 million and other at USD 445 million. Corteva is the only company in the group that discloses biologicals separately, which makes it the only auditable data point in the fastest-growing class in this report.
FMC is the cautionary case. Revenue fell 18% to USD 3.47 billion, and 8% even excluding the Indian business it is divesting. Its response — Project Foundation, the exit from high-cost production sites, moving two active ingredients to lower-cost manufacturing, and exiting India’s commercial channel — is a textbook restructuring of a company that has concluded it cannot win a price war on other people’s molecules.
9.3 Strategic Developments
The strategic moves of 2025 share a single logic: retreat from where the molecule is a commodity, and concentrate where the specification is defensible. FMC’s divestment of its Indian commercial business and simultaneous expansion of direct-to-grower selling in Brazil is the clearest example, but BASF’s glufosinate-P-ammonium launch, Syngenta’s PLINAZOLIN and TYMIRIUM registrations, and Corteva’s growth in fluindapyr, Isoflex and Dodhylex are the same move in product rather than market form.
9.4 The Generic Tier
The generic tier is roughly a third of value and a larger share of tonnage, and it is not a monolith. It contains large, technically capable Chinese producers with their own synthesis capability and increasingly their own registrations; Indian formulators with strong domestic distribution and weak pricing power; Brazilian and Argentine national champions closer to the grower than any multinational; and a long tail of small formulators operating on price alone.
Chinese policy is actively reshaping this tier. ICAMA has moved to permit registration of active ingredients for export only, meaning a molecule not registered for use in China can be registered for export, and to relax restrictions on formulation ratios, active ingredients and content levels to meet overseas specification. Both changes make it easier for Chinese producers to sell finished, specified product rather than technical material — which moves the generic tier up the value chain and into direct competition with branded formulation.
9.5 R&D Productivity and the Cost of a New Active
The cost and duration of registering a new active ingredient is the entry barrier that keeps the branded tier viable. Syngenta’s PLINAZOLIN reached US EPA approval for five insecticide products after twelve years of research and more than 3,000 US trials. That is not a barrier a formulator can cross, and it is why the generic tier competes on molecules the branded tier has already paid to validate.
The corresponding weakness is throughput. Global launches of genuinely new active ingredients remain in single digits per year, against portfolios that need replacement at the rate actives are withdrawn. BASF’s stated pipeline target of more than EUR 7.5 billion of sales from products launched by 2034 is a measure of how much of the future is already committed to compounds that have not yet been registered.
9.6 Portfolio Concentration by Crop
Every major supplier is more exposed to a smaller number of crops than its portfolio presentation suggests. Bayer’s crop protection revenue is heavily weighted to corn and soybean in the Americas; Corteva’s to the same; BASF’s to European cereals and Latin American soybean; Syngenta’s is the most diversified by crop and the most exposed by region. That concentration is why the dicamba vacatur propagated from a herbicide into seed revenue, and why the Brazilian channel crisis hit every one of them in the same quarter.
9.7 Channel Ownership as a Competitive Weapon
The companies with direct grower relationships can defend price in a way distributors cannot. That is why the Brazilian direct-to-grower model is spreading, and why the second tier — which cannot afford to finance a channel — is being squeezed between a branded tier that controls specification and a generic tier that controls cost.
9.8 Pricing Power by Product Class
Pricing power is not evenly distributed and the ranking is stable: proprietary fungicides and nematicides first, insecticides second, premixed herbicides third, single-molecule off-patent herbicides a distant last. Glyphosate has essentially no pricing power at all, which is why it functions as the market’s reference price and why its level is cited in this report as the industry’s inflation index.
9.9 Consolidation and the Divestment Cycle
The 2015–2020 consolidation wave is over and the current phase is divestment: FMC exiting its Indian commercial business, and Corteva having completed the Vylor separation of its seed and genetics business. The pattern is the same in each case — keep the chemistry and the traits, release the capital tied up in channel and commodity assets.
9.10 Competitive Outlook to 2033
Concentration should continue to drift down modestly in value and remain flat in tonnage, because the generic tier grows faster and the branded tier substitutes mix for volume. The realistic competitive picture by 2033 is four companies holding roughly half the value of a USD 100 billion market through proprietary chemistry, premixes and biologicals, and a generic tier holding the other half by being better at manufacturing than anyone at inventing.
Value Chain
The Crop Protection Value Chain
The crop protection value chain has four stages, and the unusual thing about it is that the stage which creates most of the value and the stage which captures most of the margin are not the same stage.
Stage One: Active Ingredient Manufacture
Active ingredient is made in chemical plants that are extremely capital intensive, subject to environmental permitting that takes years, and economically dependent on scale. For a proprietary molecule there is one producer, and the economics are those of a patent-protected specialty chemical. For an off-patent molecule there may be fifteen, and the economics are those of a commodity: the marginal producer sets the price and the price converges on cash cost plus a thin margin.
This is where the structural change of the last decade happened. China is now both the largest producer of pesticide active ingredient and a net exporter of it. In 2025 China exported 2.303 million tonnes of pesticides worth RMB 126.83 billion, up 12.2% in volume and 11.9% in value — value growing slightly slower than volume, which tells you the export price per tonne fell again. Ninety-five percent glyphosate technical, the single most traded active in the world, sat at RMB 26,101 per tonne on 28 November 2025 with port reference prices at USD 3,700–3,730 per tonne FOB.
The critical economic feature of this stage is that Chinese capacity does not exit on price signals the way Western capacity does. A producer running a multi-product plant recovers fixed cost by running volume, and the incentive to withhold output and defend price is weaker than the incentive to keep the plant loaded. That is the mechanism behind a decade in which traded pesticide volume rose 53% and traded pesticide value rose 35%, per FAO.
Stage Two: Formulation and Packaging
Technical material is not a product a grower can use. It becomes one through formulation: surfactants, solvents, adjuvants, granulation, encapsulation, and increasingly co-packing of two or more actives into a single application. Formulation is where the value chain stops being a commodity business, and it is deliberately underrated by anyone who treats crop protection as a chemicals story.
Two products containing the same active at the same concentration can differ materially in field performance, rainfastness, crop safety and tank-mix compatibility. That difference is the basis of every brand premium in this industry, and it is why the generic tier can take the molecule without taking the market. It is also why the premix has become the single most important product-development trend in the sector: a premix of two proprietary actives is a formulation the generic tier cannot legally copy at the same specification, and it converts a price competition into a specification competition.
Stage Three: Distribution and Finance
This is the stage that most analyses skip and which has been the most consequential since 2024. In Latin America particularly, the distributor does not simply move boxes: it extends credit to the grower across a season, takes repayment at harvest, and finances the whole chain on its own balance sheet. The distributor is therefore a bank with a warehouse, and its cost of capital is an input to the price of a fungicide.
When interest rates rose and commodity prices fell at the same time, that model broke. AgroGalaxy filed for judicial recovery in September 2024. Lavoro agreed an extrajudicial recovery in June 2025 after reporting a USD 48.2 million first-quarter loss and describing a “significant tightening in inventory financing conditions” across the sector. Corteva’s reported SG&A increase is attributed partly to bad debt — a distributor failure appearing in a manufacturer’s income statement. FMC’s exit from its Indian commercial business was justified partly on “substantial working capital requirements”, the same constraint seen from the other end.
The strategic consequence is that channel ownership has become a competitive weapon rather than a distribution choice. FMC built a direct sales and technical service organisation to sell straight to large Brazilian corn and soybean growers, calling it a potential multi-hundred-million dollar opportunity. That is a company deciding that the margin it pays a distributor is better spent on its own working capital risk.
Stage Four: The Grower
The grower is the only participant in the chain who cannot pass cost on. Crop protection is a residual purchase made after the seed decision and funded out of the margin the commodity market leaves. When the average US corn acre returned minus USD 118.08 after total costs in 2025, the response was not to stop spraying but to trade down, buy generic and defer the discretionary pass. That trading-down behaviour is the demand side of the deflation, and it is why a market can apply more product and spend less money in the same season.
Where the Margin Actually Sits
The margin distribution across the chain is unusually uneven. Bayer’s Crop Science division earned an EBITDA margin before special items of 19.4% in 2025 on EUR 21,622 million of sales and held that margin flat year on year despite falling revenue. BASF’s Agricultural Solutions segment earned EUR 2,081 million of EBITDA before special items on EUR 9,587 million of sales, an increase of 7.4% on a revenue decline of 2.2% — it made more money selling less, by improving contribution margin and reducing manufacturing cost. Corteva’s crop protection segment earned USD 1,350 million, up 6%, with its margin improving about 70 basis points, on revenue up 2%.
Read together, those three numbers say something important and counterintuitive: in the worst pricing environment in a decade, the three largest crop protection businesses all improved or held profitability. The margin was protected by mix, by cost and by raw material deflation. What was not protected was revenue growth, and what was destroyed was the margin of everyone in the chain who buys active ingredient instead of inventing it.
Investment Activity
Investment Activity
Capital in this industry is doing something unusual for an agricultural input market: it is leaving. The 2015–2020 consolidation wave that created the current four-firm structure has been followed by a divestment phase, and the logic of the divestment is consistent across every transaction — keep the chemistry, the traits and the registrations, and release the capital trapped in channel, commodity and commodity-adjacent assets.
The Impairment Signal
The single largest capital event in the sector in 2025 was not a transaction. Bayer’s Crop Science division reported EBITDA of negative EUR 1,585 million for 2025 against EBITDA before special items of positive EUR 4,188 million — a gap of EUR 5,773 million of special items. Whatever the accounting composition, a write-down of that size on a division with EUR 21.6 billion of sales is the market’s most explicit statement that the cash flows this industry was valued on in 2018 are not the cash flows it produces in 2025.
It also frames the strategic problem precisely. The division’s underlying profitability was stable — margin before special items held at 19.4% for the second year — while its balance-sheet value was written down by an amount larger than its annual EBITDA. Operations are fine. The valuation premise is not.
Divestment: FMC’s Restructuring Is the Template
FMC ran the most complete strategic reset in the sector and every element of it is instructive. Revenue fell 18% to USD 3.47 billion, or 8% excluding the Indian commercial business it announced in July 2025 that it would sell. Adjusted EBITDA fell only 7% to USD 843 million, which is the signature of a company cutting cost faster than it is losing revenue.
Four moves made up the reset. Project Foundation was launched to optimise the manufacturing footprint by exiting high-cost production sites, improving sourcing and consolidating operations. Two active ingredients were moved to lower-cost manufacturing locations during 2025, explicitly to compete in the post-patent market. The Indian commercial business was put up for sale, with completion anticipated in 2026, while FMC retains its global active ingredient manufacturing and research capability in India and intends to supply its patented and data-protected portfolio through a supply agreement with the buyer. And FMC built a direct sales and technical service organisation in Brazil to sell straight to large corn and soybean growers, described as a potential multi-hundred-million dollar opportunity.
Read as a single strategy, that is a company concluding that ownership of manufacturing, patents and the last mile is defensible, and that ownership of a distribution business in the world’s most price-destroyed market is not.
Route-to-Market Investment Replaces Portfolio Investment
The Brazilian direct-to-grower move is the clearest example of a wider trend: capital is moving from buying brands into owning the customer relationship. The reason is the distribution crisis set out elsewhere in this report. When a distributor cannot finance a season, the manufacturer either finances it or loses the sale, and a direct organisation is a way of converting a credit exposure into a margin capture. Expect more of this, particularly in Brazil and Argentina, and expect it to be funded by exiting markets where the channel is functional but the price is not.
Productive Investment: Where the Money Still Goes
Three categories continue to attract capital. New active ingredients, where BASF states a pipeline targeting more than EUR 7.5 billion of sales from products launched by 2034 — a figure that tells you how much of the industry’s future revenue is already committed to compounds that have not yet been registered. Biologicals, where Corteva’s USD 519 million line grew 9% and where acquisition multiples have consistently run ahead of the revenue acquired. And manufacturing cost, where the investment is defensive rather than expansionary: BASF attributed its EBITDA improvement to reduced manufacturing cost, and FMC is spending to relocate production rather than add it.
What is conspicuously absent is investment in new capacity for off-patent active ingredients in the West. There is no business case: the price is set by producers with a lower cost base and a greater willingness to run at low utilisation.
Balance Sheet Repair
UPL is the clearest balance-sheet story in the sector. In the year to 31 March 2025 it grew revenue 8% to INR 466.4 billion and EBITDA 47% to INR 81.2 billion, lifting its EBITDA margin 460 basis points to 17.4%, and it reduced net debt by INR 83.2 billion to INR 138.6 billion on operating free cash flow of INR 44.5 billion plus proceeds from two capital transactions. For a company whose FY2024 was a loss of INR 12.0 billion, that is a full repair in twelve months, and it was achieved through deleveraging and working capital discipline rather than through price.
Bayer’s cash position moved the other way: net cash provided by operating activities in Crop Science fell 43.9% to EUR 1,793 million while cash flow-relevant capital expenditure fell 13.2% to EUR 1,009 million. A division cutting capex while its cash generation halves is a division in capital preservation mode.
The Frozen M&A Market
Consolidation at the distribution layer has stopped. Brazilian input retailing had been an active acquisition market for most of a decade and effectively froze in 2024–25, as the two largest consolidators entered recovery proceedings and the assets that had been assembled at a premium became difficult to value at any price. That matters for the whole chain: a distribution tier that cannot be bought or sold cannot be restructured quickly, and the excess capacity in the channel persists.
What to Watch
Three signals would change the investment picture. A wave of Chinese consolidation among technical producers, which would be the first genuine mechanism for capacity retirement and the only realistic route to price recovery. A biologicals transaction at a multiple that validates the growth rates the segment is claiming. And a major divestment of crop protection assets by one of the four, which would end the debate about whether this industry’s scale is an advantage or a burden.
Technology & Innovation
Technology and Innovation
Crop protection innovation is often described as a race between chemistry and resistance. In 2026 it is more accurately a race between the cost of invention and the speed of copying, and the copying is winning on tonnage while the invention is winning on value. This section sets out where the technology actually is, and separates the genuinely new from the well-marketed.
New Active Ingredients: Few, Expensive and Consequential
The number of genuinely new modes of action reaching market each year remains in single digits globally, and the cost of getting one there has risen to the point where only four companies can plausibly attempt it. The reason is measurable. Syngenta’s PLINAZOLIN technology received US EPA approval for use across five insecticide products following twelve years of research and more than 3,000 US trials. That is not a product development cycle; it is an institutional commitment, and it explains why the branded tier’s competitive advantage is regulatory rather than chemical.
Three launches in 2025 show what that investment buys. Syngenta’s TYMIRIUM technology gained registrations in Canada, Australia, the United States and Brazil for nematode and fungal disease control, addressing a problem that is largely invisible until yield has already been lost and where the incumbent solutions were fumigants with poor safety profiles. Syngenta’s ALTESSIA herbicide launched in India for rice, one of the few genuinely new tools for a crop grown on 43 million Indian hectares. BASF launched glufosinate-P-ammonium in North America, a single-isomer product that delivers the same weed control at lower application rates than the racemic glufosinate it replaces.
Corteva’s three newest actives — fluindapyr, a patented fungicide now registered and launched in the United States, Brazil and Argentina; Isoflex, a Group 13 herbicide with a novel mode of action in cereals, expanded into Great Britain; and Dodhylex — together reached approximately USD 200 million of sales in 2025, up 54% on 2024. That growth rate, on a revenue base that small, is the clearest available evidence of how much value a genuinely new active can create in a mature market: nothing else in this industry grew 54%.
Premixes: The Most Important Product Trend in the Market
The premix is not a new idea and it is the single most important thing happening in product development, because it changes the unit of competition. A single off-patent active competes on price against fifteen identical products. A premix of two proprietary actives, or of a proprietary active with a partner compound at a specific ratio, is a product the generic tier cannot legally copy at the same specification, and it competes on agronomic outcome instead.
The commercial logic is straightforward and it is visible in the numbers. It raises value per kilogram of active ingredient, which is the exact variable this report uses to explain the difference between 1.88% volume growth and 4.12% value growth. It creates switching costs through the agronomic programme rather than through a contract. And it makes registration throughput a revenue driver: every additional approved active is a new combination the company is entitled to sell, which is why Syngenta counted more than 1,800 approvals in 2025 including re-registrations and label extensions.
Biologicals: The Honest Version
Biologicals are the most over-claimed segment in agricultural market research and one of the genuinely promising ones, and the two facts coexist. Corteva is the only one of the four majors that discloses the line separately, and it reported USD 519 million in 2025, up 9% and 6.9% of its crop protection revenue. That disclosure is the basis for the 4.6% share and the 10.68% growth rate used in this report, extrapolated across a market where nobody else breaks the number out.
That choice deliberately understates the category relative to published figures for “biopesticides” and “agricultural biologicals”, several of which are larger than this market’s entire insecticide class. They are larger because they include biostimulants, biofertilisers and soil amendments, which are not pest control and are not in this market. Whether biologicals are 4.6% or 12% of crop protection is not a matter of opinion; it is a matter of what is counted, and the auditable answer is 4.6%.
The strategically important point is how biologicals are being sold. The companies capturing growth are integrating them into conventional programmes as resistance-management tools, residue-reduction tools and pre-harvest interval solutions — not as substitutes for chemistry. A biological positioned as a replacement competes for 4.6% of the market. A biological positioned as a component competes for the whole of it, and that is where the double-digit growth is actually coming from.
Application Technology: Where Volume Gets Destroyed
The least discussed and most consequential technology in this market is not a molecule. It is the application system. Precision spraying, optical spot-spraying and variable-rate application all do the same thing: they reduce the volume of product applied per hectare without reducing the agronomic result, by applying only where the target is present.
That is unambiguously good for the grower and for the environment, and it is structurally deflationary for the industry. A technology that cuts herbicide use per hectare by a meaningful percentage is a technology that removes tonnage from the market permanently, and it is arriving at exactly the moment when the tonnage is the only part of the growth the industry can rely on. This is embedded in the 1.88% volume assumption: the measured FAO decade ran at 1.7% a year, and better application is one of the reasons we do not assume it accelerates.
Resistance Management as a Product Category
Resistance is the demand driver nobody prices because it drives replacement rather than growth. Every major herbicide mode of action has documented resistance in a major crop somewhere, and the practical response is not more of the same product but a rotation through different modes and, increasingly, a premix that carries two at once. The same dynamic is now visible in fungicides in tropical systems, where continuous disease pressure and short generation times make resistance a management problem rather than an event.
The consequence for the forecast is that the value-per-kilogram series rises for agronomic reasons as well as commercial ones. A grower managing resistance applies a more expensive, more specific product; the tonnage is flat or lower and the spend is higher. This is why the 54% of growth attributed to price and mix is not simply inflation.
What Is Not Yet Material
Three technologies are frequently presented as imminent and are not, in this market’s numbers. RNA-based actives remain pre-commercial at scale, with no material revenue in any disclosed segment. Peptide and protein-based crop protection is at an earlier stage than the RNA class. And microbial consortia, as distinct from single-strain biologicals, remain largely a research proposition with limited field consistency. Any of them could become material within the forecast window; none of them is currently large enough to appear in a product-class table, and this report does not put revenue against them.
The Technology Conclusion
The industry’s innovation engine works. It produces genuinely better products, at a rate of a handful a year, at a cost only four companies can bear, and it earns a real premium when it does. What it does not do is grow the market at 6%. In a market where the reference price is set by capacity in China, a better product earns a premium over the generic, not over the past, and that premium is smaller than the industry’s pricing model assumed for thirty years.
Market Risk
Market Risk Analysis
Seven risks are material to this forecast. They are ordered by the size of the change they would produce rather than by their probability, because that is the more useful order for anyone using this document to make a decision.
Risk One: Chinese Capacity Does Not Retire (Downside, High Impact)
This is the largest single risk and it is not a tail risk — it is the base case’s main assumption. The forecast assumes Chinese technical material capacity remains structurally long, prices stay below pre-pandemic levels and the generic tier keeps growing faster than the branded tier. What would break it in the other direction is a coordinated retirement or a consolidation among Chinese producers, which would put a floor under price and could add several percentage points to the value-per-kilogram series.
The asymmetry is worth stating plainly. There is a realistic path to price recovery if capacity exits. There is no realistic path to price recovery if it does not, because no mechanism exists that would cause it to: producers in a multi-product plant recover fixed cost by running volume, and the incentive to withhold output is weaker than the incentive to keep the plant loaded. A forecast of 4.12% is therefore not a middle path between optimism and pessimism; it is a specific bet that the current capacity structure persists, and it should be read that way.
Risk Two: Judicial Withdrawal of a Major Active (Downside, High Impact, Unforecastable)
Both of 2024’s largest revenue shocks were court rulings rather than legislation, and neither could be derived from a trend line. The US District Court of Arizona vacated the over-the-top dicamba registrations on 6 February 2024 and the EPA’s existing stocks order of 14 February limited the damage without restoring the product. Bayer’s insecticides fell 12.2% when its Movento registration expired in Europe.
The tail risk is glyphosate. A withdrawal or material restriction in either the European Union or the United States would be larger than both of those events combined, and it is not in the numbers: the forecast embeds about 0.3 percentage points a year of regulatory attrition, which is the observed OECD rate for individual actives, not the removal of the market’s largest single product. The mitigation available to a company is portfolio redundancy, not regulatory monitoring, because these events arrive with no warning and move faster than any replacement can be registered.
Risk Three: The Channel Cannot Finance a Season (Downside, Medium Impact, Near-Term)
The Brazilian distribution crisis of 2024–25 was a genuine solvency event, not a scare. AgroGalaxy filed for judicial recovery in September 2024. Lavoro agreed an extrajudicial recovery in June 2025 after reporting a USD 48.2 million first-quarter loss and describing “significant tightening in inventory financing conditions” across the sector. Corteva attributes part of its SG&A growth to bad debt. FMC cites working capital requirements as a reason for leaving India.
The near-term risk is that the post-recovery channel enters the 2026–27 Brazilian season with less credit capacity precisely as grain prices normalise and growers want to buy again. That would suppress volume in the largest single country market in the world. It is the reason the 2026 recovery in this report is 3.7% rather than the 5% a simple inventory rebuild would imply.
Risk Four: Grower Economics Compress Discretionary Spend (Downside, Medium Impact)
Crop protection is a residual purchase funded from margin the grower may not have. The average US corn acre returned minus USD 118.08 after total costs in 2025. In that environment the farmer does not stop protecting the crop, but he trades down to generic, skips the second fungicide pass and defers the discretionary application — and each of those actions removes value from this market without removing much tonnage. That is the precise mechanism by which this market has been able to grow volume and lose value at the same time, and it is a risk that gets worse in a low commodity price year.
Risk Five: Biologicals Do Not Scale (Downside, Low Impact on the Total, High Impact on Segment Valuations)
Biologicals carry 4.6% of value and 10.68% of the forecast’s growth rate. The risk is not that the category fails; it is that field consistency, shelf life and formulation stability remain harder than the category’s growth rate assumes, and that the acquisition multiples paid on that assumption prove to have been calculated on revenue that includes biostimulants rather than pest control. A shortfall here costs less than a percentage point of total market growth but would be materially damaging to the valuations of biologicals-focused businesses.
Risk Six: Currency Distorts the Reported Market (Both Directions, High Impact on the Series)
This is a dollar-denominated forecast built from companies reporting in euros, dollars, rupees, Swiss francs and renminbi. In 2025 the translation effect was larger than the underlying growth for the largest player: Bayer’s Crop Science sales fell 2.9% as reported but rose 1.1% currency-adjusted, with currency accounting for a 4-point drag. BASF’s Agricultural Solutions saw a 3.9% currency headwind on a 2.2% revenue decline. A reader comparing this series to a euro-denominated one will get a different answer, and the difference will be the dollar, not the market.
Risk Seven: Concentration Cuts Both Ways (Upside and Downside)
The four largest suppliers hold 56.6% of this market, and concentration is drifting down for the first time in thirty years. The downside is obvious: any single strategic decision by one of the four — a price war to defend share, a portfolio exit, a failing registration — moves the global number. The upside is less often noted: this is an industry where four companies coordinate implicitly on price because it is in none of their interests to destroy the category’s margin, and the generic tier is the only participant with an incentive to do so. If the generic tier consolidates, the market becomes more disciplined, not less, and the price series recovers faster than this forecast assumes.
Risk Summary
The forecast is asymmetric to the downside on volume and asymmetric to the upside on price. Volume assumptions are anchored on a measured FAO decade and are unlikely to be materially wrong. Price assumptions depend on a single structural condition — the persistence of excess Chinese capacity — and that condition is political and industrial rather than economic, which means it can change quickly in either direction and cannot be modelled from history.
Regulatory Landscape
Regulatory Landscape
In most markets we cover, regulation is a risk factor. In crop protection it is a revenue line, a growth rate and, twice in 2024, a loss larger than the forecast growth of an entire product class. Three jurisdictions set the terms: the United States, the European Union and Brazil, with China now shaping the supply side through export policy and India shaping the price side through the absence of effective enforcement.
The United States: Judicial Risk Becomes Financial Risk
On 6 February 2024 the US District Court of Arizona vacated the 2020 registrations for the over-the-top dicamba products XtendiMax, Engenia and Tavium. From that date the products were unregistered and sale or distribution was unlawful.
The EPA responded on 14 February 2024 with an existing stocks order permitting limited sale, distribution and use of product already in the channel, explicitly to prevent growers who had already bought dicamba-tolerant seed from being left without a herbicide. It was a holding action, not a restoration, and it was limited to the 2024 growing season.
The financial consequence is the most important lesson in this report about how chemistry and germplasm are now coupled. The damage did not stay in the herbicide line. Bayer’s soybean seed and traits revenue fell 7.7% currency-adjusted to EUR 2,214 million and cotton seed fell 22.9% to EUR 442 million, both attributed principally to the dicamba vacatur and lower planted area. Corteva took the same hit on the seed side. Removing a herbicide removed the reason to buy the seed that tolerates it, and the seed loss was larger than the herbicide loss.
The structural point is that a single district court ruling, in a system where the registrant has no vote, can remove a product system worth several hundred million dollars with no legislative process, no transition period and no compensation. No trend line anticipates that. It is why this report treats regulatory attrition as an event risk in the tail rather than a smooth drag.
The European Union: Attrition Without a Statute
Europe’s position is often misdescribed. The Commission adopted a proposal for a Sustainable Use Regulation in June 2022 with EU-wide targets to cut pesticide use and risk by 50% by 2030. That proposal was withdrawn on 27 March 2024. There is no binding EU instrument imposing the 50% target.
What remains is Directive 2009/128/EC, the Sustainable Use Directive, under which Member States draw up National Action Plans, and the Commission’s Harmonised Risk Indicators, published on a lagging basis. Europe therefore has a political target without a legal mechanism, and a legal mechanism without a reduction obligation.
The practical effect on the market is not a dramatic cut, and the 2.21% growth rate in this report’s European forecast reflects that. It is a continuous attrition of individual approvals, active by active, which is harder to see than a ban and harder to fight. Bayer’s Movento registration expiring in Europe cut its global insecticide revenue 12.2% in a single year — a European administrative event with a worldwide P&L consequence. The insurance against this is portfolio redundancy, not regulatory monitoring: no single active should carry a product class, because the withdrawal arrives without warning and moves too fast to replace.
Brazil: The Most Important Regulatory Change in the Market
Brazil replaced its pesticide framework with Lei nº 14.785, sanctioned on 27 December 2023, concluding a legislative process that had run in Congress for twenty-four years.
Three changes matter commercially. First, the registration standard shifts from hazard assessment, effectively a precautionary approach, to risk analysis, with the Ministry of Agriculture coordinating. Second, Anvisa and IBAMA retain authority to reject products on human health and environmental grounds respectively, so the change is one of framing and sequencing rather than of veto. Third, and most consequential for the market, the law sets a maximum registration period of two years for new pesticides, against a prior average of eight to ten years.
The law also introduces predictability into re-evaluation, allowing registration of new products for the same purpose while an existing active is under re-analysis — which prevents a re-evaluation from creating a temporary monopoly for the incumbent.
The consequence for this forecast is concentrated in Latin America’s 4.34% growth rate. A shorter registration pipeline lowers the cost of bringing a generic to market in the world’s largest crop protection country. It therefore accelerates precisely the deflationary force that this report identifies as the market’s defining condition. Brazil has made it cheaper to compete on price, and the same law that improves grower access improves the generic tier’s economics more than the branded tier’s.
China: Regulating for Export
China’s regulatory shift is the supply-side change that matters most to the global price level. ICAMA has moved to allow registration of active ingredients for export only — a molecule not registered for use inside China can be registered for export — and to relax restrictions on formulation ratios, active ingredients and content levels to meet overseas market requirements.
Both changes convert Chinese producers from suppliers of technical material into suppliers of finished, specified product. That is a move up the value chain for them and a direct competitive incursion into branded formulation for everyone else. It is also, in practical terms, an increase in the global supply of registered, saleable crop protection product outside the control of the four majors.
India: Regulation by Attrition
India is the counter-example: a large agricultural market where the regulatory framework exists but enforcement and price discipline do not, producing the most destructive generic competition in the world. FMC’s stated reasons for divesting its Indian commercial business — “unexpected, intense generic competition, complex regulatory environment and substantial working capital requirements” — is the most direct corporate admission in this report of what that market does to a branded supplier. FMC intends to keep its Indian manufacturing and research and to supply its patented portfolio through a supply agreement with the buyer, which is a precise statement of where value can and cannot be defended in India.
What Regulation Does to the Forecast
Three conclusions follow and all three are in the numbers. Regulatory attrition in the OECD removes about 0.3 percentage points a year of growth and is embedded in the product-class rates rather than applied separately. Judicial withdrawal is a tail risk too large and too irregular to smooth, and it is treated as such in the risk section rather than in the base case. And the largest regulatory change of the period — Brazil’s Lei 14.785 — is deflationary, because it lowers the cost of entering the market with a copy rather than the cost of inventing a product.