
Global Fertiliser (NPK) Market Report, Size, Share and Forecast 2026–2033
The Short Version
The global fertiliser market was worth USD 172.38 billion in 2025 at producer level, on 209.0 million tonnes of N+P2O5+K2O nutrients. We forecast USD 224.00 billion by 2033, a 3.33% compound annual growth rate, carried by nutrient volume growing 1.45% a year to 234.5 Mt.
Almost every published number for this market blends three commodities that no longer behave alike. Nitrogen is a gas derivative whose price is set by the marginal ammonia plant. Phosphate is an export-policy market that has acquired a battery-industry co-product. Potash is walking into a supply wave with a commissioning date. Their only shared property is that a farmer applies all three to the same hectare. Averaging them produces a growth rate that describes none of them.
What This Report Measures, and Where the Boundary Sits
Value is measured at producer level: realised ex-works prices, before distributor margin, blending fees, freight and application services. Published estimates for this market circulate between roughly USD 120 billion and USD 260 billion for the same year. The spread is not an arithmetic disagreement, it is a scope disagreement, and three boundary calls generate most of it.
- Producer level versus farm gate. In Brazil and the United States the distribution and blending layer between the plant and the field adds 15-25% to what the grower pays. Measured at the farm gate this market is roughly a quarter larger than the number in this report.
- Nutrient tonnes versus product tonnes. 209.0 Mt of nutrients is roughly 480-500 Mt of physical product, because every product carries ballast: urea is 46% nitrogen, MOP is 60% K2O, DAP is 46% P2O5. Sizing on product tonnage inflates volume by more than a factor of two without changing value at all. We size value and volume on nutrients and say so on every page.
- Fertiliser-destined versus all nutrient sales. A material share of ammonia never reaches a field. It becomes caprolactam, nitric acid, melamine, AdBlue and industrial urea. Following IFA practice, conventional industrial uses are included in the demand base and are not separated out.
Volume is expressed in million tonnes of nutrient, the only basis on which value per tonne means anything across products. The resulting value-per-nutrient-tonne series is a derived indicator of mix and pricing, not an observable transaction price, and the methodology field says so.
Why Three Nutrients Share One Name
The single most useful table in this report is the one that separates the three nutrients.
| Nutrient | 2025 volume (Mt) | Volume share | 2025 value (USD bn) | Value share | Value per tonne (USD) |
|---|---|---|---|---|---|
| Nitrogen (N) | 119.5 | 57.2% | 94.41 | 54.8% | 790 |
| Phosphate (P2O5) | 47.5 | 22.7% | 56.05 | 32.5% | 1,180 |
| Potash (K2O) | 42.0 | 20.1% | 21.92 | 12.7% | 522 |
| Total | 209.0 | 100% | 172.38 | 100% | 824.9 |
Phosphate is 22.7% of the tonnage and 32.5% of the value. Potash is 20.1% of the tonnage and 12.7% of the value. Only nitrogen runs roughly at its own weight in both. The nutrient that most determines this market's revenue line is therefore not the one that most determines its volume line - and neither of them is the one with the most predictable supply.
This matters practically. A forecast built by projecting nutrient tonnage and multiplying by a blended price will get the volume roughly right and the value wrong by a wide margin in any year when one nutrient's pricing regime breaks. It broke twice in the last four years: phosphate in 2024-25, nitrogen in the second quarter of 2026.
Market Size and Forecast, 2025-2033
The World Bank fertiliser price index averaged 138.7 in 2025, spiked to 188.2 in the second quarter of 2026 on the Strait of Hormuz disruption, and had fallen to 147.6 by the third quarter. Urea went from USD 422.7/t annual average in 2025 to a USD 693.5/t second-quarter 2026 average and then USD 399.2/t in the third. That is not a market finding a new level. It is a market repricing a shipping lane.
Our path therefore shows the shock and its reversal rather than smoothing them, and it is a two-speed decade: 2.52% to 2029, then 4.15% to 2033. The slow half is supply-driven - potash capacity arrives before potash demand does. The fast half is phosphate-driven, on soil depletion and purified phosphoric acid demand that cannot be met from existing capacity.
| Year | Market value (USD bn) | Nutrient volume (Mt) | Value per nutrient tonne (USD) | YoY value |
|---|---|---|---|---|
| 2025 | 172.38 | 209.0 | 824.9 | - |
| 2026 | 184.60 | 212.0 | 870.8 | +7.1% |
| 2027 | 178.90 | 215.1 | 831.7 | -3.1% |
| 2028 | 183.10 | 218.2 | 839.1 | +2.3% |
| 2029 | 190.40 | 221.4 | 860.0 | +4.0% |
| 2030 | 197.20 | 224.6 | 878.0 | +3.6% |
| 2031 | 204.80 | 227.9 | 898.6 | +3.9% |
| 2032 | 213.60 | 231.2 | 923.9 | +4.3% |
| 2033 | 224.00 | 234.5 | 955.2 | +4.9% |
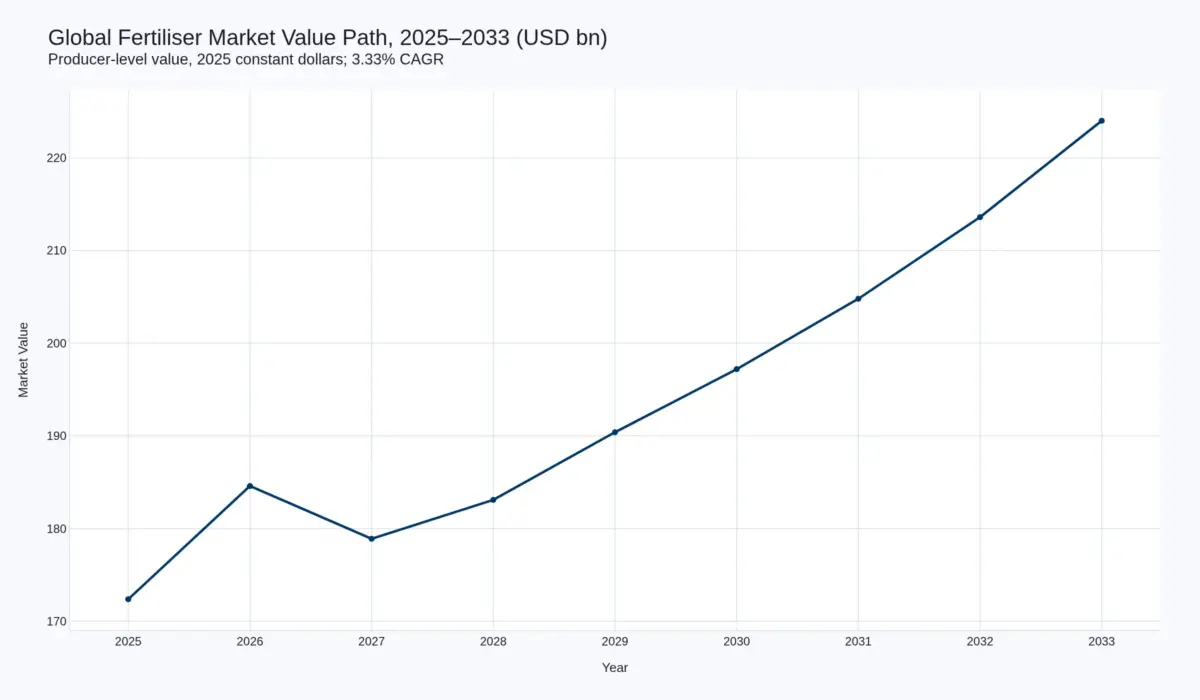
Two disciplines follow from that shape. First, anyone annualising the 2026 slope over-forecasts the decade by roughly a factor of six. Second, the value per nutrient tonne only rises 1.85% a year across the whole period - from USD 824.9 to USD 955.2 - which is less than the 2025-to-2026 move alone. The price cycle is large relative to the structural trend. That is the defining feature of a commodity input market and the reason we decompose rather than extrapolate.
Three Structural Shifts Defining 2026-2033
Shift One: The Three Nutrients Have Decoupled
Between 2020 and 2024 the three nutrients moved roughly together, driven by a common energy and freight shock. Since 2025 they have been set by three unrelated mechanisms, and the divergence is now large enough that treating them as one market is a category error.
Nitrogen is priced off gas. The November 2026 Yara-Mosaic contract settled at USD 645/t CFR Tampa, up USD 95 in a month, while Northwest European ammonia traded at USD 710-730/t CFR and Chinese export ammonia at USD 510-535/t FOB. A 40% spread across the same molecule in the same week is not noise - it is the cost curve made visible, and it explains why roughly one-third of European ammonia capacity is currently curtailed with TTF forward above EUR 100/MWh.
Phosphate is priced by administrative decision plus a co-product. In December 2025 China's National Development and Reform Commission suspended phosphate fertiliser exports until August 2026; as of September only triple superphosphate and single superphosphate cargoes were understood to be eligible for inspection and export, and DAP and MAP had no confirmed resumption date. India paid USD 890-900/t CFR for DAP in late October 2026 while Brazilian MAP sat at USD 830-850 and buyers substituted TSP, which needs no ammonia at all.
Potash is priced by a supply schedule. Brazil granular MOP fell to USD 355-375/t CFR in October 2026, down around 10% in two months, on abundant supply, elevated inventories and slowing Chinese purchasing. No other nutrient has a mine the market can point at and date.
Shift Two: Potash's Supply Wave Has a Date on It
BHP's Jansen Stage 1 is 87% complete as of 20 October 2026 and scheduled for first production in mid-2027, ramping to roughly 8.5 Mtpa when Stage 2 follows in mid-2031 and reaches full capacity in BHP's 2033-34 financial year. The project carries a CAD 21.8 billion (USD 15.3 billion) price tag and sits at the low end of the cost curve when fully ramped.
Against it, IFA expects potash to be the fastest-growing nutrient in demand at 2-3% a year, with global use reaching 224 Mt of total nutrients by FY2029. That is the tension: the nutrient with the best demand growth is the one with the clearest new supply. IFA already scores the potash balance at a theoretically available surplus equal to 14% of supply capability in 2029, against 13% in 2024, and industry estimates put roughly 15 Mt of new capacity entering the international market between 2027 and 2030.
The consequence for this forecast is specific: potash value growth must come almost entirely from tonnage, because price is capped by a surplus the market can see. This is the precise inverse of the corn seed market, where value grows because technology captures more of a fixed hectare. Here the hectare count and the application rate both grow and the price does not.
Shift Three: Europe Is Exiting the Top of the Nitrogen Cost Curve
CBAM entered its definitive period on 1 January 2026, with the Commission publishing its definitive-period calculation methodology on 14 August 2026. Fertilisers are in scope. IFA explicitly names the mechanism as a factor that "could increase fertiliser costs for farmers and slow demand growth" in Europe, alongside stricter environmental regulation.
The paradox is worth stating plainly, because it drives a forecast that looks wrong in the short run and right in the long run. Europe's ammonia capacity exits at the top of the global cost curve. That is bullish for price now, because it removes supply into a disrupted trade route and forces Europe to import at USD 710-730/t. It is bearish for price later, because permanently removing the most expensive running capacity lowers the clearing price once trade normalises. A market clears at the marginal cost of the last plant still operating. Europe is increasingly not that plant.
Which is why we do not model green ammonia as the offset. IFA projects 3.1 Mt N of electrolysis-based capacity commissioned by 2029 - 1.5% of global ammonia capacity - against close to 155 Mt N under consideration beyond 2029 pending final investment decisions. A pipeline fifty times the size of the programme is a useful indicator of intent and a poor indicator of supply.
Market Drivers
Food security policy is the largest single demand variable
China and India together accounted for 40% of global nitrogen use in FY2023, and both are running policy-driven demand. China's nitrogen use fell steadily from FY2014 to FY2021 under efficiency policy, then reversed as food security became a renewed priority - with export restrictions deployed specifically to keep domestic fertiliser affordable. India's urea subsidy at a fixed maximum retail price keeps nitrogen cheap to the grower regardless of the import parity price. Neither behaviour is a market signal; both are budget decisions.
Affordability, not price level, is what moves volume
Global fertiliser use fell to 189 Mt of nutrients in FY2022 and then recovered 17 Mt in two years to 206 Mt in FY2024. The recovery tracked the fall in prices relative to crop prices, not the fall in prices alone. In 2026 the relationship is running the other way: Brazilian fertiliser imports are tracking toward 40-41 Mt against a record 45.5 Mt in 2025, more than 10% lower, while planted area grows. Growers are not planting less. They are applying less.
Soil depletion is deferred demand with a lag
Phosphate's share of total fertiliser use fell from 25% in FY2021 to 23% in FY2022 and has not recovered. That is the signature of a nutrient being skipped under price pressure. Unlike nitrogen, phosphate does not leach away and return; it accumulates as deficiency and shows up as yield loss two or three seasons later. The suppressed tonne is not destroyed, it is borrowed against - which is why we put the acceleration in the second half of the forecast.
Biofuels tie nitrogen to energy policy
Ethanol and biodiesel mandates set corn and oilseed area, and corn area sets nitrogen demand. The transmission is mechanical and mostly policy-driven rather than price-driven, which makes it more forecastable than the crop price itself.
The under-fertilised tropics is the only large volume upside
IFA puts the average global application rate at 152 kg/ha of harvested crop area in FY2024, with nitrogen at 87 kg/ha, P2O5 at 35 kg/ha and K2O at 30 kg/ha. Africa is projected to add just 1.5 Mt of nutrients - but that is +19% on a very small base, and it is the only region where application rates sit far below agronomic response.
Market Restraints
Fiscal ceilings in the two largest subsidised markets
India has allocated INR 1,67,899.5 crore of fertiliser subsidy for 2025-26 - INR 1,18,899.5 crore for urea and INR 49,000 crore for P and K - with the rabi P and K component at INR 37,952 crore. Subsidy paid in the first quarter alone was INR 41,482 crore, 43% above the prior year. A budget line of that size is a demand ceiling as well as a demand support.
Application-rate saturation in China
China is roughly a quarter of global nutrient use. Its nitrogen consumption already demonstrated a seven-year decline when policy pushed efficiency, and IFA expects Chinese N and P2O5 use to slow and potentially plateau toward the end of the outlook period. There is no scenario in which China adds volume at the rate the rest of Asia does.
Efficiency mandates compress the tonne
Enhanced-efficiency products, variable-rate application and the 4R framework all raise yield per kilogram applied. For the grower that is a good outcome. For a market sized in tonnes it is a structural headwind that no demand forecast can offset, and it is why our volume growth is 1.45% rather than the 2-3% that crop production growth alone would imply.
Trade policy as a recurring shock
Chinese phosphate export suspension, Russian and Belarusian potash routing, tariffs on trading partners and a contested shipping lane in the Gulf have between them delivered three separate price dislocations since 2022. Each is individually temporary. The frequency is not.
Market Segmentation
By nutrient the 2025 market divides as the table above shows: nitrogen USD 94.41bn (54.8%), phosphate USD 56.05bn (32.5%), potash USD 21.92bn (12.7%).
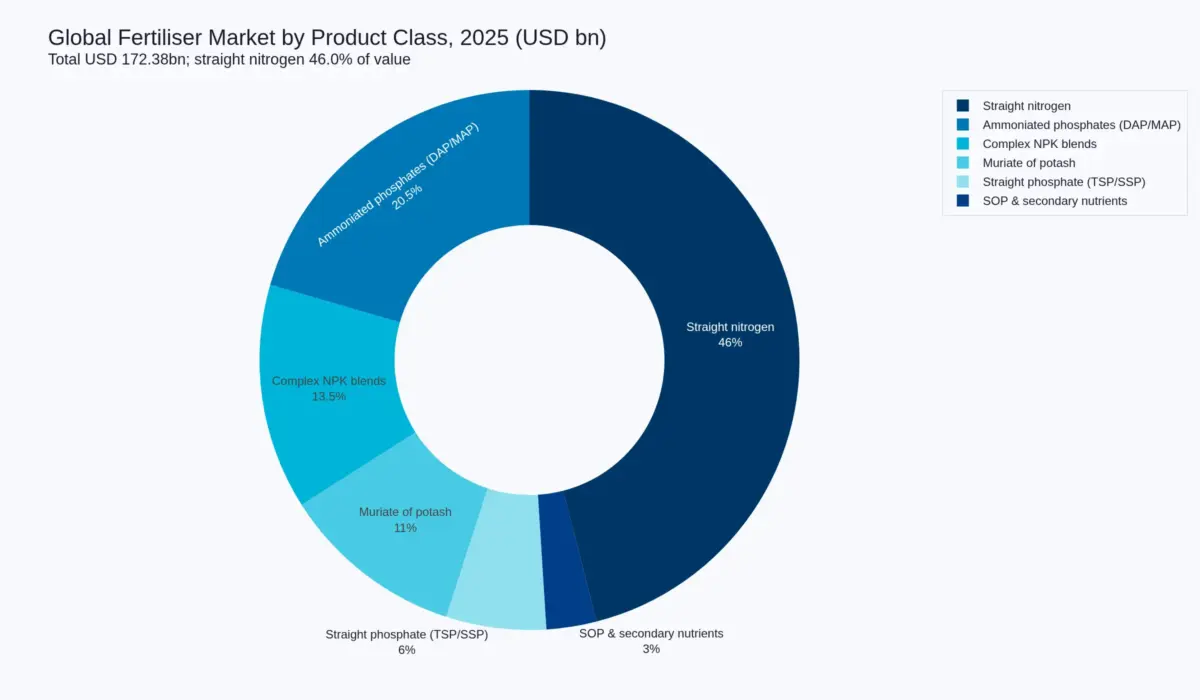
By product class the concentration in straight nitrogen is even starker.
| Product class | 2025 value (USD bn) | Share | Structural note |
|---|---|---|---|
| Straight nitrogen (urea, ammonia, AN, UAN, ammonium sulphate) | 79.29 | 46.0% | Largest, most traded, most gas-exposed |
| Ammoniated phosphates (DAP, MAP) | 35.34 | 20.5% | Doubly exposed - ammonia and sulphur inputs |
| Complex NPK blends | 23.27 | 13.5% | Highest value per nutrient tonne; premium growing |
| Muriate of potash (MOP) | 18.96 | 11.0% | Cheapest nutrient per tonne; supply wave arriving |
| Straight phosphate (TSP, SSP, rock) | 10.34 | 6.0% | Beneficiary of the DAP substitution trade |
| SOP, secondary and micronutrients | 5.17 | 3.0% | Small, high-margin, specialty-crop led |
By crop, cereals and coarse grains take 40.0% of value, oilseeds 20.0%, fruits and vegetables 15.0%, rice 13.0%, sugar crops 5.0%, cotton and other fibre 4.0% and plantation, fodder and turf 3.0%. Rice is the notable underweight: it occupies 13.0% of fertiliser value on a crop that feeds more people than any other, because it is grown on smallholdings where application rates and product premia are both low.
By formulation, granular product is 58.0% of value, prilled 14.0%, liquid and UAN 12.0%, water-soluble and fertigation grades 9.0%, and other 7.0%. The fertigation segment is the fastest-growing and the smallest - a familiar shape in input markets, and one that rewards portfolio positioning rather than volume.
By channel, dealer and distributor networks carry 52.0% of value, direct-to-grower supply 20.0%, cooperatives and farmer-owned institutions 16.0%, and government or institutional tender 12.0%. The last figure is concentrated almost entirely in South Asia, and it is why Indian demand is a policy variable rather than a commercial one.
Regional Analysis
| Region | 2025 value (USD bn) | Share | CAGR 2025-2033 | Driver |
|---|---|---|---|---|
| Asia-Pacific | 73.26 | 42.5% | 3.7% | Subsidy-supported intensity; India's phosphate deficit |
| Latin America | 29.30 | 17.0% | 4.1% | Area expansion; import dependence; highest prices paid |
| North America | 24.13 | 14.0% | 2.2% | Mature, high application rate, efficiency-led |
| Europe | 19.82 | 11.5% | 1.3% | CBAM, nitrate rules, capacity exit |
| Middle East and Africa | 15.51 | 9.0% | 4.9% | Lowest application rates; fastest growth off a small base |
| Eurasia | 10.34 | 6.0% | 3.0% | Export-oriented supply; domestic demand recovering |
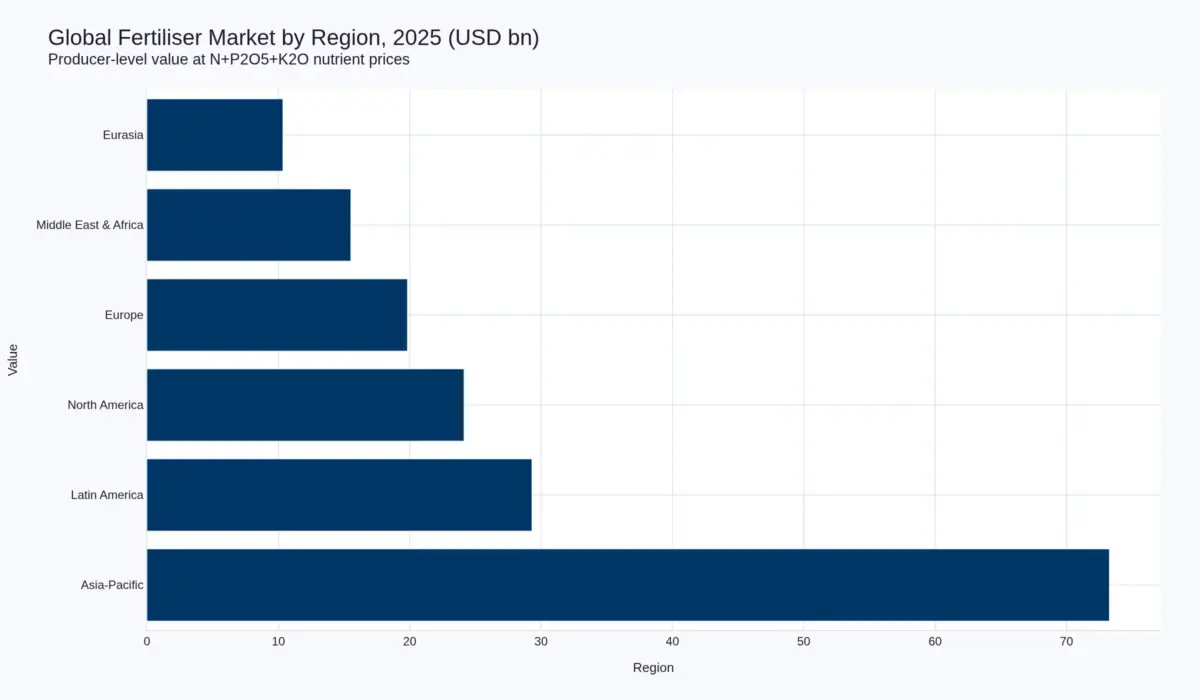
Asia-Pacific is the market. China contributes about 21.0% of global value on roughly a quarter of global nutrient use, and India about 16.0% on 19% of tonnage - the gap between those two ratios is the subsidy: Indian growers pay administratively set prices, so the same tonne of nutrient registers at a lower value. India's structural imbalance is the region's most important fact. Nitrogen and phosphate are heavily supported and potash is not: potash subsidy sits at INR 2.38/kg against INR 43.02/kg for nitrogen, and Indian K2O use never recovered to its FY2020 level. That is a soil-quality problem with a fifteen-year horizon.
Latin America pays the highest prices in the world for fertiliser and is entirely import-dependent, which makes it the marginal buyer in every trade. Brazil imported a record 45.5 Mt in 2025 and is tracking toward 40-41 Mt in 2026, at an average of USD 394.47/t through August - the highest for that window since 2022. Potassium chloride arrivals through September were 10.8 Mt, down 3.6%. Area is still expanding. Application rates are not.
North America is the most efficient market and the most consolidated on the supply side: Nutrien, Mosaic and CF Industries between them dominate domestic nitrogen and potash. Growth is 2.2% - essentially application-rate optimisation plus price - and the region's importance in this forecast is as the cost benchmark, not the volume.
Europe is the only region we forecast below 2%, and the only one where regulation is a direct volume constraint rather than a cost. One-third of ammonia capacity curtailed, permanent shutdowns in France, Germany and the UK during 2024-25, phosphate purchasing at least 30% below normal seasonal levels in late 2026, and CBAM in its definitive period. The region is converting from a producer with a market to a market with a policy.
Middle East and Africa grows fastest at 4.9% from the smallest base. Africa adds 1.5 Mt of nutrients over the IFA medium term, +19%. The region also holds the marginal supply: the Hormuz disruption removed Gulf ammonia and urea exports and reset the world price twice in eighteen months.
Eurasia is where supply and sanctions meet. Russian and Belarusian potash has been rerouted rather than removed - MOP production rose 10% to a record 76.6 Mt in 2024, driven by Russia and Belarus finding new trade routes - and EECA demand is forecast to grow 27% over the medium term.
Competitive Landscape
| Company | FY2025 scale | Profitability | What moved |
|---|---|---|---|
| Nutrien | Record upstream fertiliser sales volumes; ~USD 900m gross divestiture proceeds since Q4 2024 | Adjusted EBITDA USD 6.05bn: potash USD 2.25bn, nitrogen USD 2.15bn, retail USD 1.74bn | Net earnings USD 2.30bn; 2% of shares repurchased for USD 551m; 49% of potash ore tonnes mined with automation |
| Yara International | Revenue and other income USD 15,715m (2024: 13,934m) | EBITDA excl. special items USD 2,803m (2024: 2,051m); ROIC 10.7% | Net income USD 1,372m against USD 15m; more than USD 200m of fixed cost removed; record production |
| The Mosaic Company | Net sales USD 12.1bn (2024: 11.1bn); potash production 8.8 Mt, highest MOP output since 2019 | Adjusted EBITDA USD 2,421m: potash USD 1,183m (+25%), phosphate USD 917m (-23%), Fertilizantes USD 567m (+65%) | Net income USD 541m; Q4 net loss USD 519m on USD 422m of notable items |
| BHP (Jansen) | CAD 21.8bn (USD 15.3bn) project, 87% complete at 20 October 2026 | Pre-production | First production mid-2027; ~8.5 Mtpa at full ramp; potential 16-17 Mt |
Three things stand out from those numbers and none of them is the one the market talks about.
First, 2025 was a good year for the producers and a poor one for the phosphate position. Nutrien's potash EBITDA rose to USD 2.25bn on record volumes and higher prices. Yara nearly doubled EBITDA and turned a USD 15m net income into USD 1,372m. Mosaic's potash EBITDA rose 25%. But Mosaic's phosphate EBITDA fell 23% to USD 917m even as DAP prices stayed historically high, because sulphur and ammonia costs rose faster than the product price. In a market where the product is priced off policy and the inputs are priced off energy, the integrated producer does not automatically win.
Second, the potash incumbents are adding automation, not tonnes. Nutrien mined 49% of its potash ore tonnes using automation in 2025. That is the correct response to a supply wave you can see coming: defend the cost position, because price is going to be set by the newest and cheapest mine in the world from 2027 onward.
Third, the industry is being rebuilt around co-products. Mosaic Biosciences doubled net sales to USD 68m and is targeting a further doubling in 2026 - trivially small against USD 12.1bn of net sales, and structurally significant, because it is the only line in that business that is not a price taker on a mined commodity.
Concentration differs sharply by nutrient. Potash is the most concentrated: a handful of producers in Canada, Russia, Belarus and Laos account for the overwhelming majority of traded volume, and Canpotex and the Belarusian and Russian channels set the reference. Phosphate is concentrated at the rock and acid stage around Morocco's OCP, China, the United States and Saudi Arabia, and fragmented at the blending stage. Nitrogen is the most fragmented and the most contestable, because a new ammonia plant can be built anywhere with cheap gas and no resource endowment.
The strategic implication is that market share in this industry is a function of position on the cost curve, not of brand, distribution or technology. Jansen at the low end of the curve, with USD 15.3bn of capital already committed, is a statement that BHP expects the marginal producer in 2033 to be someone else.
Strategic Outlook
Four positions follow from the analysis above.
Price to the marginal cost curve, not to the cycle. The 2026 spike is the second-largest pricing event of the decade and it will be gone by 2027. A supplier who built capacity on the 2026 spread has built for a quarter, not a decade. The curve that matters is gas cost at the ammonia plant, sulphur and ammonia at the phosphate plant, and mine depth at the potash mine.
Own the co-product. Phosphate now has two demand curves. Fertiliser P2O5 is 47.5 Mt of nutrients and grows slowly. Purified phosphoric acid for lithium iron phosphate cathodes grows around 5% a year and IFA explicitly cites it as a factor that stabilises the phosphate balance by the end of the medium term. A phosphate producer without a PPA route is a fertiliser producer. One with it is an energy-transition supplier.
Treat potash volume as the only certainty. 2-3% demand growth with a dated supply wave is the most forecastable combination in the sector, and it is forecastable in the direction that hurts: volume up, price flat to down. Value growth of roughly 2.5% is the right expectation, not the 5% that a demand-only model produces.
Build for CBAM default values, not for exemption. The definitive period began 1 January 2026 and the calculation methodology was published 14 August 2026. Importers without verified embedded-emissions data will pay on defaults for years. That is a data problem before it is a carbon problem, and it is the cheapest competitive advantage available in the European market.
Watch List
- India's 2.5 Mt urea tender. Expectations point to an L1 around USD 370-375/t CFR, after a previous programme that secured only 410,000 t. If it clears at the low end it sets the nitrogen floor for 2027 below the 2025 average.
- Chinese DAP and MAP resumption. The NDRC suspension ran until August 2026 and only TSP and SSP were inspection-eligible as of September. A third of this market's value sits behind that decision.
- Jansen Stage 1 commissioning, mid-2027. First tonnes into a balance IFA already scores at a 14% surplus.
- European gas. TTF above EUR 100/MWh with one-third of ammonia capacity curtailed. A mild winter reverses the price. A cold one makes the closures permanent.
- Brazil's import shortfall. 40-41 Mt against a 45.5 Mt record. Whether that is deferred demand or destroyed demand is the single biggest swing in the Latin American forecast.
- Sulphur. Zhenjiang granular assessed at 7,500 yuan/t on 27 August 2026, down 1,250 week-on-week. Phosphate costs follow sulphur with a one-to-two-quarter lag.
- CBAM default values. Whether verified actuals displace defaults quickly determines whether the European cost premium is 3% or 12%.
- The affordability ratio. Fertiliser price against crop price, not fertiliser price alone. It called the FY2022 collapse and the FY2024 recovery, and it is currently deteriorating.
Conclusion
This is a USD 172 billion market growing 3.33% a year, and almost all of the interesting content is in the 44% of that growth which is tonnage versus the 56% which is price. The tonnage is unusually predictable: 209.0 Mt to 234.5 Mt, driven by population, diet and area, capped by efficiency. The price is not predictable at all, because it is set by a gas market in one nutrient, an export licence in the second and a mine schedule in the third.
The defensible position for the decade is that fertiliser value grows slowly, potash value grows slowest of the three, phosphate carries the most policy risk and the best co-product optionality, and Europe's nitrogen industry is being priced out of existence by a mechanism it legislated itself. None of that requires a view on the 2026 spike, which is exactly why we would not build one.
Further reading: why this report's revenue and this report's tonnage point at different nutrients — and what that does to the two-speed decade — is worked through in Phosphate Is 22.7 Per Cent of the Tonnage and 32.5 Per Cent of the Value. Potash Is the Other Way Round.
Further reading: Europe Is Exiting the Top of the Nitrogen Cost Curve — the 37.8% spread between Northwest European and Chinese export ammonia in the same week, why removing the top of the cost curve is bullish now and bearish later, and why the 3.1 Mt N of green ammonia commissioned by 2029 is 2% of a 155 Mt N pipeline.
Table of Contents
- Executive Summary
- Research Methodology and Scope
- Market Overview and Definitions
- 3.1 Why Three Nutrients Are Not One Market
- 3.2 The Nutrient-Tonne Boundary
- 3.3 Segmentation Framework
- 3.4 Forecasting Assumptions (2026–2033)
- Market Dynamics
- 4.1 Market Drivers
- 4.1.1 Food Security Policy Is the Largest Single Demand Variable
- 4.1.2 Affordability, Not Price Level, Moves Volume
- 4.1.3 Soil Depletion Is Deferred Demand With a Lag
- 4.1.4 Biofuels Tie Nitrogen to Energy Policy
- 4.1.5 The Under-Fertilised Tropics
- 4.2 Market Restraints
- 4.2.1 Fiscal Ceilings in the Two Largest Subsidised Markets
- 4.2.2 Application-Rate Saturation in China
- 4.2.3 Efficiency Mandates Compress the Tonne
- 4.2.4 Trade Policy as a Recurring Shock
- 4.3 Market Opportunities
- 4.1 Market Drivers
- 5. Global Fertiliser Market Size and Forecast (USD Billion), 2026–2033
- 5.1 Market Revenue Analysis
- 5.2 CAGR Analysis and the Two-Speed Decade
- 5.3 Demand-Supply Balance by Nutrient
- 5.4 Pricing Analysis
- 5.5 Investment Trends
- 5.6 Future Market Outlook
- 6. Three Structural Shifts Defining 2026–2033
- 6.1 Shift One: The Three Nutrients Have Decoupled
- 6.1.1 Value Is More Concentrated in Phosphate Than Tonnage Suggests
- 6.1.2 Three Price-Setting Mechanisms
- 6.1.3 What It Means for a Single Blended CAGR
- 6.2 Shift Two: Potash’s Supply Wave Has a Date on It
- 6.2.1 Jansen Is Not a Forecast
- 6.2.2 Fifteen Million Tonnes Between 2027 and 2030
- 6.2.3 Why Volume Growth Cannot Absorb It
- 6.3 Shift Three: Europe Exits the Top of the Nitrogen Cost Curve
- 6.3.1 One-Third of Capacity Curtailed
- 6.3.2 CBAM From 1 January 2026
- 6.3.3 The Paradox: Bearish Long Term, Bullish Now
- 6.1 Shift One: The Three Nutrients Have Decoupled
- 7. Market Segmentation Analysis (USD Billion), 2026–2033
- 7.1 By Nutrient
- 7.1.1 Nitrogen
- 7.1.2 Phosphate
- 7.1.3 Potash
- 7.2 By Product Class
- 7.2.1 Straight Nitrogen
- 7.2.2 Ammoniated Phosphates
- 7.2.3 Complex NPK Blends
- 7.2.4 Straight Phosphate
- 7.2.5 MOP, SOP and Secondary Nutrients
- 7.3 By Crop Type
- 7.3.1 Cereals and Coarse Grains
- 7.3.2 Oilseeds
- 7.3.3 Rice
- 7.3.4 Fruits and Vegetables
- 7.3.5 Sugar, Cotton and Other
- 7.4 By Formulation
- 7.5 By Distribution Channel
- 7.1 By Nutrient
- 8. Regional Market Analysis
- 8.1 Asia-Pacific (Largest Market)
- 8.2 Latin America (Highest Prices Paid)
- 8.3 North America
- 8.4 Europe (Slowest-Growing Market)
- 8.5 Middle East and Africa (Fastest-Growing Market)
- 8.6 Eurasia
- 9. Competitive Landscape
- 9.1 Market Share Analysis
- 9.2 Competitive Benchmarking
- 9.3 Strategic Developments
- 9.4 Nutrien
- 9.5 Yara International
- 9.6 The Mosaic Company
- 9.7 OCP Group and the Moroccan Phosphate Position
- 9.8 Russian and Belarusian Potash
- 9.9 The Chinese and Indian Tiers
- 9.10 Competitive Outlook to 2033
- 10. Company Profiles
- 10.1 Nutrien
- 10.2 Yara International
- 10.3 The Mosaic Company
- 10.4 CF Industries
- 10.5 OCP Group
- 10.6 ICL Group
- 10.7 K+S
- 10.8 Uralkali and Belaruskali
- 10.9 The Chinese and Indian Producer Tiers
- 10.10 The Trading and Distribution Layer
- 11. Strategic Intelligence and Pheonix AI Insights
- 11.1 Nutrient Demand Model (N, P2O5, K2O)
- 11.2 Affordability Ratio Monitor
- 11.3 Export-Policy Tracker (China, Russia, Belarus)
- 11.4 Capacity Commissioning Tracker
- 11.5 Automated Porter’s Five Forces Analysis
- 12. Future Outlook and Strategic Recommendations
- 12.1 Price to the Marginal Cost Curve, Not the Cycle
- 12.2 Own the Co-Product
- 12.3 Treat Potash Volume as the Only Certainty
- 12.4 Build for CBAM Default Values
- 12.5 Long-Term Outlook (2033+)
- 13. Appendix
- 14. About Pheonix Market Research and Disclaimer
Competitive Landscape
Market share in this industry is a cost position, not a brand
Fertiliser is the least brand-sensitive large input market in agriculture. No grower chooses a urea granule on reputation. Share therefore follows position on the cost curve, access to a resource or a gas contract, and control of the logistics that connect the two. Everything else – portfolio breadth, marketing, agronomy services – is a margin enhancement on top of that base, not a determinant of it.
Structure differs sharply by nutrient
Potash is the most concentrated. A small number of producers in Canada, Russia, Belarus and Laos account for the overwhelming majority of traded volume, with Canpotex handling Canadian offshore sales and Russian and Belarusian material moving through rerouted channels since 2022. IFA recorded global MOP production of 76.6 Mt in 2024, a record and up 10%, driven principally by Russia and Belarus finding new trade routes. Concentration here is high and rising, because the next tranche of capacity is large-scale and capital-intensive: Jansen, expansions at existing Canadian and Russian mines, and the Lao projects backed substantially by Chinese overseas investment.
Phosphate is concentrated at the acid stage and fragmented at the blend stage. Rock and phosphoric acid sit with a handful of holders – Morocco’s OCP, China, the United States, Saudi Arabia and Russia – while the products that reach a field are made by hundreds of blenders. IFA put 2024 phosphoric acid output at a record 89.6 Mt, up 5%, with China and Morocco the primary contributors at +11% and +4%. The concentration that matters commercially is not in the blending but in the acid, because acid is the constraint and the export licence sits at the border.
Nitrogen is the most fragmented and the most contestable. A new ammonia plant can be built anywhere with cheap gas and a port, and no resource endowment is required. That is why nitrogen has no OPEC, why its price is genuinely competitive, and why the marginal producer changes with the gas market rather than with an ownership decision.
The three business models
The companies in this market are running one of three models, and reading their results without knowing which is a common source of error.
The resource model monetises a finite, low-cost orebody. Nutrien’s potash business, OCP’s rock and acid position and Mosaic’s phosphate rock are the clearest examples. Margins are a function of position on the curve and volume, and the strategic imperative is to defend cost position through automation and debottlenecking rather than to chase price. Nutrien mined 49% of its potash ore tonnes using automation in 2025, which is exactly the right response to a supply wave you can see arriving.
The energy-conversion model monetises a gas contract. Yara is the purest expression of it, with USD 15,715m of revenue and other income in 2025 against USD 13,934m in 2024 and EBITDA excluding special items of USD 2,803m against USD 2,051m. The model is extremely profitable when gas is cheap relative to the nitrogen price and extremely fragile when the reverse applies, and the response – which Yara executed – is to take fixed cost out and to place capacity in the lowest-cost gas geographies rather than to defend tonne volume in high-cost ones.
The network model monetises logistics and agronomy. Nutrien’s retail business generated USD 1.74bn of adjusted EBITDA in 2025 on lower operating expenses and stronger proprietary product margins. It is the most stable of the three earnings streams and the least scalable internationally, because it depends on a local dealer footprint.
What the FY2025 results actually say
2025 was a recovery year for the producers and a warning year for the integrated phosphate position. Nutrien generated net earnings of USD 2.30bn and adjusted EBITDA of USD 6.05bn, with potash at USD 2.25bn, nitrogen at USD 2.15bn and retail at USD 1.74bn, on record upstream fertiliser sales volumes. It also raised roughly USD 900m of gross divestiture proceeds from the fourth quarter of 2024, reduced adjusted net debt and increased total cash returns to shareholders by 30% while repurchasing about 2% of its shares for USD 551m. That is a company raising cash returns in a year when it expects the next supply wave to be someone else’s problem.
Yara’s swing was the largest in the group: net income of USD 1,372m against USD 15m the prior year, operating income of USD 1,571m, ROIC of 10.7%, more than USD 200m of fixed cost removed and record-high production. The lesson is not that Yara is a better business than it looked in 2024. It is that a nitrogen producer’s earnings are a leveraged function of the gas-to-urea spread, and that spread moved violently in its favour.
Mosaic is the case study in why integration cuts both ways. Potash adjusted EBITDA rose to USD 1,183m from USD 944m and potash production reached 8.8 Mt with MOP output at its highest since 2019. The Fertilizantes business, which sells into Brazil, lifted adjusted EBITDA to USD 567m, up 65%. But phosphate adjusted EBITDA fell to USD 917m from USD 1,191m on higher raw material costs and deferred demand, and the fourth quarter produced a net loss of USD 519m including USD 422m of pre-tax notable items. A company with a rock position and a Brazilian distribution network was hit by the two things it did not control: sulphur and the timing of the grower’s purchase.
Jansen is the strategic event, not the BHP entry
BHP is not a fertiliser company and its arrival matters for one reason: it is committing CAD 21.8bn (USD 15.3bn) to a wholly-owned Saskatchewan mine with first production expected in mid-2027, ramp to roughly 8.5 Mtpa when Stage 2 starts in mid-2031, and full capacity in BHP’s 2033-34 year, with a stated ambition to sit at the low end of the cost curve and a resource capable of 16-17 Mt a year.
The strategic reading is unambiguous. BHP has priced in a world where the marginal potash producer in 2033 is higher-cost than Jansen, and it is willing to spend USD 15.3bn to be the one that clears the market. Incumbent responses – automation, debottlenecking, divestment of non-core assets, cash returns – are consistent with the same view. No potash producer in this market is behaving as though price is theirs to set after 2027.
Who is not in the top ten, and why it matters
The companies that dominate headline share statistics are not the ones that determine volume in Asia. China’s domestic nitrogen and phosphate industry, built largely on coal feedstock and expanded again during the 2021-22 shortage, is the largest single production block in the world and is managed as a domestic supply system rather than as a competitive industry. India’s producer base – cooperatives and state-linked companies alongside Coromandel and Chambal – exists inside a subsidy architecture that sets its margin. Together these two systems account for a large share of global tonnage and almost none of the global price formation, which is why a share table built on listed companies understates concentration in potash and overstates it everywhere else.
The competitive outlook to 2033 is therefore: high and rising concentration in potash with a lower clearing price, persistent fragmentation in nitrogen with a price set by gas and by Europe’s shrinking presence, and phosphate dominance retained by whoever holds rock and acid and can route a share of it into purified acid rather than into DAP.
Value Chain
Three chains, three entry points, no shared cost driver
Fertiliser is not one value chain. It is three, and the differences between them explain almost everything about how profit moves in this industry.
The nitrogen chain: gas is the product, ammonia is the hinge
Roughly four-fifths of the cost of a nitrogen fertiliser is made before the fertiliser exists. Natural gas is reformed into hydrogen, hydrogen and atmospheric nitrogen are combined into ammonia over a catalyst, and ammonia is then either sold as ammonia or converted into a solid. The conversion choice determines the product mix: ammonia plus carbon dioxide gives urea; ammonia plus nitric acid gives ammonium nitrate; ammonia plus water and urea gives UAN. Every one of those routes starts with the same molecule.
This is why the ammonia price is the reference price for the entire nitrogen complex and why the November 2026 settlement between Yara and Mosaic at USD 645/t CFR Tampa, up USD 95 in a single month, matters more to the fertiliser market than any other single quotation. It is also why Northwest European ammonia at USD 710-730/t CFR and Chinese export ammonia at USD 510-535/t FOB can coexist in the same week: the spread is gas cost plus freight plus the cost of a sanction, and none of those three components is converging.
The consequence for economics is that nitrogen producers are price takers on their largest input and price setters only to the extent that they sit at the bottom of the cost curve. A US Gulf plant paying USD 3/MMBtu and a German plant paying the equivalent of USD 30/MMBtu are not competitors in the same business. When the German plant runs, it sets the clearing price and the American plant earns a margin. When the German plant shuts – as roughly one-third of European capacity has – the price falls to the next-highest surviving cost, and the American plant’s margin narrows. That is the mechanism behind the paradox explored in section 6.3: Europe’s exit is temporarily bullish and structurally bearish, because it removes the top of the curve rather than the bottom.
The phosphate chain: three inputs, one product, and a new co-product
Phosphate rock is mined, beneficiated and digested with sulphuric acid to make phosphoric acid, which is then ammoniated to make DAP or MAP, or granulated with rock to make TSP and SSP. So a tonne of DAP carries three separate input exposures: rock, sulphur and ammonia. TSP carries two, because it needs no ammonia at all.
That asymmetry became decisive in 2026. With Gulf sulphur shipments disrupted through the Strait of Hormuz and Chinese sulphur assessed at 7,500 yuan/t on 27 August 2026, DAP and MAP economics deteriorated even as DAP prices stayed historically high, and buyers began substituting TSP – which is precisely the arbitrage the chemistry allows. Mosaic’s phosphate segment illustrates the outcome: adjusted EBITDA of USD 917m in 2025, down 23% from USD 1,191m, in a year when phosphate prices were strong. When your product is priced by policy and your inputs are priced by energy, being long the chain does not protect you.
The new element in this chain is that phosphoric acid now has a second customer. Purified phosphoric acid for lithium iron phosphate battery cathodes is a small volume and a fast-growing one, and IFA explicitly assumes 5% annual growth in PPA demand when it models the phosphate balance stabilising by the end of the medium term. That gives phosphate a demand floor that did not exist a decade ago and that is entirely independent of cropping.
The potash chain: mining, and nothing else
Potash is the only one of the three where the value chain is extraction and logistics. Ore is mined, crushed, separated and compacted into standard or granular MOP. There is no chemical transformation to speak of, no gas exposure and no sulphur exposure. Roughly three-quarters of the cash cost of a tonne of MOP is mine-related – depth, energy, labour, maintenance – and a further meaningful share is freight, which is why Russian and Belarusian material carries a delivered-cost penalty even when its mine cost is low.
This is the structural reason potash pricing behaves differently from the other two nutrients. Nitrogen’s price is set by an input market that reprices daily. Phosphate’s price is set by an input triplet and an export licence. Potash’s price is set by capacity decisions, which are lumpy, dated and visible years in advance. When BHP says Jansen Stage 1 is 87% complete and will produce first tonnes in mid-2027, that is not a forecast about potash price – it is a scheduled change to the supply curve.
Where the margin sits
Our cost build puts the split roughly as follows. In nitrogen, feedstock accounts for 55-70% of the cash cost of ammonia depending on the gas contract, with the balance in energy, catalysts and maintenance; conversion to urea or AN adds a further step whose margin is usually thin and cyclical. In phosphate, rock, sulphur and ammonia together account for 70-80% of the cash cost of DAP, which leaves very little room for a mining margin when two of the three inputs are spiking. In potash, mine cost is 70-75% and freight a further 10-20% delivered, which is why the same tonne of MOP can be profitable at USD 250/t CFR Brazil for a low-cost Canadian mine and loss-making for a deep, high-cost European one.
These are estimates from our own cost model, not disclosed figures, and should be read as orders of magnitude rather than as plant-level economics.
The distribution layer is where the working capital lives
Between the plant and the field sits a layer that is invisible in market-size statistics and decisive in cash terms. In Brazil, blenders buy granular product, formulate NPK grades to a retailer’s specification, extend credit to growers across a planting season and collect after harvest. In the United States, retail outlets owned by Nutrien and others perform the same function with a shorter credit cycle. That layer carries price risk on inventory and credit risk on the grower, and in a year when Brazilian imports fall more than 10% while prices rise to their highest since 2022, it carries both at once.
The value-chain conclusion for anyone deploying capital in this sector is that integration is a hedge, and the hedge only works if it covers the input that actually moves. Mosaic is integrated in rock and acid but buys ammonia and sulphur, so it was hedged in 2024 and exposed in 2026. Yara is integrated in ammonia and buys everything else, so it captured the 2025 nitrogen recovery and had to manage the 2026 gas spike. Nutrien is integrated in potash and nitrogen and owns the retail channel, which is the broadest hedge available and still could not fully offset weak US demand in the fourth quarter of 2025.
Investment Activity
The capital is being committed faster than the demand is arriving
The cleanest way to understand this market’s next eight years is to read the capacity numbers against the demand numbers. IFA’s medium-term outlook has nutrient demand growing 1-2% a year to 224 Mt by FY2029, an increase of 18 Mt or 9% on FY2024. Against that, announced capacity growth over the same window is larger in every nutrient.
Nitrogen capacity rises from 195 Mt N in 2024 to 216 Mt N by 2029, up 10.5%, and ammonia capability from 166.6 Mt N to 184.9 Mt N, up 9% at 1.7% a year – slightly faster than demand, which loosens the nitrogen balance. Phosphoric acid capacity grows 14% to 71.7 Mt P2O5, with the largest additions in 2027 and 2028. Potash capability rises 11% between 2024 and 2029, led by Canada and EECA, and the theoretically available surplus is projected to hold at 14% of supply capability in 2029 against 13% in 2024.
There is no reading of those four sentences that supports a 5% value CAGR. Capacity growing faster than demand in all three nutrients, with potash at a structural surplus and phosphate additions landing at the end of the decade, produces exactly the profile we forecast: slow to 2029, faster thereafter as the surplus is absorbed and as phosphate tightens.
Where the money is actually going
Nitrogen investment follows gas. IFA identifies the US, Nigeria, Qatar, UAE and Russia as the centres of nitrogen capacity investment, with the US expanding ammonia capacity 22% primarily through blue ammonia with carbon capture. The same forecast records a wave of permanent capacity shutdowns in Western Europe during 2024 and 2025, notably in France, Germany and the UK, with other plants experiencing intermittent downtime. Capital is not leaving nitrogen. It is relocating.
Phosphate investment follows rock and acid. Capacity growth is concentrated in Morocco, Saudi Arabia, China and Canada, and is being developed almost entirely by existing producers with existing ore bodies. This is the most important structural fact in the phosphate chain: IFA notes a lack of any sizeable project outside the existing suppliers, which is why the phosphate balance tightens once purified-acid demand is included. The notable exception is Canada, where a major purified phosphoric acid project is scheduled for 2028 – the first significant non-fertiliser-grade acid investment outside China.
Potash investment follows ore quality and scale. Canada, Russia and Laos are the primary contributors, with smaller expansions in Spain, the Republic of Congo and Thailand, several of them supported by Chinese overseas investment. Jansen alone – CAD 21.8bn committed, 87% complete on Stage 1 at 20 October 2026, first production mid-2027 – is larger than any other single project in the nutrient complex. BHP is explicit that it expects to operate at the low end of the cost curve and that the resource could support 16-17 Mt a year.
Low-carbon investment is mostly not being built. The 3.1 Mt N of green ammonia expected by 2029 against roughly 155 Mt N under consideration is the sector’s defining capital-allocation statistic. It says that the technology is understood, the offtake is plausible and the final investment decision keeps not being taken, because electrolysis hydrogen cannot yet beat USD 3/MMBtu gas on cost. The projects that have moved are blue, and they cluster where the fiscal support is.
Corporate capital allocation is defensive, and deliberately so
Nutrien’s 2025 is the clearest signal. The company generated USD 6.05bn of adjusted EBITDA, took about USD 900m of gross divestiture proceeds from the fourth quarter of 2024, reduced adjusted net debt, increased total cash returns to shareholders by 30% and repurchased roughly 2% of its shares for USD 551m – while spending on automation that lifted automated mining to 49% of potash ore tonnes. That is a management team investing in cost position and returning cash, not building new capacity into a wave it can date.
Yara did the capital-discipline version: more than USD 200m of fixed cost removed, capex programme completed, ROIC to 10.7%, and record production from the existing asset base. Mosaic simplified its portfolio, divested non-core assets and put its incremental investment into a biologicals line that doubled to USD 68m in net sales rather than into more phosphate tonnes while sulphur prices were moving against it.
None of these is a growth-capital story. All three are the behaviour of companies that believe the next dollar of return comes from being the low-cost survivor.
What the investment cycle means for valuation
Fertiliser assets are valued on mid-cycle earnings, and the mid-cycle assumption has moved twice in four years: down after the 2022 spike collapsed, up after the 2024-25 recovery, and up again in the second quarter of 2026 on a shipping-lane disruption that has already reversed. Any transaction priced in the second quarter of 2026 was priced on a number the World Bank’s own index shows was 22% above the level it returned to within one quarter.
The durable valuation anchors in this sector are cost-curve position, reserve life and freight distance. Those are the three variables that do not move with the price index. On that basis potash assets with long reserve life and low mine cost are worth more than the current price implies, phosphate assets with rock and acid are worth more than the current price implies if they have a purified-acid route, and European nitrogen assets with high gas exposure are worth very little as production assets and a great deal as import terminals and blending platforms.
The investment conclusion for 2026-2033 is uncomfortable but simple. This is a market where the value of the installed asset base will rise roughly 30% in dollars over eight years while the supply curve shifts down and to the right in every nutrient. Returns will be made by the low-cost producer and the co-product owner. They will not be made by the operator who added capacity because the 2026 price told him to.
Technology & Innovation
In fertiliser, technology subtracts tonnes and adds value. The reverse of seeds.
The single most important thing to understand about innovation in this market is that it works against the volume series. A better nitrogen product does not sell more nitrogen; it delivers the same yield from fewer kilograms. Every genuine advance in this sector – enhanced efficiency, variable-rate application, precision placement, improved soil testing, better genetics on the crop side – reduces the tonnes required per unit of output.
That is the exact inverse of the crop seed markets we cover, where technology captures more value from a fixed hectare. Here the hectare grows, the application rate is being optimised downward, and the only thing that keeps value rising is that the surviving kilogram is sold at a higher price in a more sophisticated product. Our 1.45% volume growth against 1.85% value-per-tonne growth is the arithmetic expression of that trade.
Decarbonisation is real, small, and mostly not electrolysis
The technology story that attracts the most capital is low-carbon ammonia, and the numbers deserve to be stated precisely because they are so often blurred. IFA projects 3.1 Mt N of electrolysis-based green ammonia capacity commissioned by 2029, representing 1.5% of global ammonia capacity. In the same forecast, close to 155 Mt N is tracked as under consideration for development beyond 2029, pending final investment decisions.
A pipeline roughly fifty times the size of the programme is a measure of intent, not of supply. The binding constraint is not demand – maritime fuel, power generation and hydrogen carriers are all credible future outlets – but the cost of hydrogen from electrolysis against USD 3/MMBtu gas, and IFA’s demand projections explicitly do not yet include emerging low-carbon ammonia uses on the grounds that they remain in their infancy.
The capacity that is actually being built is blue, not green. IFA forecasts the United States expanding ammonia capacity by 22% primarily through blue ammonia projects using carbon capture, utilisation and storage, with major UAE and Qatar developments following the same route. Global ammonia capacity grows from 195 Mt N in 2024 to 216 Mt N by 2029, up 10.5%. This is the commercially rational path: CCUS on a reforming plant captures most of the emissions at a fraction of the cost of electrolysis, and it produces a tonne that can be certified for CBAM purposes, which is what the European customer actually needs.
Enhanced efficiency is where the margin is
The products that change the economics fastest are unglamorous: urease inhibitors, nitrification inhibitors, polymer-coated and sulphur-coated urea, and stabilised nitrogen solutions. They sell at a premium of a meaningful fraction of the product price, they require no new synthesis route, and their value proposition is directly measurable in the field – less volatilisation loss, fewer applications, same yield. Regulatory pressure on nitrate leaching and ammonia emissions is the most effective distribution channel for them in Europe, and CBAM is a second: a lower-emission product carries a lower embedded-emissions burden down the chain.
The same logic drives water-soluble and fertigation grades, which we size at 9.0% of market value – the smallest formulation segment and the fastest-growing. Fertigation applies nutrient in the irrigation stream, which is materially more efficient per kilogram than broadcasting, and it is adopted fastest in high-value horticulture where the crop pays for precision. It is a premium-product business attached to an irrigation capital decision, which makes it sticky.
Biologicals: small line, large signal
Mosaic’s biologicals business doubled net sales to USD 68m in 2025 and is targeted to double again in 2026. Against USD 12.1bn of group net sales that is a rounding error. It is also the only line in a commodity fertiliser company that is not a price taker on a mined or reformed product, which is why every major producer is building one. Biologicals do not replace nutrient; they improve the efficiency of nutrient uptake, which means they are sold alongside the tonne rather than instead of it – the commercially convenient position for an incumbent.
Precision application compresses the application rate
Variable-rate application, section control on spreaders, soil scanning and satellite-derived prescription mapping all do the same thing: they move nutrient from the parts of a field that do not need it to the parts that do. The agronomic gain is real and typically quoted in the high single digits to low teens as a percentage of applied nutrient. The market consequence is a permanent downward pressure on kilograms per hectare in every market where the capital is available.
This is why the mature markets grow slowest. North America applies fertiliser at high rates with high precision; the next kilogram saved is worth more than the next kilogram added. The under-fertilised tropics is the opposite: there, the first kilogram is the one with the yield response, and no technology is required to justify it beyond access and affordability.
Phosphate recovery and the second demand curve
Phosphorus is the nutrient with no atmospheric reservoir and a finite, geographically concentrated rock reserve, which makes recovery technologies strategically interesting even when they are uneconomic today. Struvite precipitation from wastewater, manure processing and recovered-nutrient products all have a regulatory pathway into the European single market under the fertilising products framework, and all remain small relative to mined supply.
The more consequential technology shift is on the demand side. Purified phosphoric acid for lithium iron phosphate cathodes gives phosphate a customer that did not exist fifteen years ago, grows at roughly 5% a year on IFA’s assumption, and is largely indifferent to the price a farmer pays. IFA notes that new phosphoric acid capacity in China is now almost entirely purified-acid and conventional merchant-grade acid rather than fertiliser-grade, and that the largest non-Chinese PPA project is scheduled in Canada for 2028. When the incremental acid molecule can go into a battery instead of a bag, the fertiliser market is no longer the only bidder for it.
What technology will not fix
No technology in commercial deployment changes the three structural facts of this market. It does not make European ammonia competitive with US Gulf ammonia at current gas prices. It does not shorten the distance between a Saskatchewan mine and a Brazilian port. And it does not create a substitute for potassium, because there is none. Innovation in fertiliser improves the efficiency of use and the carbon content of production; it does not change the map of who holds the resource.
Market Risk
The risks that matter are dated, not general
Commodity market risk sections are usually a list of things that could go wrong. This one is a list of things that will happen, with a date and a signpost for each, because in fertiliser the uncertainty is almost never whether – it is when and how much of it is already in the price.
Risk one: the price cycle is larger than the trend, and it has already turned
The World Bank fertiliser price index averaged 138.7 in 2025, reached 188.2 in the second quarter of 2026 and fell to 147.6 in the third. Urea went from USD 422.7/t annual average in 2025 to USD 693.5/t in the second quarter of 2026 and USD 399.2/t in the third. Anyone whose plan, budget or valuation was set between March and June 2026 is working from a number that no longer exists.
The exposure is asymmetric for producers and consumers. A producer who contracted forward at the peak has locked in a margin that will look excellent; one who added capacity on the strength of it has committed capital against a price that has already halved. A grower who bought at the peak has a cost problem that will persist through the next harvest. Roughly two-thirds of this market’s value growth over the decade comes from price and mix, which means the single largest risk to the forecast is not volume at all – it is the assumption that price normalises upward rather than downward.
Risk two: Chinese phosphate policy is a third of the value line
Phosphate is 32.5% of market value on 22.7% of tonnage, and the incremental tonne of DAP or MAP in the world is largely subject to an administrative decision in Beijing. The December 2025 NDRC suspension ran to August 2026; as of September only TSP and SSP were understood to be inspection-eligible for export and no resumption date for DAP and MAP had been given.
The signpost is Chinese export volumes and the sulphur price. When Zhenjiang granular sulphur was assessed at 7,500 yuan/t on 27 August 2026, down 1,250 week on week, traders were explicit that a return toward pre-conflict levels would be needed before phosphate exports made sense again. A full resumption would lower Indian and Brazilian DAP prices materially and take several percentage points off phosphate value in 2027. A permanent restriction would do the opposite. We model a partial, delayed resumption; both tails are wide.
Risk three: the potash wave is not a forecast, it is a schedule
Jansen Stage 1 produces first tonnes in mid-2027 and BHP has already committed the capital for Stage 2. Industry estimates point to roughly 15 Mt of new capacity entering the international market between 2027 and 2030. Brazilian granular MOP has already fallen to USD 355-375/t CFR, down about 10% in two months, on abundant supply, elevated inventories and slowing Chinese purchasing.
The risk here is not that the tonnes fail to arrive. It is that they arrive into a market where demand grows 2-3% a year, which means price must fall far enough to clear the surplus – and potash producers cannot cut output the way a gas-based ammonia plant can, because a mine’s economics deteriorate faster when it runs below capacity. Potash is the nutrient with the best volume outlook and the worst price outlook, and the two facts are the same fact.
Risk four: demand destruction versus deferral in the two biggest import markets
Brazil imported a record 45.5 Mt in 2025 and is tracking toward 40-41 Mt in 2026, more than 10% lower, at an average of USD 394.47/t through August – the highest for that window since 2022. Potassium chloride arrivals through September were 10.8 Mt, down 3.6%. European phosphate purchasing is reportedly at least 30% below normal seasonal levels.
Our forecast assumes that most of that shortfall is deferred rather than destroyed, on the basis that phosphate skipped in one season shows up as yield loss two or three seasons later and then has to be replaced. If that assumption is wrong – if growers have permanently re-optimised to lower application rates – then the second-half acceleration in this forecast does not happen and the 2033 number is 8-12% too high. This is the largest single model risk in the report, and the signpost is whether Brazilian imports recover in the 2027 season while area is still expanding.
Risk five: gas, and whether European closures are permanent
Northwest European ammonia at USD 710-730/t CFR against Chinese export material at USD 510-535 FOB, with TTF forward above EUR 100/MWh and about one-third of European ammonia capacity curtailed, is a dislocation that resolves in one of two ways. A mild winter restores gas supply and some capacity returns, and nitrogen prices fall. A cold one makes the 2024-25 shutdowns permanent, Europe becomes a structural importer, and the marginal cost of the last plant in the world rises for a period.
Our forecast assumes the second, gradually – which is why nitrogen value per tonne rises modestly rather than collapsing. The risk runs both ways and the position is genuinely uncomfortable, which is the honest description of a market whose price is set by a weather variable.
Risk six: trade routes and sanctions
Three separate dislocations since 2022 – the Black Sea, the Red Sea and the Strait of Hormuz – have each repriced a nutrient within a quarter. The Hormuz disruption removed Gulf ammonia and urea exports and pushed the Tampa settlement up USD 95 in a month. Russian and Belarusian potash moves at a delivered-cost penalty that is a function of insurance and payment rules, not of mine economics. None of these risks is forecastable, all are recurring, and each one is worth several percentage points of value in the quarter it occurs.
Risk seven: the fiscal limits of subsidy
India has allocated INR 1,67,899.5 crore for 2025-26 and had already spent INR 41,482 crore in the first quarter, up 43%. A subsidy line that grows at that rate against a fixed budget eventually forces a rate adjustment, and a rate adjustment in urea or DAP changes Indian demand immediately because the retail price is administered. The signpost is the kharif rate announcement and the ratio of potash support to nitrogen support: at INR 2.38/kg against INR 43.02/kg, the imbalance is so extreme that any normalisation would be positive for potash volume – and any further fiscal compression negative for nitrogen.
Risk eight: CBAM implementation
The definitive period started on 1 January 2026 and the methodology was published on 14 August 2026. The risk is not the carbon cost; it is the data. Importers who cannot produce verified installation-level emissions pay on defaults that are set above the performance of the cleanest plants, and in a low-margin blending business that is the difference between a viable and an unviable import book. Watch whether verified actuals displace defaults quickly, because that determines whether the European premium is 3% or 12%.
How we have mitigated, and where we have not
The forecast is built on nutrient-level prices rather than a blended index, which removes the largest source of internal inconsistency; it holds volume growth at 1.45% so that no price assumption can be smuggled in through the tonnage; it is expressed in constant 2025 dollars so that inflation is not mistaken for growth; and the two-speed shape deliberately places the acceleration after 2029, when the potash surplus has been absorbed.
What we have not mitigated is the judgment that suppressed phosphate demand returns. There is no dataset that settles it, because the evidence arrives two seasons late by construction. We hold the position because the soil does not forget, and we flag it as the assumption a reader should test first.
Regulatory Landscape
Regulation reaches this market through three channels, not one
Most regulatory analysis of fertiliser treats the subject as a compliance cost. That understates it. In this market regulation acts through cost (what an operator must spend), volume (what a farmer may apply) and trade flow (where a tonne may go). The three are usually analysed separately and they interact continuously: a cost measure in Europe changes a trade flow, which changes the price a Brazilian grower pays, which changes his application rate.
Europe: CBAM’s first definitive year
The Carbon Border Adjustment Mechanism entered its definitive period on 1 January 2026, and the Commission published its definitive-period methodology for calculating embedded emissions on 14 August 2026. Fertilisers are in scope. The operational consequence for importers is narrower and sharper than the political argument suggests: without verified installation-level embedded-emissions data, importers pay on default values, and default values for nitrogen products are set above the performance of the cleanest Gulf and North American plants.
So the first competitive advantage created by CBAM is not abatement. It is measurement. A producer able to document actual emissions at the installation pays materially less than a competitor who cannot, regardless of which plant is cleaner. That favours large, integrated, well-instrumented exporters and penalises exactly the mid-sized merchant trader that supplies much of the Mediterranean and Black Sea trade.
IFA names the mechanism directly in its medium-term outlook, describing CBAM implementation from 2026 as something that “could increase fertiliser costs for farmers and slow demand growth in the region”, alongside stricter environmental regulation. That is the correct framing: in Europe the constraint on demand is now regulatory rather than agronomic, which is why we forecast European growth at 1.3%, the lowest of the six regions.
Two further European instruments shape the product mix rather than the volume. The Nitrates Directive caps nitrogen application in vulnerable zones, which pushes demand toward split application and toward enhanced-efficiency products rather than toward less total nutrient. And the cadmium limit for phosphate fertilisers phases down over time, which structurally advantages low-cadmium igneous rock over sedimentary sources and changes the sourcing map for every European blender.
India: the subsidy is the market
India’s fertiliser demand is an administered quantity. The Union government has allocated INR 1,67,899.5 crore for 2025-26 – INR 1,18,899.5 crore for urea and INR 49,000 crore for P and K – and approved INR 37,952 crore for the 2025-26 rabi season specifically, an increase of roughly INR 14,000 crore on the prior rabi. Subsidy paid in the first quarter of the fiscal year reached INR 41,482 crore, up 43% year on year and already a quarter of the full-year allocation.
The rate structure is where the distortion lives. For rabi 2025-26 the subsidy was set at INR 43.02/kg for nitrogen, INR 47.96/kg for phosphate, INR 2.38/kg for potash and INR 2.87/kg for sulphur, with urea additionally sold at a fixed maximum retail price. Potash support at roughly one-eighteenth of nitrogen support per kilogram is not an accident of arithmetic; it is a thirty-year policy inheritance. The consequence is visible in the data: Indian N and P2O5 consumption have returned to FY2020 levels while K2O consumption has not, and IFA attributes the region’s demand shortfall over 2020-24 overwhelmingly to Indian potash.
This is the single largest negative for soil health in the global nutrient system and, perversely, the single largest latent upside in the potash forecast. India is under-applying the nutrient it does not subsidise. That is a stock of deficiency being accumulated, not a permanent preference.
China: export policy as domestic price control
China manages fertiliser as a food-security instrument. In December 2025 the National Development and Reform Commission suspended phosphate fertiliser exports until August 2026. As of early September 2026 producers still had no official guidance on resumption, only triple superphosphate and single superphosphate cargoes were understood to be eligible for inspection and export, and traders expected DAP and MAP restrictions to run to the end of the year as winter stockpiling took priority. The government’s sulphur discounts to domestic phosphate producers were structured to support domestic supply, not export competitiveness.
The effect on the rest of the world is direct and measurable: Indian DAP at USD 890-900/t CFR in late October 2026, Thai buyers seeking non-Chinese supply, and a substitution trade into TSP at around USD 230/t FOB for 20% Chinese material. China is also the reason nitrogen has a ceiling in Asia, having deployed targeted export restrictions to keep domestic fertiliser affordable for its own farmers through the recent demand recovery.
Russia, Belarus and the mechanics of sanctions
Sanctions did not remove Russian and Belarusian potash from the market; they removed the cheap logistics that made it competitive in the West. IFA recorded Belarusian MOP exports recovering 82% to 8.2 Mt in 2023 once rail routes to China and Russian ports replaced the Lithuanian corridor, and by 2024 global MOP production had reached a record 76.6 Mt, up 10%, driven principally by Russia and Belarus. The delivered-cost penalty from rerouting shows up in the price spread rather than in the volume, which is why Brazilian granular MOP can trade at USD 355-375/t CFR while Russian and Belarusian material still moves.
The regulated risk is not that the tonnes disappear. It is that a further tightening of payment, insurance or shipping rules raises the delivered cost of a third of globally traded potash by enough to reprice the marginal tonne for everyone.
The United States and Brazil: policy by other means
The United States has no carbon price on fertiliser and no national application cap, so its regulatory exposure is trade policy. Tariffs on trading partners introduce uncertainty into the continuity of US export markets for agricultural products, which feeds back into planted area and therefore into nutrient demand. State-level nutrient management programmes in the Mississippi basin and Chesapeake Bay influence timing and product choice rather than total volume.
Brazil has the opposite problem: it applies more fertiliser per hectare of cropped area than almost any large producer and imports the overwhelming majority of it, having taken a record 45.5 Mt in 2025. Its policy exposure is therefore to import logistics and to the price of a delivered tonne, not to application rules. Any Brazilian move to expand domestic production reduces the country’s exposure to import parity pricing, and would raise the producer-level value of the market even as it lowered the price Brazilian growers pay – a distinction that matters when reading headline market-size figures.
What regulation does to the forecast
Three net effects are built into the numbers. European volume growth is cut by roughly a percentage point relative to what agronomy alone would produce, which is the difference between our 1.3% and North America’s 2.2%. Chinese phosphate export policy adds a persistent risk premium to phosphate value, which is why we hold phosphate growth below its 2029-33 potential in the early years. Indian potash under-support is modelled as deferred rather than destroyed demand, and it is a material part of the acceleration after 2029.