
Global Genetically Modified and Biotech Seeds Market Report, Size, Share and Forecast 2026–2033
The global market for genetically modified and biotech seed — the commercial value farmers pay for seed carrying engineered traits, together with the trait royalties embedded in that price — was worth USD 26.15 billion in 2025 and is forecast to reach USD 41.37 billion by 2033, a compound annual growth rate of 5.90% across 2026–2033.
That headline conceals an asymmetry worth stating at the outset. The area under GM crops is close to mature. In 2025 it reached 216.0 million hectares, a record and 2.5% above the prior year, but it has compounded at only 2.46% a year across 2021–2025. Value grew considerably faster — 7.20% a year over the same window — because the price of a GM seed lot rose while the land it covered barely moved. Average revenue per GM hectare was USD 121.1 in 2025 and is forecast at USD 163.5 by 2033. Almost all of the forecast increment is therefore a value-per-hectare story rather than an area story, and that is the single most important assumption in this report.
Market Snapshot
| Base year | 2025 |
| Base-year market value | USD 26.15 billion |
| Forecast market value, 2033 | USD 41.37 billion |
| CAGR, 2026–2033 | 5.90% |
| Historical CAGR, 2021–2025 | 7.20% |
| GM planted area, 2025 | 216.0 million hectares |
| GM area CAGR, 2021–2025 | 2.46% |
| GM share of global crop area, 2025 | 28.2% of 765.9 million hectares |
| Average revenue per GM hectare, 2025 | USD 121.1 |
| Share of the global commercial seed market | 33.4% of USD 78.40 billion |
| Countries cultivating GM crops, 2025 | 30 |
| Largest single market | United States, 79.7 million hectares |
| Fastest-growing significant market, 2025 | China, +79.0% in area |
| Largest crop by value | Maize, 47.2% of market value |
Market Size and Forecast
The market expanded from USD 19.80 billion in 2021 to USD 26.15 billion in 2025, a 7.20% compound rate. That period captures two unusual years: the 2022 commodity price spike that reset seed price expectations upward across the Americas, and the 2024–2025 acceleration in Chinese approvals, which added 2.7 million hectares in a single season. Neither repeats at the same magnitude, which is why the forward rate steps down to 5.90% rather than extending the historical trend.
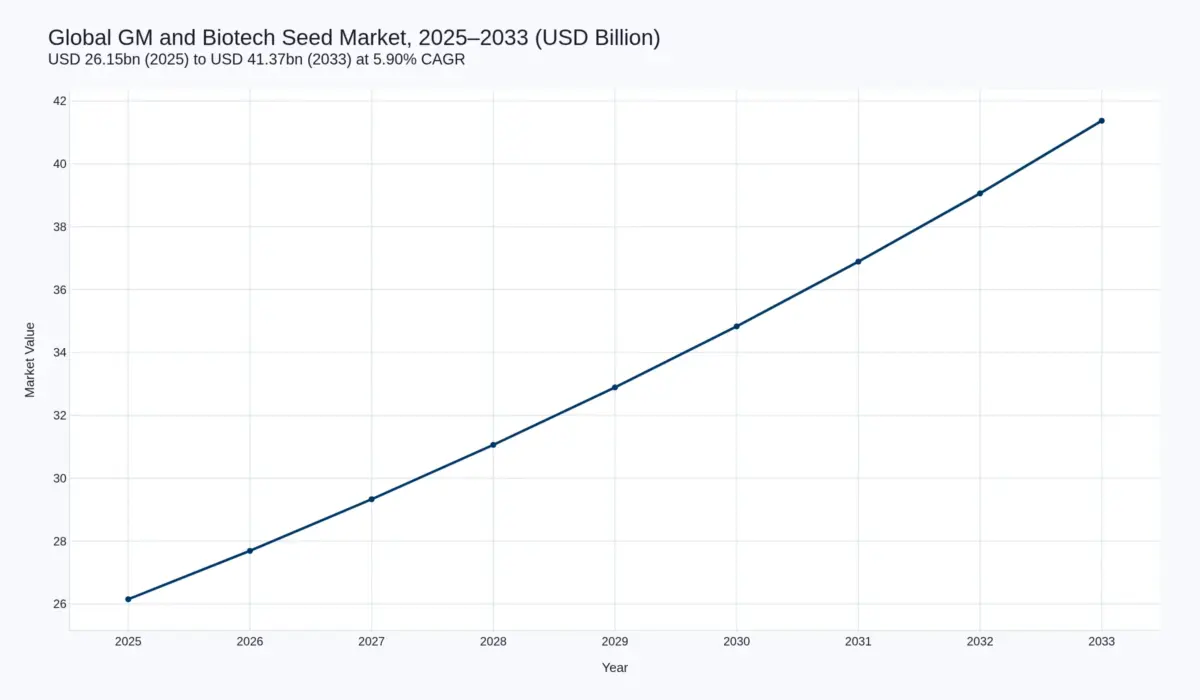
| Year | Market value (USD billion) | GM area (million ha) | Value per hectare (USD) |
|---|---|---|---|
| 2025 | 26.15 | 216.0 | 121.1 |
| 2026 | 27.69 | 220.3 | 125.7 |
| 2027 | 29.33 | 224.7 | 130.5 |
| 2028 | 31.06 | 229.2 | 135.5 |
| 2029 | 32.89 | 233.8 | 140.7 |
| 2030 | 34.83 | 238.5 | 146.1 |
| 2031 | 36.89 | 243.3 | 151.6 |
| 2032 | 39.06 | 248.1 | 157.4 |
| 2033 | 41.37 | 253.1 | 163.5 |
The decomposition matters more than the total. Area contributes roughly one third of the increment; price and mix contribute the rest. Three mechanisms drive the price component. Trait stacking raises the number of events in a single bag and with it the royalty stack — stacked varieties accounted for 84% of US maize area in 2025, against 1% in 2000. Generic competition in Brazil and Argentina pushes the other way, compressing herbicide-tolerance pricing where patented events have lost exclusivity. And gene-edited events, once they clear registration in volume, carry a premium that conventional transgenic events no longer command.
Three Structural Shifts Defining 2026–2033
First, China has crossed from pilot to routine commercial planting. The 2024 demonstration programme covered eight provinces and roughly 1.07 million mu. In 2025 it extended to thirteen provinces and passed 30 million mu. The 2026 season is the first conducted under ordinary commercial planting rules, with maize targeted at 57.85 million mu and soybean at 1.03 million mu across 23 provinces plus the Xinjiang Corps and Beidahuang. That puts GM maize penetration at close to 9% of a national maize seed area of about 650 million mu. Field results are the reason the policy has held: efficacy against fall armyworm and stem borer above 90%, average yield gains of 8.5%, and a cost-and-revenue benefit of RMB 132.5 per mu in maize. Cumulative variety approvals reached 239 by the fourth batch in late 2026 — 219 maize and 20 soybean — a supply-side signal that the pipeline behind the area target is real.
Second, the trait business is becoming a licensing business. In early 2026 Corteva settled all litigation with Bayer for a USD 610 million cash outflow, pulled its royalty-neutrality target forward two years to 2026, and set out to become a net out-licensor of seed technology. The settlement brought forward the availability of triple-stack maize traits for out-licensing by roughly five years, to as early as 2027, and advanced third-generation above-ground insect traits by about two years. Alongside this, Corteva has announced its intention to separate Seed and Crop Protection into two standalone listed companies. The consequence for the market is structural: access to elite traits is becoming purchasable rather than merely licensable, which widens the field of competitors selling GM seed while concentrating the owners of the events.
Third, gene editing has split the regulatory world in two. Regulation (EU) 2026/1388 was adopted on 17 June 2026, entered into force on 16 July 2026, and applies from 17 July 2028. It creates two categories: category 1 NGT plants meeting defined equivalence criteria are treated broadly like conventionally bred plants, while category 2 plants remain inside the GMO regime with adaptations. Until July 2028 the existing GMO rules continue to apply to all NGTs, and no crop developed exclusively through NGTs is yet authorised for food or feed in the EU. Europe is therefore 0.6% of this market today and an option on the 2033 number rather than a contributor to it.
Market Drivers
Farm-gate economics. Adoption follows demonstrated net return, not ideology. Where a trait delivers a measured yield gain and a measurable reduction in spray passes, farmers buy it — including in markets where the regulatory environment is hostile. This is why Bt brinjal persists in Bangladesh and why Chinese maize adoption accelerated once herbicide registration completed the chain from biosafety certificate to variety approval to in-crop chemistry.
Resistance cycles. Weed and insect resistance is the engine of trait refresh. Glyphosate-resistant weed populations force rotation into dicamba, 2,4-D, glufosinate and isoxaflutole systems, each of which requires a different tolerance event and therefore a new seed purchase. The cycle is commercially reliable precisely because it is agronomically unavoidable.
Feed and biofuel demand. GM soybean area is a derived demand for protein meal and vegetable oil, and increasingly for renewable diesel and sustainable aviation fuel feedstock. Every increment of crush capacity in the United States, Brazil or Argentina pulls seed demand with it, which is why soybean is forecast to outgrow the market at 6.62% a year.
Climate and input stress. Drought tolerance, nitrogen-use efficiency and early vigour are the traits with the clearest pipeline visibility, because they address cost lines that farmers cannot control. Their commercial value rises with every season of input price volatility.
Market Segmentation
By crop, maize leads at USD 12.35 billion or 47.2% of 2025 value, ahead of soybean at 31.7%, cotton at 13.0%, canola at 5.9% and all other crops at 2.1%. Cotton has the highest adoption rate of any crop at 76.7% of world area, but the smallest value pool per hectare relative to maize. Maize and soybean together account for 78.9% of value and will still account for 80.9% in 2033.
By trait, stacked varieties — herbicide tolerance plus insect resistance in a single event set — represent 62.0% of value in 2025, rising to 67.2% by 2033. Herbicide tolerance alone represents 27.0% and is the segment most exposed to generic erosion. Insect resistance alone represents 11.0% and is concentrated in cotton.
By technology generation, established transgenic events remain 98.7% of value in 2025. Gene-edited and NGT-derived seed is 1.3% — small enough to look like a rounding error today and the fastest-growing segment in the forecast, at 16.3% a year, contingent on category 1 verification capacity in the EU and on equivalent determinations in Japan, Brazil, Argentina, Canada, the Philippines and Colombia.
By route to market, branded seed is 67.3% of value and licensed or out-licensed technology 32.7%. The licensed share is forecast to rise to 35.0% by 2033, which is the cleanest single indicator of the licensing shift described above.
Regional Analysis
North America remains the value centre at USD 14.00 billion or 53.5% of the 2025 market, on 79.7 million hectares in the United States. Its growth rate is the lowest of any region at 4.83%, because adoption is saturated and the 2025 dicamba label vacatur cut soybean and cotton trait revenue directly — Bayer's soybean seed and traits sales fell 8% and cotton 23% in the year.
South America is USD 8.50 billion or 32.5%, growing at 6.34%. Brazil now plants only 5 million hectares less GM crop than the United States, the narrowest gap on record, and Argentina approved thirteen new events across 2024–2025. Latin America is where volume growth and price compression coexist most visibly.
Asia-Pacific is the fastest-growing significant region at 9.05% a year, from USD 2.30 billion in 2025 to USD 4.60 billion in 2033. China alone added 79.0% to its GM area in 2025. India remains structurally constrained by the absence of any commercially approved biotech food crop other than Bt cotton, which is the region's largest single regulatory option.
Europe is USD 0.15 billion, 0.6% of the market, and the Middle East and Africa USD 1.20 billion at 4.6%, growing 4.60% a year on the strength of cowpea, maize and cotton programmes in West and Southern Africa. Ghana became the thirtieth cultivating country in 2025 with GM cowpea.
Competitive Landscape
The market is highly concentrated at the level of event ownership and considerably less concentrated at the level of seed sales. Bayer Crop Science reported Seeds and Traits sales of EUR 11,136 million in 2025, of which corn seed and traits were EUR 7,149 million, up 13% on higher area and additional licensing revenue. Corteva's Seed segment reported net sales of USD 9,898 million, up 4%, with a segment operating EBITDA margin improvement of roughly 340 basis points. Syngenta AG grew Seeds sales 0.7% in a year of portfolio restructuring in North America. The Chinese trait platform is the genuinely new entrant: Beijing Dabeinong discloses that its events sit inside 133 of the 219 maize varieties approved to date, a 60.73% share of the national approval list.
| Company | FY2025 seed measure | Change | Note |
|---|---|---|---|
| Bayer Crop Science | EUR 11,136m Seeds & Traits | +5% currency- and portfolio-adjusted | Corn EUR 7,149m, up 13%; soybean down 8% on dicamba vacatur |
| Corteva Agriscience | USD 9,898m seed net sales | +4% | Corn USD 7,002m; seed EBITDA USD 2,636m, up 19% |
| Syngenta AG | Seeds sales | +0.7% | Volume down 0.5%, price up 1.3%; North America restructuring |
| Beijing Dabeinong | Trait share of approved maize varieties | 133 of 219 | 60.73% of China’s approved maize list |
Below the top four, the independent seed sector matters more than its revenue suggests. Out-licensing means the route for a regional breeder to sell GM seed no longer runs through a full alliance with a trait owner, and the licensing settlements of 2025–2026 have widened that path deliberately.
The competitive and regulatory picture connects directly to the rest of this cluster. The Global Seed Market report establishes the USD 78.40 billion base this market sits inside; the Global Seed Treatment and Global Vegetable Seeds reports cover the adjacent seed categories and the same four vendors. The chemistry side of the corridor is covered in Peru Crop Protection. Downstream demand for GM soybean appears in Global Animal Feed and Brazil Animal Feed, and the data layer behind trait selection in AI in Agriculture and Remote Sensing Technology for Agriculture.
Strategic Outlook
The market compounds at 5.90% because two forces of similar magnitude pull against each other. Expansion comes from China, from sub-Saharan Africa's small base, from gene editing clearing registration, and from biofuel-driven soybean area. Compression comes from Latin American generic competition, from trait exclusivity expiry, and from the regulatory risk that a single label vacatur can remove a chemistry — and with it the value of the tolerance trait built around it — in one season. The 2025 US dicamba episode is the template, and it cost two of the four largest players material revenue within a single fiscal year.
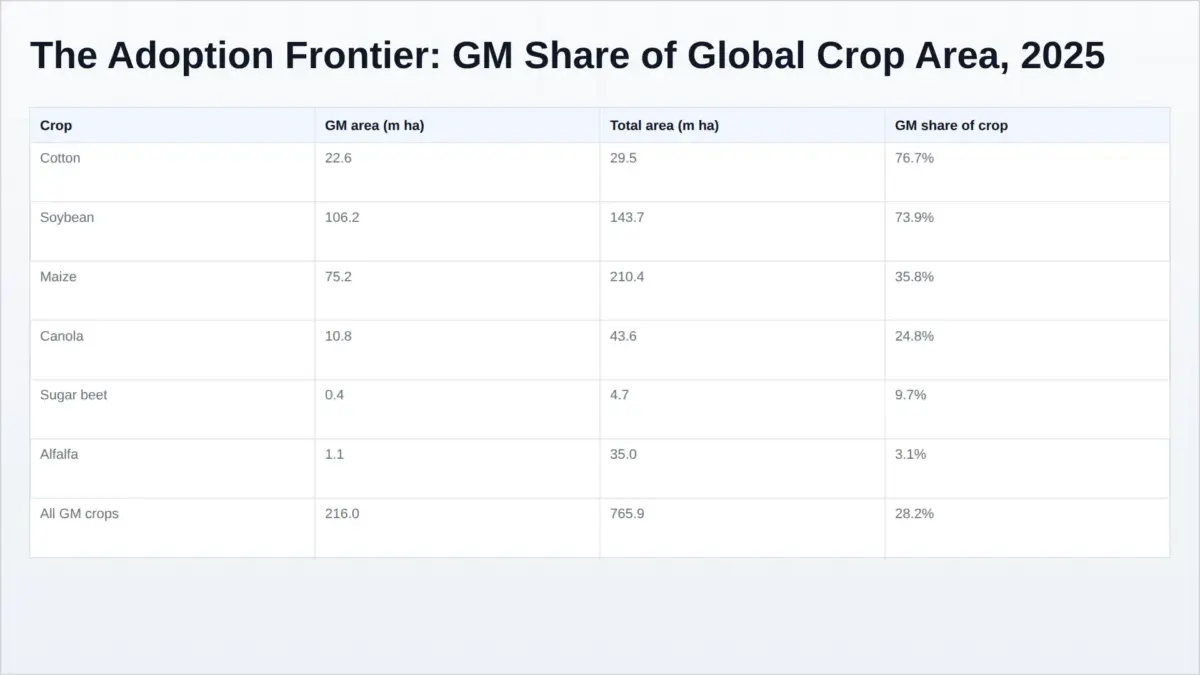
The strategic read is that headroom sits in maize. Cotton at 76.7% and soybean at 73.9% have little adoption left to win; maize at 35.8% of a 210.4 million hectare global crop has more than 130 million hectares of unconverted area, overwhelmingly in Asia and Africa. Whoever converts that area — through locally adapted germplasm, through licensing, or through state-linked programmes in China — sets the shape of the market after 2030.
Watch List
- China's 2027 area target and whether trait approval keeps pace with the planting ambition.
- The EU delegated and implementing acts on category 1 verification, due by 17 July 2028.
- Whether triple-stack maize traits reach out-licensing in 2027 as signalled.
- Completion and terms of the Corteva Seed / Crop Protection separation.
- Any further herbicide label litigation in the United States.
- First commercial-scale gene-edited row-crop launches outside North and South America.
Sources and Further Reading
Company disclosure. Bayer Annual Report 2025, Crop Science business development; Corteva fourth-quarter and full-year 2025 results; Syngenta AG FY2025 performance report.
Planted area and adoption data. AgbioInvestor, Global GM Crop Area Review; ISAAA Crop Biotech Update, biotech crop area and country ranking.
Regulatory instruments. European Commission, legislation for plants obtained by new genomic techniques; EFSA, new genomic techniques.
Company information. Bayer Crop Science; Corteva Agriscience; Syngenta Group.
Methodology note: this report is built on a 70% secondary and 30% primary evidence base. Market size is triangulated from a GM share applied to the USD 78.40 billion global commercial seed base, a bottom-up aggregation of disclosed tier-1 seed and trait revenue, and an area-times-value-per-hectare build from 216.0 million GM hectares. The three converge within a USD 25.2–27.1 billion band for 2025; the midpoint is taken. No third-party market-research study is used, licensed or cited anywhere in this report.
Further reading: Genetically Modified Seed Is Nearly All of the Corn in the Americas and None of the Rice Anywhere — the adoption table behind this forecast, why maize carries 135 million unconverted hectares at USD 163.9 a hectare, and what China's 57.85 million mu target does to the volume line.
Table of Contents
Table of Contents
- Executive Summary
- 1.1 Snapshot
- 1.2 Key Findings
- 1.3 Segments Covered
- 1.4 Methodology and Data Sources
- Market Overview
- 2.1 Definition and Scope
- 2.2 The Biotech Seed Value Chain
- 2.3 Trait Value versus Germplasm Value
- 2.4 What Falls Outside This Market
- Market Size and Forecast (USD Billion), 2026-2033
- 3.1 Historical Market Size, 2021-2025
- 3.2 Base-Year Market Size, 2025
- 3.3 Forecast Market Size, 2026-2033
- 3.4 Forecasting Assumptions
- Market Drivers
- 4.1.1 Farm-Gate Economics and Measured Yield Gain
- 4.1.2 China’s Commercial Roll-Out
- 4.1.3 Feed and Biofuel Demand
- 4.1.4 Weed and Insect Resistance Cycles
- 4.1.5 Climate Stress and Drought Tolerance
- Market Restraints and Challenges (USD Billion), 2026-2033
- 5.1 Asynchronous Approval and Export Rejection
- 5.2 Herbicide Label and Regulatory Vacatur Risk
- 5.3 Royalty and Refuge Compliance Erosion
- 5.4 Consumer and Retail Resistance in Regulated Markets
- Market Segmentation (USD Billion), 2026-2033
- 6.1 By Crop
- 6.1.1 Maize
- 6.1.2 Soybean
- 6.1.3 Cotton
- 6.1.4 Canola
- 6.1.5 Other Crops
- 6.2 By Trait
- 6.2.1 Stacked Herbicide Tolerance and Insect Resistance
- 6.2.2 Herbicide Tolerance Only
- 6.2.3 Insect Resistance Only
- 6.3 By Technology Generation
- 6.3.1 Established Transgenics
- 6.3.2 Gene-Edited and NGT-Derived
- 6.4 By Route to Market
- 6.4.1 Branded
- 6.4.2 Licensed and Out-Licensed
- 6.1 By Crop
- Regional Analysis
- 7.1 North America
- 7.2 South America
- 7.3 Asia-Pacific
- 7.4 Europe
- 7.5 Middle East and Africa
- Value Chain Analysis
- 8.1 Event Discovery and Trait Development
- 8.2 Germplasm Integration and Breeding
- 8.3 Regulatory Dossiers and Approval
- 8.4 Seed Multiplication and Conditioning
- 8.5 Licensing, Royalty and Channel Economics
- Competitive Landscape
- 9.1 Bayer Crop Science
- 9.2 Corteva Agriscience
- 9.3 Syngenta Group
- 9.4 BASF Agricultural Solutions
- 9.5 Beijing Dabeinong
- 9.6 Yuan Longping High-Tech and the State-Linked Complex
- 9.7 KWS and the Sugarbeet Position
- 9.8 Independent Seed Companies and Licensees
- 9.9 Regional Trait Developers
- 9.10 Ownership and Portfolio Changes
- Strategic Intelligence
- 10.1 Competitive Positioning Matrix
- 10.2 Royalty and Pricing Benchmarks
- 10.3 Trait Pipeline Assessment
- 10.4 M&A and Partnership Screen
- 10.5 Automated Porter’s Five Forces Analysis
- Regulatory Landscape
- 11.1 Approval Pathways and Asynchronous Authorisation
- 11.2 Cartagena Protocol and Trade Documentation
- 11.3 Gene Editing and the EU NGT Regulation
- 11.4 Intellectual Property, Patents and Plant Variety Rights
- 11.5 Labelling, Thresholds and the Organic Interface
- Technology and Innovation
- 12.1 Event Stacking and Multi-Trait Platforms
- 12.2 RNA Interference and Novel Modes of Action
- 12.3 Gene Editing and Base Editing
- 12.4 Drought and Nitrogen-Use Efficiency Traits
- 12.5 Digital Trait Selection and Phenotyping
- Investment Activity
- 13.1 M&A and Portfolio Reshaping
- 13.2 Trait Licensing and Royalty Deals
- 13.3 R&D Spending Benchmarks
- 13.4 Capacity, Breeding Stations and Seed Production
- Market Risks and Outlook
- 14.1 Demand-Side Risks
- 14.2 Seed Production and Supply Risks
- 14.3 Regulatory and Trade Risks
- 14.4 Competitive and Intellectual Property Risks
- 14.5 Forward Outlook and Watch List
Competitive Landscape
Competitive Landscape
Overview
Event ownership in biotech seed is one of the most concentrated technology markets in the world. Four companies — Bayer, Corteva, Syngenta and BASF — hold the overwhelming majority of commercial events for maize, soybean, cotton and canola, and the capital required to generate and register a new event is high enough that new entrants at the discovery layer are rare. Below that layer, however, the seed-selling market is genuinely fragmented: thousands of independent seed companies, regional multipliers and cooperatives sell GM seed under licence, and their aggregate share of the bag is larger than any single brand.
2025 was an unusual year in which the two largest players moved in opposite directions for reasons that had little to do with competitive performance and everything to do with exposure to a single herbicide chemistry.
Current Scenario
Bayer Crop Science reported Crop Science sales of EUR 21,622 million in 2025, up 1.1% currency- and portfolio-adjusted, with Seeds and Traits at EUR 11,136 million. Corn seed and traits were the engine at EUR 7,149 million, up 13% adjusted on higher planted area across all regions and additional licensing revenue. Soybean seed and traits fell 8% to EUR 2,214 million and cotton seed and traits fell 23% to EUR 442 million, both attributed to the US dicamba label vacatur and lower planted area. Vegetable seeds grew 8% to EUR 788 million. Segment EBITDA before special items was EUR 4.2 billion at a 19.4% margin, flat year on year — a result that reads as stability but is in fact corn growth absorbing a regulatory shock.
Corteva Agriscience reported Seed net sales of USD 9,898 million in 2025, up 4%, on 3% price/mix and 2% volume gains, with seed operating EBITDA of USD 2,636 million, up 19%, and a margin improvement of roughly 340 basis points. Corn was USD 7,002 million, soybean USD 1,878 million and other oilseeds USD 644 million. North America was USD 6,271 million of the seed total, Latin America USD 1,614 million, EMEA USD 1,560 million and Asia-Pacific USD 453 million. Argentina reached more than 30% penetration of Enlist E3 soybean technology, primarily through out-licensing, and Brazil is expected to reach double-digit Conkesta trait penetration. The announced intention to separate Seed and Crop Protection into two standalone companies, disclosed on 1 October 2025, is the most consequential portfolio decision in the sector this cycle.
Syngenta Group grew Seeds sales 0.7% in 2025, with volume down 0.5% and price up 1.3%. Argentina recovered from the 2024 corn stunt outbreak and sunflower acreage grew; North America declined because of a deliberate business transformation; Europe was hurt by reduced maize and sunflower area. Group net income was USD 993 million against USD 269 million in 2024 and free cash flow USD 1.2 billion. The company is executing a restructuring rather than pursuing share, which makes its North American trajectory the number to watch in 2026.
BASF Agricultural Solutions remains a meaningful but smaller participant in GM seed, concentrated in canola and cotton with a functional-crop portfolio that carries less trait exposure than the three above it. Its position is best understood as an adjacent rather than a direct competitor in maize and soybean.
The Chinese trait platforms. Beijing Dabeinong disclosed in November 2026 that its events are present in 133 of the 219 GM maize varieties approved to date, a 60.73% share, including 38 of the 59 varieties approved in the most recent batch; its DBN9936 and DBN3601T traits are the commercial anchors. Yuan Longping High-Tech and its associated platform hold five transformation event biosafety certificates. These are not yet global competitors, but they are the reason China’s adoption curve is steepening faster than any prior national rollout.
| Company | FY2025 seed measure | Change | Note |
|---|---|---|---|
| Bayer Crop Science | EUR 11,136m Seeds & Traits | +5% adjusted | Corn +13%; soybean -8%, cotton -23% on dicamba vacatur |
| Corteva Agriscience | USD 9,898m seed net sales | +4% | Seed EBITDA USD 2,636m, +19% |
| Syngenta AG | Seeds sales | +0.7% | Volume -0.5%, price +1.3%; North America restructuring |
| Beijing Dabeinong | Trait share of approved maize list | 133 of 219 | 60.73% of China’s approved maize varieties |
Signals
The 2026 Corteva-Bayer resolution is the signal that matters. It settled all litigation, pulled Corteva’s royalty-neutrality target forward two years to 2026, accelerated triple-stack maize trait availability to out-licensing by roughly five years to as early as 2027, advanced third-generation above-ground insect traits by about two years, and opened the US cotton out-licensing market. It cost USD 610 million in cash and is expected to contribute around USD 1 billion of aggregate earnings upside over the next decade. In strategic terms, the two largest event owners have agreed to compete on placement and germplasm rather than on access denial.
Strategic Implications
Concentration at the event layer and fragmentation at the bag layer produce a specific competitive logic. A regional seed company that once needed a full alliance with a trait owner to enter GM seed can now buy access on commercial terms, which raises the number of brands competing for the same farmer and compresses brand premium. The event owners accept that compression because their return comes from volume of placements, not from the retail margin. The parties most exposed are mid-sized seed businesses with neither proprietary germplasm nor proprietary events — they face the same trait costs as larger rivals without the scale to absorb them.
Forward Outlook
The forecast assumes the top four retain control of the majority of commercial events through 2033 but that their share of the total value chain declines as licensing widens and as Chinese platforms capture domestic volume that would otherwise have been imported. Watch three things: whether the Corteva separation completes on the announced terms, whether triple-stack maize traits actually reach out-licensing in 2027, and whether Syngenta’s North American restructuring stabilises its seed trajectory in 2026. A fourth, less comfortable watch item is litigation: the dicamba vacatur showed that a legal outcome can reprice a trait portfolio faster than any competitor can.
Value Chain
Value Chain Analysis
Overview
The biotech seed value chain runs from event discovery through germplasm integration, regulatory approval, seed multiplication and conditioning, to licensing and channel delivery. What distinguishes it from every other agricultural input category is where value is created versus where it is captured. Roughly two thirds of chain economics accrue to the owner of the trait and the elite germplasm it sits in; the multiplier, conditioner and distributor share the remainder but handle volumes an order of magnitude larger. A single maize event can generate royalty income across dozens of licensee brands, while the licensee earns a modest margin on a bag that would otherwise have been sold as conventional seed.
The consequence is a market whose competitive dynamics are decided upstream, at the point of event ownership and regulatory approval, rather than downstream at the point of sale. That is why this report treats the 2025-2026 licensing settlements as a structural event rather than a legal footnote.
Current Scenario
Event discovery and trait development. The cycle from discovery to first commercial sale runs eight to twelve years and consumes the majority of a trait developer’s research budget before any revenue appears. Bayer Crop Science spent EUR 2.6 billion on research and development in 2024 across the division, and the seeds and traits share of that is the single largest line. The technical work has shifted emphasis over the last decade: herbicide tolerance and lepidopteran resistance are mature platforms, and incremental spend now goes into novel modes of action, RNA interference, drought and nitrogen-use efficiency, and gene editing. The 2025 area data confirms the maturity of the first generation: stacked varieties represented 84% of US maize area, against 1% in 2000, leaving little further substitution to sell.
Germplasm integration and breeding. A trait is worth nothing in the wrong genetic background. Introgressing an event into elite germplasm takes four to seven backcross generations, supported by marker-assisted selection, and the performance difference between the same event in a leading hybrid and a mediocre one is routinely larger than the trait effect itself. This is why trait owners either own top-tier germplasm or license to those who do, and why the licensing settlement expanding freedom to operate across maize, canola and cotton matters more than any single new event. It widens the pool of germplasm a trait can profitably be placed in.
Regulatory dossiers and approval. Approval is the binding constraint on the whole chain. A dossier must clear food and feed safety, environmental risk and, in many jurisdictions, cultivation authorisation separately, and the process is asynchronous by design: China has approved 239 GM maize and soybean varieties in four batches since December 2023, Argentina has approved 91 biotech events across nine crops, and the European Union authorised no new cultivation event of consequence in the period. In China the chain now runs end to end — biosafety certificate, variety approval, and herbicide registration — a sequence only completed in 2024, which is precisely why 2026 is the first season of routine commercial planting rather than demonstration.
Seed multiplication and conditioning. Commercial GM seed is multiplied in counter-season nurseries — Chile, Argentina, Brazil and parts of Southeast Asia — under isolation distances and purity tolerances that make it materially more expensive to produce than conventional seed. Conditioning adds priming, sizing, film coating and seed treatment, and in the upper tiers of the market that layer is increasingly where differentiation is won, because the trait itself is common across competing brands. The seed treatment adjacency is not incidental: the same companies that own the events also sell the treatment that goes on them.
Licensing, royalty and channel economics. The royalty stack is the market’s characteristic pricing mechanism. A stacked maize bag may carry fees from two or three event owners simultaneously, and the total trait component can represent 30% to 40% of the bag price in North America. Licensed and out-licensed routes to market were 32.7% of 2025 value and are forecast to reach 35.0% by 2033. Corteva’s stated intention to become a net out-licensor after reaching royalty neutrality in 2026, with a target of USD 1 billion in net royalty income by 2035, is the clearest public statement of where the chain’s economics are heading.
Signals
Three signals indicate the chain is reorganising rather than simply growing. First, the USD 610 million Corteva-Bayer settlement, funded from 2025 free cash flow and paid largely in the first quarter of 2026, converts a litigation relationship into a licensing one and explicitly accelerates triple-stack maize trait availability for out-licensing by roughly five years. Second, Bayer’s corn seed and traits sales grew 13% in 2025 partly on additional licensing revenue, meaning licensing is now large enough to move a segment result at the largest player. Third, the Chinese state-linked and private trait platforms are accumulating approval share at a rate that puts them inside, not outside, the global royalty conversation: Beijing Dabeinong’s events sit in 133 of the 219 approved maize varieties, a 60.73% share of the national list.
Strategic Implications
For event owners, the strategic prize is no longer exclusivity but penetration — owning fewer events placed in more bags beats owning many events placed in one brand. For seed companies without proprietary events, access has genuinely improved: the licensing market is wider than it was in 2024, and the barrier is now capital and germplasm quality rather than permission. For distributors, the value shift means the margin on a GM bag is less defensible than the margin on the service, treatment and agronomic advice attached to it. And for investors, the chain’s structure explains why a company with 60% of a national approval list can be structurally important while generating a fraction of Bayer’s or Corteva’s revenue.
Forward Outlook
By 2033 the chain will look more like a technology licensing industry and less like a seed industry. The forecast assumes licensed routes rise to 35.0% of value, that trait stacks continue to refresh at roughly a three-to-five year cadence, and that regulatory approval remains the critical path in every jurisdiction. The main risk to that assumption cuts across the whole chain: the 2025 US dicamba label vacatur removed a working chemistry in one season and with it the value of the tolerance trait built around it, cutting Bayer soybean seed and traits sales 8% and cotton 23% within the same fiscal year. No link in this chain is more fragile than the regulatory approval that underwrites it, and no link is cheaper to insure against than a diversified trait and crop portfolio.
Investment Activity
Investment Activity
Overview
Capital allocation in biotech seed has shifted from buying capacity to buying access. The 2015-2018 consolidation wave — Bayer and Monsanto, Dow and DuPont, ChemChina and Syngenta — was about owning the assets. The current period is about rearranging rights to them: settling litigation, licensing events, separating business units and building trait capability in markets that previously imported it. For an investor, the relevant question is no longer who owns what, but who can place which event in whose germplasm fastest.
Current Scenario
M&A and portfolio reshaping. The largest single portfolio decision of the cycle is Corteva’s announced intention, disclosed on 1 October 2025, to separate its Seed and Crop Protection businesses into two standalone publicly traded companies in a transaction intended to be tax-free. A standalone seed business with USD 9,898 million of net sales, a 19% operating EBITDA improvement and gene editing, hybrid wheat and out-licensing as stated growth vectors is a different investment proposition from a combined input supplier. On the other side of the ledger, Syngenta’s North American restructuring reduced its seed top line in 2025 by design, and Bayer’s Crop Science division continues to operate under a group-level cost and portfolio review.
Trait licensing and royalty deals. The Corteva-Bayer settlement is the defining transaction. It resolved all litigation between the two, cost USD 610 million in cash largely in the first quarter of 2026 funded from 2025 free cash flow, pulled Corteva’s royalty-neutrality target forward two years to 2026, and converted Corteva from a net royalty payer to a net out-licensor thereafter. The company has set a target of USD 1 billion in net royalty income by 2035 and expects the agreement to contribute roughly USD 1 billion of aggregate earnings upside over the next decade across licensing and branded sales. Separately, Corteva reached more than 30% penetration of Enlist E3 soybean technology in Argentina primarily through out-licensing, and expects double-digit Conkesta trait penetration in Brazil.
R&D spending benchmarks. Bayer Crop Science reported research and development expenses of EUR 2,611 million for 2024 on a basis that includes special items, depreciation, amortisation and impairments, falling to EUR 2,013 million in 2025 on the same basis — a comparison distorted by impairment timing and not a clean read on underlying research spend. Across the sector the pattern is consistent: absolute R&D is large and stable, and the mix is rotating away from first-generation transgenic events toward editing, novel modes of action and data. Corteva’s positioning of gene editing and hybrid wheat as standalone-company growth vectors implies the same reallocation.
Capacity, breeding stations and seed production. Physical investment follows the demand map. Chinese capacity is expanding in step with the 2026 planting target, concentrated in Gansu, which is simultaneously a spring maize target market and the country’s core GM maize seed production base — a dual role that has visibly influenced which companies received approvals in the fourth batch, with 12 first-time applicants including several northwestern producers. In the Americas, investment continues in conditioning and treatment capacity rather than in field production, because the differentiation has moved downstream of the trait.
Signals
Four signals support the read that capital is chasing access rather than assets. The USD 610 million settlement price is itself a valuation of freedom to operate. Corteva’s royalty-neutrality milestone arriving two years early means the licensing income line became material faster than management had guided. Bayer’s corn seed and traits revenue growth of 13% in 2025 was attributed partly to additional licensing revenue, showing that licensing now moves segment results at the largest player. And the Chinese approval list is increasingly populated by companies whose assets are trait rights and seed production capacity in the same province — a capital pattern that did not exist three years ago.
Strategic Implications
For investors, the sector is best analysed as two businesses with different economics inside one legal entity: an event-licensing business with high margins, long asset life and regulatory gating, and a seed-production and distribution business with working capital intensity and modest margins. Corteva’s separation is a bet that the market will value them separately at more than the sum. For strategic buyers, the interesting targets are no longer seed brands but trait platforms in geographies where approval share is still being allocated — China, Brazil, India and, prospectively, West Africa. For the majors, the cheapest source of growth is litigation settlement, which is an unusual but defensible conclusion from the 2026 evidence.
Forward Outlook
The forecast assumes licensing income continues to grow faster than seed sales, that the Corteva separation completes, and that no further transformational consolidation occurs among the top four. Watch three items: whether the Corteva separation is completed on the announced terms and at what valuation, whether Chinese trait platforms attract foreign licensing partnerships once domestic volume is proven, and whether the 2027 out-licensing of triple-stack maize traits triggers a visible repricing of mid-sized seed assets. A fourth, less pleasant item is contingent liability: the dicamba vacatur demonstrated that a legal outcome can remove revenue faster than capital can be redeployed.
Technology & Innovation
Technology and Innovation
Overview
The technology agenda in biotech seed has changed character. Between 1996 and roughly 2015 the industry’s innovation model was substitution: replace a conventional variety with a transgenic version carrying one or two events, and charge for the difference. That model is exhausted in the crops where it worked. Stacked varieties reached 84% of US maize area in 2025 against 1% in 2000, and stacked traits now represent 62.0% of global GM seed value. The next increment cannot come from converting conventional area within the established crops, because there is very little left to convert. It has to come from new traits, new crops and new regulatory categories.
Current Scenario
Event stacking and multi-trait platforms. Stacking remains the most reliable value driver available, because every additional event in the bag carries its own royalty and adds a discrete agronomic benefit the farmer can observe. A modern maize platform might combine two herbicide-tolerance systems with above-ground and below-ground insect resistance, and the commercial logic is that each component defends a different part of the yield. The limit is regulatory: every event in a stack must be approved independently in every destination market, so the dossier burden grows combinatorially with the stack. This is the quiet reason the majors consolidate events into a small number of preferred platforms rather than proliferating combinations.
RNA interference and novel modes of action. RNAi-based traits represent the most significant departure from the protein-expression model that has dominated since the 1990s. Because the mechanism is sequence-specific silencing rather than expression of a bacterial protein, it opens targets — particularly coleopteran pests such as corn rootworm — where Bt resistance has become a genuine agronomic problem. The commercial significance is that RNAi traits are new events with fresh patent life, which means they earn full royalty rather than competing with expiring ones. Novel modes of action are also the answer to the resistance cycle described elsewhere in this report: the value of a tolerance trait is a function of how long the chemistry it protects remains effective.
Gene editing and base editing. Gene editing is the segment with the widest spread between present size and potential. Gene-edited and NGT-derived seed was 1.3% of 2025 value, but it is forecast to grow at 16.3% a year to 2033 — faster than any other segment in this report. The technical distinction that matters commercially is that editing can deliver traits which are genuinely hard to obtain by transgenesis: targeted disease resistance, altered fatty acid profiles, reduced browning, improved nitrogen use, and drought response mediated by native gene regulation rather than an introduced protein. Base editing extends this to single-nucleotide changes, which is precisely the category that regulatory frameworks find hardest to classify. The EU’s category 1 equivalence criteria, operational from July 2028, are effectively a test of how much of this technology can escape a full GMO dossier.
Drought and nitrogen-use efficiency. These are the traits with the clearest economic logic for the farmer and the longest development history. Their value is proportional to input price volatility and water scarcity, both of which have trended adversely for growers across the period. Adoption remains modest because the phenotypes are hard to prove consistently across environments — a drought trait that fails in a wet year is a trait the farmer will not buy twice — but the pipeline visibility is better than for any other category, and the addressable area is the whole of the world’s maize and wheat.
Digital trait selection and phenotyping. The least visible and most consequential change is in how events are selected before they ever reach a field trial. High-throughput phenotyping, genomic prediction and multi-environment trial analytics have compressed selection cycles and, more importantly, reduced the rate at which expensive events fail late. Corteva, Bayer and Syngenta all operate proprietary trial networks whose real asset is the dataset, not the germplasm. This is why the barrier to entry at the discovery layer has risen even as the barrier to selling GM seed has fallen.
Signals
Three signals are worth tracking. The 2026 Corteva-Bayer resolution brought forward triple-stack maize trait availability for out-licensing by roughly five years, to as early as 2027, and advanced third-generation above-ground insect traits by about two years — a rare case of a legal settlement accelerating a technology timeline. Corteva has stated that as a standalone seed company it intends to grow through gene editing, biofuels, hybrid wheat, expanded crop offerings and out-licensing. And in China, the trait pipeline is now deep enough to support area targets rather than merely to justify pilots: 239 approved varieties in four batches since December 2023, with state-linked platforms holding five transformation event safety certificates of their own.
Strategic Implications
The strategic conclusion is that technology has become a portfolio allocation question rather than a research question. A company can spend on incremental stacking and defend existing royalty, or spend on gene editing and compete for a category that does not fully exist yet. The two require different regulatory strategies, different partner networks and different capital horizons. The parties best positioned are those with both — an established event platform generating cash, and an editing pipeline positioned to exploit category 1 equivalence if it proves workable. The parties worst positioned are those with a single mature event family and no editing capability, because their royalty base expires without replacement.
Forward Outlook
By 2033 this report expects gene-edited and NGT-derived seed to reach 2.8% of market value, from 1.3% in 2025 — a modest share of the total but a 16.3% annual growth rate and a materially different competitive field. The assumption most likely to be wrong is the European timeline: if category 1 verification proves administratively workable and is adopted as a template elsewhere, gene-edited share would materially exceed the forecast. The assumption least likely to be wrong is that stacking continues, because every commercial incentive in the chain points toward it.
Market Risk
Market Risks and Outlook
Overview
This market’s risk profile is unusual in that its largest risks are legal and regulatory rather than agronomic or cyclical. Demand for GM seed is anchored in demonstrated farm-gate economics and does not disappear in a downcycle; what disappears, and disappears quickly, is the legal right to sell a particular technology. The 2025 US dicamba label vacatur is the reference case: within a single fiscal year it contributed to an 8% decline in Bayer’s soybean seed and traits revenue and a 23% decline in cotton.
Current Scenario
Demand-side risks. The primary demand risk is not rejection of GM technology but compression of the price premium in markets where trait exclusivity has expired. In Brazil and Argentina, generic competition in herbicide tolerance has already compressed pricing, and Syngenta explicitly cited intensified generic competition challenging profitability in Brazil during 2025. A secondary demand risk sits in the export channel: when a destination market has not approved an event, the crop can be grown but not shipped without segregation, which functions as a demand ceiling rather than a cost.
Seed production and supply risks. GM seed is multiplied in counter-season geographies and is materially harder to produce than conventional seed, with isolation distances, purity tolerances and tight production windows. A single adverse season in a key multiplication area can constrain supply of a specific hybrid for two years. Concentrating production in a small number of provinces — as China now does in Gansu — improves logistics and raises single-point-of-failure risk simultaneously.
Regulatory and trade risks. This is the dominant risk category. Asynchronous approval means the portfolio is only as valuable as its weakest significant market. Herbicide label litigation can remove a chemistry and devalue the tolerance trait built around it. And the European position, though improving, is not resolved: Regulation (EU) 2026/1388 applies from 17 July 2028, and until the delegated and implementing acts on category 1 verification are adopted, the practical requirements are unknown. A company that built a European strategy on the regulation’s passage has an assumption, not a plan.
Competitive and intellectual property risks. The 2026 Corteva-Bayer resolution reduced litigation risk for two of the four majors but did not eliminate the underlying patent thicket. Licensing widens access, which is positive for the market and negative for brand premium: more licensees selling the same event into the same geography compresses the retail margin even as it expands the event owner’s royalty base. For mid-sized seed companies, that is the specific mechanism by which a wider licensing market hurts rather than helps.
Signals
Four risk signals are live. The dicamba vacatur has already cost two of the four majors material revenue and remains the template for what a single legal outcome can do. Syngenta’s 2025 volume decline of 0.5% alongside a price gain of only 1.3% shows how thin pricing power is where competition is generic. Bayer’s cotton seed and traits revenue fell 23% in a year in which the global GM cotton area fell only 3.8% — a gap that is almost entirely regulatory rather than agronomic. And the EU timeline has a two-year implementation gap between entry into force and application, during which the existing GMO rules still govern every NGT product.
Strategic Implications
The correct response to this risk profile is portfolio diversification across chemistries, crops and jurisdictions rather than across geographies alone, because two jurisdictions with the same regulatory framework provide no diversification at all. The second implication is that herbicide-tolerance traits should be underwritten with a shorter asset life than their patent term, since the label that gives them value can be withdrawn independently. The third is that the market’s growth is genuinely more robust than its volatility suggests: 216.0 million hectares of adoption is not reversible, and farmers who have adopted stacked traits for resistance management do not revert to conventional seed while the resistance problem persists.
Forward Outlook
The base case remains USD 41.37 billion by 2033 at 5.90%, with the downside scenario anchored on a US herbicide label shock larger than 2025’s and the upside anchored on faster Chinese conversion plus a workable European category 1 pathway. The watch list for the next twenty-four months is short and specific: China’s 2027 area target and whether trait approval keeps pace; the EU delegated and implementing acts due by 17 July 2028; whether triple-stack maize traits reach out-licensing in 2027 as signalled; completion and terms of the Corteva separation; any further US herbicide label litigation; and the first commercial-scale gene-edited row-crop launches outside North and South America. None of these is agronomic. All of them are legal, regulatory or structural — which is the defining characteristic of risk in this market.
Regulatory Landscape
Regulatory Landscape
Overview
Regulation is not a constraint on this market; it is the market’s primary organising structure. Two products with identical agronomic performance can differ in commercial value by an order of magnitude depending on which jurisdictions have approved the event and whether those approvals are synchronous. Asynchronous authorisation creates the single largest avoidable cost in the chain: a trait approved in Brazil but not in the destination export market is a trait that can be grown but not sold into that market without segregation, and segregation is rarely economic at commodity scale.
Current Scenario
Approval pathways. The three significant regimes behave differently. The United States operates a notification and exemption framework administered by USDA APHIS alongside EPA and FDA review, and remains the fastest and least discretionary route to market. Brazil’s CTNBio combines scientific review with a comparatively predictable timeline and has made the country a first-launch market rather than a follower. China runs a three-part chain — biosafety certificate, variety approval and, for herbicide-tolerant events, chemistry registration — and the completion of that chain in 2024 is what converted two years of demonstration into 2026’s routine commercial planting. The European Union approved essentially no new cultivation events in the period, and its import approvals remain slow enough to be a recurring trade irritant.
The EU NGT Regulation. Regulation (EU) 2026/1388 was adopted by the European Parliament and the Council on 17 June 2026, entered into force on 16 July 2026, and applies from 17 July 2028. It establishes two categories. Category 1 NGT plants meet defined equivalence criteria and are treated broadly like conventionally bred plants, with a verification procedure rather than a full risk assessment. Category 2 plants remain within the GMO regime with specific adaptations. Between now and July 2028 the existing GMO rules continue to apply to all NGTs, and no crop developed exclusively through NGTs is authorised for food or feed in the EU today. The delegated and implementing acts that will make category 1 verification operational are due by 17 July 2028, as is EFSA’s guidance.
Intellectual property. The patent and plant variety right interface is where commercial friction concentrates. Utility patents on event sequences and methods coexist with breeders’ exemptions and, in some jurisdictions, farmer saved seed privileges, and the boundary between them is litigated rather than settled. The 2026 Corteva-Bayer resolution explicitly expanded freedom to operate across maize, canola and cotton — a reminder of how constraining the patent thicket had become for two parties that are both major patent holders.
Trade documentation and labelling. The Cartagena Protocol on Biosafety underpins documentation requirements for transboundary movement, and destination-market labelling thresholds drive the practical segregation burden. Thresholds that vary between 0.9% and 5% across importing countries mean the same shipment can be compliant in one market and non-compliant in another, which pushes cost back up the chain into identity-preserved logistics.
Signals
Four regulatory facts define the period. The EU regulation is in force but not yet applicable, which makes Europe a 2028 event rather than a 2026 one, and explains why Europe is 0.6% of this market. China approved 239 varieties across four batches and shifted to nationwide commercial planting in 2026 with GM maize penetration near 9%. Argentina approved 13 new events across 2024-2025 and now has 91 approved events, with GM soybean covering almost all of its 16.5 million hectare crop. And in the United States, a single label vacatur removed dicamba as a usable chemistry in 2025, cutting Bayer’s soybean seed and traits revenue 8% and cotton 23% in the same year.
Strategic Implications
The most important implication is that regulatory scope is a portfolio decision, not a compliance cost. A company building a trait for the Americas can size the investment against a relatively predictable approval path; the same trait aimed additionally at Europe carries a 2028 start date and unquantified category 1 verification requirements. This is why the EU regulation should be read as an option with a known expiry of uncertainty rather than as an opening: the value is real, but it cannot be booked into a 2026-2027 forecast. The second implication is that herbicide-tolerance traits carry a regulatory dependency that insect-resistance traits do not, because a tolerance trait is only as valuable as the label permitting the chemistry it tolerates. Investors who model trait portfolios without modelling the chemistry labels are modelling half the risk.
Forward Outlook
The forecast assumes no significant European cultivation before 2029 and only marginal after, that China’s approval throughput continues at or above its 2023-2026 pace, and that asynchronous approvals remain a structural cost rather than a resolved problem. The regulatory variable with the largest spread is the United States: further herbicide label litigation would remove value from tolerance traits across all four majors at once, while a settled label environment would stabilise the segment that took the 2025 hit. The regulatory variable with the largest upside is Europe after 17 July 2028 — not because European cultivation will become large, but because category 1 equivalence, once operational, gives gene-edited traits a path to market that does not require a GMO-style dossier anywhere.