
Global EV Battery Market Report, Size & Forecast 2026-2033
Global EV Battery Market Forecast Snapshot 2026-2033
| Metric | Value |
|---|---|
| Base Year | 2025 |
| Base Year Market Size | 91.7 billion USD |
| Forecast Window | 2026 – 2033 |
| Market Direction | Strong positive |
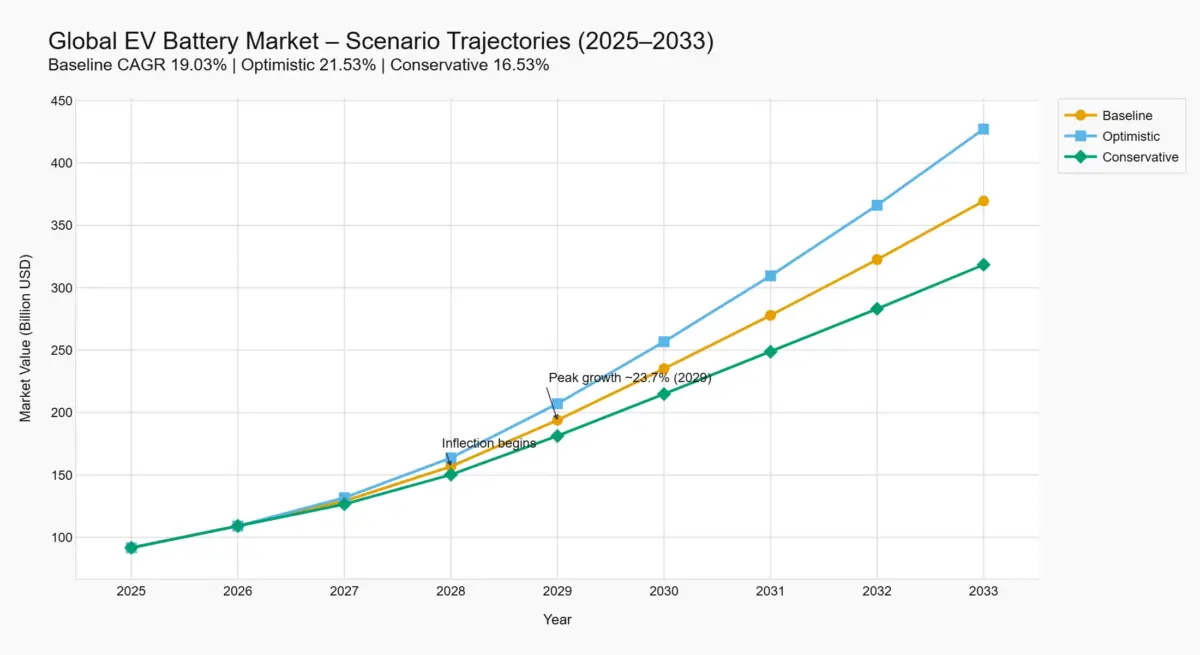
| Baseline CAGR | 19.03% |
| Baseline Endpoint (2033) | 369.5 billion USD |
| Optimistic CAGR | 21.53% |
| Conservative CAGR | 16.53% |
| Growth Shape | Front-loaded; peak annual growth ~23.7% in 2029 (baseline) |
| Largest Region (indicative) | Asia Pacific (China, Japan, South Korea dominate cell manufacturing) |
| Fastest Growing Region (indicative) | North America and Europe (policy-driven capacity localization) |
| Top Segment by Share (indicative) | Lithium-ion battery cells (largest value tier) |
| Key Trends | Front-loaded capacity investment, vertical integration by OEMs, LFP chemistry shift, regulatory compliance costs |
| Future Focus | Supply chain localization, battery passport compliance, next-generation chemistry diversification |
Companion analysis. The materials concentration behind this forecast is argued separately in Ninety-Six Thousand Six Hundred Tonnes Is a Policy Number, which reads the ARECOMS cobalt allowance as a quota rather than a scarcity problem — 20,000 tonnes worth about USD 1.1 billion at risk against 96,600 tonnes, 20.70 per cent of the annual allowance — and sets it beside the anode, refining and nickel chokepoints that are governed by entirely different instruments.
Companion analysis. What the 19.03 per cent does and does not contain is worked through in Four Times the Market, Half the Material Share, which separates the value claim from the volume implied by it, shows LFP cathode falling from 9.05 to 4.33 per cent of this market, and traces the 2029 acceleration back to an announced capacity schedule.
Companion analysis. The distance between this model and the realised run rate is separated in The Market Grew 16.3 Per Cent. Four Suppliers Grew 36., which sets January to May 2026 installations growth of 16.3 per cent against the 19.03 per cent baseline, shows CALB, Gotion, Eve and Svolt compounding at 35 to 37 per cent while LG Energy Solution, SK On and Panasonic lost share, reproduces the incumbent share moves from the denominator to test them, and reports that the report's own challenger volumes (73.0 GWh) were 11.4 GWh short of the 84.4 GWh total the report originally stated — an error since corrected on the report itself.
Market Overview and Scenario Framework
The global EV battery market is Scoped as lithium-ion cells, modules, and packs used in electric vehicles including passenger cars, two-wheelers, three-wheelers, buses, and trucks for the period 2026–2033. The market was Estimated at a market size of 91.7 billion USD in 2025.
EV Battery Market Expected trajectory
1: Baseline scenario (CAGR 19.03%): the market reaches 369.5 billion USD by 2033, driven by front-loaded capacity investment, supportive regulation, and technology maturation.
2: Optimistic scenario (CAGR 21.53%): assumes faster technology adoption and accelerated policy support without material delays.
3: Conservative scenario (CAGR 16.53%): reflects risks from upstream supply concentration, Chinese equipment dependency, and regulatory compliance hurdles that could delay ramp-ups and compress margins.
All three scenarios share a front-loaded growth shape: annual growth accelerates from 18.27% in 2027 to a peak of 23.67% in 2029 under the baseline, then decelerates as the market matures and risk factors exert increasing negative drag.
Key Takeaways
-
-
- The market is projected to grow from 91.7 billion USD in 2025 to 369.5 billion USD by 2033 under the baseline scenario, with a front-loaded peak near 24% in 2029.
-
-
-
- Announced capacity expansions from Samsung SDI, Volkswagen, LG-Honda, Umicore, and Albemarle collectively support the early ramp; most facilities begin production between 2024 and 2027, aligning with the modeled acceleration in 2027–2029.
-
-
-
- Upstream risks represent the largest unmodelled downside: DRC supplies ~70% of cobalt, China controls >90% of graphite processing and 60–70% of lithium refining, and Chinese suppliers dominate cell production equipment.
-
-
-
- The EU Battery Regulation’s compliance timeline – battery passport by February 2027, recycled content targets from 2031 – adds fixed costs not factored into the growth rates.
-
Year-by-Year Market Growth projections
| Year | Market Value (Billion USD) | Annual Growth Rate (%) |
|---|---|---|
| 2025 | 91.7 | — |
| 2026 | 109.15 | 19.03 |
| 2027 | 129.09 | 18.27 |
| 2028 | 156.80 | 21.46 |
| 2029 | 193.91 | 23.67 |
| 2030 | 235.19 | 21.29 |
| 2031 | 277.95 | 18.18 |
| 2032 | 322.56 | 16.05 |
| 2033 | 369.50 | 14.55 |
The front-loaded shape is a direct result of early capital expenditure commitments, technology ramp-up, and value-chain investments that concentrate positive momentum in the 2027–2030 window. Under the optimistic scenario, the peak growth rate reaches 26.54% in 2029; under the conservative scenario, 20.64% in the same year.
Capacity Expansion Pipeline and Driver Alignment
for the EV Battery Market Forecast early acceleration is underpinned by a wave of announced capital commitments from battery manufacturers and automotive OEMs. The following table summarizes the major supply-side projects drawn from company announcements and industry news.
| Company / JV | Location | Capacity | Investment | Production Start | Forecast Year Most Directly Affected |
|---|---|---|---|---|---|
| Samsung SDI | Seremban, Malaysia | Not disclosed (21700 cells) | 1.7 trillion won (~1.3 billion USD) | 2024 | 2027–2028 (ramp-up) |
| Volkswagen (PowerCo) | Salzgitter, Germany | 20 GWh (expandable to 40 GWh) | ~2 billion EUR | End of 2025 | 2027–2029 |
| LG-Honda JV (L-H Battery) | Ohio, USA | 40 GWh | 3.5–4.4 billion USD | End of 2025 | 2027–2029 |
| Umicore | Loyalist, Ontario, Canada | 35 GWh equivalent (CAM) | 1.27 billion EUR (0.69 billion after grants) | End of 2025 (commissioning) | 2027–2029 |
| GM–LG Ultium Cells (now LG-owned) | Lansing, Michigan, USA | 50 GWh | ~2.6 billion USD | Under construction since 2022 | 2027–2029 |
| Mitsubishi Chemical | Kagawa, Japan | 11,000 tons/yr anode material | Not disclosed | October 2026 | 2027–2030 |
| Albemarle | Chester County, South Carolina, USA | 50,000–100,000 mt/yr LiOH | At least 1.3 billion USD | Target 2024–2025 | 2027–2030 |
Risks, Assumptions, and Limitations
While the evidence supports a strong positive outlook, the forecast trajectory is conditional on several structural risks and unresolved assumptions.
Upstream Concentration
The DRC supplies approximately 70% of global cobalt; a customs platform failure in July 2026 threatened to block up to 20,000 metric tons of cobalt exports worth 1.1 billion USD. China controls more than 90% of spherical graphite output and 60–70% of lithium chemical refining. Indonesia’s nickel processing share jumped to about 60% in 2024. These single-point-of-failure risks are not fully modeled in the growth rates.
Equipment Dependency on China
Chinese suppliers dominate battery cell production equipment – coating, calendaring, slitting, and winding machinery. The Carnegie Endowment for International Peace reports that Chinese cell manufacturing capacity could reach at least 5,862 GWh by 2030, more than triple the combined OECD capacity. Any escalation in trade restrictions could stall Western gigafactory timelines.
EU Regulatory Compliance Costs
The EU Battery Regulation mandates a Digital Product Passport by 18 February 2027, recycled content targets for cobalt (16%), lithium (6%), and nickel (6%) from 2031, and material recovery obligations. Consultancy fees for compliance run to 80,000–120,000 EUR per manufacturer, with internal staff costs of 60,000–80,000 EUR. These costs are not explicitly factored into the forecast.
Table of Contents
- 1. Forecast Snapshot (USD Billion), 2025–2033
- 2. Market Overview and Scenario Framework
- 3. Year-by-Year Market Growth Projections (2025–2033)
- 4. Capacity Expansion Pipeline and Driver Alignment
- 5. Risks, Assumptions and Limitations
- 6. Competitive Landscape
- 7. Value Chain
- 8. Investment Activity
- 9. Technology & Innovation
- 10. Market Risk
- 11. Regulatory Landscape
Competitive Landscape
Global EV Battery Market Competitive Landscape
Key Takeaways
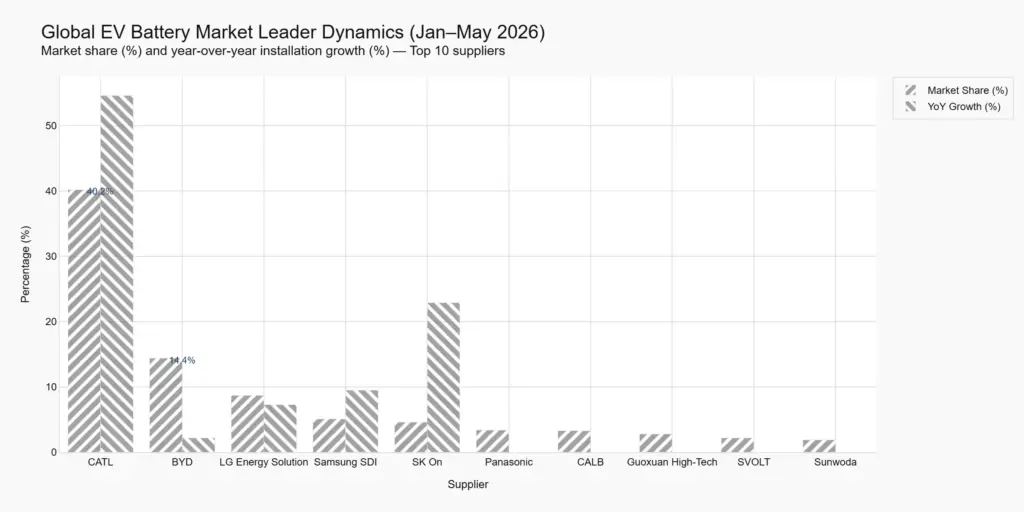
- CATL holds a commanding 40.2% global share, expanding its lead through installations growth of 22.9% year-on-year.
- Seven Chinese suppliers now collectively control 72.6% of global installations, up 2.1 percentage points from the prior year.
- Korean and Japanese suppliers lost share despite mixed absolute volume performance; SK On and Panasonic registered absolute declines in installations.
- Second-tier Chinese firms (CALB, Gotion, Eve Energy, Svolt) each grew rapidly: CALB +36.3%, Gotion +37.0%, Eve Energy +35.2%, Svolt
- Korean suppliers are mounting a strategic response through large-scale OEM partnerships in Western markets, notably the LG Energy Solution–Tesla LFP deal in Michigan and the Samsung SDI–Volkswagen unified cell contract in Hungary.
Chinese Consolidation at the Top
Industry data for January–May 2026 shows that CATL continued to strengthen its leading position in the EV battery market. The company recorded 188.4 GWh of battery installations, representing a 22.9% year-on-year increase. This was significantly higher than the overall market growth of 16.3%, which reached 469.2 GWh during the same period. As a result, CATL’s market share increased to 40.2%, compared with 38.0% in the corresponding period a year earlier.
BYD remained in second place, with 67.6 GWh of installations. However, its installations grew by just 0.4%, well below the overall market growth rate. This caused BYD’s market share to decline from 16.7% to 14.4%.
Together, CATL and BYD accounted for 54.6% of global EV battery installations during January–May 2026, highlighting the strong concentration among the leading suppliers. The competitive gap becomes even more pronounced when the other five Chinese companies in the global top ten are included. Chinese battery manufacturers collectively held 72.6% of global EV battery installations, putting continued pressure on battery producers outside China.
| Rank | Company | Country | Market Share (%) | Installations (GWh) | YoY Change (%) |
|---|---|---|---|---|---|
| 1 | CATL | China | 40.2% | 188.4 | +22.9% |
| 2 | BYD | China | 14.4% | 67.6 | +0.4% |
| 3 | LG Energy Solution | South Korea | 8.7% | 41.0 | +7.3% |
| 4 | CALB | China | 5.1% | 23.8 | +36.3% |
| 5 | Gotion High-tech | China | 4.6% | 21.7 | +37.0% |
| 6 | SK On | South Korea | 3.4% | 15.8 | -5.8% |
| 7 | Eve Energy | China | 3.3% | 15.4 | +35.2% |
| 8 | Panasonic | Japan | 3.2% | 15.1 | -8.5% |
| 9 | Svolt | China | 2.6% | 12.1 | +35.3% |
| 10 | Sunwoda | China | 2.4% | 11.4 | +13.8% |
| — | Others | — | 12.1% | 56.8 | — |
| Total | 469.2 | +16.3% |
Erosion of Korean and Japanese Incumbents
Chinese suppliers are putting increasing pressure on established battery manufacturers, and this is clearly reflected in the declining market positions of LG Energy Solution, SK On, and Panasonic. LG Energy Solution remained in third place with 41.0 GWh of installations, representing a 7.3% year-on-year increase in volume. However, this growth was much slower than the overall market growth of 16.3%, causing its market share to fall from 9.5% to 8.7%. Industry sources link the limited growth in LGES’s market share to the rapid expansion of Chinese competitors, along with fluctuations in demand from its major automotive customers, including Tesla, Hyundai Motor Group, GM, and Volkswagen.
SK On faced a more significant decline, with installations falling 5.8% year-on-year to 15.8 GWh. As a result, its market share dropped from 4.1% to 3.4%. Panasonic also saw its position weaken, with installations declining 8.5% to 15.1 GWh and its market share falling from 4.1% to 3.2%. The decline in Panasonic’s installations was directly linked to slower sales growth from one of its key customers.
The falling market shares of LG Energy Solution, SK On, and Panasonic highlight the broader competitive shift taking place in the EV battery market, as Chinese suppliers continue to gain ground against established Korean and Japanese manufacturers.
The Second Chinese Wave
Beyond CATL and BYD, a cohort of Chinese suppliers is growing at rates that far exceed the market average, placing additional strain on incumbents. In the January–May 2026 period, CALB (23.8 GWh, +36.3%), Gotion High-tech (21.7 GWh, +37.0%), Eve Energy (15.4 GWh, +35.2%), and Svolt (12.1 GWh, +35.3%) each demonstrated robust momentum.
These four firms are not marginal players; they have secured relationships with major original equipment manufacturers. CALB supplies XPeng, Nio, and Leapmotor, while Gotion is backed by Volkswagen as a strategic partner. The combined installation volume of CALB, Gotion, Eve, and Svolt reached 84.4 GWh, which exceeds the 56.8 GWh total delivered by LG Energy Solution and SK On combined. This indicates that competition for the remaining non-Chinese market share is intensifying from multiple directions rather than solely from the market leader.
Strategic Partnerships and Supply Chain Realignment
As Chinese suppliers continue to lead the market through large-scale production, Korean battery manufacturers are taking a more targeted approach. Instead of competing only on volume, they are focusing on high-value partnerships that can secure long-term demand in Western markets while also taking advantage of local policy support.
LG Energy Solution signed a $4.3 billion supply agreement with Tesla in March 2026, which was confirmed by the U.S. government. Under the agreement, LG Energy Solution will manufacture lithium iron phosphate (LFP) prismatic cells at its facility in Lansing, Michigan. The facility was originally developed as a joint venture with General Motors, but GM later withdrew from the project. The cells will be supplied for Tesla’s Megapack 3 energy storage systems, which are produced in Houston. Production is expected to begin in 2027. The deal was announced as part of broader $56 billion in private sector commitments highlighted by the U.S. administration at the Indo-Pacific Energy Security Summit.
Samsung SDI is taking a similar approach in Europe after securing a contract to supply Volkswagen Group’s standardized “Unified cell.” Production will come from Samsung SDI’s Göd, Hungary facility, where the company is converting two existing lines at Hungary Plant 1 to meet Volkswagen’s prismatic cell specifications. The required equipment has already been installed.
Mass production is expected to start in 2027, with capacity estimated to be in the double-digit gigawatt-hour range. Samsung SDI will be the third supplier for Volkswagen’s unified cell platform, alongside Gotion High-tech and PowerCo. The company expects EV battery demand in Europe to grow more than 10% in 2026 and has also indicated plans to increase utilization at its Hungarian plant to above 70% in the second half of 2026.
Taken together, these deals show a clear shift in strategy among Korean battery manufacturers. Rather than trying to match Chinese suppliers purely through production scale, Korean companies are securing localized production capacity linked to specific customers, platforms, and battery chemistries. This approach gives them a way to build more stable demand while strengthening their position in key Western markets.
Value Chain
Value Chain: Global EV battery Market
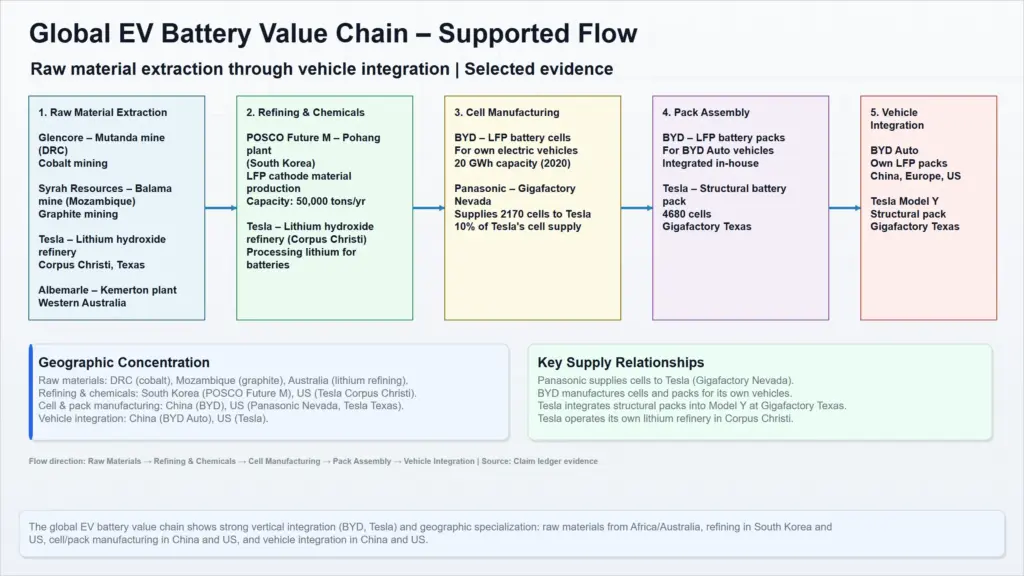
The global EV battery value chain covers raw material extraction and refining, component manufacturing, battery cell and pack assembly, and integration into electric vehicles or stationary storage systems. Based on the available evidence, the supported part of the chain runs from lithium and cobalt mining through lithium hydroxide refining and LFP cathode production, followed by cell manufacturing and structural pack integration, and finally electric vehicle assembly. Key relationships include BYD’s vertically integrated production of LFP batteries for its own vehicles, Tesla’s in-house lithium refining and structural pack assembly, and Panasonic’s long-standing cell supply relationship with Tesla.
The value chain also shows clear geographic concentration, with cobalt extraction in the Democratic Republic of Congo, graphite mining in Mozambique, and lithium refining in Texas and Western Australia. Several upstream mines and refineries feed these downstream battery and vehicle manufacturers, but the available information does not cover the entire value chain. Activities such as nickel and manganese processing, electrolyte and separator production, battery management software, and end-of-life battery recycling are not supported by the available evidence.
Evidence‑backed implications
Vertical integration in cell and pack production. BYD manufactures lithium‑iron‑phosphate (LFP) battery cells and packs for its own electric vehicles, including the Han EV launched in 2020. The company’s Chongqing plant, which broke ground in 2019 and reached 20 GWh annual capacity with an investment of CN¥10 billion, produces long, flat blade‑shaped cells that are packed directly into a honeycomb structure without intermediate modules. This design reduces parts count and integrates into a Cell‑to‑Body architecture where the battery becomes part of the vehicle frame. Tesla similarly integrates its structural battery pack into the Model Y at Gigafactory Texas, using 4680‑format cells that serve as the vehicle floor. The pack attaches front and rear gigacastings with only 38 bolts, simplifying assembly and improving structural rigidity. Both approaches shorten the chain from cell to vehicle and reduce assembly complexity.
Cell supply dependency and refinery capacity. Panasonic supplies lithium‑ion battery cells to Tesla from the jointly operated Gigafactory Nevada, governed by a 2020 pricing agreement that spans capacity commitments and technology plans. In 2023 Panasonic announced a 10% production boost by adding a 15th line, aiming for completion by March 2026. Meanwhile, Tesla operates its own lithium hydroxide refinery in Corpus Christi, Texas — the first spodumene‑to‑lithium hydroxide refinery in North America — using an acid‑free process that began production in 2025. This facility gives Tesla direct control over a critical upstream input, reducing reliance on external refiners. Conversely, Albemarle idled its Kemerton lithium hydroxide refinery in Western Australia in 2026, placing the remaining train into care and maintenance after a period of low lithium prices. Kemerton had processed spodumene from the Greenbushes mine and was originally designed to produce up to 100,000 tonnes per year across four trains. The contrasting fortunes of these two refineries illustrate how cost structures and market conditions shape upstream value capture.
Raw material concentration and supply risk. Glencore operates the Mutanda copper‑cobalt mine in the Democratic Republic of Congo, which together with KCC produced 36,100 tonnes of cobalt in 2025. The DRC introduced an export quota system in late 2025 that constrained exports; Glencore prioritised copper over cobalt, stockpiling finished cobalt inventories. For 2026‑2027, Mutanda’s cobalt export quotas are set at reduced levels. This single‑country dependency introduces policy risk and potential supply bottlenecks. Similarly, Syrah Resources operates the Balama graphite mine in Mozambique, which resumed production in June 2025 after a year‑long shutdown. Balama achieved a 23 kt per month average daily production rate post‑restart, and Syrah is building a downstream active anode material facility in the United States (Vidalia). Both cobalt and graphite are essential for most EV battery chemistries, and the evidence shows that their supply chains are concentrated in politically sensitive regions.
LFP cathode production expansion. POSCO Future M has broken ground on a dedicated LFP cathode material plant in Pohang, South Korea, with mass production targeted for 2027 and eventual annual capacity up to 50,000 tons. This plant, a joint venture with Pino and C&G Al, targets the energy storage and entry‑level EV battery markets. It adds a new node in the value chain for LFP chemistries, which are valued for cost competitiveness and long cycle life. The expansion signals that LFP cathode production is shifting beyond China, though the evidence does not connect this plant to specific downstream customers.
| Stage | Participant | Activity | Geography | Status |
|---|---|---|---|---|
| Lithium mining & refining | Tesla | Operates spodumene‑to‑lithium hydroxide refinery | Corpus Christi, Texas, US | Operational (2025) |
| Lithium refining | Albemarle | Operated Kemerton lithium hydroxide refinery (now idled) | Kemerton, Western Australia | Placed into care & maintenance (2026) |
| Cobalt mining | Glencore | Operates Mutanda copper‑cobalt mine | Democratic Republic of Congo | Active, with export quotas through 2027 |
| Graphite mining | Syrah Resources | Operates Balama graphite mine | Mozambique | Active (resumed June 2025) |
| Cathode active material | POSCO Future M | Constructing LFP cathode material plant | Pohang, South Korea | Under construction; target production 2027 |
| Cell manufacturing | Panasonic | Supplies lithium‑ion cells to Tesla | Gigafactory Nevada, US | Ongoing; capacity expansion to +10% by March 2026 |
| Cell & pack manufacturing | BYD | Manufactures LFP cells and packs for own EVs (Blade Battery) | Chongqing, China (and others) | Mass production since 2020 |
| Pack integration | Tesla | Integrates structural battery pack into Model Y | Gigafactory Texas, US | Ongoing |
Investment Activity
Key Takeaways
-
- Government funding programs in the US, UK, Spain, and Argentina are providing substantial capital for battery manufacturing, recycling, and lithium processing, signaling strong policy support for domestic supply chains.
- Corporate investment is also expanding beyond conventional battery cell manufacturing. Companies are increasingly investing in areas such as thermal management and recycling infrastructure. Hyundai WIA, for example, has committed $334.5 million to integrated thermal management, while Gotion High-Tech is investing in recycling and cathode production in Spain.
- The Stryten-C&D Trojan acquisition will create a 15-plant US manufacturing network, underscoring consolidation as a strategy to achieve scale and supply security.
- BMW’s new high-voltage battery assembly plant in Bavaria and Fraunhofer FFB’s public research facility highlight Germany’s ambition to retain battery production within Europe.
- Argentina’s approval of a $709M lithium expansion by Chinese-owned Zijin Mining illustrates the growing role of resource-rich countries and foreign investment in upstream supply chain development.
Public Funding and Policy Catalysts
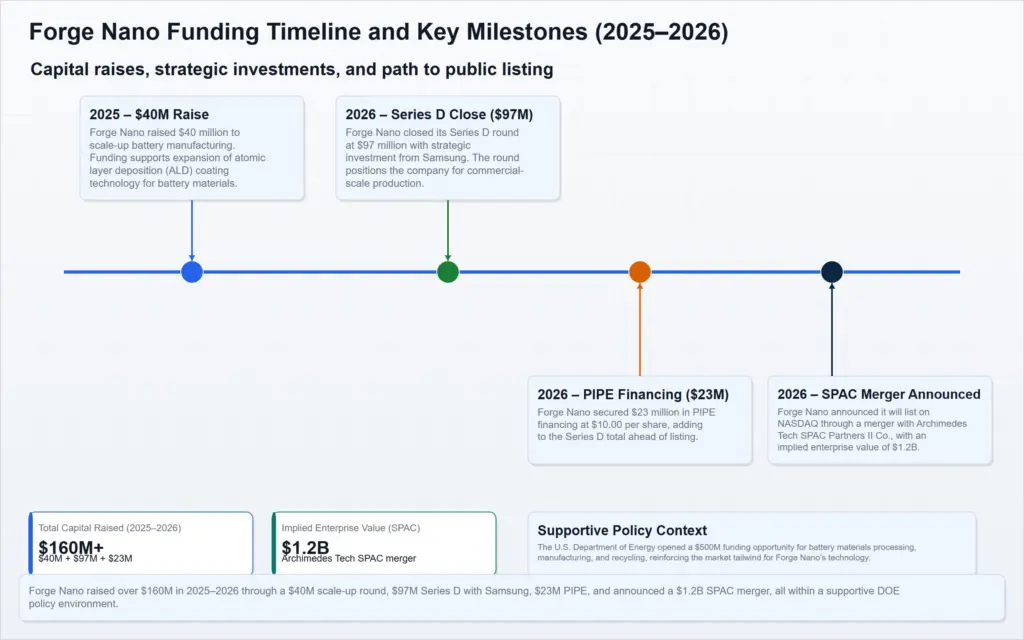
Government investment programs in 2026 are directing substantial capital into the EV battery value chain. The focus is not limited to battery cell production. Funding is increasingly being directed toward regional supply chain independence, domestic critical-material processing, battery recycling, component manufacturing, and early-stage research and innovation.
The United States, United Kingdom, Spain, Argentina, and Germany have all announced or advanced funding mechanisms targeting different parts of the EV battery supply chain. Together, these initiatives demonstrate the growing role of government policy in shaping battery manufacturing and investment decisions.
United States – $500 Million for Critical Materials and Battery Manufacturing
In March 2026, the U.S. Department of Energy’s Office of Critical Minerals and Energy Innovation issued a Notice of Funding Opportunity for up to $500 million to expand domestic critical mineral and materials processing, derivative battery manufacturing, and recycling.
The third round of the Battery Materials Processing and Battery Manufacturing and Recycling programs will support demonstration and commercial facilities covering materials such as lithium, graphite, nickel, and copper. The program also supports recycling of manufacturing scrap and end-of-life batteries.
The funding is open to projects across three topic areas:
-
- Domestic critical minerals processing from raw feedstocks
- Domestic critical materials recycling
- Domestic battery materials and component manufacturing
United Kingdom – £25 Million Battery Innovation Programme
Innovate UK, on behalf of the Department for Business and Trade, opened the Battery Innovation Programme’s Battery Innovation Concept Development Round 2 competition in April 2026.
Up to £25 million in grants is available for UK-registered businesses conducting collaborative R&D in battery-grade material technologies for electrification.
Projects must request between £500,000 and £4 million, run for 12 to 36 months, and start no earlier than October 2026.
The program is designed to support the development and scale-up of UK battery manufacturing capability. A consortium requirement also applies, with at least one UK-registered SME claiming grant funding required to participate.
Spain – PERTE-Backed Gotion Investment
The Spanish government approved a nearly €1 billion strategic investment by Chinese battery maker Gotion High-Tech in Valladolid for a battery cathode plant and recycling facility.
The project is valued at €950 million ($1.09 billion) and is supported by a €138 million public grant under the Strategic Projects for Economic Recovery and Transformation (PERTE) program for electric vehicles.
The project will be developed in two phases:
-
- Phase One: Budgeted at €411.5 million, this phase will target a recycling plant capable of processing up to 200,000 tonnes of battery material annually.
- Phase Two: Budgeted at €539.1 million, this phase will produce 200,000 tonnes of cathode material per year.
Construction is planned to begin in 2027.
Argentina – $709 Million Lithium Expansion Under RIGI
In July 2026, Argentina’s Committee for the Incentive Regime for Large Investments (RIGI) approved a $709 million investment by Liex, the Argentine subsidiary of China’s Zijin Mining, to expand the Tres Quebradas lithium project in Catamarca province.
As part of the second phase, the project will add a new processing plant with the capacity to produce 40,000 metric tons of lithium carbonate annually. The expansion will build on the first phase, which began production in September 2025 with a capacity of 20,000 metric tons per year.
Once the expansion is completed, the project’s total planned capacity is expected to reach between 60,000 and 80,000 metric tons annually, strengthening its position as a significant lithium production project in Argentina.
The project is also expected to have a broader economic impact. It is estimated to generate 4,406 jobs during construction and operation, while annual exports are expected to reach around $400 million.
Germany – Fraunhofer FFB Research Facility
The Fraunhofer Institute for Battery Cell Research and Production reached an important construction milestone in July 2026 with the topping-out ceremony for the FFB Fab battery cell production facility in Münster, North Rhine-Westphalia.
The federal government is providing up to €750 million, while the state is investing approximately €320 million, bringing the combined investment to about €1 billion.
The 39,000-square-meter site will house gigawatt-scale production research infrastructure.
The first phase, FFB PreFab, opened in 2024 as an open research factory. The second phase, FFB Fab, will include production facilities covering more than 20,000 square meters and is expected to become the nucleus of a strong European battery industry.
| Country / Programme | Funding amount | Focus area | Status |
|---|---|---|---|
| US DOE Battery Manufacturing & Recycling Grants | $500 million | Critical mineral processing, battery manufacturing, recycling | Announced (NOFO) |
| UK Battery Innovation Concept Development Round 2 | £25 million | Battery-grade material technologies, R&D | Open for applications (closes May 2026) |
| Spain – PERTE VEC grant for Gotion Valladolid | €138 million | Cathode production, battery recycling | Approved, construction planned 2027 |
| Argentina – RIGI incentive for Zijin Tres Quebradas | $709 million (private investment with RIGI benefits) | Lithium carbonate expansion | Approved, phase 2 planned |
| Germany – Fraunhofer FFB Fab (federal + state) | €750 million (federal) + €320 million (state) | Battery cell research and gigafactory-scale infrastructure | Under construction (topping-out July 2026) |
Corporate Capacity Expansion and Strategic Investment
Government programs are only one part of the investment picture. Direct corporate investments and acquisitions in 2026 are also reshaping the competitive landscape.These moves show that competition is expanding beyond battery cell chemistry and manufacturing capacity. Companies are increasingly investing in thermal management, recycling, vertical integration, and manufacturing consolidation as they seek greater scale and supply security.
Hyundai WIA – 500 Billion Won in Integrated Thermal Management
Hyundai WIA has unveiled a plan to invest 500 billion won, or approximately $334.5 million, to expand its integrated thermal management system business. The investment will support the development and production of advanced heating and cooling systems for electric vehicles. It will also cover battery thermal management technologies.
Of the total investment, 200 billion won ($133.8 million) will be allocated to the Changwon plant. This funding will be used to expand thermal management production lines by 2030.
Another 180 billion won ($120.4 million) will be directed toward eco-friendly research and development. The remaining 120 billion won will be used to establish and strengthen Hyundai WIA’s overseas bases.
Hyundai WIA already supplies the cabin air-conditioning and heater system for Kia’s purpose-built PV5 vehicle. The company also operates a thermal management test facility in Uiwang, Gyeonggi Province. The facility was completed in 2023.
The investment reflects Hyundai WIA’s view that thermal management is becoming a more important part of electric vehicle technology. As EV adoption increases, efficient heating and cooling systems are becoming increasingly important for both vehicle performance and battery management.
Stryten Energy Acquires C&D Trojan
In July 2026, Stryten Energy announced the acquisition of C&D Technologies and Trojan Battery Company (C&D Trojan) as part of its strategy to expand global battery manufacturing capabilities and strengthen U.S. energy security. The transaction is expected to close in the third quarter of 2026, subject to regulatory approvals, and will create a combined company operating 15 battery and component manufacturing facilities across the United States with a workforce of approximately 3,700 employees.
Following the acquisition, the enlarged network will also include operations in Mexico and China, along with offices across Europe and Asia, giving Stryten a broader international manufacturing and operating footprint. Financial terms were not disclosed, while the company plans to increase its capacity for absorbent glass mat (AGM) batteries, which are used in start-stop and hybrid vehicles, telecommunications, and data centers.
The acquisition reflects a broader consolidation strategy, allowing Stryten Energy to increase manufacturing scale while strengthening vertical integration across its battery operations and improving its ability to serve multiple end-use markets.
BMW – High-Voltage Battery Assembly Plant in Bavaria
BMW Group is constructing a dedicated high-voltage battery assembly plant in Irlbach-Strasskirchen, Lower Bavaria, to support the launch of its Neue Klasse electric vehicles. The project is progressing rapidly, and by mid-2026, all 1,066 pillars of the central production building had been erected, just 16 weeks after the official start of construction in June 2024.
Once operational, the plant will supply battery packs to BMW vehicle assembly plants in Dingolfing, Regensburg, and Munich, supporting the company’s transition toward a fully electric vehicle portfolio. The project is also part of BMW’s broader strategy to retain approximately 30,000 jobs in the region while preparing its manufacturing network for the shift to electric mobility.
The project moved through the approval process quickly, with the building permit process completed in April 2024, making it one of the fastest such processes in Germany. While the investment amount has not been disclosed, the scale of the construction and the planned role of the facility indicate a significant commitment to high-voltage battery assembly and BMW’s future electric vehicle production.
Gotion – €950 Million Spain Project (Corporate-Led)
Gotion High-Tech’s Valladolid project, enabled by the PERTE grant, represents a €950 million corporate investment in a cathode plant and recycling facility. The company, whose single largest shareholder is the Volkswagen Group, aims to begin construction in 2027. The recycling plant (Phase One, €411.5 million) will have capacity to process up to 200,000 tonnes of battery material per year. The cathode plant (Phase Two, €539.1 million) will produce 200,000 tonnes of cathode material annually. The project is described by the Spanish Transport Minister as featuring unique technology within the European Union.
These corporate moves, alongside public funding, indicate that the investment landscape is broadening from pure cell manufacturing to include thermal management, recycling, and consolidation. However, notable gaps remain: no investments by leading Chinese cell manufacturers (CATL, BYD) beyond Gotion are captured, and no commitments to solid-state or sodium-ion battery production have been disclosed in this packet.
The 2026 EV battery investment landscape covers government funding, corporate investments, acquisitions, new facilities, and capacity expansion across the global battery value chain. The analysis includes investment size, project status, location, partners, and capacity impact across raw materials, components, cell manufacturing, pack assembly, recycling, and thermal management.
Technology & Innovation
Technology & Innovation : Global EV Battery Market
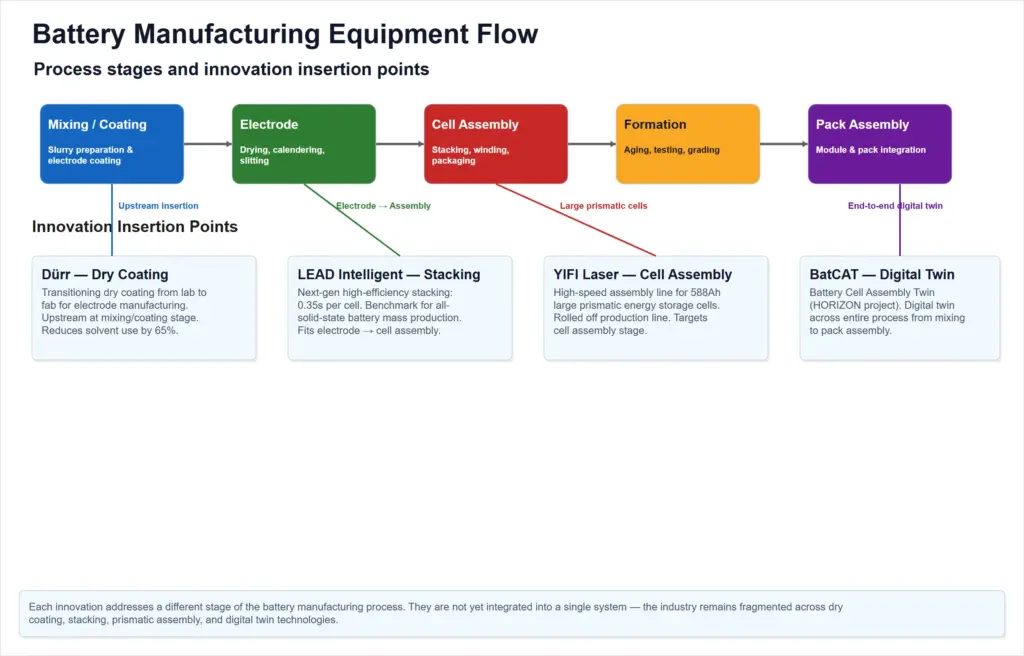
Battery Cell Manufacturing Infrastructure
The Fraunhofer FFB facility in Münster, Germany exemplifies large-scale public investment in European battery cell R&D infrastructure. In July 2026, a topping-out ceremony marked the midway point for the FFB Fab, the second construction phase. The overall site covers 39,000 square meters, with more than 20,000 square meters dedicated to gigafactory-scale production research. The federal government and the state of North Rhine-Westphalia jointly invested approximately €1 billion (€750 million federal, €320 million state) in the initiative. The first phase, FFB PreFab, has been operational since 2024. The FFB Fab will provide a research infrastructure unique in Europe for battery cells up to gigawatt scale, enabling industry transition from laboratory to large-scale manufacturing.
Thermal Management Technologies
JIOS Aerogel’s Korean manufacturing licensee secured a contract to supply Thermal Blade thermal runaway barriers for Hyundai and Kia models under the company’s Hub & Spoke licensing model introduced in 2025. The model centralizes aerogel powder production at a hub facility in Korea, supplying global licensees for high-volume barrier manufacturing. Mass production is scheduled to commence in June 2027, with a contract span of 12 years. This first contract under the licensing model validates reduced capital barriers for automaker adoption.
Aisin launched an advanced cooling plate manufacturing line at its Seymour, Indiana facility in July 2026. The line produces aluminum cooling plates for battery thermal management in electrified vehicles, strengthening North American supply chains and reinforcing Aisin’s electrification strategy.
Battery Management System Semiconductor Evolution
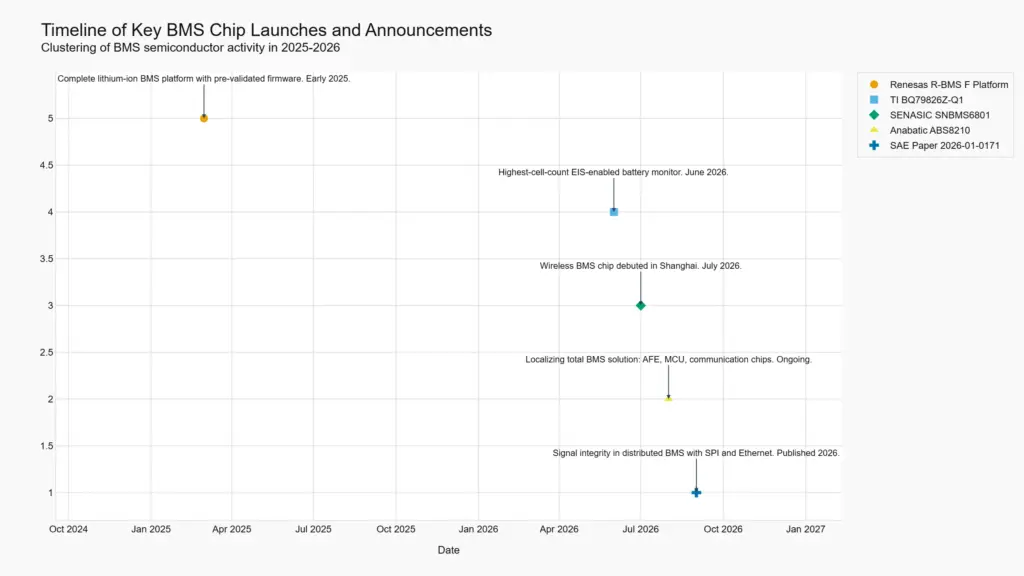
BMS chip capabilities are advancing rapidly with higher cell-count monitoring, integrated electrochemical impedance spectroscopy (EIS) for early thermal runaway detection, wireless communication, and localized supply chains.
Texas Instruments released the BQ79826Z-Q1 in June 2026, the industry’s highest-cell-count EIS-enabled battery monitor. It tracks up to 26 cells in series (44% more channels than previous generations), with an integrated smart EIS engine achieving 1% impedance accuracy over a 0.01 Hz to 3.5 kHz frequency range. The device enables safer EVs and energy storage systems.
SENASIC debuted the SNBMS6801 single-cell wireless BMS chip at the Munich Shanghai Electronics Show in July 2026. The chip integrates multi-dimensional sensing (voltage, temperature, EIS), wireless communication, and edge AI for anomaly detection, eliminating traditional wiring harnesses.
Anabatic Semiconductor is localizing a total BMS solution in South Korea, bundling AFE, MCU, and communication chips. Its first product, ABS8210, measures up to 20 cells and integrates EIS on-chip, enabling anomaly detection 20 to 30 minutes earlier than conventional methods. The company aims to challenge the US duopoly of Analog Devices and Texas Instruments.
Renesas announced the R-BMS F platform in early 2025, a complete lithium-ion battery management solution with pre-validated firmware. Targeting 2-4 and 3-10 cell series applications (e-bikes, vacuum cleaners, robotics, drones), it includes fuel gauge ICs, MCU, analog front end, and software, reducing design barriers for consumer and light EV devices.
SAE published technical paper 2026-01-0171 on signal integrity in distributed BMS with SPI and Ethernet communication for next-gen EVs. Using a 192-cell test platform, the paper quantifies that poor signal integrity design can reduce signal margins by 18 dB, and demonstrates that co-design strategies achieve up to 30% jitter reduction and Ethernet latency below 120 ns, with BER ≤ 1×10⁻¹².
| Technology | Participant | Supplied Metric | Period | Application | Evidence-Based Implication |
|---|---|---|---|---|---|
| 26-cell EIS monitor | Texas Instruments | 26 cells, 44% more channels, 1% impedance accuracy, 0.01 Hz–3.5 kHz EIS | Launched June 2026 | Passenger EV, energy storage | Highest cell-count per device reduces BOM; integrated EIS enables early thermal runaway detection. |
| Wireless single-cell BMS chip | SENASIC | Single-cell wireless, EIS, edge AI, eliminates wiring harness | Debuted July 2026 | Passenger EV, large-scale ESS | Wireless architecture reduces material and assembly cost; edge AI improves anomaly prediction. |
| 20-cell EIS AFE with bundled chips | Anabatic Semiconductor | 20 cells, integrated EIS, bundled AFE + wired/wireless + MCU | Ongoing (2026-2029 roadmap) | Passenger EV | Localized total solution challenges US duopoly; potential for South Korean supply chain independence. |
Key Takeaways
- Public investment in large-scale battery cell R&D infrastructure (Fraunhofer FFB, ~€1 billion) signals sustained European commitment to domestic gigafactory production.
- Licensing models for thermal management components (JIOS Hub & Spoke) reduce capital intensity for automaker adoption, validated by a 12-year Hyundai/Kia contract.
- BMS semiconductor innovation is accelerating with higher cell-count monitors, integrated EIS for early thermal runaway detection, and wireless connectivity, enabling safer, higher-density packs.
- Localization of BMS chip supply chains in South Korea (Anabatic Semi) challenges the US duopoly (TI, ADI) and could reshape procurement strategies.
- Standardization efforts (SAE paper on distributed BMS signal integrity) address scalability challenges for high-cell-count packs, critical for next-generation EVs.
Market Risk
Risk and Constraint Analysis :Global EV Battery Market
Key takeaways:
-
- China controls over 90% of graphite processing and 60–70% of lithium refining, creating acute dependency for non-Chinese battery manufacturers.
- The Democratic Republic of the Congo supplies 70% of the world’s cobalt; any disruption — from export quotas to logistics failures — can cascade globally because substitution elasticity is low.
- Chinese suppliers dominate battery cell production equipment, posing a bottleneck risk for Western gigafactories if export controls or trade tensions escalate.
- The EU Battery Regulation will impose compliance costs of €80,000–120,000 per manufacturer for consultancy alone, plus internal data‑collection burdens, with a mandatory Digital Product Passport by February 2027.
- The Middle East shipping crisis and a DRC customs‑platform glitch illustrate how operational vulnerabilities compound structural concentration risks.
- This assessment covers risks across the EV battery supply chain from raw‑material extraction through cell manufacturing, focusing on geographic and processing concentration, regulatory compliance, manufacturing‑equipment dependency, and logistics disruption. The boundary does not include downstream risks such as end‑of‑life recycling, battery performance degradation, or demand‑side factors.
- The following sections are based on publicly available evidence from authoritative sources as of the dates indicated in the accompanying factual record.
Upstream Concentration in Critical Mineral Processing
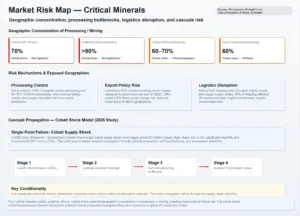
The global EV battery supply chain faces significant single-point-of-failure risks at the processing stage for four critical minerals: cobalt, graphite, lithium, and nickel. Geographic concentration at this stage means that a disruption in one jurisdiction can quickly spread across the battery-manufacturing network. Cobalt mining is particularly concentrated in the Democratic Republic of the Congo (DRC), which produces approximately 70% of global supply. The DRC has tightened export controls through quotas and suspensions, while a recent administrative failure on the customs platform threatened to block up to 20,000 metric tons of cobalt exports, worth an estimated $1.1 billion. A 2026 academic study using a multilayer shock-propagation model found that cobalt demand is inelastic in the short term and processing is highly concentrated, meaning that a localized supply shock can cascade through the wider supply chain and create abrupt, non-linear failures. This cobalt supply shock model shows how a disruption in one location can spread through global EV battery production.
Graphite processing for battery anodes is even more concentrated, with China controlling more than 90% of spherical graphite and synthetic anode-material output. In December 2023, China introduced an export-licensing regime that sharply reduced spherical graphite shipments in early 2024, forcing battery manufacturers to deal with a supply chain in which investment had previously been limited. By 2025, less than 1% of uncoated spherical graphite was produced outside China. Lithium refining presents a similar dependency, as China accounts for roughly 60 to 70% of global lithium chemical refining capacity and output, particularly for hard-rock lithium. This concentration means that even though lithium mining is spread across Australia, South America, and Africa, the critical conversion stage remains heavily controlled by China.
Nickel processing is also highly concentrated in Indonesia, where the country’s share of global supply increased from 31.5% in 2020 to about 60% in 2024 following a raw-ore export ban that attracted Chinese-backed refining investment. The Indonesian government is now tightening state control over the sector, creating additional policy uncertainty for buyers that depend on Indonesian nickel intermediates. Taken together, the concentration of cobalt, graphite, lithium, and nickel processing highlights the vulnerability of the EV battery supply chain, where disruptions, export controls, administrative failures, or policy changes in a small number of jurisdictions can have effects far beyond the original location.
| Mineral | Processing stage | Dominant country / region | Share of global processing | Key risk mechanism |
|---|---|---|---|---|
| Cobalt | Mining & initial concentration | Democratic Republic of the Congo | 70% | Export quotas, administrative failures, political instability |
| Graphite | Spherical & synthetic anode production | China | >90% | Export licensing, trade restrictions |
| Lithium | Chemical refining (hydroxide / carbonate) | China | 60–70% | Conversion capacity concentration, reliance on single jurisdiction |
| Nickel | Processing to nickel pig iron / mixed hydroxide precipitate | Indonesia | 60% | Export policy shifts, environmental crackdowns |
The four minerals are not interchangeable; LFP cathodes can reduce cobalt dependency but still require lithium and graphite, while NMC chemistries rely on nickel and cobalt. Substitution is slow and capital‑intensive, reinforcing the exposure.
Strategic Dependency on Chinese Manufacturing Equipment
Beyond raw materials, a less visible but equally consequential chokepoint exists in the production equipment used to manufacture battery cells. Chinese suppliers dominate the market for battery cell production equipment — including coating, calendaring, slitting, and winding machinery. This vulnerability centers on Chinese equipment suppliers and the battery manufacturing equipment they provide. The Carnegie Endowment for International Peace reports that by 2030 Chinese cell manufacturing capacity could reach at least 5,862 GWh, more than triple the OECD members’ combined capacity. This scale advantage is mirrored in equipment supply, where Chinese firms have integrated upstream and midstream inputs.
The Jamestown Foundation has identified specialized equipment as one of the most consequential chokepoints in the battery value chain. Because Chinese‑controlled processing and material inputs already shape cost and availability, export controls on equipment would inflict delay, uncertainty, and selective denial costs on foreign clean‑tech and defense‑adjacent industries. For Western gigafactory buildouts that rely on imported Chinese production lines, any escalation in trade tensions — including the imposition of export licensing similar to the 2023 graphite restrictions — would stall construction and commissioning timelines. The core vulnerability is not a shortage of finished cells but dependence on Chinese‑controlled manufacturing inputs that determine whether new facilities can ramp up as planned.
Regulatory Compliance Pressure: EU Battery Regulation
The EU Battery Regulation (2023/1542) imposes binding requirements on any industrial or EV battery placed on the European market. Essential obligations include carbon‑footprint declarations, recycled‑content quotas, supply chain due diligence, and performance metrics — all to be documented in a Digital Product Passport. The deadline is 18 February 2027.
According to compliance‑technology specialists, most manufacturers had not started preparation as of mid‑2026. For a typical manufacturer placing 200 stock‑keeping units on the EU market, each passport requires roughly 90 data fields spanning electrochemistry, supply chain data, carbon‑footprint calculations, and recycled‑content figures. The data is scattered across test reports, bills of materials, supplier declarations, and lab results.
The cost of a manual approach is substantial: consultancy‑firm fees for gap analysis and process design run to €80,000–120,000 per manufacturer, with internal staff time for supplier coordination and data entry adding another €60,000–80,000. These figures cover only the initial compliance build; updates for regulatory changes or new SKUs would recur. The regulation thus creates both a fixed cost burden for any battery manufacturer selling into the EU and a data‑management risk if supply‑chain information is incomplete or unverifiable.
Logistics and Geopolitical Shock Amplification
Operational disruptions have already demonstrated how upstream concentration risks are compounded by logistics failures and administrative bottlenecks.
The Middle East shipping crisis that began in early 2026 illustrates this propagation. The Strait of Hormuz normally handles roughly half of global seaborne sulfur trade. The Copperbelt region — the DRC and Zambia — sources approximately 90% of its sulfur from the Gulf region. When the Strait of Hormuz closed to dry‑bulk traffic on 28 February 2026, more than 600,000 metric tons of sulfur accumulated in Gulf vessels with no exit. Because sulfuric acid is essential for leaching cobalt and copper from ore, the chemical input crisis directly threatened African battery‑metal production. Ivanhoe Mines revised its 2026 copper guidance downward as a result, even before the full impact on cobalt processing became clear.
Independently, an administrative glitch in the DRC’s customs platform in July 2026 prevented major cobalt producers — including CMOC, Glencore, Eurasian Resources Group, and Huayou Cobalt — from registering export declarations ahead of a 5 July deadline for first‑half quota usage. Mining executives estimated that 60% to 75% of companies would miss the deadline, risking the loss of as much as 20,000 metric tons of cobalt export allocations worth $1.1 billion. The episode underscores how even non‑geopolitical failures — a software bug — can lock critical supply when concentration is high.
These incidents sit alongside longer‑standing sourcing constraints. The OECD Due Diligence Guidance for Responsible Supply Chains addresses risks prevalent in cobalt and copper sourcing from the DRC, including child labour, corruption, and security‑force involvement. Compliance with due diligence frameworks adds another layer of cost and verification for battery‑material buyers.
The sequence highlights how a disruption at a major global shipping route can quickly move through the battery supply chain, starting with the Strait of Hormuz closure, which blocks an estimated 600,000 tonnes of sulfur, followed by a sulfur shortage that affects processing operations in the DRC and Zambia, where the Copperbelt has around 90% dependency on Gulf sulfur. The resulting processing disruption can reduce cobalt output, while a separate ARECOMS administrative glitch creates a risk to as much as 20,000 tonnes of cobalt exports, representing an estimated $1.1 billion in value. The chain can therefore be illustrated as Hormuz closure → sulfur shortage → DRC/Zambia processing disruption → reduced cobalt output → global battery supply impact. The sequence draws on Mapshock for the Strait of Hormuz sulfur cutoff and Ivanhoe guidance revision, and Miningweekly and Business Insider Africa for the ARECOMS glitch, 20,000-tonne export risk, and $1.1 billion value, showing how the battery supply chain can be exposed to simultaneous logistics disruptions and administrative failures through the same upstream material flow.
Regulatory Landscape
Scope of this Chapter
Government policies, regulations, and industry standards are becoming increasingly important in shaping the growth and long-term development of the global EV battery market. This chapter examines the mandatory regulations, voluntary standards, and government financial measures that directly affect EV batteries, including battery cells, battery packs, and battery systems used in passenger cars, two-wheelers, three-wheelers, buses, and trucks.
The chapter does not cover regulations related to stationary energy storage systems, environmental laws that are not specifically related to batteries, or company-level compliance cost estimates.
The global EV battery market was valued at USD 91.70 billion in 2025. The analysis is based on enacted regulations, announced policy initiatives, and internationally recognized standards that were in effect according to the most recent available evidence.
Key Takeaways
-
- EU Battery Regulation imposes the most comprehensive lifecycle requirements with mandatory recycled content targets (cobalt 16%, lithium 6%, nickel 6% from 2031), material recovery rates, and a battery passport from February 2027, creating a compliance timeline for market participants in Europe.
- Safety and transport regulations (UN/ECE GTR No.20, US DOT HMR, SAE/ISO standards) enforce harmonized testing and logistics protocols but add testing costs and require dedicated certification for market access.
- China’s consumption tax on lithium-ion batteries (2% from Sep 2026, rising to 4% from Sep 2027) with exemptions for sodium-ion and solid-state through 2028 provides a fiscal push toward next-generation chemistries.
- India’s PLI scheme mandates rising domestic value addition (25% to 60% within 5 years) and attracts cell manufacturing investment, but the gestation period until end-2024 means performance obligations begin 2025.
- The postponement of EU due diligence obligations from 2025 to 2027 indicates regulatory adaptation challenges and gives economic operators more time to establish compliant sourcing policies.
Lifecycle Regulation: Recycled Content, Passports, and Due Diligence
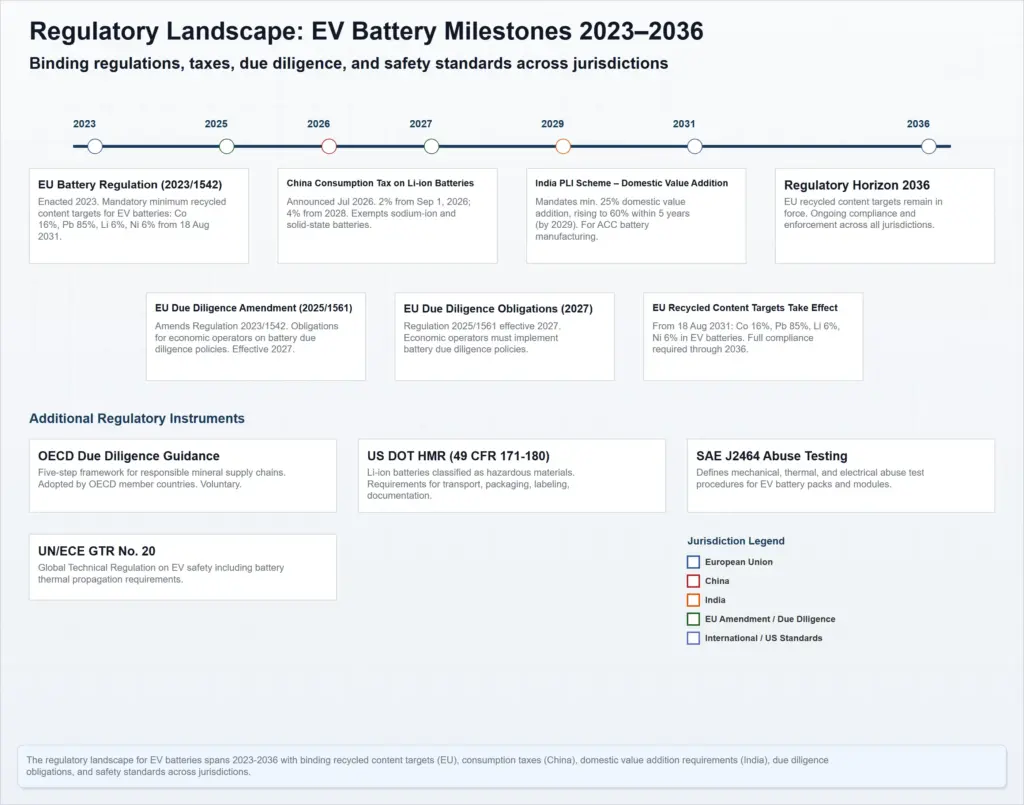
The EU Battery Regulation (2023/1542) sets the most detailed lifecycle obligations for batteries placed on the European market. From 18 August 2031, EV batteries must contain minimum recycled content: 16% cobalt, 85% lead, 6% lithium, and 6% nickel. These targets increase in 2036. For waste portable batteries, collection targets are 63% by end of 2027 and 73% by end of 2030. Material recovery targets for cobalt, lithium, and nickel are staged: 90% for cobalt by 2027, rising to 95% by 2031; 50% for lithium by 2027, rising to 80% by 2031; 90% for nickel by 2027, rising to 95% by 2031.
Article 77 of the regulation mandates a battery passport for EV batteries and industrial batteries above 2 kWh from 18 February 2027. This digital record tracks materials, components, and lifecycle data, affecting economic operators (cell manufacturers, pack integrators, OEMs) and requiring significant data management infrastructure.
Due diligence obligations covering the sourcing of cobalt, natural graphite, lithium, and nickel were originally applicable from 18 August 2025. However, Regulation (EU) 2025/1561 postponed the application date to 18 August 2027, citing the need for sufficient time to notify conformity assessment bodies and allow operators to prepare. The OECD Due Diligence Guidance for Responsible Supply Chains of Minerals from Conflict-Affected and High-Risk Areas provides a five-step framework used as a voluntary international standard and referenced in EU legislation.
These rules most directly affect cell manufacturers, battery recyclers, and EV OEMs that source or sell in Europe. The two-year delay on due diligence shows implementation complexity and gives early movers in recycling and traceability a strategic advantage.
| Requirement | Target Values | Effective Dates | Affected Participants |
|---|---|---|---|
| Recycled content (cobalt, lead, lithium, nickel) | Co 16%, Pb 85%, Li 6%, Ni 6% (increase in 2036) | 18 Aug 2031 (higher targets 2036) | Cell manufacturers, battery pack assemblers, OEMs |
| Waste portable battery collection | 63% by end 2027; 73% by end 2030 | 31 Dec 2027; 31 Dec 2030 | Recyclers, collection schemes, OEMs |
| Material recovery (Co, Li, Ni) | Co 90%/95%, Li 50%/80%, Ni 90%/95% | End 2027 / End 2031 | Recyclers, waste processors |
| Battery passport | Electronic record per Article 77 | 18 Feb 2027 | Economic operators placing EV/industrial >2 kWh batteries on EU market |
| Due diligence (sourcing, processing, trading of Co, graphite, Li, Ni) | Third-party verification by notified bodies | Postponed from 18 Aug 2025 to 18 Aug 2027 | All economic operators in supply chain |
Global Safety and Transport Standards
Battery safety regulations and voluntary testing standards create a multi-layered compliance environment. The UN/ECE Global Technical Regulation No. 20 (GTR No.20) on electric vehicle safety includes thermal propagation requirements for rechargeable energy storage systems (REESS). It applies to passenger cars (category M) and trucks (category N) with maximum design speed above 25 km/h, excluding permanently grid-connected vehicles. This regulation drives pack design modifications to prevent thermal runaway propagation between cells.
In the United States, the DOT Hazardous Materials Regulations (49 CFR Parts 171–180) classify lithium-ion batteries as hazardous materials. Transporters must comply with packaging, labeling, documentation, and handling rules under 49 CFR 173.185. These requirements affect all shipments to, from, or within the US and impose testing to UN Manual of Tests and Criteria Section 38.3.
Voluntary standards supplement these binding rules. SAE J2464 defines abuse test procedures for EV battery packs covering mechanical, thermal, and electrical abuse conditions. SAE J2929 sets minimum safety criteria for lithium-based propulsion battery systems. ISO 6469 series specifies safety requirements for electrically propelled road vehicles, including protection against electric shock and thermal events. ISO 12405 series provides test procedures for performance, reliability, and abuse of lithium-ion traction battery packs and systems.
Together, these standards increase testing and certification costs. They also create a market for dedicated battery testing and certification services, as manufacturers must demonstrate compliance to access multiple regions.
| Jurisdiction | Standard / Regulation | Key Requirements | Status |
|---|---|---|---|
| UN/ECE (adopting countries) | Global Technical Regulation No. 20 | Thermal propagation requirements for REESS; applies to M and N category vehicles | Binding regulation in adopting countries |
| United States (DOT) | Hazardous Materials Regulations 49 CFR Parts 171–180 | Classification of lithium-ion batteries as hazardous; packaging, labeling, documentation | Binding federal regulation |
| Global (SAE International) | SAE J2464 | Abuse test procedures: mechanical, thermal, electrical | Voluntary standard (often referenced) |
| Global (SAE International) | SAE J2929 | Minimum safety criteria for propulsion battery systems | Voluntary standard |
| Global (ISO) | ISO 6469 series | Safety specifications for electrically propelled road vehicles (electric shock, thermal events) | Voluntary international standard |
| Global (ISO) | ISO 12405 series | Test specification for lithium-ion battery packs and systems (performance, reliability, abuse) | Voluntary international standard |
Fiscal Policies and Localization Incentives
Fiscal measures in China and India are steering investment and technology choices. China announced in July 2026 a phased consumption tax on lithium-ion batteries, ending an 11-year exemption. From 1 September 2026, lithium-ion batteries are taxed at 2%, rising to 4% from 1 September 2027. By contrast, sodium-ion batteries, solid-state batteries, fuel cells, and certain advanced photovoltaic cells are exempt from the tax through 31 December 2028. This creates a clear cost disadvantage for lithium-ion chemistry relative to next-generation alternatives, encouraging development and adoption of sodium-ion and solid-state systems.
India’s Production Linked Incentive (PLI) scheme for Advanced Chemistry Cell (ACC) battery manufacturing requires beneficiary firms to achieve minimum domestic value addition of 25%, rising to 60% within five years. The scheme also mandates an investment of 225 crore rupees per GWh of committed capacity within two years of the appointed date. The gestation period runs from 1 January 2023 to 31 December 2024, followed by a performance period from 1 January 2025 to 31 December 2029. Three firms have been allocated 30 GWh of capacity, with 20 GWh available for fresh allocation. These requirements directly affect cell manufacturers investing in India, favoring those able to build local supply chains.
| Jurisdiction | Policy | Requirement / Incentive | Effective Dates / Timeline | Exemptions / Notes |
|---|---|---|---|---|
| China | Consumption tax on batteries | 2% tax on lithium-ion from Sep 2026; 4% from Sep 2027 | 1 Sep 2026 (first phase); 1 Sep 2027 (second phase) | Sodium-ion, solid-state, fuel cells exempt through 31 Dec 2028 |
| India | PLI scheme for Advanced Chemistry Cell (ACC) | Min. domestic value addition 25%, rising to 60% within 5 years; investment of 225 crore/GWh within 2 years | Gestation: 1 Jan 2023 – 31 Dec 2024; Performance: 1 Jan 2025 – 31 Dec 2029 | 30 GWh allocated; 20 GWh available for fresh allocation |