
Global EV Charging Infrastructure Market Report, Size & Forecast 2026 - 2033
Global EV Charging Infrastructure Market Forecast 2026 - 2033
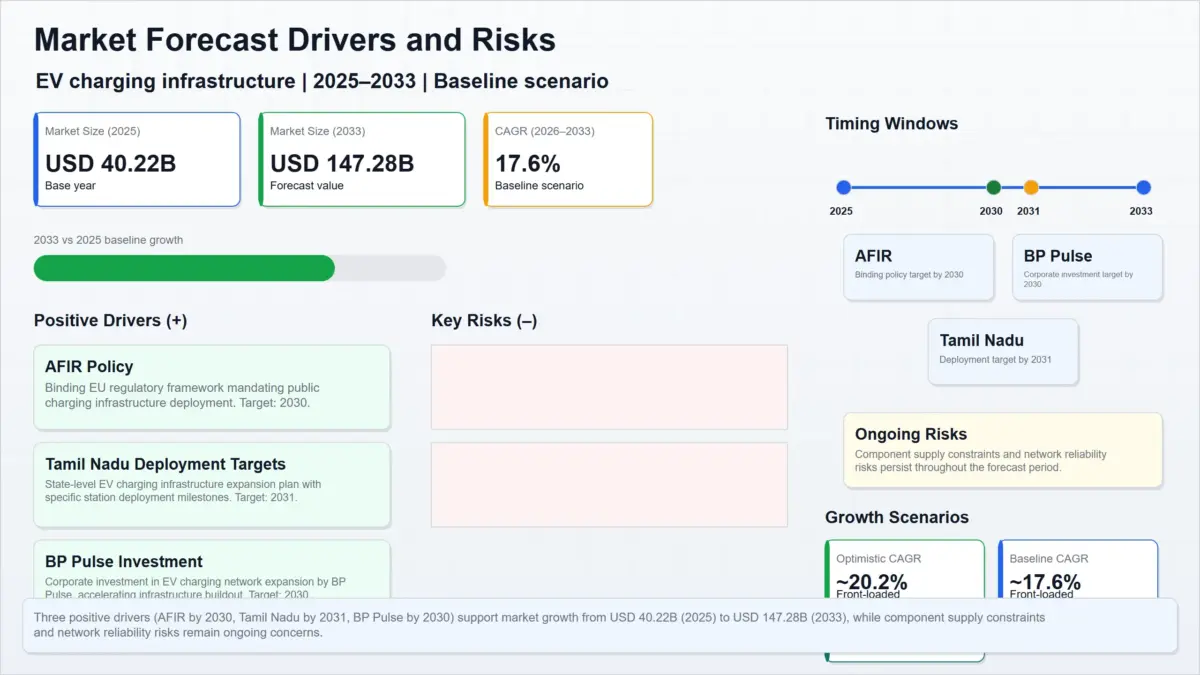
The EV charging infrastructure market, encompassing charging equipment manufacturing, installation services, network operations, and software platforms, is forecast to expand from a base of USD 40.22 billion in 2025 to USD 147.28 billion by 2033 at a baseline CAGR of 17.61%. The forecast window covers 2026 through 2033. The market direction is strongly positive, underpinned by binding policy mandates, accelerating private capital deployment, and industrial-scale manufacturing expansions across Europe, India, and the United States. The baseline growth path is front-loaded, reflecting an early concentration of capital expenditure and technology ramp-up that drives above-trend expansion through 2029 before decelerating toward the end of the forecast horizon.
Evidence-Backed Implications
Key Takeaways
- The baseline forecast projects the market to more than triple from USD 40.22 billion (2025) to USD 147.28 billion (2033), with annual growth peaking at 19.83% in 2029.
- Binding regulatory targets, such as the EU Alternative Fuels Infrastructure Regulation (AFIR) requiring 1.3 kW per BEV and 0.8 kW per PHEV by 2030, create a structural demand floor for public charging capacity.
- Private investment is material and geographically diversified. BP Pulse has committed USD 1 billion to U.S. charging build-out.
- The growth profile is front-loaded. The first four forecast years (2026–2029) contribute a disproportionately large share of cumulative market expansion, driven by early capital expenditure and technology deployment.
- Risk factors—including component supply constraints (IGBTs and BMS AFE ICs with 26–40 week lead times) and network reliability gaps (2.1% of U.S. DC fast-charging stations temporarily unavailable)—represent execution-stage threats to the baseline trajectory.
EV Charging Infrastructure Market – Baseline Forecast
| Year | Market Value (USD Billion) | Annual Growth Rate |
|---|---|---|
| 2025 | 40.22 | — |
| 2026 | 47.30 | 17.61% |
| 2027 | 55.61 | 17.56% |
| 2028 | 65.94 | 18.58% |
| 2029 | 79.02 | 19.83% |
| 2030 | 94.36 | 19.41% |
| 2031 | 111.08 | 17.72% |
| 2032 | 128.68 | 15.85% |
| 2033 | 147.28 | 14.45% |
The baseline CAGR of 17.61% serves as the reference scenario. The optimistic scenario (CAGR 20.11%) and conservative scenario (CAGR 15.11%) define the probable range. The baseline endpoint of USD 147.28 billion reflects the most likely outcome under current policy, investment, and technology trends.
Growth Shape and Inflection Timing
The forecast is front-loaded. Annual growth accelerates from 17.56% in 2027 to a peak of 19.83% in 2029, before gradually decelerating through 2033 (14.45%).
The acceleration phase (2027–2029) coincides with:
-
- Delivery of early-stage capital commitments.
- Scaling of manufacturing capacity.
This is evidenced by:
-
- The opening of new charger manufacturing plants:
- XCharge (Spain).
- Exicom (India).
- Foxconn (Vietnam).
- The ramp-up of large-scale public deployment contracts:
- Char.gy's 3,000 on-street charging sockets in the United Kingdom.
- Oregon NEVI Round 2 charging stations.
- The opening of new charger manufacturing plants:
The deceleration after 2029 reflects market maturation, with declining year-on-year incremental capital expenditure as the highest-return corridor deployments approach completion.
Drivers, Policy Tailwinds, and Capital Deployment
Three principal demand-side pillars anchor the forecast.
1. Regulatory Mandates
The European Union's Alternative Fuels Infrastructure Regulation (AFIR) establishes binding national targets for public charging power output:
-
- 1.3 kW per registered battery electric vehicle (BEV).
- 0.8 kW per registered plug-in hybrid electric vehicle (PHEV).
Based on:
-
- 5.8 million BEVs.
- 4.2 million PHEVs.
registered by the end of 2024, the total minimum public charging power requirement is approximately 11,000 MW.
This regulation ensures that charging infrastructure deployment keeps pace with electric vehicle adoption across all 27 European Union member states.
2. State-Level Deployment Targets
The Tamil Nadu Government has announced a target of 20,000 public EV charging stations by 2031, supported by:
-
- Dedicated EV sub-metering.
- Waiver of fixed demand charges.
- Private investment incentives under the Vetri Thamizhagam initiative.
This sub-national commitment demonstrates that large-scale charging infrastructure deployment extends beyond Western economies.
3. Corporate Investment Programmes
BP Pulse has committed USD 1 billion by 2030 to deploy EV charging infrastructure across the United States.
Key elements of the programme include:
-
- A cornerstone partnership with Hertz to deploy fast chargers across more than a dozen U.S. cities.
- A global target of operating more than 100,000 charge points by 2030.
- Approximately 90% of those charge points being rapid or ultra-fast chargers.
This private capital complements public funding while reducing reliance on any single funding source.
Additional investment momentum comes from:
-
- European Commission funding:
- €1.1 billion through the CEF Transport 2026 call.
- €600 million through AFIF awards supporting high-power and heavy-duty charging infrastructure.
- United States NEVI Round 2 allocations:
- USD 52 million for Oregon.
- USD 51 million for Michigan.
- Industry consolidation:
- The merger of Eviny Fast Charging and Mer.
- Creation of a charging network comprising approximately 3,500 charging points.
- A customer base exceeding one million registered users.
- European Commission funding:
This consolidation demonstrates that scale-driven mergers and acquisitions have become an important profitability strategy within mature EV charging markets.
Restraints and Risk Factors
Two categories of risks could shift the market trajectory toward the conservative scenario.
1. Component Supply Constraints
Component supply constraints remain significant across the EV charging infrastructure supply chain.
Key issues include:
-
-
- IGBT modules and power MOSFETs have experienced two price increases within six months from Infineon.
- Battery Management System (BMS) Analog Front-End (AFE) ICs currently have lead times ranging from 26 to 40 weeks because of manufacturing capacity constraints at legacy 180–130 nm analogue semiconductor nodes.
- A single-source concentration risk exists for these safety-critical integrated circuits, requiring approximately 9–18 months to re-qualify alternative suppliers.
-
These supply constraints have the potential to delay infrastructure deployment and increase project costs.
2. Network Reliability
Operational reliability remains inconsistent across public charging networks.
Current evidence indicates:
-
- Leading U.S. charging networks achieve uptime ranging between 96.2% and 99.7%.
- Approximately 2.1% of all U.S. DC fast-charging (DCFC) stations were reported as temporarily unavailable in a July 2026 snapshot.
Each percentage point of charger downtime results in:
-
- Lost charging revenue.
- Reduced driver confidence.
- Lower network utilisation.
- Weaker financial returns for charging network operators.
The available evidence does not provide:
-
- Regional market share estimates.
- Segment-level revenue distribution.
- Company-level financial performance.
The competitive landscape chapter, based on U.S. DC fast-charging port counts, indicates:
-
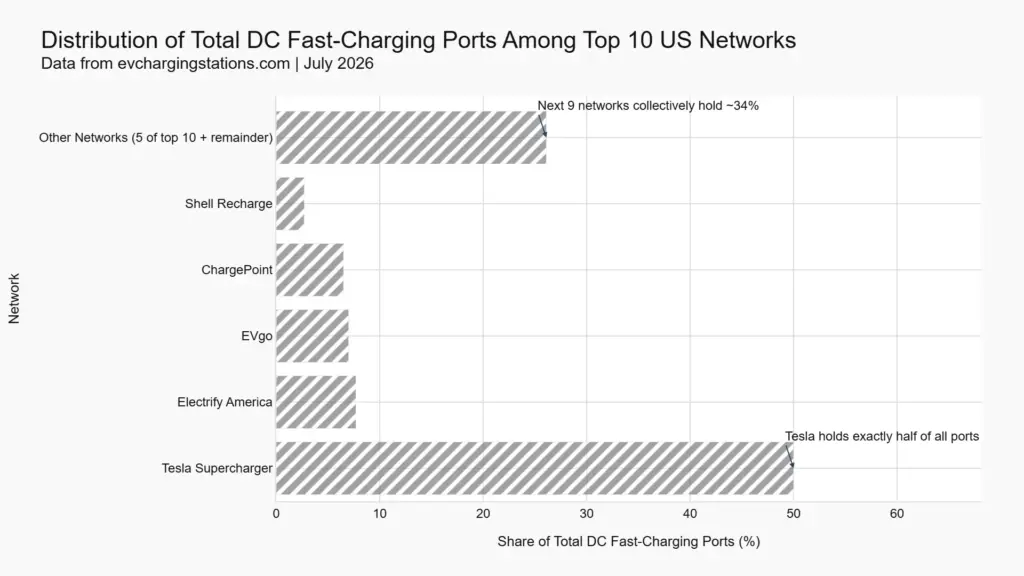
- Tesla accounts for approximately 50% of installed ports.
- Electrify America accounts for approximately 7.7%.
- EVgo accounts for approximately 7.0%.
These figures represent charging network deployment rather than market revenue.
The forecast is constructed using a deterministic modelling framework that integrates:
-
- Regulatory signals.
- Investment activity.
- Technology developments.
- Risk indicators.
It does not assume specific financial outcomes for individual companies.
Summary of Strongest Supported Relationships
The strongest evidence-supported relationships are:
Positive Drivers
-
- Binding policy (AFIR): The European Union's AFIR establishes mandatory charging infrastructure requirements through 2030, creating a structural demand floor for public charging deployment.
- Deployment targets (Tamil Nadu): Tamil Nadu's objective of installing 20,000 public EV charging stations by 2031 demonstrates sustained sub-national policy support and infrastructure investment.
- Corporate investment (BP Pulse): BP Pulse's commitment of USD 1 billion through 2030 supports large-scale charging network expansion and reinforces private-sector investment momentum.
Key Risks
-
- Component supply constraints: Ongoing shortages of IGBT modules and BMS AFE ICs continue to present execution risks because of extended component lead times and supplier concentration.
- Network reliability: Continuing charger downtime and reliability gaps remain operational risks that could reduce utilisation, revenue generation, and customer confidence.
Outlook
The baseline scenario indicates that the EV charging infrastructure market will more than triple in nominal value over the eight-year forecast period.
The front-loaded growth profile means that investment decisions made between 2026 and 2029 will disproportionately determine the market's long-term scale.
Decision-makers should closely monitor three leading indicators:
-
- The pace of private capital deployment, including:
- Debt financing.
- Mergers and acquisitions.
- Corporate investment commitments.
- Progress in resolving component supply bottlenecks, particularly:
- BMS AFE IC lead times.
- Consistency of policy implementation, including:
- Continuity of U.S. NEVI funding.
- Compliance with the European Union's AFIR requirements.
- The pace of private capital deployment, including:
Significant coverage gaps remain.
The forecast does not disaggregate the market by:
-
- Charging speed:
- AC charging.
- DC charging.
- Power levels.
- End-user segment:
- Public charging.
- Workplace charging.
- Home charging.
- Fleet charging.
- Geography beyond the jurisdictions specifically cited in the supporting evidence.
- Charging speed:
The USD 40.22 billion market estimate for 2025 is derived from a single web-based estimate and has not been independently verified.
Annual growth rates:
-
- Before 2026.
- Beyond 2033.
are not provided.
The optimistic (20.11% CAGR) and conservative (15.11% CAGR) scenarios are presented only as boundary assumptions. Their corresponding endpoint market values are not considered authoritative and are therefore omitted.
The EV charging infrastructure market remains strategically important because it provides the enabling infrastructure required for widespread electric vehicle adoption.
Without accessible, reliable, and adequately powered public charging infrastructure:
-
- Fleet electrification targets will become more difficult to achieve.
- Consumer electric vehicle purchasing decisions may be constrained.
The combination of binding AFIR requirements and substantial private-sector investment commitments embeds EV charging infrastructure within national energy and transportation policy, supporting its position as a structurally attractive long-term growth market with limited downside under the baseline scenario.
Key Limitations
-
- The USD 40.22 billion base market estimate is derived from a single source and should be regarded as indicative rather than independently verified.
- Regulatory and investment evidence primarily covers:
- The United States.
- The European Union.
- India.
- Evidence relating to component supply constraints and cybersecurity incidents is based on a relatively small number of high-profile events.
- Network reliability metrics reflect a single snapshot period and may not represent long-term operating performance.
- The forecast does not model:
- Macroeconomic shocks.
- Disruptive technology changes.
- Changes in consumer electric vehicle adoption beyond the supplied evidence set.
- Decision-makers should regard the baseline scenario as the most probable market trajectory under current conditions while monitoring the three leading indicators identified in the Outlook section and updating assumptions as new evidence becomes available.
Table of Contents
1. Executive Summary
1.1 Global EV Charging Infrastructure Market Snapshot (2025–2033)
1.2 Market Size & CAGR Analysis
1.3 Largest Region & Fastest-Growing Region
1.4 Key Regional Insights
1.5 Major Market Growth Drivers
1.6 Competitive Landscape Overview
1.7 Strategic Outlook Through 2033
2. Introduction & Market Overview
2.1 Definition of EV Charging Infrastructure
2.2 Scope of the Study
2.3 Evolution of the Global EV Charging Infrastructure Industry
2.4 EV Charging Infrastructure Value Chain Analysis
2.5 Global EV Charging Ecosystem & Deployment Landscape
2.6 Regulatory Framework for EV Charging Infrastructure
2.7 Technology Innovations in EV Charging Systems & Software
3. Research Methodology
3.1 Primary Research
3.2 Secondary Research
3.3 Market Size Estimation Model
3.4 Forecast Assumptions (2025–2033)
3.5 Data Validation & Market Triangulation
4. Market Dynamics
4.1 Drivers
4.1.1 Binding Government Policies & AFIR Mandates
4.1.2 Large-Scale Public & Private Investment in Charging Networks
4.1.3 Expansion of EV Adoption Driving Charging Demand
4.1.4 Manufacturing Capacity Expansion for Charging Equipment
4.1.5 Growth of Fast & Ultra-Fast Charging Infrastructure
4.2 Restraints
4.2.1 Component Supply Constraints & Semiconductor Shortages
4.2.2 High Infrastructure Installation Costs
4.2.3 Grid Capacity & Power Distribution Challenges
4.2.4 Slow Deployment in Emerging Markets
4.3 Opportunities
4.3.1 Expansion of Ultra-Fast Charging Networks
4.3.2 Smart Charging & Energy Management Integration
4.3.3 Fleet Electrification & Commercial Charging Solutions
4.3.4 Vehicle-to-Grid (V2G) & Renewable Energy Integration
4.4 Challenges
4.4.1 Network Reliability & Charger Downtime
4.4.2 Cybersecurity Risks in Connected Charging Networks
4.4.3 Standardization & Interoperability Issues
4.4.4 Supply Chain & Critical Component Dependency
5. Global EV Charging Infrastructure Market Analysis (USD Billion), 2025–2033
5.1 Market Size Overview
5.2 CAGR Analysis
5.3 Regional Revenue Distribution
5.4 Segment Revenue Analysis
5.5 Infrastructure Deployment Analysis
5.6 Technology & Investment Trends
6. Market Segmentation (USD Billion), 2025–2033
6.1 By Charging Type
6.1.1 AC Charging
6.1.1.1 Level 1 Charging
6.1.1.1.1 Residential Charging
6.1.1.1.1.1 Home Charging Solutions
6.1.2 DC Fast Charging
6.1.2.1 High-Power DC Charging
6.1.2.1.1 Ultra-Fast Charging (HPC)
6.1.2.1.1.1 Megawatt Charging Systems (MCS)
6.1.3 Wireless Charging
6.2 By Charger Connectivity
6.2.1 Networked Chargers
6.2.2 Non-Networked Chargers
6.3 By Installation Type
6.3.1 Residential Charging
6.3.2 Commercial Charging
6.3.3 Public Charging
6.3.4 Fleet Charging
6.4 By Connector Type
6.4.1 CCS (Combined Charging System)
6.4.2 CHAdeMO
6.4.3 NACS (North American Charging Standard)
6.4.4 GB/T
6.4.5 Type 2 (Mennekes)
6.4.6 Other Connector Standards
6.5 By End User
6.5.1 Passenger Vehicles
6.5.2 Commercial Vehicles
6.5.3 Electric Bus Operators
6.5.4 Fleet Operators
6.5.5 Government & Public Infrastructure Agencies
7. Market Segmentation by Geography
7.1 North America
7.2 Europe
7.3 Asia-Pacific
7.4 Latin America
7.5 Middle East & Africa
8. Competitive Landscape
8.1 Market Share Analysis
8.2 Technology Benchmarking
8.3 Charging Network Deployment Analysis
8.4 Strategic Partnerships, Investments & Acquisitions
8.5 Sustainability & Innovation Strategies
9. Company Profiles
9.1 Tesla, Inc.
9.2 BP Pulse
9.3 ABB Ltd.
9.4 Siemens AG
9.5 Shell Recharge Solutions
9.6 ChargePoint Holdings, Inc.
9.7 EVgo Inc.
9.8 Blink Charging Co.
9.9 Tritium DCFC Limited
9.10 Wallbox N.V.
9.11 Delta Electronics, Inc.
9.12 Exicom Tele-Systems Limited
9.13 XCharge Europe
9.14 Foxconn (Hon Hai Precision Industry Co., Ltd.)
9.15 Char.gy Ltd.
10. Strategic Intelligence & Pheonix AI Insights
10.1 Pheonix EV Charging Demand Forecast Engine
10.2 Charging Network Utilization Analytics Dashboard
10.3 Infrastructure Investment Tracker
10.4 EV Charging Market Opportunity Monitor
10.5 Automated Porter’s Five Forces Analysis
11. Future Outlook & Strategic Recommendations
11.1 Ultra-Fast Charging Infrastructure Outlook
11.2 Smart Charging & Grid Integration Strategy
11.3 Expansion of Public & Fleet Charging Networks
11.4 Renewable Energy & Vehicle-to-Grid (V2G) Integration Strategy
11.5 Long-Term Market Outlook (2033+)
12. Appendix
13. About Pheonix Research
14. Disclaimer
Competitive Landscape
Global EV Charging Infrastructure Market Competitive Intensity & Market Structure Overview
The Global EV Charging Infrastructure Market is highly competitive and characterized by the presence of charging equipment manufacturers, charge point operators (CPOs), charging network providers, energy companies, electrical equipment manufacturers, software platform developers, automotive OEMs, and infrastructure investors. Competitive intensity is driven by rapid expansion of public charging networks, ultra-fast charging technologies, government infrastructure mandates, private capital investment, digital charging management platforms, and smart energy integration.
Companies compete across multiple segments including AC chargers, DC fast chargers, ultra-fast charging systems, residential charging solutions, commercial charging infrastructure, fleet charging networks, charging management software, payment platforms, energy management systems, and charging-as-a-service solutions. Increasing electric vehicle adoption, binding regulatory mandates, public funding programs, corporate investment, and network expansion strategies are intensifying competition while accelerating innovation across the EV charging ecosystem.
The market structure is evolving toward integrated charging ecosystems combining hardware manufacturing, installation services, charging network operations, cloud-based software platforms, energy management, payment solutions, predictive maintenance, renewable energy integration, and battery storage. Market participants are investing heavily in ultra-fast charging technology, smart charging software, grid integration, interoperability standards, and strategic partnerships to strengthen market positioning while supporting large-scale EV adoption.
Global EV Charging Infrastructure Market Competitive Intensity & Market Structure Current Scenario
Leading Global EV Charging Infrastructure Companies
Tesla Supercharger Network: A leading charging network operator with approximately 50% of installed U.S. DC fast-charging ports, expanding ultra-fast charging infrastructure and supporting large-scale EV deployment.
Electrify America: A major public charging network focused on high-power DC fast charging, nationwide charging corridor expansion, and public charging accessibility.
EVgo Inc.: A leading fast-charging network operator providing public DC fast charging, fleet charging solutions, and renewable energy-powered charging infrastructure.
BP Pulse: An integrated energy company investing USD 1 billion through 2030 to expand U.S. EV charging infrastructure, rapid charging networks, and strategic fleet partnerships.
Char.gy: A charging infrastructure provider deploying large-scale on-street charging networks, including a 3,000-socket deployment program in the United Kingdom.
Mer & Eviny Fast Charging: Following their merger, the combined entity operates approximately 3,500 charging points serving more than one million registered users, strengthening scale and operational efficiency.
XCharge: A charging equipment manufacturer expanding European production capacity through new manufacturing facilities in Spain.
Exicom: A charging equipment manufacturer expanding EV charger production capacity in India to support domestic and export markets.
Foxconn: An electronics manufacturer expanding EV charger manufacturing capabilities through new production facilities in Vietnam.
Key Competitive Intensity & Market Structure Drivers
Increasing electric vehicle adoption, government infrastructure mandates, and large-scale charging deployment programs are intensifying competition among charging infrastructure providers worldwide.
Growing investment in ultra-fast charging technologies, smart charging software, cloud-based charging management, renewable energy integration, and interoperability standards is creating significant technological differentiation among market participants.
Binding regulatory initiatives, including the European Union’s Alternative Fuels Infrastructure Regulation (AFIR), together with state-level charging deployment targets and public funding programs, are strengthening competitive intensity while accelerating infrastructure deployment.
Strategic collaborations among charging network operators, automotive OEMs, utilities, energy companies, governments, fleet operators, and technology providers are accelerating network expansion, improving charging accessibility, and enhancing customer experience.
Continuous investment in manufacturing capacity, digital charging platforms, payment technologies, predictive maintenance, battery storage integration, and high-power charging infrastructure is enabling companies to improve operational efficiency, network reliability, and long-term competitiveness.
Strategic Implications of Competitive Intensity & Market Structure
Companies offering integrated charging ecosystems combining charging hardware, software platforms, network operations, and energy management capabilities are expected to maintain significant competitive advantages.
Investment in ultra-fast charging, smart charging software, interoperability, renewable energy integration, predictive maintenance, and digital network management is becoming increasingly important for sustaining long-term market leadership.
Organizations focusing on expanding charging coverage, improving network uptime, strengthening charging reliability, and increasing charging speed are likely to improve customer adoption and market share.
Strategic partnerships with governments, utilities, automotive manufacturers, fleet operators, renewable energy providers, and infrastructure investors are supporting network expansion, technology innovation, and long-term revenue growth.
Businesses capable of combining charging hardware expertise, software innovation, energy integration, large-scale infrastructure deployment, and digital charging services will be best positioned to compete effectively in the evolving Global EV Charging Infrastructure Market.
Global EV Charging Infrastructure Market Competitive Intensity & Market Structure Forward Outlook
The competitive landscape of the Global EV Charging Infrastructure Market is expected to become increasingly software-driven, network-centric, and energy-integrated as governments and private investors accelerate charging infrastructure deployment worldwide.
Future competition will be shaped by ultra-fast charging technologies, smart charging platforms, AI-powered network management, renewable energy integration, vehicle-to-grid (V2G) capabilities, battery energy storage systems, predictive maintenance, interoperability, and digital payment ecosystems.
Market participants are expected to increase investments in charging network expansion, manufacturing capacity, software platforms, energy management systems, charging reliability, and strategic partnerships to strengthen competitive positioning.
Over the forecast period, companies that successfully combine charging infrastructure expertise, digital software capabilities, energy integration, operational scalability, and high-reliability charging networks will be best positioned to lead the evolving Global EV Charging Infrastructure Market.
Value Chain
EV Charging Infrastructure Value Chain Overview
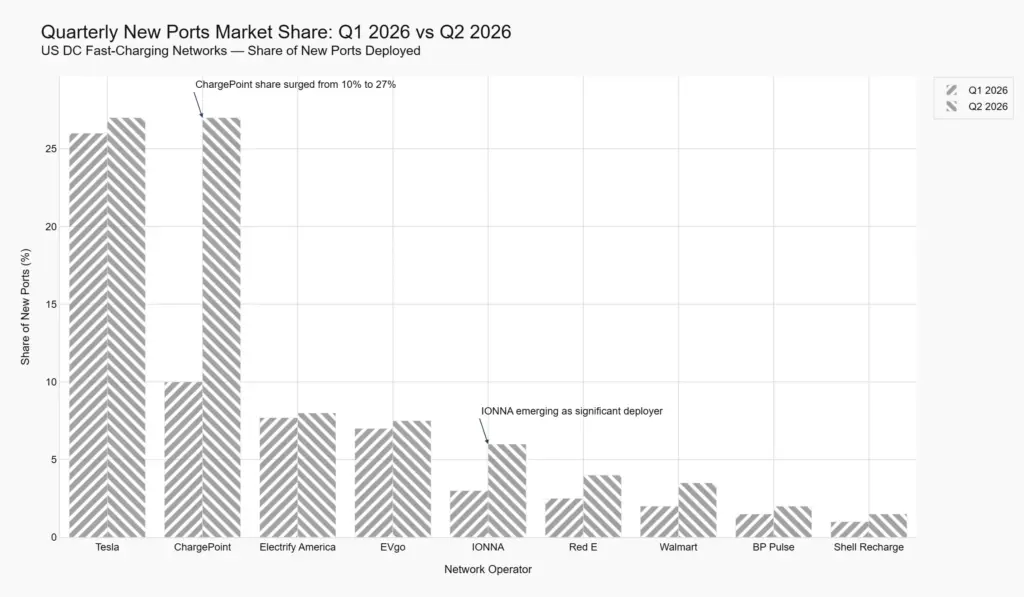
The EV charging infrastructure value chain in 2026 spans equipment manufacturing, charging network deployment, and software and payment services. Hardware manufacturers are expanding production capacity in Europe, India, and Southeast Asia. Large-scale public charging contracts are being awarded across the United Kingdom, supported by government funding schemes and private investment. Software innovators are introducing payment and authorization solutions that simplify charging for both individual drivers and commercial fleets.
Key Takeaways
- Manufacturing investments are becoming geographically diversified, with XCharge expanding in Spain, Exicom in India, and Foxconn in Vietnam.
- UK local government contracts, including Char.gy’s deployment of more than 3,000 on-street charging sockets and EZO’s installation of 250 rapid chargers, are focused on residents without off-street parking and are supported by the UK Government’s Local Electric Vehicle Infrastructure (LEVI) Fund.
- Payment and user experience innovations, including Cariqa’s direct payment API and SWTCH Energy’s offline NFC charging solution, are reducing charging friction and improving integration with mobility platforms.
- Corporate fleet electrification is driving charging infrastructure upgrades, demonstrated by 24 7 Group’s Tesco project involving 149 AC chargers and three twin DC fast chargers.
- The EV charging infrastructure value chain is expanding simultaneously across manufacturing, charging network deployment, and software service layers.
Manufacturing Capacity Expansion
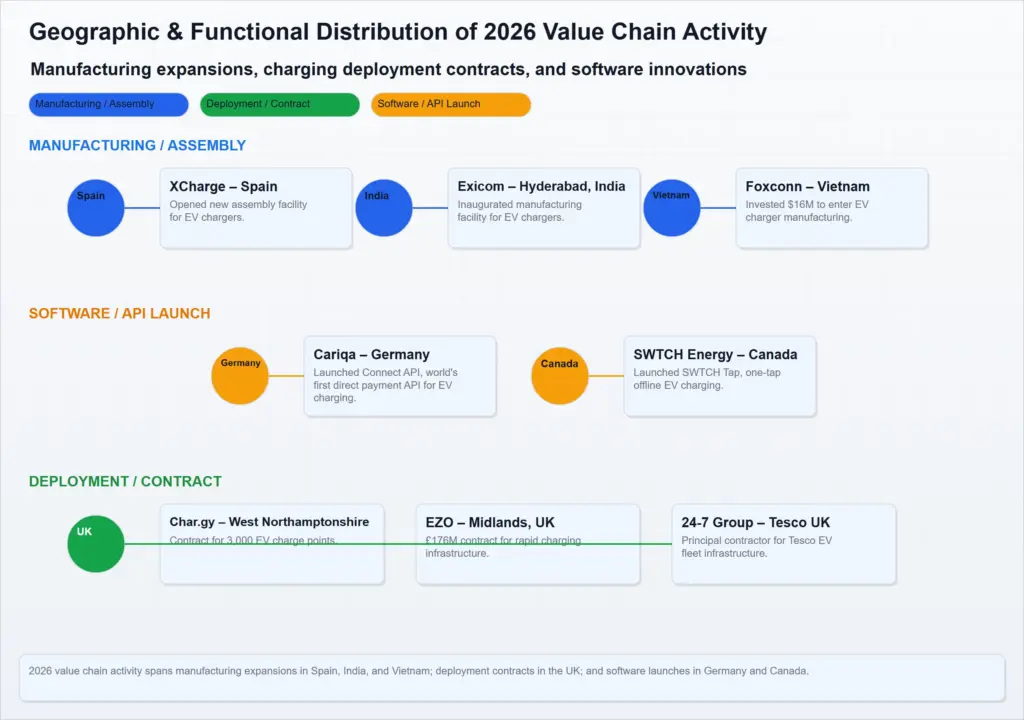
Three manufacturers expanded or established production facilities for EV chargers and related power electronics during 2026, each serving different regional markets.
XCharge inaugurated its first European assembly plant in Silla, Valencia, Spain. The nearly 3,000 m² facility will assemble high-power charging infrastructure and battery energy storage systems under the “Made in Spain” label. Production is expected to reach full capacity during 2027, beginning with the GridLink system—a battery-supported fast charger capable of delivering up to 200 kW from a 44 kW grid connection using a patented 215 kWh battery storage system, expandable to 430 kWh. The facility complements XCharge’s technical centre in Madrid and laboratory in Hamburg.
Exicom Tele-Systems inaugurated an integrated manufacturing facility in Hyderabad, India, following an investment of US$24 million (£216 crore). Spread across 18.4 acres with 280,000 square feet of built-up space, the plant doubles Exicom’s production capacity and creates more than 750 jobs. Annual production capacity includes 4,000 DC fast chargers, 100,000 AC chargers, and 0.5 GWh of lithium-ion battery cell-to-module assembly. The facility also manufactures power electronics for telecom and data centre applications.
Foxconn, through its wholly owned Vietnamese subsidiary Fulian Precision Technology Component Co., added EV charging station manufacturing as a new business line and increased its charter capital by VND 402 billion (US$16 million). This increased Fulian’s registered capital to VND 9.86 trillion (US$398 million). Having invested more than US$4 billion in Vietnam since 2007 and employing approximately 130,000 people, Foxconn is expanding its operations in Bac Ninh Province to include EV charger manufacturing alongside existing electronics production.
Manufacturing Capacity Expansions in 2026
| Stage | Participant | Activity | Geography | Status |
|---|---|---|---|---|
| Charging Equipment Manufacturing | XCharge | First European assembly plant for high-power chargers and battery systems (GridLink) | Silla, Valencia, Spain | Inaugurated April 2026; full capacity expected in 2027 |
| Charging Equipment Manufacturing | Exicom Tele-Systems | Integrated manufacturing facility for DC and AC chargers, battery assembly, and power electronics | Hyderabad, India | Inaugurated March 2026; operations began November 2025 |
| Charging Equipment Manufacturing | Foxconn (Fulian) | Added EV charger manufacturing business line and increased charter capital by US$16 million | Bac Ninh, Vietnam | Registered July 2026 |
Charging Network Deployment Contracts
Three major UK projects demonstrate how public, residential, and commercial fleet charging infrastructure is being financed and deployed.
Char.gy was appointed by West Northamptonshire Council to install more than 3,000 on-street EV charging sockets for residents without off-street parking. The project is funded through the UK Government’s Local Electric Vehicle Infrastructure (LEVI) Fund, contributing £2.85 million alongside significant private investment. Installation is scheduled to begin in mid-2026, with chargers retrofitted to existing lampposts across council and parish locations.
EZO secured a 15-year, £176 million contract to install and manage 250 rapid and ultra-rapid public charging stations across Worcestershire, Leicestershire, Rutland, and Warwickshire. Delivered through the Fourth Midlands EV Infrastructure Consortium (FMeVIC), the project is funded by the UK Government without requiring direct capital investment from participating councils and is expected to serve approximately two million residents.
24 7 Group was appointed principal contractor by Tesco to design and implement EV charging infrastructure at the Croydon Customer Fulfilment Centre. The project supports the expansion of Tesco’s electric home delivery fleet and includes installation of 149 × 22 kW AC chargers, three twin 240 kW DC chargers, 149 new 16 A refrigerated van sockets, a new 2,000 kVA transformer, a low-voltage electrical panel, and 43 dedicated EV charging bays. The project is privately funded by Tesco.
Software and Payment Innovation
Two software launches during 2026 addressed key challenges associated with payment integration and charging reliability.
Cariqa, headquartered in Berlin, introduced the Connect API, described as the world’s first direct payment API for EV charging. The platform enables mobility providers, OEMs, fleet operators, and navigation applications to integrate public charging services while maintaining direct commercial relationships with charge point operators. The API manages payments, VAT compliance, electronic invoicing, and connectivity while providing access to more than 900,000 charging points across Europe through a single technical integration that can be implemented within days.
SWTCH Energy, based in Toronto, launched SWTCH Tap, an NFC-based one-tap charging capability integrated into the SWTCH Cortex platform. The solution uses near-field communication to authenticate both the charging station and driver locally, eliminating dependence on cloud connectivity. It functions even when mobile or Wi-Fi networks are unavailable, addressing connectivity challenges commonly encountered in underground parking structures and remote locations. Drivers simply tap their smartphone, access a one-click charging page, and begin charging without downloading additional applications or waiting for network connectivity.
Investment Activity
Public Funding: EU Central Coordination vs. US Federal Volatility
The investment landscape for EV charging infrastructure in 2025–2026 reveals a clear divergence between public funding approaches in the European Union and the United States. The EU continues to deploy large, centrally coordinated grant programs focused on corridor buildout, while the US faces funding volatility that has forced states to adapt and private capital to seek alternative pathways.
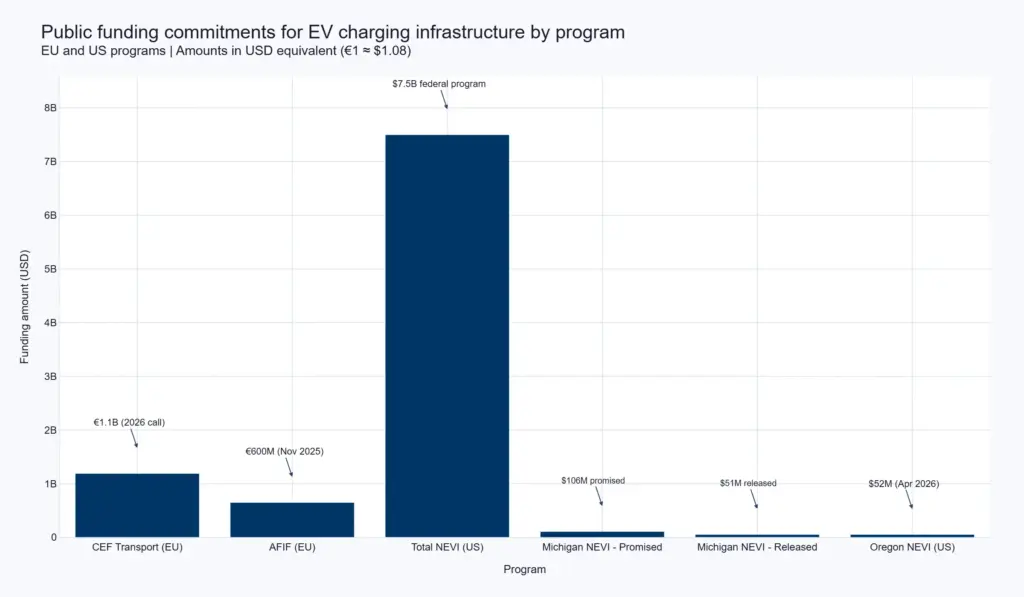
The European Commission’s 2026 Connecting Europe Facility (CEF) Transport call makes €1.1 billion available for projects that electrify road haulage, airport ground handling, and maritime port charging infrastructure along the TEN-T network. This call, launched through the European Climate, Infrastructure and Environment Executive Agency (CINEA), targets specific sectors and requires alignment with the TEN-T Regulation (EU) 2024/1679.
In November 2025, the EU awarded more than €600 million to 70 alternative fuel projects under the same CEF framework, including over 1,000 light-duty recharging points (150 kW), 2,000 heavy-duty recharging points (350 kW), and 586 ultra-high-power (1 MW) charging points. These grants also support 38 hydrogen refuelling stations. The awards span 24 EU countries and cover road, maritime, and airport infrastructure, reflecting a coordinated strategy to align charging capacity with vehicle segments and transport corridor requirements.
In contrast, the US National Electric Vehicle Infrastructure (NEVI) program—a US$7.5 billion federal initiative—has experienced funding uncertainty. Michigan was allocated US$106 million, but only half was released after the Trump administration suspended additional NEVI funding. Following a federal court ruling in January 2026, US$51 million was released in April 2026 to support construction of 60 charging stations along major travel corridors, supplementing the state’s existing network of 5,455 public chargers. However, Michigan remains well below its target of 100,000 chargers by 2030.
Oregon has experienced a more stable funding environment. In April 2026, the Oregon Department of Transportation selected seven private companies for NEVI Round 2 grants worth US$52 million over five years. The funding supports 24 DC fast-charging stations (126 charging ports) located along Interstate 84 and US Highways 20, 26, 97, and 101. The projects require 20% matching funds and are expected to become operational in 2027.
Public Funding Commitments for EV Charging Infrastructure (Selected Programs)
| Project / Program | Investor / Partner | Geography | Amount or Capacity | Timing | Status |
|---|---|---|---|---|---|
| CEF Transport 2026 Call (Road Haulage Electrification) | European Commission (CINEA) | EU / TEN-T Network | €1.1 billion | Call launched 2026 | Announced |
| AFIF Grants (70 Alternative Fuel Projects) | European Commission (CINEA) | 24 EU Countries | €600 million; 1,000+ light-duty (150 kW), 2,000 heavy-duty (350 kW), 586 (1 MW) charging points | Awarded November 2025 | Funded / Under Construction |
| Michigan NEVI Charger Expansion | US Federal NEVI Program / Michigan DOT | Michigan, USA | US$106 million allocated; US$51 million released; 60 stations | Funding released April 2026 | Under Construction |
| Oregon NEVI Round 2 Grants | US Federal NEVI Program / Oregon DOT | Oregon, USA | US$52 million; 24 stations (126 ports); 20% matching | Selected April 2026; stations online 2027 | Funded (Planned) |
Private Capital: Debt Financing and M&A as Consolidation Drivers
While public funding dominates corridor buildout, private investors are deploying capital through debt instruments and mergers to achieve scale and reduce exposure to public funding uncertainty.
Terawatt Infrastructure, which develops EV charging infrastructure and counts Waymo among its customers, secured up to US$300 million in senior secured debt financing in June 2026. The facility, led by RBC Capital Markets, with participation from Sumitomo Mitsui Banking Corporation and UBS Group AG, consists of an initial US$150 million with an option to expand by another US$150 million. The proceeds will finance the acquisition and development of charging infrastructure across the United States and international markets. The use of debt rather than equity reflects confidence in project-level cash flows while preserving shareholder ownership.
In the Nordic region, consolidation occurred through a strategic merger. In July 2026, Eviny Fast Charging and Mer agreed to combine operations to create the region’s largest fast-charging network. Subject to regulatory approvals, the merged company will operate across Norway, Sweden, Denmark, and Germany, serving more than one million registered customers through a network of approximately 3,500 charging points. Ownership of the merged company will be divided between Eviny (57%) and Statkraft (43%), which previously co-owned Mer. The merger aims to improve profitability through greater operational scale and an enhanced customer offering.
These private capital initiatives complement public funding by emphasizing operational efficiency, consolidation, and long-term financial sustainability rather than purely geographic expansion.
Visualization Recommendation
Illustrate the sequence and type of disclosed investment events from the available data:
-
- November 2025 – EU AFIF Grants
- April 2026 – Oregon NEVI Round 2
- April 2026 – Michigan NEVI Funding Release
- June 2026 – Terawatt Debt Facility
- July 2026 – Eviny–Mer Merger
- Early 2027 – Oregon Charging Stations Operational
The visualization should distinguish grant funding, debt financing, and merger activity, while highlighting geography, project status, and investment progression over time.
Investment Implications for Market Participants
The disclosed investment pattern carries significant implications for participants across the EV charging ecosystem.
-
- Equipment manufacturers producing 350 kW and 1 MW charging systems are expected to benefit directly from EU-funded deployment programs, particularly the AFIF initiative supporting more than 2,000 heavy-duty and 586 ultra-high-power charging points.
- Installation contractors operating along the TEN-T transport corridors are likely to experience sustained demand as CEF-funded projects progress.
- In the United States, charging infrastructure deployment remains highly dependent on federal funding continuity. Michigan experienced funding delays, while Oregon has maintained a more predictable implementation schedule.
- Charging network operators may increasingly rely on debt financing and strategic mergers to reduce exposure to public funding uncertainty, as demonstrated by Terawatt Infrastructure and the Eviny–Mer merger.
- Key deployment risks remain. NEVI funding may continue to face legal and political uncertainty, while EU funding remains concentrated on heavy-duty and high-power charging, potentially requiring future funding rounds for broader light-duty infrastructure.
- The Nordic consolidation demonstrates that scale is becoming increasingly important for profitability, suggesting further merger activity across mature charging markets.
- Property owners and commercial real estate developers should monitor these investment trends, as both public and private capital remain concentrated on public corridor and fleet charging infrastructure. Investment activity related to home and workplace charging is not covered in the available data and represents a notable information gap.
Key Takeaways
- EU public funding remains the largest source of capital for corridor charging infrastructure, supported by €1.1 billion through the CEF Transport 2026 call and more than €600 million through the 2025 AFIF grant program.
- US NEVI funding remains subject to policy and legal uncertainty. Michigan received only US$51 million of its US$106 million allocation following federal funding delays, while Oregon continues implementation through US$52 million in Round 2 grants.
- Private investment is increasingly focused on debt financing and industry consolidation, illustrated by Terawatt Infrastructure’s US$300 million credit facility and the Eviny–Mer merger.
- Heavy-duty and ultra-high-power charging infrastructure represents the primary beneficiary of current EU funding, while US deployment timelines remain dependent on federal funding continuity.
- The Nordic merger indicates that consolidation is becoming a key strategy for improving profitability in mature EV charging markets, a trend that may expand into additional regions.
Technology & Innovation
Technology Landscape in EV Charging Infrastructure
The EV charging infrastructure technology landscape is being reshaped by three concurrent advances: formalized charging protocol standards that enable cross-network interoperability, smart charge management systems that align vehicle charging with on-site renewable generation, and the deployment of extreme-high-power and dynamic wireless charging systems. This chapter examines the specific technologies, their maturity stages, and the implications for manufacturers, network operators, fleet owners, and utilities. The analysis is limited to communication protocols, smart charging with renewable integration, and novel high-power and wireless charging technologies. Market sizing, cost per charging port, connector hardware supply chains, and policy incentives are not covered.
Key Takeaways
- The publication of ISO/PAS 15118-23:2026 and the acceptance of OCPP 2.1 as IEC 63584-210 establish formal conformance testing and interoperability assurance for DC charging equipment, providing a standardized certification pathway for EVCC and SECC implementations.
- Smart charge management at Marine Corps Base Camp Blaz demonstrates a replicable model capable of reducing photovoltaic (PV) curtailment by up to US$150 annually at a site with 233 charging ports and 12 MW of solar generation, supporting federal fleet electrification targets by 2027.
- Tesla’s first 1.2 MW Megacharger station represents the commercial introduction of extreme-high-power charging for Class 8 electric trucks, creating new opportunities for long-haul electrification while introducing additional grid infrastructure requirements.
- Japan’s first public-road Dynamic Wireless Power Transfer (DWPT) trials demonstrated stable 10 kW in-motion charging over an 18-month testing period, recovering 63.3% of the vehicle’s driving energy. However, the technology remains in the pilot stage with no announced commercialization timeline.
Charging Protocol Standardization and Interoperability
Two recent standardization milestones are creating a more predictable environment for charging equipment certification and cross-network interoperability.
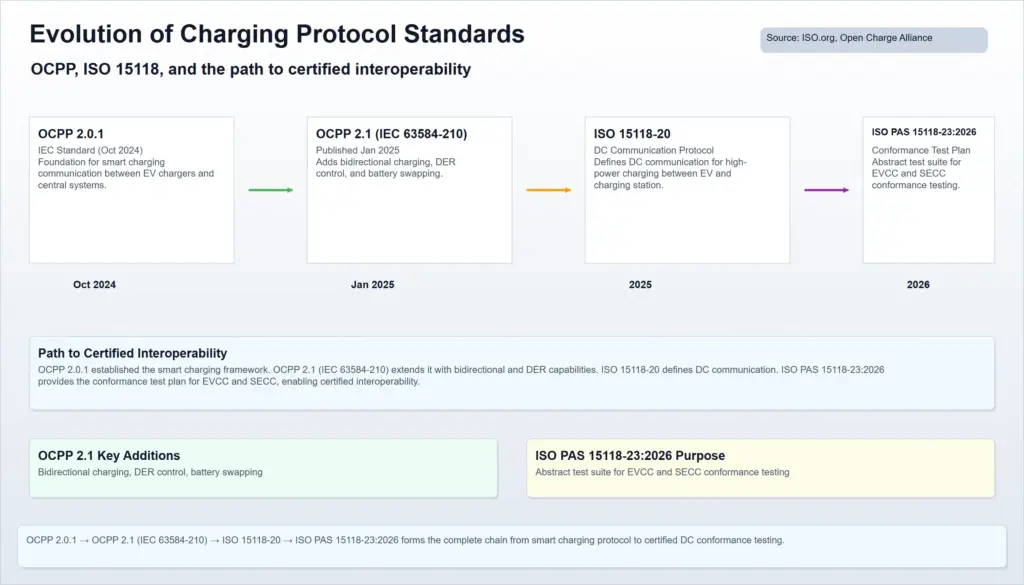
In 2026, the International Organization for Standardization (ISO) published ISO/PAS 15118-23:2026, which specifies an Abstract Test Suite (ATS) for conformance testing of Electric Vehicle Communication Controllers (EVCCs) and Supply Equipment Communication Controllers (SECCs) used in DC charging.
The Abstract Test Suite includes:
-
- Capability testing to verify static conformance requirements defined in ISO 15118-20.
- Behaviour testing to validate dynamic communication requirements.
This standardized testing framework provides equipment manufacturers with a clearly defined certification pathway while enabling charging network operators to verify interoperability between charging equipment supplied by different vendors.
Separately, the Open Charge Point Protocol (OCPP) 2.1 was accepted by the International Electrotechnical Commission (IEC) as IEC 63584-210 in early 2025.
Compared with OCPP 2.0.1, OCPP 2.1 introduces:
-
- Support for ISO 15118-20.
- Bidirectional charging functionality.
- Distributed Energy Resource (DER) control.
- Battery swapping support.
- Expanded authorization methods.
The combination of ISO/PAS 15118-23 and IEC 63584-210 establishes a stronger certification ecosystem covering both vehicle-side and charging infrastructure communication while reducing proprietary system lock-in and improving cross-network interoperability.
Smart Charging and Renewable Energy Integration
A real-world deployment at Marine Corps Base Camp Blaz on Guam demonstrates how intelligent charge management can convert potential renewable energy curtailment into productive charging demand.
The facility, scheduled to open in 2027, will include:
-
- 233 EV charging ports
- 12 MW solar photovoltaic generation
The Naval Facilities Command (NAVFAC), supported by the National Renewable Energy Laboratory (NREL) and the Federal Energy Management Program (FEMP) EV Tiger Team, is implementing smart charging software that schedules vehicle charging during periods of maximum solar generation.
Without charge management, approximately US$150 of solar generation would be curtailed annually.
The smart charging strategy delivers several benefits:
-
- Reduced renewable energy curtailment.
- Improved utilization of on-site solar generation.
- Reduced stress on the local electricity grid.
- Compliance with Executive Order 14057 requiring all federal light-duty fleet acquisitions to become zero-emission vehicles by 2027.
The Camp Blaz project demonstrates a scalable deployment model applicable to military facilities, corporate campuses, logistics hubs, and fleet operations integrating renewable generation with electric vehicle charging infrastructure.
Ultra-Fast and Dynamic Charging Technologies
Two different charging technologies achieved important milestones during 2026, each targeting a different segment of electric vehicle charging.
Tesla Megacharger
Tesla opened its first Megacharger station in Bloomington, California, during July 2026.
The facility includes:
-
- Six charging stalls.
- Charging capacity of up to 1.2 MW per stall.
- Drive-through charging bays designed for Class 8 electric trucks.
Tesla Semi specifications include:
-
- Standard Range – 548 kWh battery with a driving range exceeding 500 km.
- Long Range – 822 kWh battery with a driving range of approximately 800 km.
The Megacharger network is designed to support long-haul freight corridors and depot charging, although detailed charging curves and grid connection requirements are not available in the supplied evidence.
Dynamic Wireless Power Transfer (DWPT)
Japan conducted the first public-road trials of Dynamic Wireless Power Transfer (DWPT) for passenger electric vehicles.
The prototype system demonstrated:
-
- Approximately 10 kW wireless power transmission while the vehicle was moving.
- Recovery of 63.3% of the vehicle’s energy consumption during driving.
- Stable underground transmission coil performance throughout an 18-month testing period.
- No false vehicle detection or unintended energy transmission.
The results confirm the technical feasibility of in-motion wireless charging. However, commercial deployment timelines have not been announced, and significant challenges remain regarding infrastructure deployment and power scaling.
Comparison of Ultra-Fast and Dynamic Wireless Charging Technologies
| Technology | Participant | Performance Metric | Status | Primary Application | Evidence-Based Implication |
|---|---|---|---|---|---|
| Extreme High-Power Charging (Megacharger) | Tesla | 1.2 MW per stall; 6 charging stalls; Semi battery capacity 548–822 kWh | Commercial deployment (July 2026) | Heavy-duty Class 8 truck charging | Enables rapid long-haul charging but requires substantial grid infrastructure investment. |
| Dynamic Wireless Power Transfer (DWPT) | Japan Research Consortium | 10 kW transmission; 63.3% driving energy recovery; stable operation over 18 months | Pilot Stage (2026) | In-motion passenger EV charging | Demonstrates technical feasibility but requires higher power capability and infrastructure development before commercialization. |
Market Risk
EV Charging Infrastructure Market Risk & Disruption Analysis
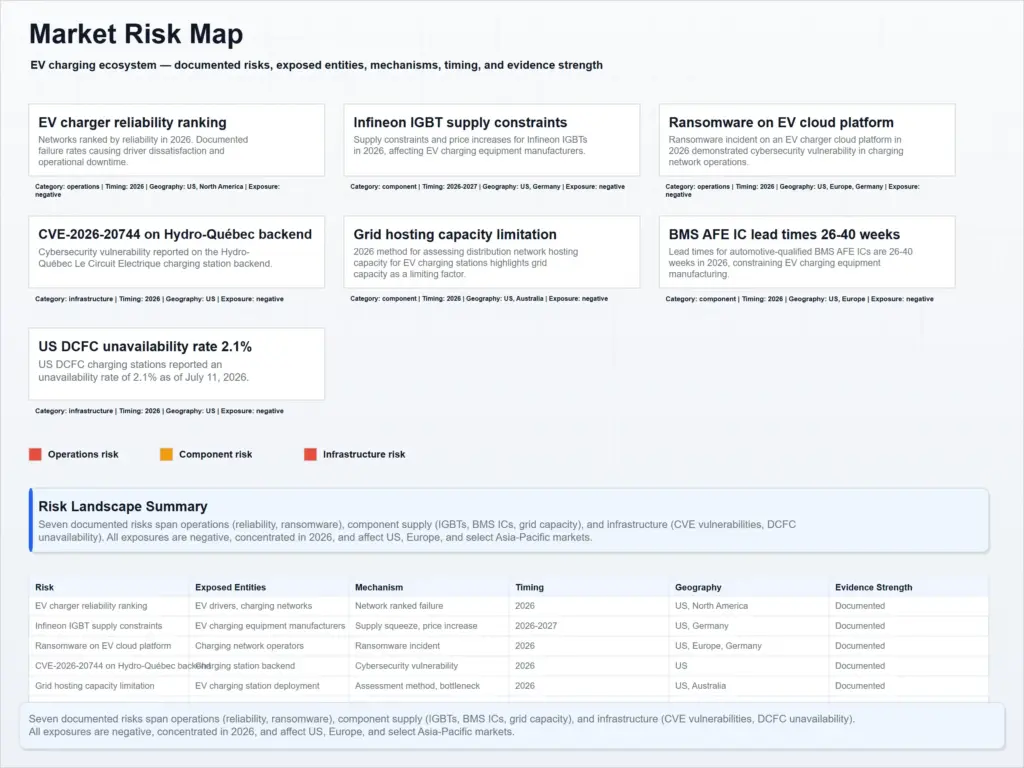
The EV charging infrastructure market is exposed to a convergence of operational, component supply, cybersecurity, and grid capacity risks in 2026. These risks collectively threaten deployment targets, driver confidence, and network profitability. This chapter covers the supported evidence for these four risk categories, focusing primarily on the US market while incorporating global findings where available. The analysis excludes upstream raw material constraints and non-infrastructure risks such as EV demand fluctuations or macroeconomic factors.
Key Takeaways
- Charger reliability remains a critical operational risk. Top networks achieve uptime ranging up to 99.7%, while 2.1% of US DC fast charging (DCFC) stations are reported as temporarily unavailable.
- Component supply constraints for IGBTs and BMS AFE ICs are causing price increases and lead times of 26–40 weeks, threatening manufacturing schedules for charging equipment.
- Cybersecurity incidents, including ransomware attacks and critical backend vulnerabilities, expose network operators to data breaches, privilege escalation, and regulatory penalties.
- Grid capacity assessment methods reveal upstream bottlenecks that limit the pace and location of new charging station deployment.
Operational Reliability: Network Downtime and Driver Impact
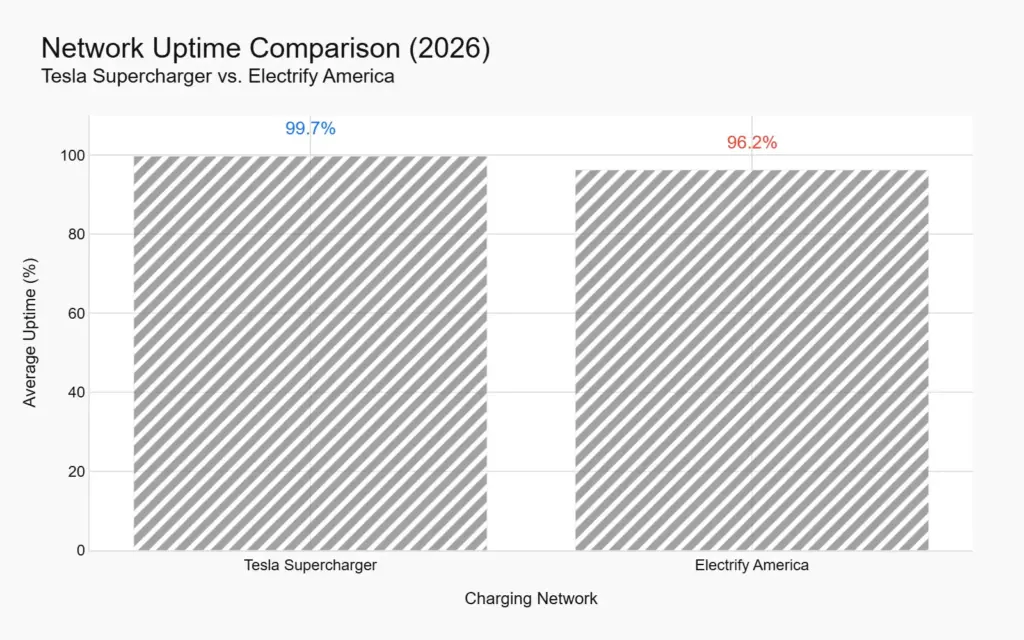
A 2026 ranking of EV charging networks in North America measured average uptime ranging from 99.7% (Tesla Supercharger) to 96.2% (Electrify America). The data, drawn from 2,173 real-world charging sessions across 14 networks, documents significant variation in reliability. Networks with lower uptime expose drivers to a higher risk of encountering non-functional stations, eroding trust and reducing utilisation for network operators.
Separately, a snapshot from the US Alternative Fuels Data Center (AFDC) showed that, as of 11 July 2026, 1,829 stations—representing 2.1% of 88,810 tracked stations—were flagged as temporarily unavailable. Although this aggregate rate is relatively low, it masks network-level differences and does not capture the duration or frequency of outages. Hardware malfunctions, software glitches, connectivity failures, and delayed maintenance remain the primary causes of downtime. For network operators, each outage represents lost revenue, increased customer support costs, and reputational damage.
Network Uptime, Speed, and Cost per kWh for Selected Top US EV Charging Networks (2026)
| Rank | Network | Avg. Uptime | Max Speed (kW) | Cost per kWh (USD) |
|---|---|---|---|---|
| 1 | Tesla Supercharger | 99.7% | 250 | US$0.32–0.48 |
| 2 | Electrify America | 96.2% | 350 | US$0.36–0.56 |
Visualization Recommendation
-
- Develop a visual comparison of average uptime for the two leading US EV charging networks using the provided 2026 data.
- Use the RankVault reliability ranking together with the AFDC snapshot as supporting evidence.
- Highlight the reliability gap between Tesla Supercharger and Electrify America.
Component Supply Constraints: IGBTs and BMS AFE ICs
Power semiconductor and battery management components continue to face severe supply constraints in 2026, directly affecting EV charging equipment manufacturers.
In May 2026, Infineon announced its second price increase of the year, effective from 1 July, covering IGBT modules, power MOSFETs, high-density PMICs, and automotive-grade devices. The company attributed the increase to rising energy, raw material, and logistics costs, together with demand that had greatly exceeded previous industry forecasts, particularly from new energy vehicles, AI data centres, and industrial automation. Although the specific percentage increase was not disclosed, two price adjustments within six months indicate sustained upward pressure on manufacturing costs.
Meanwhile, automotive-qualified BMS AFE ICs—the core safety-critical chips used in battery management systems—are experiencing lead times of between 26 and 40 weeks. Components supplied by Texas Instruments, Analog Devices, NXP, and STMicroelectronics are all affected due to demand from approximately 12 million EVs expected to ship globally during 2026. The supply bottleneck is concentrated in legacy analog/mixed-signal manufacturing nodes (180nm–130nm BCD) at TSMC, ST, and TI fabrication facilities. Because each BMS AFE architecture requires between 9 and 18 months of functional safety re-validation, dependence on single-source suppliers creates unusually high sourcing risk for EV charging station manufacturers that design integrated battery storage or power conversion systems.
Component Supply Risk Dimensions for IGBTs and BMS AFE ICs (2026)
| Risk Dimension | IGBT Modules / Power MOSFETs | BMS AFE ICs |
|---|---|---|
| Affected manufacturers | Infineon | TI, ADI, NXP, ST |
| Lead time impact | Not specified; second price increase signals tight allocation | 26–40 weeks |
| Price impact | Two price increases during 2026 (April & July); exact rates confidential | Allocation status reported; no direct pricing disclosed |
| Underlying cause | Rising energy, raw material and logistics costs; rapidly increasing demand | Approximately 12 million EV shipments; constrained fab capacity at 180–130nm nodes |
| Exposure for charger manufacturers | Higher bill-of-material costs and possible delivery delays | Sourcing risk requiring 9–18 months of re-validation for alternative AFE suppliers |
Cybersecurity Vulnerabilities in Network Operations
Three distinct cybersecurity incidents during 2026 illustrate the range of threats facing EV charging network operators.
In March 2026, ELECQ, a manufacturer of smart EV chargers, experienced a ransomware attack targeting its AWS cloud platform. Attackers encrypted and exfiltrated customer information, including names, email addresses, phone numbers, and home addresses. Financial information was not compromised. The company reported the breach to regulators in both the UK and Germany, indicating an impact on European customers. Although the charging devices themselves remained operational, the incident exposed vulnerabilities within cloud-based management systems.
At the critical-severity level, CVE-2026-20744 was assigned to Hydro-Québec’s Le Circuit Électrique charging station backend. A WebSocket endpoint accepted unauthenticated connections, enabling privilege escalation. The vulnerability received CVSS v4.0 and CVSS v3.1 scores of 9.3 and 9.8 respectively, demonstrating that unauthenticated attackers could potentially gain administrative access, manipulate charging sessions, or access sensitive operational data.
Also during March 2026, CISA published advisory ICSA-26-062-08 concerning Everon OCPP Backends. The advisory identified multiple critical vulnerabilities, including missing authentication for critical functions, inadequate protection against repeated login attempts, and insufficient session expiration. Successful exploitation could allow attackers to obtain administrative control over charging infrastructure or disrupt charging services.
Together, these incidents demonstrate that charging network operators face risks from both cloud-platform attacks and protocol-level vulnerabilities affecting OCPP-based charging infrastructure.
Grid Capacity and Deployment Bottlenecks
A 2026 academic study introduced a methodology for assessing distribution network hosting capacity for EV charging stations, identifying grid capacity as a structural constraint affecting infrastructure deployment.
The methodology combines multi-zone load profiling, an improved ISODATA clustering algorithm, genetic algorithms, Ordinary Kriging, and an entropy-weighted TOPSIS model to evaluate capacity at 10 kV, 35 kV, and 110 kV distribution levels. The study found that upstream network constraints frequently remain hidden when assessments focus only on local transformer capacity.
Although based on academic modelling rather than operational deployment data, the research highlights an important infrastructure risk. Even where local transformer capacity appears sufficient, higher-voltage distribution circuits, utility interconnection queues, and grid upgrade lead times may restrict the number of charging stations that can be connected.
Risk Comparison
The following table compares two of the most material risks across key dimensions.
Comparison of Operational Reliability and Component Supply Risks
| Risk | Mechanism | Exposed Participants / Geography | Timing | Supported Consequence |
|---|---|---|---|---|
| Network reliability | Charger hardware/software failure, connectivity loss, maintenance delays | EV drivers and charging network operators (North America) | Ongoing throughout 2026 | Drivers face 2.1% station-level unavailability; top networks range from 99.7% to 96.2% uptime; lost charging revenue and reduced customer satisfaction |
| Component supply constraints | Demand exceeds supply; energy and raw material cost pass-through; allocation constraints at mature semiconductor fabs | EV charging equipment manufacturers (Global, particularly Europe and North America) | 2026 (Infineon price increases effective April and July; lead times of 26–40 weeks) | Increased bill-of-material costs, manufacturing delays, and single-source risk for BMS AFE ICs requiring 9–18 months of re-validation |
Evidence Gaps
Evidence gaps remain and should be considered when interpreting this assessment.
- The market size estimate of US$40.22 billion is derived from a single web source and should be regarded as indicative.
- Network uptime data comes from one independent reliability study and one AFDC snapshot. Actual performance across all charging stations may differ.
- Component lead-time and pricing information reflects only two semiconductor component families and may not represent the broader EV charging supply chain.
- Cybersecurity incidents are based on verified reports but represent a limited sample, and no quantitative assessment of financial impact has been supplied.
- The grid capacity assessment relies on a single academic methodology rather than real-world deployment data, limiting direct quantification of deployment risk.
These limitations should be considered when using this chapter for strategic planning and investment decision-making.
Regulatory Landscape
Regulation
This chapter covers binding regulatory instruments directly governing the deployment, operation, and interoperability of EV charging infrastructure. It focuses on the United States, the European Union, and India as representative jurisdictions, covering technical standards, reporting obligations, procurement requirements, building codes, and incentive programs.
Key Takeaways
- US EV charging regulation is transitioning from voluntary industry standards to binding procurement rules and building code mandates, increasing compliance costs and reshaping supply chains.
- The European Union’s Alternative Fuels Infrastructure Regulation (AFIR) imposes mandatory data transparency obligations with phased implementation deadlines during 2025–2026, creating technical integration challenges for operators active across multiple countries.
- Subnational regulatory interventions, including California’s Low Carbon Fuel Standard (LCFS) infrastructure credits and Delhi Electricity Regulatory Commission (DERC) cost reallocation framework, use different policy mechanisms to accelerate EV charging infrastructure deployment.
- Technical standards for charging connectors and communication protocols remain fragmented across regions, sustaining interoperability costs for global equipment manufacturers and charging network operators.
- The 2026 National Electrical Code (NEC) and International Building Code (IBC) 2025 updates incorporate EV charging infrastructure requirements into building regulations, directly affecting commercial property developers, installation contractors, and electrical inspectors.
Standardization and Interoperability Mandates
Hardware and communication standards form the technical foundation for interoperability across EV charging networks. SAE J1772 (introduced in 2009) is the North American standard for Level 1 and Level 2 charging connectors, specifying physical, electrical, and communication requirements, including a five-pin connector measuring 33.5 mm in length and 43.8 mm in diameter. Its international counterpart, IEC 62196, defines Type 1 and Type 2 connector standards globally, with Type 2 serving as the dominant connector standard throughout Europe. ISO 15118 establishes the communication protocol for DC charging and vehicle-to-grid (V2G) interactions, enabling advanced functions such as Plug & Charge.
For network-level communication, the Open Charge Alliance operates the Open Charge Point Protocol (OCPP) certification programme. Vendors may only claim OCPP compliance after successfully completing independent conformance testing for versions 1.6 or 2.0.1 at accredited laboratories such as Dekra and DNV. Although OCPP certification reduces integration risks in multi-vendor deployments and serves as an important market trust indicator, participation remains voluntary rather than legally mandated.
Separately, ETSI EN 303 413 (Version 1.2.1, 2021) establishes technical requirements for Global Navigation Satellite System (GNSS) receivers operating within the 1,164–1,300 MHz and 1,559–1,610 MHz frequency bands. As a harmonised standard under EU Directive 2014/53/EU, it applies to radio equipment, including location-enabled EV charging stations using satellite positioning for smart charging services. Compliance provides a presumption of conformity with the directive, making it effectively mandatory for applicable equipment marketed within the European Union.
Data Transparency and Reporting Obligations
The European Union Alternative Fuels Infrastructure Regulation (AFIR) requires Charge Point Operators (CPOs) managing publicly accessible charging infrastructure to report data through National Access Points (NAPs). Under Article 20, operators must provide both:
-
- Static data, including charging station characteristics, location, and connector types.
- Dynamic data, including real-time availability and pricing information.
Implementation occurs in two phases:
-
- Basic data-sharing requirements became mandatory on 14 April 2025.
- Mandatory implementation of the DATEX II reporting format takes effect on 14 April 2026.
Failure to comply may result in financial penalties, while the European Commission may issue recommendations to Member States. Multi-country charging operators face additional technical complexity because they must integrate with multiple national reporting platforms.
Domestic Content and Procurement Rules
On 10 February 2026, the Federal Highway Administration (FHWA) proposed modifications to its February 2023 Buy America waiver covering EV chargers used in Federal-aid highway projects, including chargers funded through the National Electric Vehicle Infrastructure (NEVI) programme.
The existing waiver permits a 55% domestic content threshold, while the proposed modification would increase this requirement to up to 100% of total component costs. The proposal cites cybersecurity concerns associated with foreign-manufactured components and the availability of domestic manufacturing capacity within the United States.
If finalised, the revised procurement requirement would immediately apply to all federally funded EV charger acquisitions and installations. The proposal remains under public consultation while FHWA evaluates stakeholder comments before determining whether to adopt, modify, or withdraw the proposal.
The procurement framework can be summarised as follows:
| Requirement | Current Rule | Proposed Rule |
|---|---|---|
| Domestic content threshold | 55% | Up to 100% |
| Scope | Federal-aid highway EV charging projects (including NEVI-funded chargers) | Federal-aid highway EV charging projects (including NEVI-funded chargers) |
| Affected participants | Equipment manufacturers, installation contractors, State Departments of Transportation | Equipment manufacturers, installation contractors, State Departments of Transportation |
| Status | Current waiver in force | Proposed (February 2026), awaiting final determination |
Building and Electrical Codes
The International Building Code (IBC), as adopted by jurisdictions including Washington State, mandates minimum EV charging infrastructure requirements for new buildings and accessory structures.
Section 429 specifies minimum numbers of:
-
- EV-capable parking spaces.
- EV-ready parking spaces.
- EV Supply Equipment (EVSE) spaces.
Requirements vary according to occupancy classification and total parking capacity, as detailed in Table 429.2. Exemptions apply where commercial electrical service is unavailable or where residential dwellings lack garages. Buildings outside Groups A, E, and M with fewer than ten on-site parking spaces are also exempt.
The 2026 National Electrical Code (NEC) updates Article 625 to address increasing charger power levels and operational complexity through:
-
- Enhanced ground-fault protection.
- Improved disconnecting means.
- Clearer equipment identification requirements.
- Greater emphasis on qualified installation practices and inspector competency.
These requirements directly affect commercial property developers, installation contractors, and electrical inspectors responsible for ensuring compliance with EV charging safety standards.
Market-Based Regulatory Incentives and Local Interventions
California’s Low Carbon Fuel Standard (LCFS) includes infrastructure crediting provisions under Sections 95486.2, 95486.3, and 95486.4, allowing DC fast charging operators to generate credits based on charger capacity, fuel dispensed, and operational uptime.
As of November 2025:
-
- 1,042 fast charging sites had been approved.
- 6,632 DC fast chargers qualified under the programme.
A programme cap limiting infrastructure credits to 2.5% of total deficits helps control overall credit issuance while encouraging investment in reliable, high-capacity charging infrastructure.
In Delhi, the Delhi Electricity Regulatory Commission (DERC) amended its regulations during July 2026 to address upstream electricity infrastructure costs. Under the revised framework:
-
- Infrastructure costs for transformers and transmission lines may be funded through the Government of India’s PM E-DRIVE Scheme rather than recovered through electricity tariffs.
- Charge Point Operators must submit proof of payment of distribution company (discom) demand notes before receiving 70% of the eligible subsidy.
- Infrastructure costs cannot be recovered from electricity consumers and must instead be borne by Charge Point Operators.
The PM E-DRIVE Scheme allocates ₹2,000 crore to support deployment of 72,000 public charging stations across India.
These contrasting approaches—market-based incentives in California and subsidy-supported infrastructure cost sharing in Delhi—illustrate different regulatory mechanisms for accelerating private investment in EV charging infrastructure.
Key Compliance and Implementation Dates
| Instrument | Jurisdiction | Milestone Date | Affected Participants |
|---|---|---|---|
| AFIR Article 20 – Basic Data Reporting | European Union | 14 April 2025 | Charge Point Operators |
| AFIR Article 20 – DATEX II Mandatory | European Union | 14 April 2026 | Charge Point Operators |
| FHWA Buy America Waiver Modification Proposal | United States | 10 February 2026 (Proposal) | Equipment manufacturers, installation contractors, State DOTs |
| International Building Code (IBC) EV Infrastructure Requirements | United States | IBC 2025 adoption (jurisdiction dependent) | Commercial property developers, architects, builders |
| National Electrical Code (NEC) Article 625 Updates | United States | 2026 adoption cycle | Electrical inspectors, contractors, developers |
Comparison of Key Regulatory Frameworks
| Jurisdiction | Instrument | Requirement | Effective Date | Affected Participants |
|---|---|---|---|---|
| United States (Federal) | FHWA Buy America Waiver Modification (NEVI) | Increase domestic content threshold from 55% to up to 100% of component cost for EV chargers used in Federal-aid highway projects | Proposed February 2026; finalisation pending after consultation | Equipment manufacturers, installation contractors, State Departments of Transportation |
| European Union | AFIR Article 20 | Mandatory reporting of static and dynamic charging data through National Access Points using DATEX II | Data sharing: 14 April 2025; DATEX II mandatory: 14 April 2026 | Charge Point Operators managing publicly accessible charging stations |
The regulatory environment for EV charging infrastructure is characterised by increasingly stringent compliance requirements and differing regional policy approaches. Voluntary technical standards are gradually being complemented by binding procurement rules, data transparency obligations, and building code requirements, while regional governments continue using financial incentives and infrastructure support programmes to accelerate deployment. Manufacturers, charging network operators, developers, and infrastructure providers must navigate a complex and evolving regulatory landscape that varies significantly across jurisdictions.