
Global stationary energy storage systems (ESS) market Report, Size & Forecast 2026-2033
Global stationary energy storage systems (ESS) market Forecast Snapshot 2026 - 2033
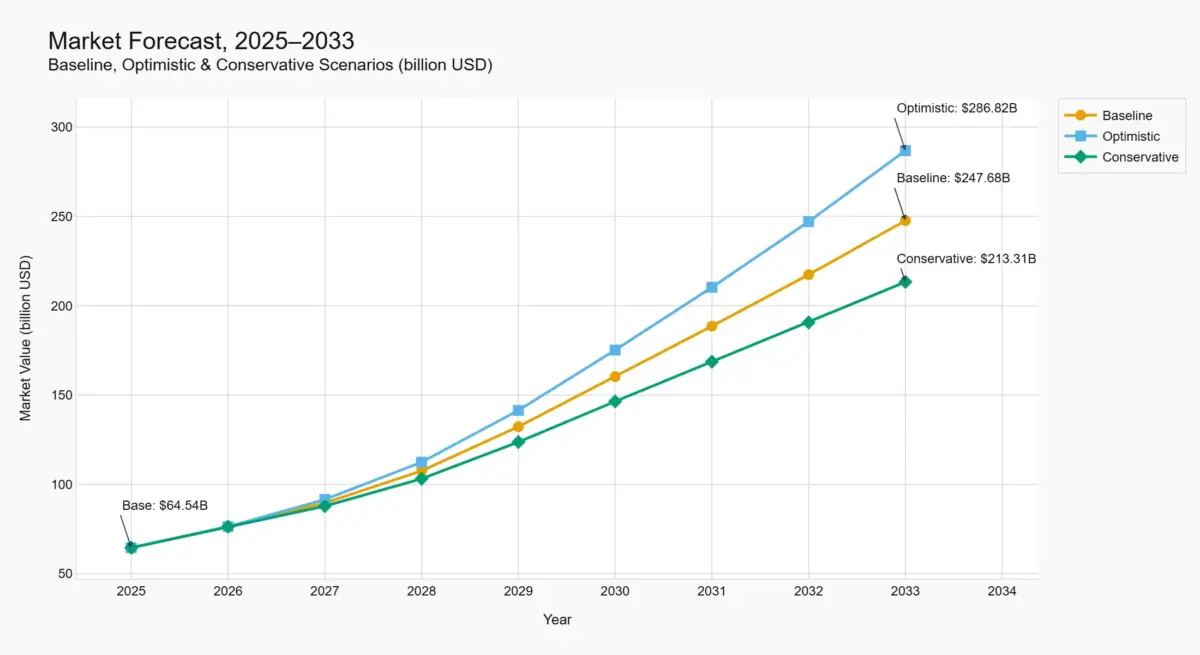
The global stationary energy storage systems (ESS) market includes grid-scale, commercial and industrial (C&I), and residential installations using lithium-ion and emerging sodium-ion technologies. The market is projected to increase from USD 64.54 billion in 2025 to USD 247.68 billion by 2033, representing a baseline CAGR of 18.31%. The forecast period runs from 2025, the base year, through 2033.
Three growth scenarios are considered: an optimistic scenario with a 20.81% CAGR, a baseline scenario, and a conservative scenario with a 15.81% CAGR. Growth is expected to be front-loaded, with the strongest annual gains occurring between 2028 and 2030 as early policy support, manufacturing ramp-up, and improvements in technology costs accelerate market expansion.
| Metric | Value |
|---|---|
| Base year market size (2025) | USD 64.54 billion |
| Forecast window | 2026 – 2033 |
| Baseline CAGR (2025–2033) | 18.31% |
| Optimistic CAGR | 20.81% |
| Conservative CAGR | 15.81% |
| Baseline market value (2033) | USD 247.68 billion |
| Growth shape | Front-loaded (peak growth 2028–2030) |
| Largest regions (qualitative) | United States, China, Europe, India |
| Dominant technology segment | Lithium-ion (LFP) grid-scale |
| Key trends | Domestic content incentives, sodium-ion emergence, large-format cells, long-duration storage |
Global stationary energy storage systems (ESS) market Overview
The global stationary energy storage systems market includes grid-scale, commercial and industrial (C&I), and residential installations using lithium-ion and emerging sodium-ion technologies. The market is valued at USD 64.54 billion in 2025, which serves as the base year and is derived from a single web estimate.
The market is expected to maintain strong growth as supportive policies, falling battery costs, and rapid manufacturing scale-up come together. However, growth is unlikely to follow a straight path. Regulatory measures and supply-side investments will support demand, while trade restrictions, material supply risks, and rising near-term levelised costs could create pressure. Growth is expected to be strongest during 2028–2029 before gradually moderating as the market becomes more mature.
Drivers, Restraints, Opportunities, and Threats (DROC) Analysis of the Global Stationary Energy Storage Systems (ESS) Market
Key Drivers
Policy and regulatory catalysts
Three regulatory actions create near-term demand pull. In the United States, New Hampshire’s HB 1718, passed in 2026, mandates a framework for net metering credits for solar‑charged stationary storage, directly incentivizing residential deployment. In Germany, transmission system operators began market‑based procurement of inertia (instantaneous reserve) in January 2026, offering long‑term contracts for grid‑forming battery energy storage systems. In India, POWERGRID invited bids in July 2026 for a 500 MW/1,000 MWh battery energy storage system project across multiple locations, signalling the country’s commitment to large‑scale storage for renewable integration.
Manufacturing capacity buildout
Announced gigafactories are expanding supply and diversifying technology. Peak Energy plans a 4 GWh sodium‑ion factory in California (shipments Q1 2027), with over 6 GWh of customer commitments. Zenergy signed a 50 GWh long‑duration LFP manufacturing project in Suzhou (phase 1 production Q3 2027, phase 2 in 2028). Ultium Cells began LFP cell production for ESS in July 2026 after converting an EV line in Tennessee, meeting U.S. domestic‑content requirements. These investments underpin supply confidence and reduce dependence on single sources.
Long‑run cost declines and large‑format cell economies
IRENA reported that battery storage costs fell 93% since 2010, reaching USD 192/kWh in 2024, and cell prices dropped 20% in 2024 to USD 115/kWh. Chinese manufacturers are ramping 500 Ah+ LFP cells (CATL 587 Ah, EVE Energy 628 Ah, HiTHIUM 1,175 Ah) that improve module‑level energy density by 60–80%, cutting balance‑of‑system costs. Research firm Intertek CEA projects these large‑format cells will reduce overall BESS system costs through 2027 even as lithium prices rise.
Restraints
FEOC restrictions and rising levelised cost of storage (LCOS)
The U.S. government's “foreign entity of concern” (FEOC) restrictions, introduced in 2025, limit the investment tax credit eligibility for projects using Chinese‑manufactured cells. According to Lazard’s 2026 report, the utility‑scale LCOS without the ITC increased from USD 115–254/MWh in 2025 to USD 210–292/MWh in 2026. Even with the ITC, LCOS now ranges from USD 148–209/MWh, a significant increase that raises project costs and slows deployment in the near term.
Material supply risks
Critical battery materials face concentrated supply disruptions. The Democratic Republic of Congo supplies ~70% of global cobalt; a 2026 customs‑quota glitch threatened 20,000 tonnes worth USD 1.1 billion, driving a 160% price surge. BHP suspended its Nickel West operations, removing a key source of Class 1 nickel. Graphite supply from Mozambique’s Balama mine was halted for nearly a year due to political unrest. Lithium extraction in Chile faces water‑rights disputes with Indigenous communities. These risks increase cell costs and supply‑chain uncertainty.
Power electronics bottlenecks
IGBT and silicon‑carbide (SiC) modules face a demand‑versus‑foundry capacity gap exceeding 18% in 2026. Lead times for IGBT modules reach 30–45 weeks, causing delays for inverter supplies. One manufacturer saw ON Semiconductor IGBT allocations pushed out by 15 weeks, threatening factory output. These bottlenecks slow project commissioning and raise procurement costs.
Opportunities
Domestic manufacturing and IRA incentives
FEOC restrictions, while raising costs, simultaneously create a pull for domestic cell production. Fluence’s 800 MWh Avantus project in California draws cells, modules, and enclosures from U.S. factories, ensuring IRA eligibility. The emergence of LFP and sodium‑ion factories in North America and India positions local manufacturers to capture growing demand from grid and AI data‑centre applications.
Sodium‑ion and long‑duration storage
Sodium‑ion technology offers a 20% cost reduction over lithium‑ion and eliminates exposure to lithium and cobalt price volatility. Peak Energy’s factory and its customer commitments (Jupiter Power, Energy Vault) demonstrate commercial viability. Zenergy’s 50 GWh plant targets 4‑ to 12‑hour discharge cycles, addressing the growing need for long‑duration storage to support high renewable penetration.
Second‑life battery deployment
B2U Storage Solutions deployed 24 MWh of second‑life EV batteries in Texas at under USD 100/kWh, compared to ~USD 149/kWh for new systems. The facility participates in ERCOT markets and plans to scale to 100 MWh. This pathway offers a low‑cost complement to new BESS, leveraging retired automotive packs that still retain significant capacity.
Threats
Geopolitical and trade disruptions
Beyond FEOC, U.S. tariff expansions (Section 232, AD/CVD investigations on battery materials) and forced‑labour scrutiny create procurement volatility. Border detentions and uncertain trade policy force developers to adopt early procurement and contractual risk‑allocation strategies, adding costs and complexity.
Interconnection cost uncertainty
The Shoreham battery project on Long Island faces estimated grid‑connection costs ranging from USD 0 to 27 million on a total budget of USD 86 million. Such swings can render projects financially unviable. Grid upgrade requirements are difficult to predict before detailed engineering, introducing risk into project financing.
Certification and safety incidents
A December 2025 fire at an unauthorised BESS facility in Warwick, New York, caused by water infiltration and lack of a Certificate of Compliance, highlights the risks of uncertified installations. Intensified regulatory scrutiny and potential liability costs could delay project approvals and increase compliance burdens for developers.
Global Stationary Energy Storage Systems (ESS) Market Segmentation
- 1.1 By Technology
- 1.1.1 Lithium-Ion Energy Storage Systems
- 1.1.2 Sodium-Ion Energy Storage Systems
- 1.1.3 Flow Battery Systems
- 1.1.4 Other Energy Storage Technologies
- 1.2 By Application
- 1.2.1 Grid-Scale Energy Storage
- 1.2.2 Commercial & Industrial (C&I) Energy Storage
- 1.2.3 Residential Energy Storage
- 1.3 By End User
- 1.3.1 Electric Utilities & Grid Operators
- 1.3.2 Renewable Energy Developers
- 1.3.3 Commercial & Industrial Customers
- 1.3.4 Residential Consumers
- 1.4 By System Component
- 1.4.1 Battery Cells & Modules
- 1.4.2 Battery Management Systems (BMS)
- 1.4.3 Power Conversion Systems (PCS)
- 1.4.4 Energy Management Systems (EMS)
Regional Insights
The market is global, with the strongest evidence for the United States, China, Germany, and India.
United States: Policy catalysts (NH net metering, FEOC restrictions), manufacturing investments (Peak Energy, Ultium Cells, Honda-LG), and project awards (Fluence 800 MWh, B2U second-life) position the U.S. as a key growth market, though near-term costs have risen due to trade restrictions.
China: The largest manufacturing hub, with CATL, EVE Energy, and HiTHIUM producing large-format LFP cells and Zenergy building a 50 GWh long-duration plant. China removed its storage mandate for new renewables, introducing market-based uncertainty, but remains dominant in cell supply.
Germany: The first TSO-led inertia procurement for grid-forming BESS in January 2026 creates a new revenue stream for storage, supporting front-loaded demand in Europe.
India: POWERGRID’s 500 MW/1,000 MWh tender and iNVERGY’s 3 GWh gigafactory indicate accelerating deployment under the Make in India initiative.
Other regions, such as the Middle East and Australia, are mentioned anecdotally but lack detailed evidence.
Leading Companies in the Market
Based on the supplied evidence, the following companies are active in manufacturing, project development, or component innovation:
-
- Fluence: Secured a 200 MW/800 MWh Smartstack contract with domestic‑content sourcing; acts as single EPC contractor.
- Peak Energy: First U.S. sodium‑ion BESS factory (4 GWh) with customer commitments exceeding capacity.
- Zenergy Battery: Chinese manufacturer with a 50 GWh long‑duration LFP plant.
- iNVERGY: Indian gigafactory (3 GWh) producing LFP BESS units.
- Ultium Cells (LG‑GM JV): Converted EV line to LFP ESS production in Tennessee.
- Invinity Energy Systems: Vanadium flow battery provider for tribal microgrid (Project VITALITY).
- Dukosi, A123 Systems, Nuvation Energy: Collaborated on chip‑on‑cell monitoring reference platform
- B2U Storage Solutions: Second‑life EV battery deployment in ERCOT.
Why the Market Is Accelerating
The stationary energy storage market is not merely growing; it is accelerating because storage has become the linchpin for grid decarbonisation, renewable integration, and the surge in electricity demand from AI and data centres. Policy frameworks in the US, Germany, and India are creating new revenue mechanisms (inertia procurement, net metering, large‑scale tenders) that de‑risk investments. Simultaneously, manufacturing capacity is diversifying across technologies (sodium‑ion, long‑duration LFP) and geographies (US, China, India), reducing reliance on single supply chains. Although near‑term headwinds from trade restrictions and rising LCOS are real, they are counterbalanced by long‑run cost declines and large‑format cell economies. The conservative and optimistic scenario endpoints (±3 percentage points from baseline CAGR) bracket the risk‑reward balance: the market can absorb shocks from material disruptions and policy shifts, but the underlying demand for grid resiliency and renewable firming ensures a strong positive trajectory.
Table of Contents
1. Executive Summary
1.1 Market Snapshot (2026–2033)
1.2 Key Market Highlights
1.3 Forecast Assumptions & Scenario Overview
1.4 Demand-Supply Overview
1.5 Analyst Viewpoint
2. Market Overview
2.1 Introduction to the Global Stationary Energy Storage Systems (ESS) Market
2.2 Market Definition & Scope
2.3 Industry Value Chain Analysis
2.4 Market Evolution & Historical Trends
2.5 ESS Supply Chain Structure
2.6 Grid Modernization, Renewable Integration & Energy Transition
3. Global Stationary Energy Storage Systems (ESS) Market Forecast Snapshot (USD Billion), 2025–2033
3.1 Base Year Market Size (2025)
3.2 Baseline Market Forecast (2033)
3.3 CAGR (2025–2033)
3.4 Market Direction
3.5 Largest Regions
3.6 Dominant Technology Segment
3.7 Key Trends
3.8 Future Outlook
4. Market Forecast Scenario Analysis
4.1 Baseline Forecast Scenario
4.2 Optimistic Forecast Scenario
4.3 Conservative Forecast Scenario
4.4 Year-by-Year Market Forecast (2025–2033)
4.5 Growth Shape Analysis
4.6 Annual Growth Rate Analysis
4.7 Scenario Comparison & Market Implications
5. Market Dynamics
5.1 Drivers
5.1.1 Policy & Regulatory Catalysts
5.1.2 Manufacturing Capacity Expansion
5.1.3 Battery Cost Decline & Large-Format Cell Innovation
5.2 Restraints
5.2.1 FEOC Restrictions & Rising LCOS
5.2.2 Critical Material Supply Risks
5.2.3 Power Electronics Supply Bottlenecks
5.3 Opportunities
5.3.1 Domestic Manufacturing & IRA Incentives
5.3.2 Sodium-Ion & Long-Duration Energy Storage
5.3.3 Second-Life Battery Deployment
5.4 Threats
5.4.1 Geopolitical & Trade Disruptions
5.4.2 Grid Interconnection Cost Uncertainty
5.4.3 Certification, Safety & Compliance Risks
6. Market Segmentation by Technology (USD Billion), 2025–2033
6.1 Lithium-Ion Energy Storage Systems
6.1.1 Lithium Iron Phosphate (LFP)
6.1.2 Nickel Manganese Cobalt (NMC)
6.1.3 High-Capacity Large-Format Cells
6.1.4 Grid-Scale Lithium Battery Systems
6.2 Sodium-Ion Energy Storage Systems
6.2.1 Utility-Scale Sodium-Ion Systems
6.2.2 Commercial & Industrial Sodium-Ion Systems
6.2.3 Long-Duration Sodium-Ion Storage
6.2.4 Next-Generation Sodium Battery Platforms
6.3 Flow Battery Systems
6.3.1 Vanadium Redox Flow Batteries
6.3.2 Iron Flow Batteries
6.3.3 Long-Duration Flow Storage
6.3.4 Utility Grid Applications
6.4 Other Energy Storage Technologies
6.4.1 Hybrid Energy Storage Systems
6.4.2 Solid-State Energy Storage
6.4.3 Gravity & Mechanical Storage Integration
6.4.4 Emerging Storage Technologies
7. Market Segmentation by Application (USD Billion), 2025–2033
7.1 Grid-Scale Energy Storage
7.1.1 Renewable Energy Integration
7.1.2 Frequency Regulation
7.1.3 Peak Shaving
7.1.4 Grid Balancing & Ancillary Services
7.2 Commercial & Industrial (C&I) Energy Storage
7.2.1 Manufacturing Facilities
7.2.2 Commercial Buildings
7.2.3 Data Centres
7.2.4 Industrial Power Backup
7.3 Residential Energy Storage
7.3.1 Rooftop Solar Storage
7.3.2 Home Backup Power
7.3.3 Smart Home Energy Management
7.3.4 Community Energy Storage
8. Market Segmentation by End User (USD Billion), 2025–2033
8.1 Electric Utilities & Grid Operators
8.2 Renewable Energy Developers
8.3 Commercial & Industrial Customers
8.4 Residential Consumers
9. Market Segmentation by System Component (USD Billion), 2025–2033
9.1 Battery Cells & Modules
9.2 Battery Management Systems (BMS)
9.3 Power Conversion Systems (PCS)
9.4 Energy Management Systems (EMS)
10. Regional Market Analysis
10.1 North America
10.2 Europe
10.3 Asia-Pacific
10.4 Rest of the World
11. Regional Insights
11.1 United States – Policy-Led Manufacturing Expansion
11.2 China – Global Manufacturing & Cell Technology Leader
11.3 Europe – Grid Modernization & Inertia Markets
11.4 India – Utility-Scale Deployment & Domestic Manufacturing
12. Supply Chain & Investment Analysis
12.1 Global ESS Value Chain
12.2 Battery Manufacturing Capacity Expansion
12.3 Domestic Content & Localization Initiatives
12.4 Critical Raw Material Supply Assessment
12.5 Large-Format Cell Technology Evolution
12.6 Long-Duration Storage Investment Outlook
13. Competitive Landscape
13.1 Market Structure Analysis
13.2 Competitive Positioning Matrix
13.3 Geographic Manufacturing Footprint
13.4 Strategic Developments
13.5 Capacity Expansion & Investment Activities
14. Company Profiles
14.1 Fluence
14.2 Peak Energy
14.3 Zenergy Battery
14.4 Ultium Cells
14.5 iNVERGY
14.6 Invinity Energy Systems
14.7 B2U Storage Solutions
14.8 Nuvation Energy
15. Strategic Intelligence & AI-Driven Insights
15.1 Pheonix Forecast Intelligence Engine
15.2 Grid Storage Intelligence Dashboard
15.3 ESS Manufacturing Intelligence
15.4 Critical Supply Chain Risk Monitor
15.5 Long-Duration Storage Opportunity Intelligence
16. Investment & Growth Opportunities
16.1 Utility-Scale Energy Storage Projects
16.2 Domestic Battery Manufacturing
16.3 Sodium-Ion Commercialization
16.4 Grid Modernization Programs
16.5 Long-Duration Energy Storage Technologies
17. Why the Global Stationary Energy Storage Systems (ESS) Market Remains Critical
17.1 Renewable Energy Integration
17.2 Grid Reliability & Resilience
17.3 AI & Data Centre Power Demand
17.4 Domestic Energy Security
17.5 Long-Term Decarbonization
18. Key Analytical Insights
18.1 Front-Loaded Growth Window Analysis
18.2 Policy & Manufacturing Impact Assessment
18.3 Technology Competitiveness Analysis
18.4 Forecast Assumptions & Limitations
19. Methodology & Research Approach
19.1 Research Methodology
19.2 Forecast Modeling Framework
19.3 Data Sources
19.4 Assumptions & Limitations
20. About Pheonix Research
21. Disclaimer
Competitive Landscape
Competitive Landscape: Stationary Energy Storage Systems
The stationary energy storage competitive landscape in 2026 is defined by a rapid scaling of manufacturing capacity across multiple continents, technology diversification beyond lithium‑ion, and the growing importance of domestic content as a competitive differentiator in the US market. The chapter focuses on announced manufacturing capacity, project wins, and technology developments from specific participants using supplied data covering lithium‑iron‑phosphate (LFP) cells, sodium‑ion systems, vanadium flow batteries, and advanced monitoring components. It excludes pumped hydro, compressed air, hydrogen storage, and the actions of larger incumbents for which no evidence was provided.
Key Takeaways
-
- Announced BESS manufacturing capacity from four companies includes iNVERGY (3 GWh), Zenergy (50 GWh), and Peak Energy (4 GWh), with Ultium Cells adding an unspecified capacity from line conversion.
- Domestic content is a decisive factor in US project awards: Fluence’s 800 MWh Avantus project uses cells from US factories to qualify for federal tax credits.
- Technology diversification is evident: sodium‑ion (Peak Energy) and vanadium flow (Invinity) are deployed in first‑of‑the‑kind US projects, while chip‑on‑cell monitoring (Dukosi) advances BMS architecture.
- Asian manufacturers iNVERGY (India) and Zenergy (China) are scaling rapidly with large, dedicated BESS factories targeting regional demand.
- Integrated EPC and system capabilities, as demonstrated by Fluence’s single‑contract approach, are becoming a competitive differentiator.
Manufacturing Scale‑Up: New Factories and Capacity Addition
In 2026, multiple companies announced or began operation of large‑scale BESS manufacturing facilities, reflecting a global race to secure production capacity for utility‑ and commercial‑scale storage. The combined announced capacity from iNVERGY, Zenergy, and Peak Energy represents a major manufacturing scale-up, while Ultium Cells converted an EV line to ESS production at its Tennessee plant.
iNVERGY inaugurated a fully automated 3 GWh BESS gigafactory in Dasna, Uttar Pradesh, India, in June 2026. The 217,000 sq ft facility produces LFP battery packs, complete BESS units, and solar inverters for residential, commercial, and utility applications. With investment exceeding ₹200 crore (~$25 million), the factory incorporates AI-driven battery management and IoT remote monitoring. Zenergy also signed an agreement in March 2026 for a 50 GWh long-duration storage manufacturing base in Suzhou, China, through its subsidiary Suzhou Lishen Energy Technology. The $720 million project will be built in two 25 GWh phases, with phase 1 scheduled for Q3 2027 and phase 2 for 2028. It will focus on large-capacity LFP cells exceeding 300 Ah, with at least 12,000 cycles at 80% discharge, targeting applications of four hours or longer.
In the United States, Peak Energy announced a 4 GWh sodium-ion grid-scale factory in Sacramento, California, the first U.S. facility dedicated to sodium-ion stationary storage. The 183,000 sq ft plant requires approximately $71 million in capital and is expected to begin shipments in Q1 2027. Peak Energy has secured more than 6 GWh of customer commitments through 2030, including 4.75 GWh from Jupiter Power and 1.5 GWh from Energy Vault. Ultium Cells, a General Motors–LG Energy Solution joint venture, began producing LFP batteries for ESS at its Spring Hill, Tennessee plant in July 2026 after converting an EV battery line in under five months with a $70 million investment. The batteries are supplied through LGES’s North American system integration subsidiary Vertech and meet the “U.S.-made” requirements of the Inflation Reduction Act. Capacity in GWh was not specified in the supplied evidence.
| Company | Announced Capacity | Location | Technology | Investment | Timeline |
|---|---|---|---|---|---|
| iNVERGY | 3 GWh | Uttar Pradesh, India | LFP | ₹200 cr (~$25 M) | Inaugurated June 2026 |
| Zenergy | 50 GWh (2×25 GWh) | Suzhou, China | LFP (long‑duration) | $720 M | Phase1 Q3 2027; Phase2 2028 |
| Peak Energy | 4 GWh | Sacramento, California, USA | Sodium‑ion | $71 M | Shipments Q1 2027 |
| Ultium Cells | Not specified | Spring Hill, Tennessee, USA | LFP | $70 M (line conversion) | Production started July 2026 |
| Company | Project | Scale (MWh) | Duration | Domestic Content | Application | Timeline |
|---|---|---|---|---|---|---|
| Fluence | Avantus Rexford 2 | 800 MWh (200 MW) | 4 hours | Yes – cells/modules/enclosures from US factories (Utah, SC, TX) | Solar‑plus‑storage, grid firm capacity | Construction 2027, operations late 2028 |
| Invinity | Project VITALITY (Bad River Band) | 2 MWh | Long‑duration (vanadium flow) | US‑manufactured system | Tribal microgrid, resilience, peak shaving | Delivery 2027 |
These project wins and technology collaborations underscore that differentiation is increasingly based on three factors: (1) the ability to deliver IRA‑compliant domestic content at utility scale, (2) the deployment of non‑lithium chemistries for niche but growing applications such as microgrids and long‑duration storage, and (3) component‑level advances in monitoring and controls that improve system economics. The competitive landscape remains fragmented, with large incumbents like Tesla, CATL, and BYD not covered in the supplied evidence.
Value Chain
Introduction
The stationary energy storage systems (ESS) value chain begins with raw material extraction and processing, moves through cell manufacturing and system integration, and ends with deployment at utility, commercial, residential, and microgrid sites. Drawing on available evidence, this chapter traces the chain from upstream nickel supply for lithium-ion batteries through North American cell manufacturing buildout to innovations in system-level integration. Coverage does not include lithium, cobalt, or graphite mining; downstream project deployment; recycling; or financial details.
Key Takeaways
-
- BHP’s Nickel West operation supplies battery-grade nickel sulfate at a scale of 100,000 t/yr, with 85–90 % of sales directed to battery markets, underpinning a critical raw material link for ESS manufacturers.
- At least four major North American manufacturing initiatives (Tesla, Honda‑LG ES, Ultium Cells, Peak Energy) are building or retooling ESS cell production, diversifying beyond lithium‑ion to sodium‑ion.
- Joint ventures (Honda‑LG, Ultium) are repurposing EV battery lines for ESS, reducing capital outlay and accelerating capacity.
- Tesla’s Lathrop Megafactory (40 GWh/yr) is currently the largest utility‑scale ESS production site in North America.
- New integration partnerships (Dukosi‑A123‑Nuvation Energy) are demonstrating chip‑on‑cell monitoring that could improve BESS safety and modularity.
Upstream Nickel Supply for Battery Manufacturing
Nickel is a critical input for many lithium‑ion battery chemistries used in stationary storage. BHP’s Nickel West operation in Western Australia represents a fully integrated mining‑to‑refinery value chain. The operation includes open‑cut and underground mines, concentrators, a smelter at Kalgoorlie, and the Kwinana refinery, which produces nickel metal as powder or briquettes and, since 2021, nickel sulfate through a dedicated plant.
BHP’s Kwinana nickel sulfate plant has a stage‑one design capacity of 100,000 tonnes per year, enough to supply about 700,000 EV batteries annually. The company reported that 85 % of Nickel West’s existing sales – mainly nickel powder and briquettes – go to the battery market, and that share is expected to rise to around 90 % as the nickel sulfate plant ramps up. In fiscal year 2020–2021, Nickel West produced 89,000 tonnes of nickel metal. The facility exports nickel sulfate from the Port of Fremantle to global battery markets, linking Western Australian mines directly to downstream cell manufacturers in Asia and North America.
This upstream concentration gives BHP a significant role in supplying battery‑grade nickel to the ESS and EV industries, though the available evidence does not provide data on other nickel producers or comparative market shares.
North American Cell Manufacturing Buildout for ESS
A wave of production capacity for ESS cells is taking shape in North America, driven by joint ventures that retool EV lines, dedicated factories, and new technologies such as sodium‑ion. The table below summarises the major initiatives supported by available evidence.
| Company | Technology | Announced capacity (GWh) | Location | Start year | Target market segment |
|---|---|---|---|---|---|
| Tesla | Lithium‑ion (Megapack) | 40 | Lathrop, California | Operational | Utility‑scale |
| Honda‑LG ES (L‑H Battery) | Lithium‑ion | 17 | Jeffersonville, Ohio | July 2026 | Residential, commercial, utility |
| Ultium Cells (LG‑GM JV) | Lithium‑iron‑phosphate (LFP) | Not disclosed (converted EV line) | Tennessee | July 2026 | Grid stabilization, renewables, AI data centers |
| Peak Energy | Sodium‑ion | 4 | Sacramento, California | Shipments Q1 2027 | Grid‑scale |
Tesla operates the Megafactory in Lathrop, California, capable of producing 10,000 Megapack units annually (40 GWh), making it one of the largest utility‑scale battery factories in North America.
Honda‑LG ES (L‑H Battery Company) began lithium‑ion cell production at its Jeffersonville, Ohio, plant in July 2026. The facility was originally built for EV cells and retooled for ESS. With 1,000 employees and a $4 billion investment, its 17 GWh capacity will serve residential through utility markets, with cells integrated by LG ES Vertech.
Ultium Cells (LG Energy Solution‑General Motors joint venture) started LFP battery production for ESS at its Tennessee plant in July 2026, after a $70 million conversion of part of its EV line. The batteries will be supplied through Vertech and used in North American grid, renewable energy, and AI data center projects. They meet U.S.‑made requirements under the Inflation Reduction Act.
Peak Energy announced plans to build America’s first dedicated grid‑scale sodium‑ion BESS factory in Sacramento, California. The 183,000‑sq‑ft facility will produce up to 4 GWh annually, representing a $71 million investment and 239 jobs. Shipments are expected to begin in Q1 2027, and the company claims a 20 % cost reduction compared to lithium‑ion systems. The factory already has more than 6 GWh of customer commitments.
Fluence, a system integrator, does not manufacture cells but integrates battery modules from Tier 1 suppliers into its Gridstack Pro product line, which incorporates Fluence’s own BMS and operating system for utility and grid operator customers.
Display a comparison of North American ESS cell manufacturing initiatives by company, technology, capacity, location, start year, and target market. Corporate announcements and news articles for Tesla, Honda‑LG ES, Ultium Cells, Peak Energy, and Fluence. Show the diversity of manufacturing ventures, technology choices (LFP, lithium‑ion, sodium‑ion), scale, and geographic concentration in Ohio, Tennessee, and California.
System Integration and Component Innovation
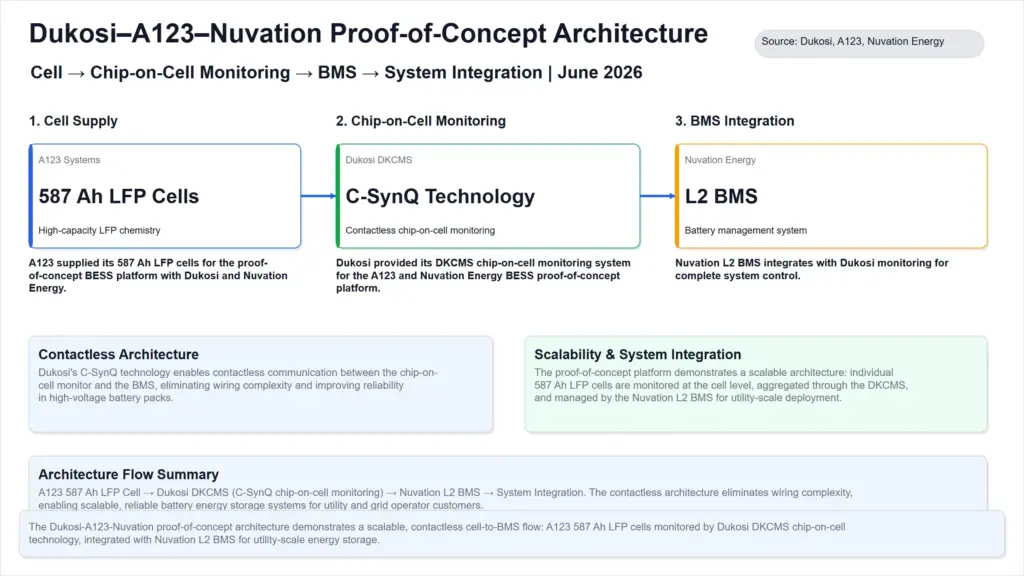
Beyond cell manufacturing, system‑level integration is advancing through collaborations that combine new cell form factors, chip‑on‑cell monitoring, and battery management systems (BMS). In June 2026, Dukosi, A123 Systems, and Nuvation Energy announced a proof‑of‑concept reference platform targeting the North American BESS market.
The proof‑of‑concept module uses a 1P13S configuration with A123’s 587 Ah prismatic LFP cells. Each cell is equipped with Dukosi’s DKCMS chip‑on‑cell monitoring system, which uses C‑SynQ proprietary communications to provide contactless monitoring of voltage and temperature. The module is managed by a Nuvation Energy L2 BMS, forming an end‑to‑end solution that demonstrates scalability and improved safety compared to traditional wired architectures.
This collaboration illustrates how cell suppliers (A123), monitoring technology providers (Dukosi), and BMS specialists (Nuvation) can create a pre‑validated platform that reduces time‑to‑market for North American integrators and project developers. The available evidence does not include data on commercial adoption or pricing of this platform.
Investment Activity
Investment : Global stationary energy storage systems
Investment in stationary energy storage systems is picking up across manufacturing, project deployment, and early-stage technology. Government funding, private equity, and corporate capital spending are supporting this growth, with increasing attention on long-duration storage and recycling infrastructure.
This chapter looks at investment flows across the stationary energy storage systems market, including manufacturing plant capex, grid-scale project financing, public grants, corporate equity raises, and early-stage venture capital. It excludes operational revenues, detailed technology cost analysis, and investments in software or platform companies that do not have a storage hardware focus. Geographic coverage is limited to the deals captured across the United States, Europe, China, India, and Australia.
Key takeaways
- Manufacturing investments in China and India target multi-GWh capacities and long-duration LFP storage, while Australia sees small-scale recycling infrastructure.
- Large-scale BESS project financing is maturing: UK NWF crowds in private equity for 1.9 GW of assets, and a ten-bank consortium funds 700 MW/2.8 GWh in Belgium.
- Public grants from the Department of Energy support flow battery demonstration for tribal resilience, while venture capital seeds long-duration storage startups at single-digit million levels.
- Corporate equity raises by storage companies remain modest ($75 million) compared to manufacturing and project capex, indicating continued reliance on debt and government funds.
- The investment landscape shows a clear push toward long-duration storage and recycling, but deal counts are limited and concentrated in a few geographies.
Manufacturing and recycling capacity expansion
Capital is flowing into building manufacturing and recycling infrastructure for battery energy storage systems, highlighting scale, location, and technology choices across Asia and Australia.
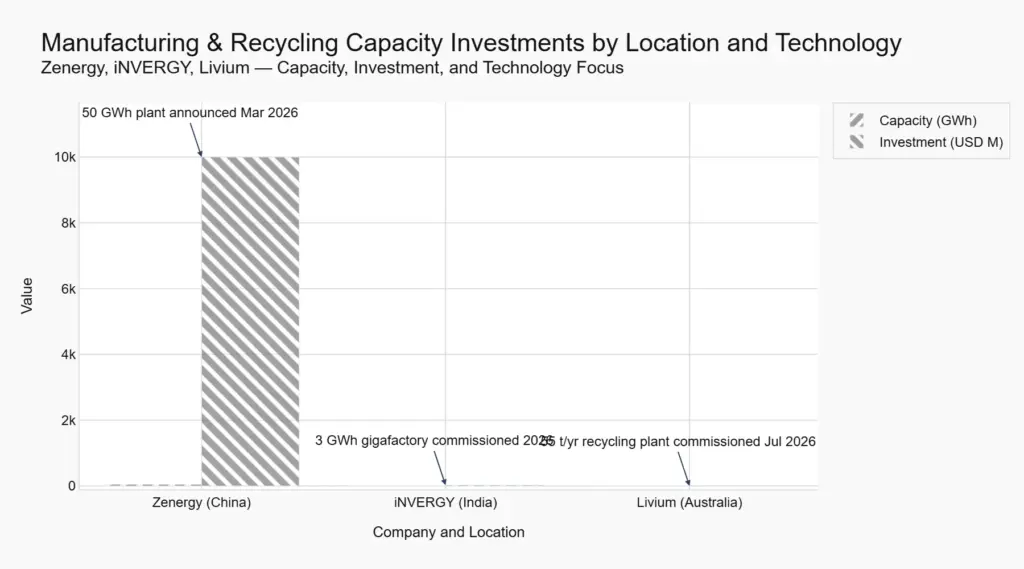
Zenergy Battery signed an agreement with Suzhou Xiangcheng Economic and Technological Development Zone for a 50 GWh next-generation long-duration energy storage smart manufacturing project, the company’s largest single storage manufacturing base. With total planned investment of approximately CNY 5.2 billion ($720 million), the site will be built in two phases: phase one with 25 GWh of capacity will start construction in the second half of 2026 with production scheduled for the third quarter of 2027, and phase two will add another 25 GWh with completion expected in 2028. The Suzhou base will focus on large-capacity lithium iron phosphate cells designed for 4-hour and longer charge-discharge cycles, with single-cell capacity of more than 300 Ah and cycle life of at least 12,000 cycles at 80% discharge. The core product is the 588 Ah high-capacity battery cell, compatible with storage durations extending up to 4 to 12 hours.
iNVERGY India inaugurated a new BESS gigafactory in Dasna, Uttar Pradesh, in June 2026. The fully automated 217,000 square foot facility has an annual capacity of 3 GWh, producing advanced LiFePO₄ battery packs, complete BESS units, and solar inverters for residential, commercial and industrial, and utility applications. Built with an investment of over ₹200 crore (approximately $25 million), the factory incorporates AI-driven battery management systems, IoT monitoring, and automated production lines, positioning it as one of the largest battery factories in India supporting the Make in India initiative.
In Australia, Livium reported completion of commissioning for a dedicated battery recycling plant at its Envirostream facility in Campbellfield, Victoria, in July 2026. The plant was funded by Sell & Parker under an April 2026 variation to the existing recycling agreement. In July 2026, Envirostream is anticipated to receive 55 tonnes of material from Sell & Parker, compared with an historical monthly average of approximately 7 tonnes recorded between May 2025 and May 2026. The Sell & Parker contract carries anticipated value above $5 million and could remain Envirostream’s largest recycling contract by revenue.
Manufacturing and recycling capacity investment comparison
| Project / Company | Investor / Partner | Geography | Capacity | Investment amount | Timing | Status |
|---|---|---|---|---|---|---|
| Zenergy long-duration storage manufacturing plant | Zenergy Battery | Suzhou, China | 50 GWh | CNY 5.2 billion (~$720 million) | Signed March 2026; phase one production Q3 2027; phase two completion 2028 | Announced |
| iNVERGY BESS gigafactory | iNVERGY India Private Limited | Dasna, Uttar Pradesh, India | 3 GWh/year | ₹200 crore (~$25 million) | Inaugurated June 2026 | Operating |
| Livium battery recycling plant at Envirostream | Sell & Parker (funding partner) | Campbellfield, Victoria, Australia | 55 tonnes/month throughput (July 2026) | Contract value above $5 million | Commissioned July 2026 | Operating |
Grid-scale project financing and public funding
Large BESS projects are achieving financial close with debt and equity from institutional investors, while public grants fund demonstration projects for non-lithium technologies.
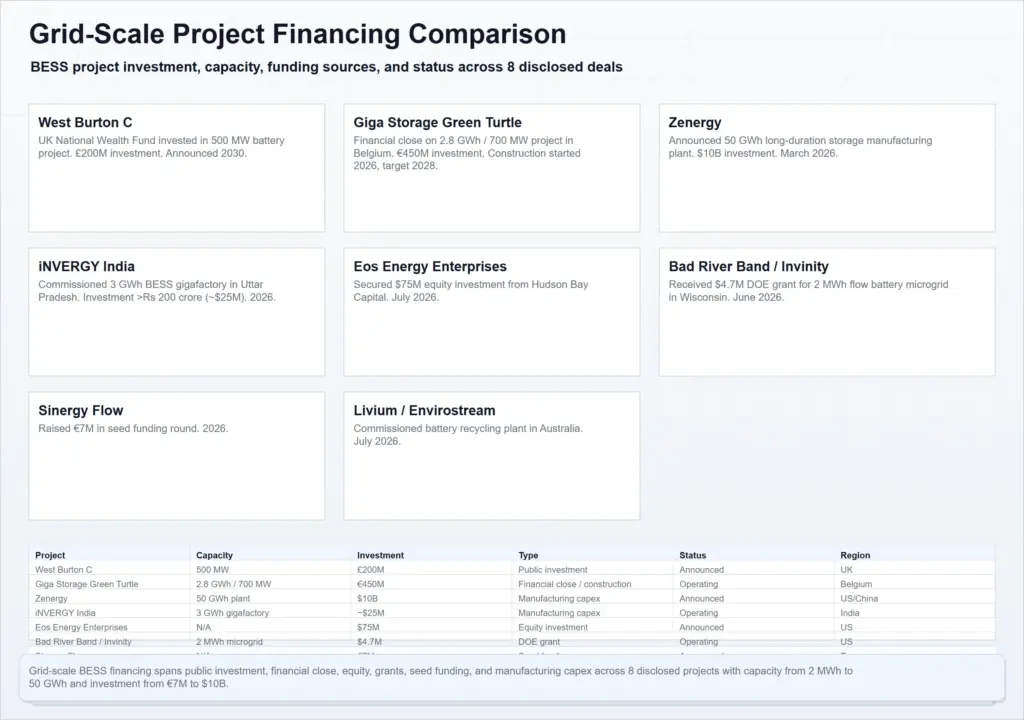
The UK National Wealth Fund committed up to £200 million of equity into Fidra Energy to finance construction of two Battery and Energy Storage System assets: Thorpe Marsh at 1,400 MW and West Burton C at 500 MW. Thorpe Marsh will be the largest BESS asset in the UK with seven times the capacity of the current largest installation. Fidra was established by EIG, an experienced infrastructure investor, who supports the investment through EIG’s fund vehicle. This is part of a £389 million equity raise with an additional £632 million of debt from the private market. The two sites have a combined capacity of 1.9 GW, a major contribution toward the 16 GW required by 2030. The National Wealth Fund addresses what it describes as a critical equity gap in the BESS market, where many developers lack the capital to reach final investment decision.
European BESS developer Giga Storage reached financial close on July 9, 2026, for its 700 MW / 2.8 GWh Green Turtle project in Belgium, with construction beginning in September and commissioning expected in 2028. A consortium of ten international banks—ABN AMRO, ING, Rabobank, Triodos Bank, Triodos Investment Management, a.s.r., Belfius, HCOB, Santander, and SMBC—provided €450 million in debt financing. The remaining portion of required financing is contributed as equity by InfraVia Capital Partners, the French majority owner of Giga Storage. At peak moments, the energy storage system can supply electricity equivalent to the daily consumption of approximately 385,000 households.
The U.S. Department of Energy awarded $4.7 million for a long-duration energy storage demonstration that will install a 2 MWh Invinity Energy Systems Endurium Enterprise vanadium flow battery in a building-level microgrid on the Bad River Band of Lake Superior Chippewa reservation in Ashland, Wisconsin. The DOE awarded $3.6 million to Invinity, which supplies the battery, and $1.1 million to muGrid Analytics, which provides the microgrid controls. The demonstration, branded Project VITALITY, will provide demand charge management, peak shaving, and resilience. The U.S.-manufactured system is planned for delivery in 2027, with operational data shared into the DOE’s rapid operational validation initiative.
Corporate equity and early-stage venture capital
Publicly listed storage companies and startups are raising capital to fund growth and technology development through equity instruments and venture rounds.
Eos Energy Enterprises secured a registered direct offering with Hudson Bay Master Fund Ltd., an affiliate of Hudson Bay Capital Management LP, on July 1, 2026. The Company issued 13,683,634 shares of common stock and 6,004,378 warrants, each warrant to purchase one share of common stock at an exercise price of $5.481 per share. Each share was offered together with 0.4388 of an accompanying warrant at an aggregate offering price of $5.481, for total gross proceeds of $75 million. The warrants expire on the 10th anniversary of issuance.
Sinergy Flow, a deep-tech startup developing innovative solutions for long-duration energy storage, closed a €7 million late seed funding round led by CDP Venture Capital SGR, with participation from 360 Capital, a European venture capital fund, and Exergon, part of Audacia Group. The funding will enable Sinergy Flow to accelerate industrial development of its technology, complete commercial-scale validation activities, and prepare for market entry in utility-scale energy storage and standalone applications supporting electricity grids and renewable energy integration.
Corporate equity and venture capital deal comparison
| Company | Deal type | Amount | Investors | Stated use of proceeds |
|---|---|---|---|---|
| Eos Energy Enterprises | Registered direct offering (equity with warrants) | $75 million | Hudson Bay Capital Management LP | Not specified in the disclosed filing |
| Sinergy Flow | Late seed venture round | €7 million | CDP Venture Capital SGR, 360 Capital, Exergon | Accelerate industrial development, complete commercial-scale validation, prepare for market entry in utility-scale storage |
Technology & Innovation
Large‑Format LFP Cells: The Race to 500 Ah+
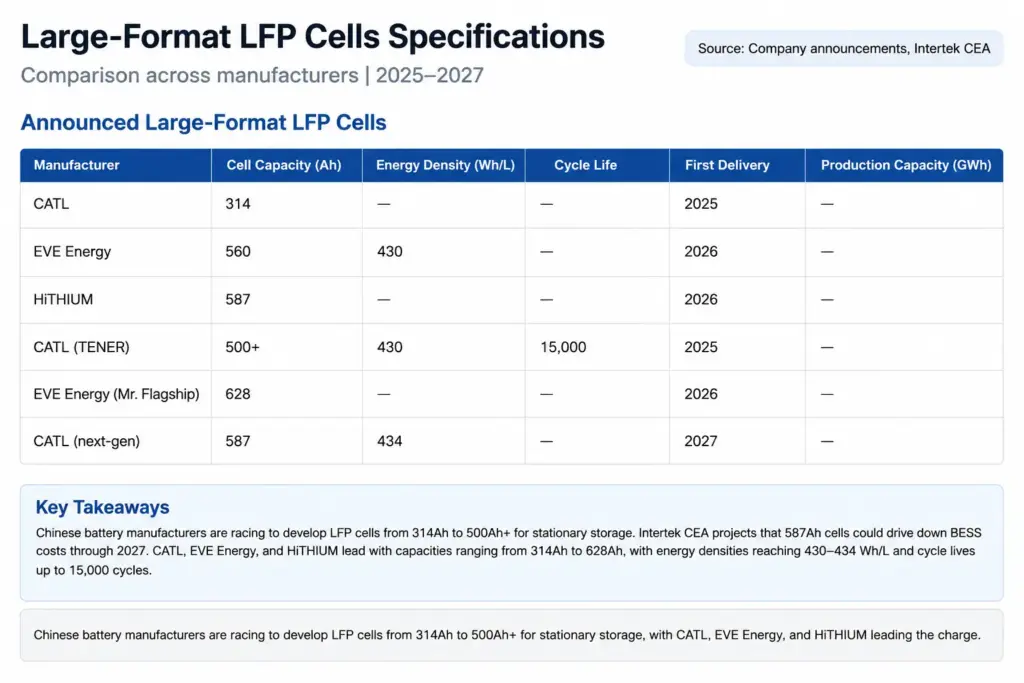
Chinese battery manufacturers have accelerated the rollout of lithium iron phosphate (LFP) cells beyond the 314 Ah generation, positioning 500 Ah+ formats as a near‑term pathway to reduce balance‑of‑system (BOS) complexity and lift container‑level energy density. CATL is promoting a 587 Ah cell with a claimed volumetric energy density of 434 Wh/L and cycle life exceeding 10,000 cycles. First deliveries occurred in June 2025, and the company has installed four production lines at its Jining facility with an annual capacity of 60 GWh. EVE Energy has pushed its Mr. Big 628 Ah product line into the market, reaching mass production and shipment milestones in December 2024 at its Jingmen base. HiTHIUM follows a two‑track approach: a 587 Ah cell (first deliveries August 2025) and a larger 1,175 Ah cell that entered mass production in June 2025.
According to research firm Intertek CEA, wider adoption of 587 Ah cells is likely to reduce BESS costs through 2027 even as lithium carbonate prices have roughly tripled. The cell‑level energy density gain is modest (roughly 20 %), but modules and racks designed around the new architecture achieve a 60‑80 % increase in energy density at that level, cutting BOS costs by reducing upstream component count. Critically, LFP cells account for only about 18 % of total BESS system cost, and lithium carbonate contributes roughly 10‑12 % of that total – smaller than the combined savings from upstream simplification.
| Manufacturer | Cell capacity (Ah) | Volumetric energy density (Wh/L) | Cycle life (claimed) | First delivery / mass production | Production capacity (GWh) |
|---|---|---|---|---|---|
| CATL | 587 | 434 | >10,000 | First deliveries June 2025 | 60 (Jining) |
| EVE Energy | 628 (Mr. Big) | Not stated in sources | Not stated in sources | Mass production Dec 2024 (Jingmen) | Not stated |
| HiTHIUM | 587 / 1,175 | Not stated in sources | Not stated in sources | 587 Ah: first deliveries Aug 2025; 1,175 Ah: mass production June 2025 | Not stated |
North American and Indian Gigafactory Buildout
New LFP battery production capacity for stationary storage is coming online from both converted EV lines and greenfield facilities. In the United States, Ultium Cells – the joint venture between LG Energy Solution and General Motors – began producing LFP cells for ESS at its Tennessee plant on July 7, 2026. The company invested approximately $70 million to convert part of its EV battery line, completing the conversion in less than five months. The cells are supplied to Vertech, LG Energy Solution’s North American ESS system integrator, for grid, renewable energy, and AI data‑center applications. The Tennessee plant meets U.S.-made manufacturing requirements under the Inflation Reduction Act.
Similarly, the L‑H Battery Company (Honda‑LG ES) commenced lithium‑ion cell production at its Jeffersonville, Ohio plant in July 2026. Originally conceived for EV batteries, the facility redirected initial production toward stationary ESS due to the U.S. BEV policy shift. The plant maintains a flexible portfolio, also producing hybrid‑EV cells. First cells will be integrated into ESS solutions by LG ES Vertech, targeting residential, commercial‑industrial, and utility‑scale projects.
In India, iNVERGY commissioned a 3 GWh BESS gigafactory in Dasna, Uttar Pradesh, in June 2026. The 217,000 sq ft fully automated plant – built with an investment of over ₹200 crore (~$25 million) – manufactures LiFePO₄ battery packs, complete BESS units (5 kWh to 5 MWh), and solar inverters for residential, C&I, and utility applications. The factory incorporates AI‑driven battery management systems, IoT‑enabled remote monitoring, and automated quality control. iNVERGY’s parent company reported consolidated revenue growth of 69 % in FY2025‑26, underlining the market pull for localized production.
| Facility | Location | Production start | Investment | Annual capacity | Target market |
|---|---|---|---|---|---|
| Ultium Cells (LG‑GM JV) | Tennessee, USA | July 2026 (converted EV line) | $70 million | Not stated (part of 60 GWh total EV+ESS line) | Grid, renewable, AI data centers (IRA‑eligible) |
| L‑H Battery (Honda‑LG ES) | Ohio, USA | July 2026 (retooled EV facility) | Not stated (50:50 JV) | Not stated | Residential, C&I, utility (via LG ES Vertech) |
| iNVERGY Gigafactory | Uttar Pradesh, India | June 2026 (greenfield) | ~$25 million | 3 GWh | Residential, C&I, utility (Make in India) |
Smart BMS and Monitoring Innovations
Battery management systems are evolving to support larger cell formats and second‑life applications. Dukosi provided its DKCMS chip‑on‑cell monitoring system for a proof‑of‑concept BESS platform with A123 Systems and Nuvation Energy. The 1P13S module integrates A123’s 587 Ah LFP prismatic cells with Dukosi’s contactless cell monitoring and Nuvation’s L2 BMS, creating a highly scalable, safer architecture aimed at the North American market. The platform demonstrates how chip‑on‑cell technology can simplify wiring, improve safety, and enable more accurate state‑of‑charge tracking.
Separately, researchers designed and experimentally validated a modular BMS for second‑life ZEBRA (sodium‑nickel) batteries retired from electric vehicles. The system includes string‑level modularity, thermal control, Coulomb‑counting SoC estimation, and hybrid state‑of‑health assessment. Integrated into a PV‑grid hybrid bench, it delivered 819 Wh in backup mode (500 W load for 1 h 38 min) and 1,424 Wh in self‑consumption mode (average 442 W for 3 h 13 min). The validation confirms the feasibility of repurposing sodium‑nickel cells for low‑ to medium‑power stationary applications such as residential backup and microgrids, extending service life and deferring recycling.
iNVERGY’s Indian gigafactory further illustrates the deployment of AI‑based BMS and IoT‑enabled remote monitoring at production scale, embedding intelligence directly into the manufactured BESS units.
Second‑Life Batteries in Grid Services
Second‑life EV batteries are being deployed commercially for grid services. B2U Storage Solutions put a 24 MWh facility online east of San Antonio, Texas, in early 2026, using 500 reconditioned battery modules from retired General Motors electric vehicles. The site interconnects to CPS Energy’s distribution system and participates in the ERCOT day‑ahead energy market and ancillary services programs. The installation cost was under $100/kWh, compared to approximately $149/kWh for new lithium‑ion systems (BloombergNEF Q4 2025). The system charges during midday solar and wind surplus and discharges during peak periods, capturing energy‑arbitrage value.
B2U plans three additional Texas locations to reach 100 MWh of total second‑life capacity. The company’s system is brand‑agnostic, accepting Nissan, Honda, Tesla, and Ford modules. Texas is projected to account for 53 % of all new U.S. battery storage capacity additions in 2026, and earlier deployments (e.g., Element Energy’s 900‑battery ERCOT project in 2025) demonstrate growing traction. The second‑life pathway offers a low‑cost complement to new BESS, leveraging retired automotive packs that still retain significant usable capacity for stationary duty cycles.
Market Risk
This chapter looks at the main operational, regulatory, and financial risks affecting stationary energy storage systems (BESS), with a primary focus on North America. It covers risks related to material supply, power electronics availability, trade policies, and project-level safety and grid interconnection during 2025–2027.
The analysis also considers upstream areas such as lithium, cobalt, nickel, and graphite mining, battery cell manufacturing, and power electronics manufacturing. Recycling, second-life battery markets, and insurance-related risks are not included because there is limited supporting evidence in the supplied material. The assessment is based on publicly available sources from 2024–2026 and does not use primary market data or proprietary risk models.
Key takeaways
- Over 70% of global cobalt supply originates from the DRC, where an administrative export‑quota glitch in 2026 threatened 20,000 tonnes worth $1.1 billion, driving a 160% price surge.
- Power electronics (IGBT/SiC modules) face an >18% demand‑versus‑capacity gap, extending lead times beyond 30 weeks and creating bottlenecks for inverter supplies.
- Uncertified BESS installations continue to pose fire risks, as demonstrated by the Warwick, NY fire, which involved an unauthorised system without a Certificate of Compliance.
- US tariff expansions under Section 232 and AD/CVD investigations add material cost uncertainty, with border detentions and forced‑labour scrutiny further complicating procurement.
- Interconnection cost swings of up to $27 million can render projects financially unviable, as seen in the Shoreham Long Island project with a total budget of $86 million.
Raw Material Exposure and Geopolitical Supply Risk
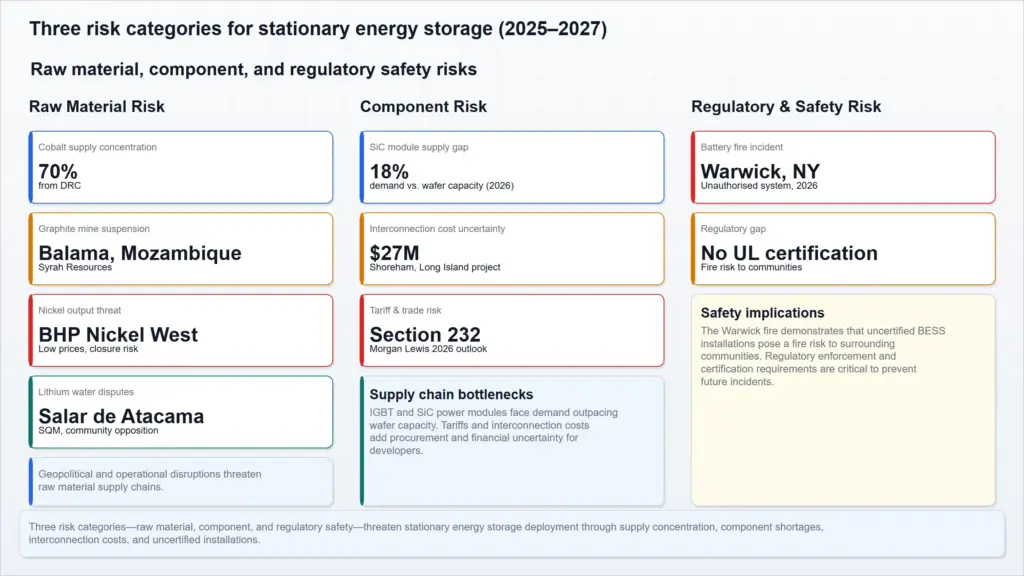
Four critical battery materials—cobalt, nickel, graphite, and lithium—face distinct but compounding supply risks that directly affect stationary storage cell costs and project timelines. The concentration of cobalt in the Democratic Republic of Congo (DRC) remains the most concentrated single‑country risk. Congo produces about 70% of the world’s cobalt and hosts operations by CMOC, Glencore, Eurasian Resources Group, and Huayou Cobalt. In July 2026, an administrative glitch in the customs platform threatened export quotas. The regulator ARECOMS set a July 5 deadline for first‑half quota usage; unused volumes would be withdrawn and reallocated. Industry sources estimated that 60% to 75% of companies were unlikely to meet the deadline, risking as much as 20,000 metric tons of missed shipments worth $1.1 billion at current prices. The same regulator imposed a 96,600 t annual export cap for 2026 and 2027. Cobalt prices have surged 160% since February 2025 to $26/lb ($57,320 /t). This disruption directly raises costs for battery cell manufacturers and stationary storage developers who rely on cobalt‑based chemistries. These events underscore DRC cobalt mining instability as a persistent risk to stationary storage supply chains, directly threatening cobalt supply for stationary storage batteries.
Nickel supply faces a different mechanism: oversupply‑driven mine suspensions that shrink available output. BHP suspended its Nickel West operations in Western Australia from October 2024, citing a global oversupply of nickel driven by Indonesia and a shift away from nickel in some battery types. The suspension caused an underlying EBITDA loss of approximately US$300 million. BHP intends to review the decision by February 2027 and continues to invest about A$450 million per year in the facilities to enable a potential restart. While near‑term nickel prices remain low, the suspension removes a significant source of Class 1 nickel used in high‑energy‑density batteries, potentially tightening supply if demand rebounds or if other producers follow.
Graphite supply has been disrupted by operational and market conditions at the Balama mine in Mozambique, operated by Syrah Resources. Production was suspended for nearly a year due to post‑election violence and resettlement grievances. Production recommenced on 16 June 2025, with 7 kt produced in the following two weeks. By the end of the June 2025 quarter, 1 kt of natural graphite had been sold and shipped at a weighted average price of US$779 per tonne (CIF). The mine’s restart was achieved on time and within budget, but the prolonged suspension demonstrated the vulnerability of graphite supply to social and political disruptions in a single region.
Lithium extraction in Chile faces ongoing water rights disputes and community opposition. SQM’s operations at Salar de Atacama are central to these tensions. Indigenous communities are demanding more control and environmental protections in negotiations with Codelco and SQM. A governance plan is under negotiation, expected to conclude by end‑2025. Any disruption to SQM’s extraction could affect lithium supply for battery cell production, though the negotiations have not yet resulted in production cuts.
| Material | Supply concentration | Disruption type | Price impact / financial magnitude |
|---|---|---|---|
| Cobalt | ~70% in DRC | Administrative export quota glitch | 160% price surge (Feb 2025 – Jul 2026); $1.1B at risk on 20,000 t |
| Nickel | Moderate (Indonesia dominant, but BHP key Western producer) | Mine suspension due to oversupply | EBITDA loss ~$300M; $450M/yr upkeep for potential restart |
| Graphite | High (Mozambique significant; Balama key) | Production suspension (social/political) | 7 kt output resumed; $779/t weighted average sale price |
| Lithium | Chile ~30% of global | Ongoing water rights disputes and community opposition | No direct price impact yet; potential production disruption if negotiations fail |
Component and Trade Policy Risk
Beyond raw materials, power electronics are a critical bottleneck for stationary storage inverters. IGBT and silicon carbide (SiC) modules face a demand‑versus‑foundry‑capacity gap of over 18% in 2026, according to a BloombergNEF report cited by SupplyICs. Foundries are struggling to yield high‑quality 200 mm SiC wafers, creating persistent bottlenecks for brands such as Infineon, ON Semiconductor, and Wolfspeed. Lead times for IGBT modules reach 30–45 weeks in Q2 2026. In one case, a manufacturer of solar inverters saw their ON Semiconductor IGBT module allocation pushed out by an additional 15 weeks, threatening a factory shutdown in Eastern Europe. These delays directly affect stationary storage system integrators who depend on inverters for grid‑connected projects, extending project commissioning timelines and raising procurement costs.
Trade policy amplifies component risk. A Morgan Lewis 2026 outlook identifies tariffs and trade enforcement as core risk variables. US tariff expansion, Section 232 investigations into steel, aluminum, copper, and critical minerals, and AD/CVD investigations targeting battery materials are reshaping procurement strategies. Border detentions related to forced‑labour scrutiny remain a significant supply chain risk. Although finished battery storage systems may be excluded from some tariffs, upstream inputs like steel enclosures, copper wiring, and power modules are affected. Developers face cost uncertainty from tariff volatility, requiring early procurement strategies and contractual risk allocation (fixed pricing, pass‑through clauses, renegotiation mechanisms). The combination of extended lead times and tariff‑driven cost increases makes project budget certainty challenging for developers seeking financing.
Project-Level and Regulatory Risk
Individual projects face operational safety and regulatory compliance risks that can derail timelines and increase costs. A December 2025 fire at the Church Street Battery Storage Facility in Warwick, New York, involved an unauthorised system. Village Mayor Michael Newhard confirmed that the system was activated and fully charged without a required Certificate of Compliance, and that the facility “should not have been operational.” Water infiltration was identified as the probable cause; similar failures occurred at two other Convergent‑operated sites in 2023 after heavy rain. The fire was contained to one unit with no injuries, but cleanup, testing, engineering, and police service costs must be borne by the owner. This incident highlights the risk of uncertified installations—specifically the lack of UL or regulatory certification—and intensifies scrutiny on developers and regulatory compliance regimes.
Grid interconnection costs pose another project‑level financial risk. The proposed Shoreham battery project on Long Island—a 50‑MW facility at the former Shoreham nuclear plant site—faces estimated connection costs ranging from $0 to $27 million, according to a draft NYISO report. The project has a total budget of $86 million and has applied for tax breaks of up to $6.4 million from the Brookhaven Industrial Development Agency. Developer Key Capture Energy (KCE) has indicated that the uncertainty could render the project financially unfeasible. The cost variability stems from grid upgrade requirements that are difficult to predict before final engineering studies. While KCE is seeking an extension, the case illustrates how interconnection cost swings of nearly one‑third of total project budget can threaten viability.
Comparing project risk profiles: the Warwick fire represents a safety‑compliance risk that can be mitigated by stricter enforcement of certification requirements and inspection protocols. The Shoreham interconnection cost issue is a financial‑infrastructure risk that depends on utility and ISO procedures. Both can delay or halt projects, but the mechanisms differ: Warwick exposes liability and reputational damage, while Shoreham exposes budget overruns and financing challenges.
Regulatory Landscape
Stationary Energy Storage Systems Regulation
Stationary energy storage regulation in 2024–2026 is undergoing simultaneous tightening across fire safety, grid interconnection, and end-of-life sustainability, forcing project developers and manufacturers to navigate a multi-jurisdictional compliance environment that varies significantly between the US and EU. The market, estimated at $64.54 billion in 2025, is shaped by federal and state-level rules in the United States and by European Union-wide requirements that affect global supply chains.
Fire safety and installation standards
The 2026 editions of two foundational US fire safety standards—NFPA 855 and UL 9540A—introduce material changes that affect system integrators, residential installers, EPC contractors, and equipment manufacturers. These updates converge with the 2024 edition of the International Fire Code (IFC) Chapter 12 to create a denser compliance environment for stationary storage installations.
NFPA 855, the Standard for the Installation of Stationary Energy Storage Systems, has been significantly revised in its 2026 edition. General requirements applicable to all energy storage systems have been consolidated into Chapter 4, while technology-specific requirements are now contained in dedicated chapters. The standard adds new battery types, introduces Chapter 16 for flow batteries, and Chapter 17 for ESS on barges. Refined exclusions apply to lead-acid, aqueous nickel-based, and aqueous metal-air batteries. New requirements for an emergency response plan and for EV charging systems that have energy storage are also included. These revisions directly impact system design and siting decisions for project developers and require updated fire protection planning from EPC contractors.
UL 9540A, the Test Method for Evaluating Thermal Runaway Fire Propagation in Battery Energy Storage Systems, was published as a new Sixth Edition on March 13, 2026. The edition revises Installation Level Testing requirements for large-scale fire testing. A notable change allows Unit Level testing to be skipped if Installation Level testing is conducted, potentially reducing testing burdens for manufacturers opting for the larger-scale test route. The standard is ANSI and SCC approved. For system integrators and battery cell manufacturers, the revised test methodology may alter product certification strategies and timelines for new battery chemistries and large-format systems.
The International Fire Code (IFC) 2024 edition includes Chapter 12 on energy systems, providing an additional code-based compliance pathway. Gaps between IFC Chapter 12 and NFPA 855 persist, as the IFC is an adoptable model code while NFPA 855 is an installation standard; adopters of the IFC may need to reference NFPA 855 for detailed testing and fire suppression criteria. For residential solar installers and commercial project developers, the interplay between these documents determines local permitting requirements and fire marshal approvals.
| Instrument | Jurisdiction | Key provisions | Effective date | Primary affected participants |
|---|---|---|---|---|
| NFPA 855 2026 Edition | United States (model code) | Consolidated requirements in Ch.4; new battery types; flow batteries (Ch.16); ESS on barges (Ch.17); emergency response plan requirements | 2026 | System integrators, EPC contractors, residential installers, project developers |
| UL 9540A 6th Edition | United States (ANSI/CAN) | Revised Installation Level Testing; allows skipping Unit Level testing if Installation Level testing is conducted; large-scale fire test updates | March 13, 2026 | Battery cell manufacturers, system integrators, testing laboratories |
| IFC Chapter 12 (2024) | United States (model code) | Energy systems chapter covering stationary storage siting, fire protection, and operational requirements | 2024 | Building code officials, fire marshals, project developers, residential installers |
Grid interconnection and market participation
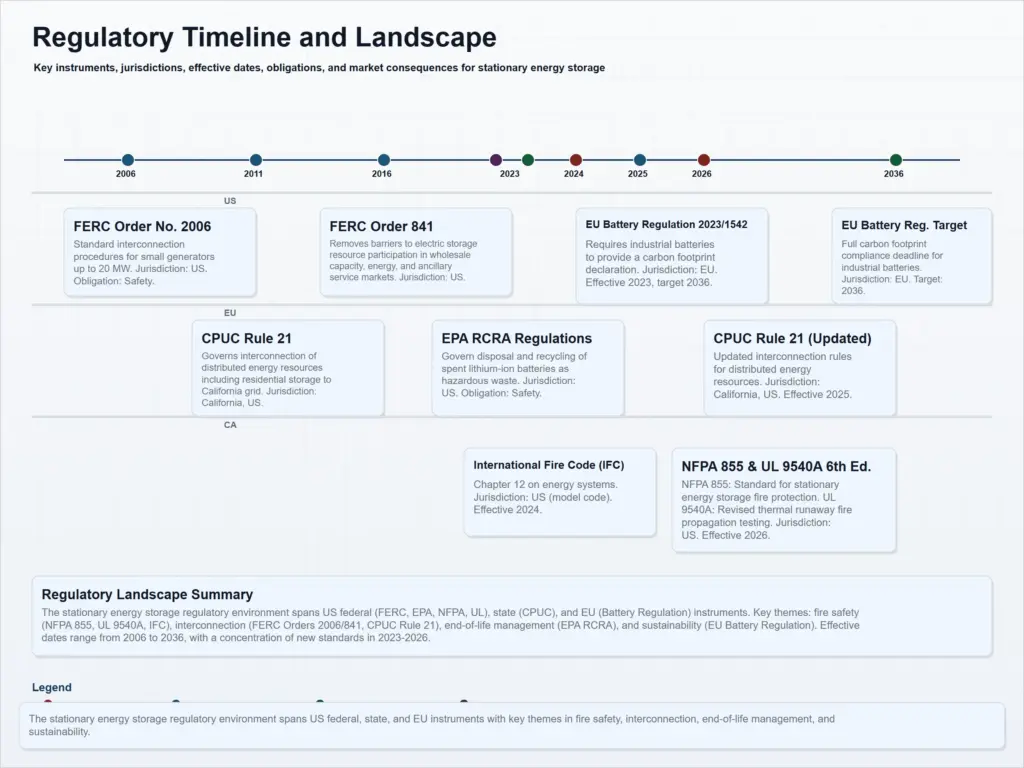
Federal and state-level interconnection rules define how stationary storage resources access wholesale electricity markets and connect to distribution grids. FERC Order 841, Order 2006, and California’s CPUC Rule 21 create overlapping but distinct requirements for different project scales and geographies.
FERC Order 841 requires each Regional Transmission Organization and Independent System Operator to revise its tariff to establish a participation model for electric storage resources. The model must ensure that storage resources are eligible to provide all capacity, energy, and ancillary services they are technically capable of providing, can be dispatched, and can set the wholesale market clearing price as both a seller and buyer. A minimum size requirement must not exceed 100 kW. This order removes historical barriers that treated storage like traditional generation and enables smaller projects to participate in RTO/ISO markets, affecting project developers and battery cell manufacturers targeting wholesale market revenue streams.
FERC Order 2006 establishes standard interconnection procedures and agreements for small generators up to 20 MW. Public utilities that own, control, or operate transmission facilities must amend their open access transmission tariffs to include these standardized procedures. The order applies to interconnection service for devices used for electricity production with capacity of no more than 20 MW, with an effective date 60 days after publication in the Federal Register. This rule provides a streamlined pathway for medium-scale storage projects that fall below the 20 MW threshold, reducing interconnection timelines and costs for project developers and EPC contractors.
California’s CPUC Rule 21 governs interconnection of distributed energy resources, including residential stationary storage, to the electric distribution systems of Pacific Gas and Electric, Southern California Edison, San Diego Gas & Electric, and small/multi-jurisdictional utilities. First adopted in 1982, Rule 21 has been refined through successive rulemakings. The Commission opened a new proceeding, R.25-08-004, in August 2025 to update interconnection procedures concerning safety, reliability, transparency, and cost containment. The prior proceeding R.17-07-007 was closed by Decision D.24-12-034 in December 2024. For residential solar installers and DER storage providers, Rule 21 defines technical interconnection requirements, metering standards, and application processes that directly affect project feasibility and timelines in the California market.
| Instrument | Issuer | Year | Capacity scope | Core requirements |
|---|---|---|---|---|
| FERC Order 841 | Federal Energy Regulatory Commission | 2016 (final rule) | Minimum size ≤100 kW; no upper limit specified | RTOs/ISOs must allow storage to provide all capable services, be dispatched, set clearing price; participation model required |
| FERC Order 2006 | Federal Energy Regulatory Commission | 2005 (issued) | Up to 20 MW | Standard interconnection procedures and agreement for small generators; public utilities must amend OATT |
| CPUC Rule 21 | California Public Utilities Commission | 1982 (first adopted); 2025 rulemaking R.25-08-004 ongoing | Distributed energy resources (residential to commercial scale) | Interconnection tariff for generating and storage facilities; safety, reliability, transparency, cost containment |
End-of-life and sustainability regulation
Regulatory pressure on battery disposal and lifecycle sustainability continues to grow in both the US and EU, with distinct compliance frameworks that affect recycling business models, supply chain management, and manufacturing cost structures for stationary storage.
In the United States, the Environmental Protection Agency under the Resource Conservation and Recovery Act classifies most lithium-ion batteries as hazardous waste when disposed of, due to ignitability and reactivity characteristics (D001 and D003). Generators of spent lithium batteries are responsible for determining whether their waste is hazardous and must manage it accordingly. To streamline compliance, the EPA recommends that businesses manage all used lithium batteries as universal waste under 40 CFR Part 273, which provides reduced handling requirements compared to full hazardous waste management. The universal waste pathway allows collection, transportation, and recycling under simplified standards until the batteries reach a destination facility. For stationary storage owners, this classification imposes recordkeeping, labeling, and time limits on storage, while the universal waste option reduces administrative burden. Battery recycling services benefit from the clearer regulatory pathway established by the EPA’s guidance.
In the European Union, Regulation 2023/1542 (the EU Battery Regulation) establishes sustainability requirements for batteries placed on the Union market. Article 7 requires a carbon footprint declaration for rechargeable industrial batteries with a capacity greater than 2 kWh, including stationary battery energy storage systems defined as industrial batteries designed to store and deliver electric energy to the grid or to end-users. The declaration must be drawn up for each battery model per manufacturing plant and follow implementing acts establishing the format. Article 8 introduces recycled content requirements that apply from 18 August 2028 or 24 months after the date of entry into force of the relevant implementing act. For global manufacturers supplying both US and EU markets, these requirements create divergent compliance paths: EU-facing products must track and declare carbon footprint and recycled content, while US-facing products must navigate RCRA hazardous waste classification and universal waste management options. Battery cell manufacturers and system integrators serving both jurisdictions face dual reporting and design-for-recycling obligations that increase compliance costs.
| Regime | Jurisdiction | Core obligations | Thresholds | Affected participants |
|---|---|---|---|---|
| RCRA – Universal waste (40 CFR Part 273) | United States (federal) | Most lithium-ion batteries are hazardous waste (D001, D003); EPA recommends universal waste management for streamlined collection and recycling | Applies to generators of spent lithium batteries; household exemption | Stationary storage owners, battery recyclers, waste management firms |
| EU Battery Regulation 2023/1542 | European Union | Carbon footprint declaration (Article 7); recycled content requirements (Article 8 effective August 2028); labeling and information duties | Industrial batteries >2 kWh (including stationary battery energy storage systems) | Battery cell manufacturers, system integrators, importers placing products on EU market |