
Global Mobile Parking Payment & Transaction Platforms Market Report, Size, Share and Forecast 2026–2033: The Fee Has No Cost Base — the Session Is the Asset and the Driver Is Paying for the Receipt
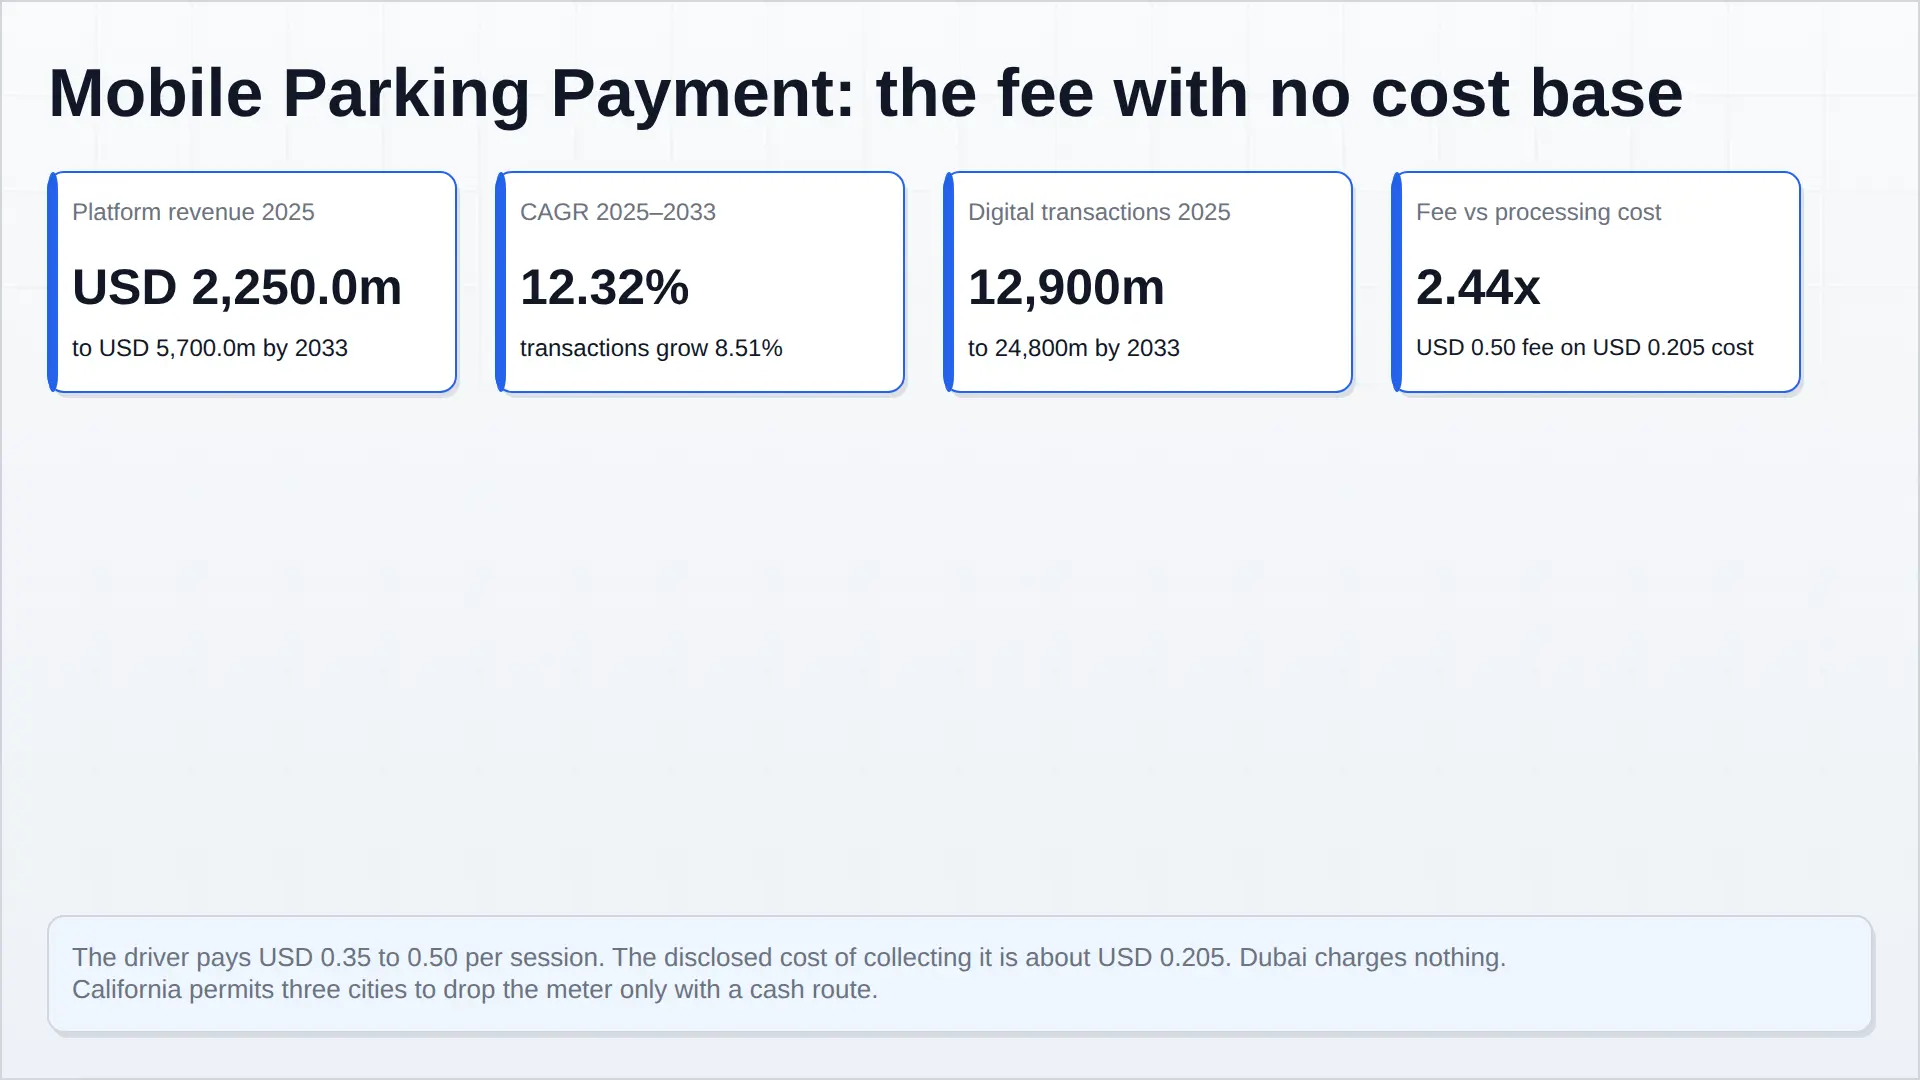
Pheonix sizes the global mobile parking payment and transaction platforms market at USD 2,250.0 million in 2025, reaching USD 5,700.0 million by 2033 at a compound annual growth rate of 12.32 per cent, across 12,900 million digital parking transactions rising to 24,800 million at 8.51 per cent.
The market does not sell payments. Payment is the cheapest thing it does. It sells the session record — the assertion that a specific vehicle was authorised to occupy a specific place for a specific duration — and everything it charges for is downstream of that record.
The fee is the exception. A driver in Dallas or San Francisco pays USD 0.35 per transaction; ParkMobile tells subscribers its fees average about USD 0.50, or 15 per cent of the parking cost. Against an average US on-street session of USD 3.98, that is 8.79 per cent at the published rate and 12.56 per cent at the realised rate. Chicago Parking Meters LLC booked credit card and other fees of USD 8,296,389 against parking revenue of USD 160,945,228 in 2024 — 5.15 per cent, or roughly USD 0.205 on a USD 3.98 session. The platform fee is therefore 1.71 to 2.44 times the cost it nominally covers, and nothing in it corresponds to a cost base.
Nor is it set by the party that owns the asset. San Bruno’s 2025 request for proposals requires a solution funded through reasonable transaction fees paid by end users, with no capital expenditure from the city, and invites bidders to propose a revenue share. The city pays nothing. The driver pays the tariff and the fee, and can vote on neither.
Four jurisdictions have already repriced the transaction. Dubai charges nothing for payment through its own applications or WhatsApp and penalises only SMS. The United Kingdom’s National Parking Platform, run by the British Parking Association on a not-for-profit basis since May 2025, routes sessions across 10 local authorities and more than 500,000 transactions a month so that any approved app can transact. California’s Vehicle Code section 22508(e) provides that a local authority may accept but shall not require payment by mobile device, with a narrow three-city exception. And open banking removes interchange and scheme fees from the rail beneath the fee.
Digitisation has been substitution, not expansion. At Seattle, pay-by-phone rose from about 35 per cent of transactions in 2019 to 80.21 per cent in 2025, but phone transactions were 6.68 million in 2023, 6.74 million in 2024 and 6.73 million in 2025 — a rise of 0.75 per cent — while pay-station transactions fell 24.89 per cent and total transactions fell 5.62 per cent. The app did not create a parker; it absorbed a machine.
Ownership has closed over. Arrive, until recently EasyPark Group, completed its acquisition of Flowbird Group in January 2025, bringing ParkMobile, EasyPark, RingGo and the Flowbird machine estate under one owner with combined 2024 revenue of EUR 574.0 million, or about USD 619.9 million. Corpay paid approximately USD 301.9 million net of cash for PayByPhone in September 2023. Verra Mobility’s parking segment produced USD 80.6 million on 190 million transactions, 9.17 per cent of a company whose total revenue was USD 879.2 million.
The three arms diverge. Driver-paid fees are 46.22 per cent of revenue in 2025, growing 7.75 per cent and falling to 33.16 per cent by 2033. Turnover and licence revenue grows 13.35 per cent to 40.88 per cent. Data and integration grows 19.54 per cent to 25.96 per cent. Of the USD 3,450.0 million added by 2033, the driver-paid fee contributes 24.64 per cent.
That is the forecast’s real content: not more parking, but a fee being competed, regulated and engineered out of existence while the transaction count nearly doubles — with growth migrating to whoever holds the contract with the asset owner rather than the account with the driver.
1. Market Snapshot
Pheonix sizes the global mobile parking payment and transaction platforms market at USD 2,250.0 million in 2025, reaching USD 5,700.0 million by 2033 at a compound annual growth rate of 12.32 per cent. Beneath that value sits a volume of 12,900 million digital parking transactions, rising to 24,800 million at 8.51 per cent. Revenue therefore grows at 12.32 per cent against transaction growth of 8.51 per cent, and the whole argument of this report turns on whether that gap is a durable repricing or a fee that is about to be taken away.
| Metric | 2025 | 2033 | CAGR |
|---|---|---|---|
| Platform revenue, USD million | 2,250.0 | 5,700.0 | 12.32% |
| Digital parking transactions, million | 12,900 | 24,800 | 8.51% |
| Revenue per digital transaction, USD | 0.174 | 0.230 | — |
| Driver-paid transaction fees, USD million | 1,040.0 | 1,890.0 | 7.75% |
| Turnover and licence revenue, USD million | 855.0 | 2,330.0 | 13.35% |
| Data, integration and embedded revenue, USD million | 355.0 | 1,480.0 | 19.54% |
What is counted. The market measured here is the platform layer: the revenue earned from initiating, authorising, settling, recording and reconciling a parking payment. That comprises the fee a driver pays to use an app or an automated channel; the licence, per-transaction and software revenue paid by the city or operator that owns the asset; and the emerging revenue from the transaction record itself — inventory digitisation, occupancy insight, embedded in-car payment and the hand-off of a session into an enforcement system.
What is not counted. The parking tariff belongs to the asset owner and is sized in parking management and concession operations. Pay-station and barrier hardware, including the machine estate that Flowbird manufactures, belongs to parking access and revenue control systems. Bay-level sensing belongs to occupancy sensing and space guidance, and the citation belongs to on-street enforcement and digital permitting. The boundary matters: three of those four adjacent markets supply the input this market charges for, and none of them sets the price of the transaction.
All figures are in nominal US dollars, all arithmetic was executed in Pheonix’s calculation engine, and no market-research publisher is cited anywhere in this report.
2. Executive Summary
The mobile parking payment market does not sell payments. Payment is the cheapest thing it does. It sells the session record: the assertion that a specific vehicle was authorised to occupy a specific place for a specific duration, written at a specific time, in a form an enforcement officer, an auditor or a disputes clerk will accept. Everything the market charges for is downstream of that record, and the record is the only part of the transaction that has no substitute.
Understanding that changes what the market’s headline number means. Pheonix sizes it at USD 2,250.0 million in 2025, rising to USD 5,700.0 million in 2033, across 12,900 million digital transactions growing to 24,800 million. The three arms behave very differently. Driver-paid transaction fees are the largest arm today at 46.22 per cent of revenue, growing 7.75 per cent — slower than everything else, and destined to fall to 33.16 per cent of the market by 2033. Turnover and licence revenue, paid by the asset owner, grows 13.35 per cent to 40.88 per cent. Data, integration and embedded revenue grows 19.54 per cent to 25.96 per cent. Of the USD 3,450.0 million added by 2033, driver fees contribute 24.64 per cent, owner-paid revenue 42.75 per cent and data 32.61 per cent.
The finding that matters is about the fee, not the market. A driver in Dallas or San Francisco pays USD 0.35 per transaction to use ParkMobile. ParkMobile itself tells subscribers that the fee averages USD 0.50, or about 15 per cent of the parking cost. Against an average US on-street session of USD 3.98 — the figure implied by ParkOmaha’s 2024 report, 1,555,173 sessions for USD 6,196,995 — the published USD 0.35 is 8.79 per cent of the session and the realised USD 0.50 is 12.56 per cent. The underlying cost of taking the money is visible in the audited accounts of the largest metered concession in the United States: Chicago Parking Meters LLC booked USD 8,296,389 of credit card and other fees against USD 160,945,228 of parking revenue in 2024, or 5.15 per cent. On a USD 3.98 session that is roughly USD 0.205 of processing cost. The platform fee is 1.71 to 2.44 times the cost it nominally covers, and unlike almost every other price in parking, nothing in the fee corresponds to a cost base.
Nor is it set by the party that owns the asset. In June 2025 the City of San Bruno, California, issued a request for proposals for mobile parking payment that requires “no capital expenditure from the City” and a solution “funded through reasonable transaction fees paid by end users”, while inviting bidders to declare a “proposed revenue share (if any) with the City”. Read that as a fiscal instrument and it is startling: a public body converts a capital and operating cost into a user fee set by a private supplier it has selected, on a service it has made mandatory, and may then take a percentage of the fee. The city pays nothing. The driver pays twice — the tariff and the fee — and can vote on neither.
Three jurisdictions have already set the price of the transaction to something other than what the supplier asks. Dubai’s Roads and Transport Authority charges no additional fee for payment through its smart applications or WhatsApp, and levies an extra 30 fils only on SMS. The United Kingdom’s National Parking Platform, taken over by the British Parking Association in May 2025 on a not-for-profit basis, has moved 10 local authorities onto an app-of-choice switch handling over 500,000 transactions a month — the structural opposite of a single-supplier fee. And California, since 1 January 2025, forbids a local authority from requiring payment by mobile device, permitting it only in San Francisco, Long Beach and Santa Monica, and only where the city has adopted an accessible cash payment plan and halved the fine for non-payment.
Digitisation so far has been substitution, not expansion. Seattle’s paid parking programme is the cleanest test available. Pay-by-phone rose from about 35 per cent of transactions in 2019 to 80.21 per cent in 2025 — but in absolute terms phone transactions were 6.68 million in 2023, 6.74 million in 2024 and 6.73 million in 2025, a rise of 0.75 per cent over two years, while pay-station transactions fell from 2.21 million to 1.66 million, down 24.89 per cent, and total transactions fell 5.62 per cent. The app did not create a parker. It absorbed a machine. San Francisco shows the same pattern against a different baseline: mobile app share of meter payments rose from 17 per cent in FY2019 to 36 per cent in FY2025, while card fell from 66 to 57 and cash halved from 14 to 7 per cent.
Ownership has closed over. Arrive — the group until recently called EasyPark Group — completed its acquisition of Flowbird Group in January 2025, bringing ParkMobile, EasyPark, RingGo and the Flowbird machine estate under one owner with combined 2024 revenue of EUR 574.0 million, roughly USD 619.9 million at USD 1.08 per euro, or 27.55 per cent of the market Pheonix sizes for 2025 — a share flattered by Flowbird’s hardware revenue, which this market’s definition excludes. Corpay paid approximately USD 301.9 million net of cash for PayByPhone in September 2023 and described it in its own filing as the world’s second-largest mobile parking operator. Verra Mobility’s parking segment produced USD 80.6 million on 190 million transactions across roughly 2,000 customers — 9.17 per cent of a company whose total revenue was USD 879.2 million. The United Kingdom’s competition authority cleared the EasyPark–Flowbird merger on 1 August 2024 without finding a substantial lessening of competition, on a market definition in which the fee the driver pays was not the relevant price.
The forecast is not a forecast of more parking. It is a forecast of a fee being competed, regulated and engineered out of existence at the same time as the underlying transaction count nearly doubles — which is why revenue per transaction rises only from USD 0.174 to USD 0.230 while the driver-paid fee per transaction falls 25.81 per cent, from USD 0.31 to USD 0.23, and why the market’s growth migrates to whoever holds the contract with the asset owner rather than the account with the driver.
3. What This Market Actually Sells
Strip the branding away and four things are sold, and only one of them is defensible.
Initiation. The platform tells the system which zone, which plate, which duration. This is worth almost nothing on its own: it is a form with four fields, and it is the part of the product most exposed to being absorbed into a camera, a car or a bank app.
Authorisation and settlement. The card is charged, the money moves, the operator is paid. This is a commodity bought from acquirers at a published price, and the audited evidence is unambiguous about what it costs: 5.15 per cent of parking revenue at Chicago Parking Meters, 5.37 per cent the year before. Merchant discount is a cost of doing business, not a market.
The session record. This is the product. A payment authorisation proves money moved. A session record proves a vehicle was entitled to be somewhere, and it is the only artefact that survives contact with a citation, an appeal, a chargeback or an audit. It is what the credential reader checks against when a permit is presented, and what the enforcement chain in on-street enforcement and digital permitting acts on. Nothing else in the stack can be substituted for it.
The fee. The fee is not a product. It is the price charged for the first three, attached to the driver rather than to the beneficiary, and set by the supplier rather than the asset owner. It is the only line in this market that has no cost base — and it is 46.22 per cent of revenue.
| What is sold | Who needs it | What it costs to provide | What the market charges |
|---|---|---|---|
| Initiation (zone, plate, duration) | Driver | Negligible marginal cost | Bundled into the fee |
| Authorisation and settlement | Asset owner | 5.15–5.37% of tariff at Chicago Parking Meters | Passed through, plus margin |
| Session record | Asset owner, enforcement, auditor, driver | Software and integration | Licence, per transaction, or both |
| The fee itself | Nobody, contractually | No identifiable cost base | USD 0.35–0.50 in the US; GBP 0.20 in the UK; zero in Dubai |
The distinction between the record and the payment is not academic. It explains why the sector’s valuations survived a decade in which card processing collapsed in price, and why they are now exposed to a decade in which the session record is being pulled into the vehicle’s own account. It also explains the politics. A city can defend a tariff because a tariff is a policy instrument it sets by ordinance. It has no such defence for a convenience fee it did not set, cannot see on its own revenue statements, and is not permitted to require in the largest state car market in the United States.
4. Demand Drivers
Six forces are pushing volume up, and two are pulling price down. The forecast is the net of them.
Machine withdrawal. Cities are removing the physical estate faster than they are adding demand. Seattle’s phone transactions held flat at 6.68 to 6.73 million between 2023 and 2025 while pay-station transactions fell 24.89 per cent, from 2.21 million to 1.66 million, leaving phone at 80.21 per cent of a shrinking total. Orlando has committed to fully cashless, meterless on-street and off-street operations by 1 October 2026, having run ParkMobile since 2015. Every removed machine is a transaction the platform receives by default.
Municipal capital aversion. The procurement norm is now zero capex. San Bruno’s 2025 RFP for 834 paid spaces requires the solution to be funded entirely by end-user transaction fees. That converts an infrastructure purchase into a service contract and removes the budget scrutiny that would otherwise attach to it.
| Channel | 2023 | 2024 | 2025 | Change 2023–2025 |
|---|---|---|---|---|
| Seattle pay-by-phone, million transactions | 6.68 | 6.74 | 6.73 | +0.75% |
| Seattle pay station, million transactions | 2.21 | 1.89 | 1.66 | −24.89% |
| Total, million transactions | 8.89 | 8.63 | 8.39 | −5.62% |
| Phone share of transactions | 75% | 78% | 80.21% | +5.21 points |
Enforcement dependency. Once permits go virtual and enforcement reads plates, the session record becomes an operational input rather than a receipt. That is the mechanism by which a payment platform becomes difficult to remove: not switching cost on the driver, but integration into the citation.
Tariff inflation. Where the fee is a percentage of the tariff, or where a flat fee is periodically re-set alongside one, tariff increases lift platform revenue without a single new transaction. The driver-paid arm grows 7.75 per cent a year in this forecast largely on that basis, not on volume.
Embedded channels. In-vehicle payment and plate-linked accounts remove the app from the transaction. In China, Parkopedia and ETCP report that under 1 per cent of surveyed drivers still pay for parking in cash and 40 per cent already pay through the vehicle’s infotainment system. This is a volume driver for transactions and a mortal threat to the fee, because there is no obvious moment at which to present a convenience charge.
Subscription conversion. ParkMobile sells a USD 5.99 monthly membership that removes the per-transaction fee entirely — and excludes San Francisco from eligibility. A supplier that will accept USD 5.99 a month in place of USD 0.50 a session is telling the market that the realised fee is not a cost recovery but a price it can move.
The two brakes. First, access politics: 40 per cent of UK drivers still name cash as their first choice, rising to 46 per cent of the over-65s, and 73 per cent of those who used a parking app in the previous year reported difficulties. Second, and more expensive, statutory constraint: California now treats mandatory mobile payment as a regulated privilege available to three named cities on conditions. Both brakes act on the fee, not on the volume.
5. Segment and Product Split
Three arms, three buyers, three different trajectories. The split below is Pheonix’s construction from disclosed participant revenue, municipal payment mix and per-session economics, and is presented net of tariff.
| Arm | 2025, USD m | Share | 2033, USD m | Share | CAGR | Share of growth |
|---|---|---|---|---|---|---|
| Driver-paid transaction fees | 1,040.0 | 46.22% | 1,890.0 | 33.16% | 7.75% | 24.64% |
| Turnover and licence revenue | 855.0 | 38.00% | 2,330.0 | 40.88% | 13.35% | 42.75% |
| Data, integration and embedded | 355.0 | 15.78% | 1,480.0 | 25.96% | 19.54% | 32.61% |
| Total | 2,250.0 | 100% | 5,700.0 | 100% | 12.32% | 100% |
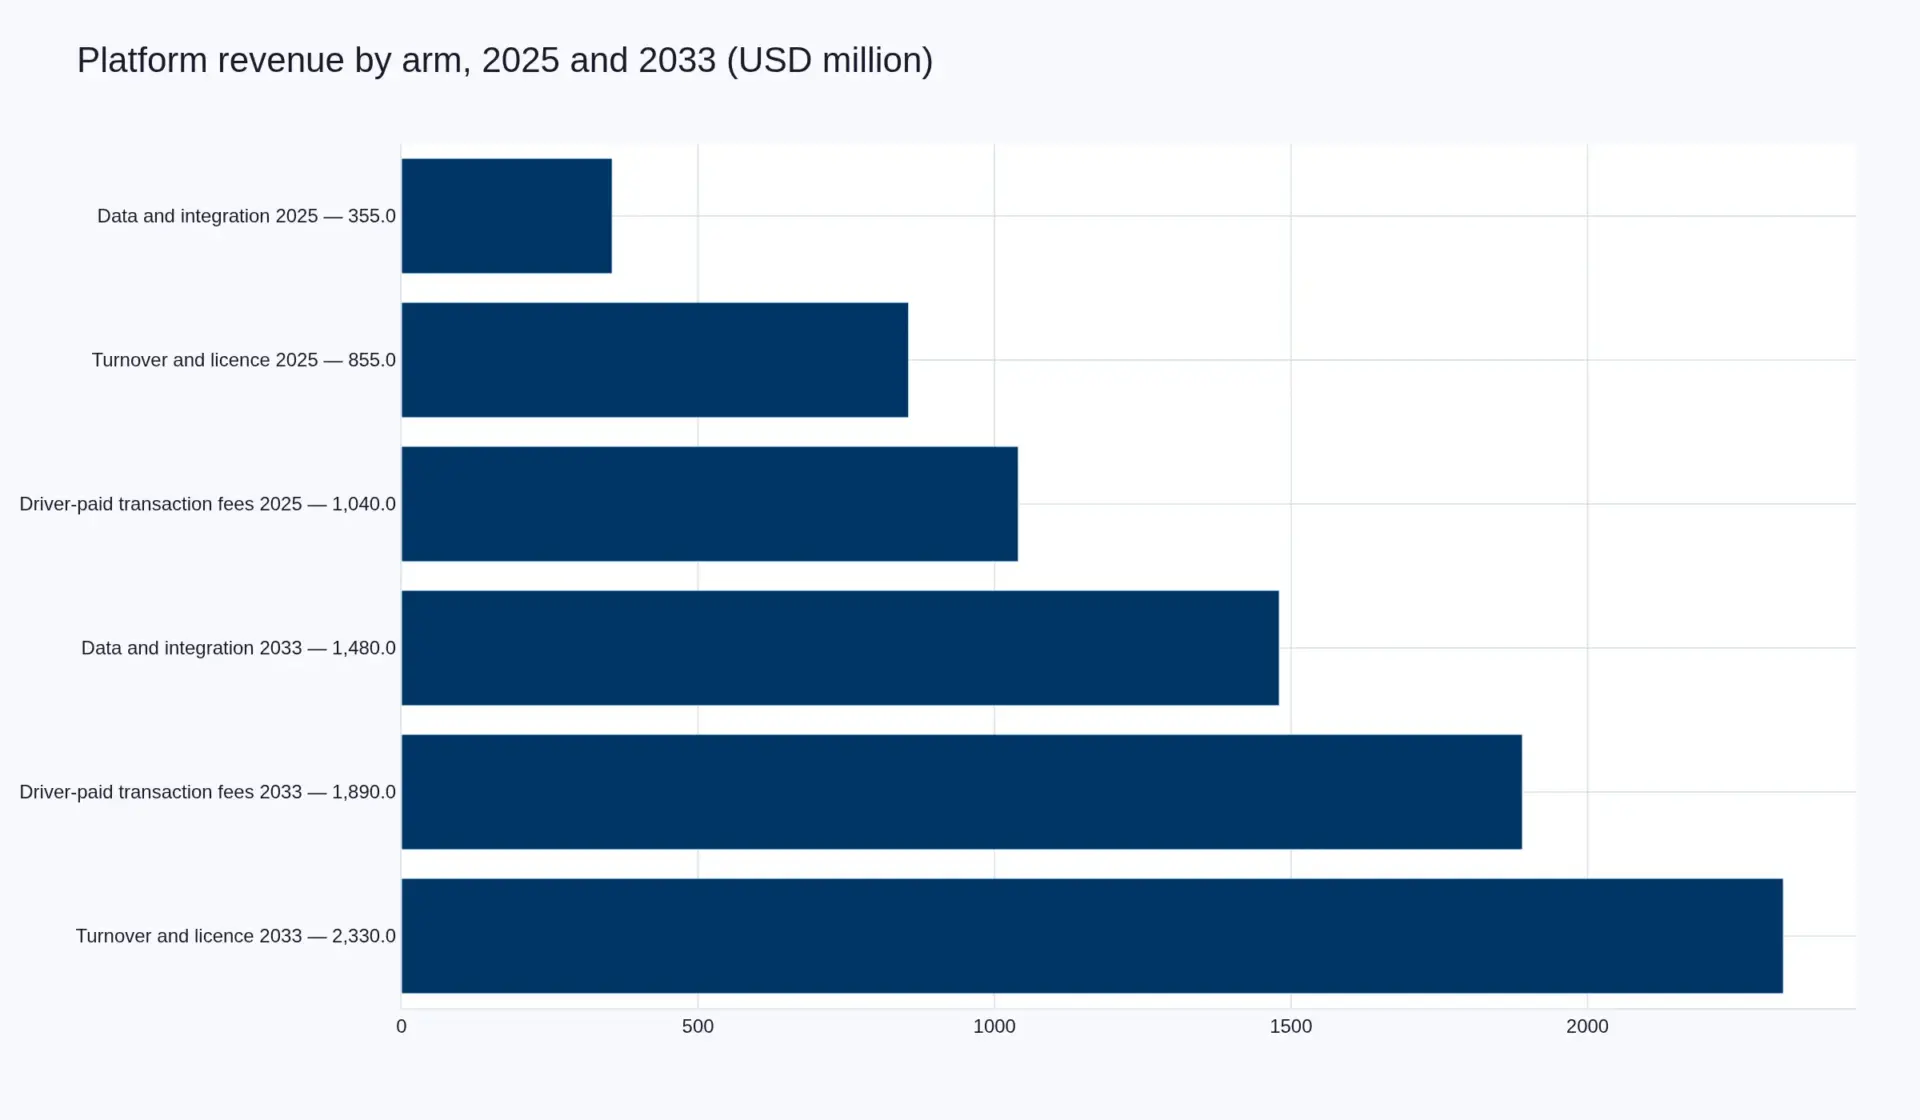
Driver-paid fees are the arm everyone can see and the one nobody owns. The count of transactions that carry a fee rises 11.85 per cent a year, from 3,355 million to 8,217 million, as cash-only markets digitise — but the fee per transaction falls 25.81 per cent, from USD 0.31 to USD 0.23, as app-of-choice switches, statutory conditions and open-banking rails take the price down. That is the entire story of this market in one pair of numbers: more transactions carrying a fee, each fee worth less, and the arm losing 13.06 points of share.
Turnover and licence revenue is what the asset owner pays: software subscription, per-transaction processing, integration with the enforcement and access systems, and in some contracts a share of the fee itself. It is the least glamorous arm and the most secure, because it is attached to a contract term rather than a consumer’s tolerance. Its growth is driven by the replacement of in-house systems and by the same digitisation that shrinks the fee.
Data, integration and embedded is where the record becomes a product: inventory digitisation, occupancy insight, in-car payment, permit issuance, and the reconciliation between the session and the citation. It is the smallest arm and the only one growing at a rate that suggests a different market underneath — 19.54 per cent, from 15.78 to 25.96 per cent of revenue.
6. Regional Analysis
Europe is the largest region on value and Asia-Pacific is the largest on volume, and the gap between those two statements is the single most important structural fact in this market: China generates roughly fifty-four times ParkMobile’s annual transaction count at a fraction of the revenue per transaction.
| Region | 2025, USD m | Share | 2033, USD m | CAGR |
|---|---|---|---|---|
| Europe | 880.0 | 39.11% | 2,010.0 | 10.88% |
| Asia-Pacific | 810.0 | 36.00% | 2,240.0 | 13.56% |
| North America | 430.0 | 19.11% | 1,010.0 | 11.26% |
| Middle East and Africa | 75.0 | 3.33% | 250.0 | 16.24% |
| Latin America | 55.0 | 2.44% | 190.0 | 16.76% |
| Total | 2,250.0 | 100% | 5,700.0 | 12.32% |
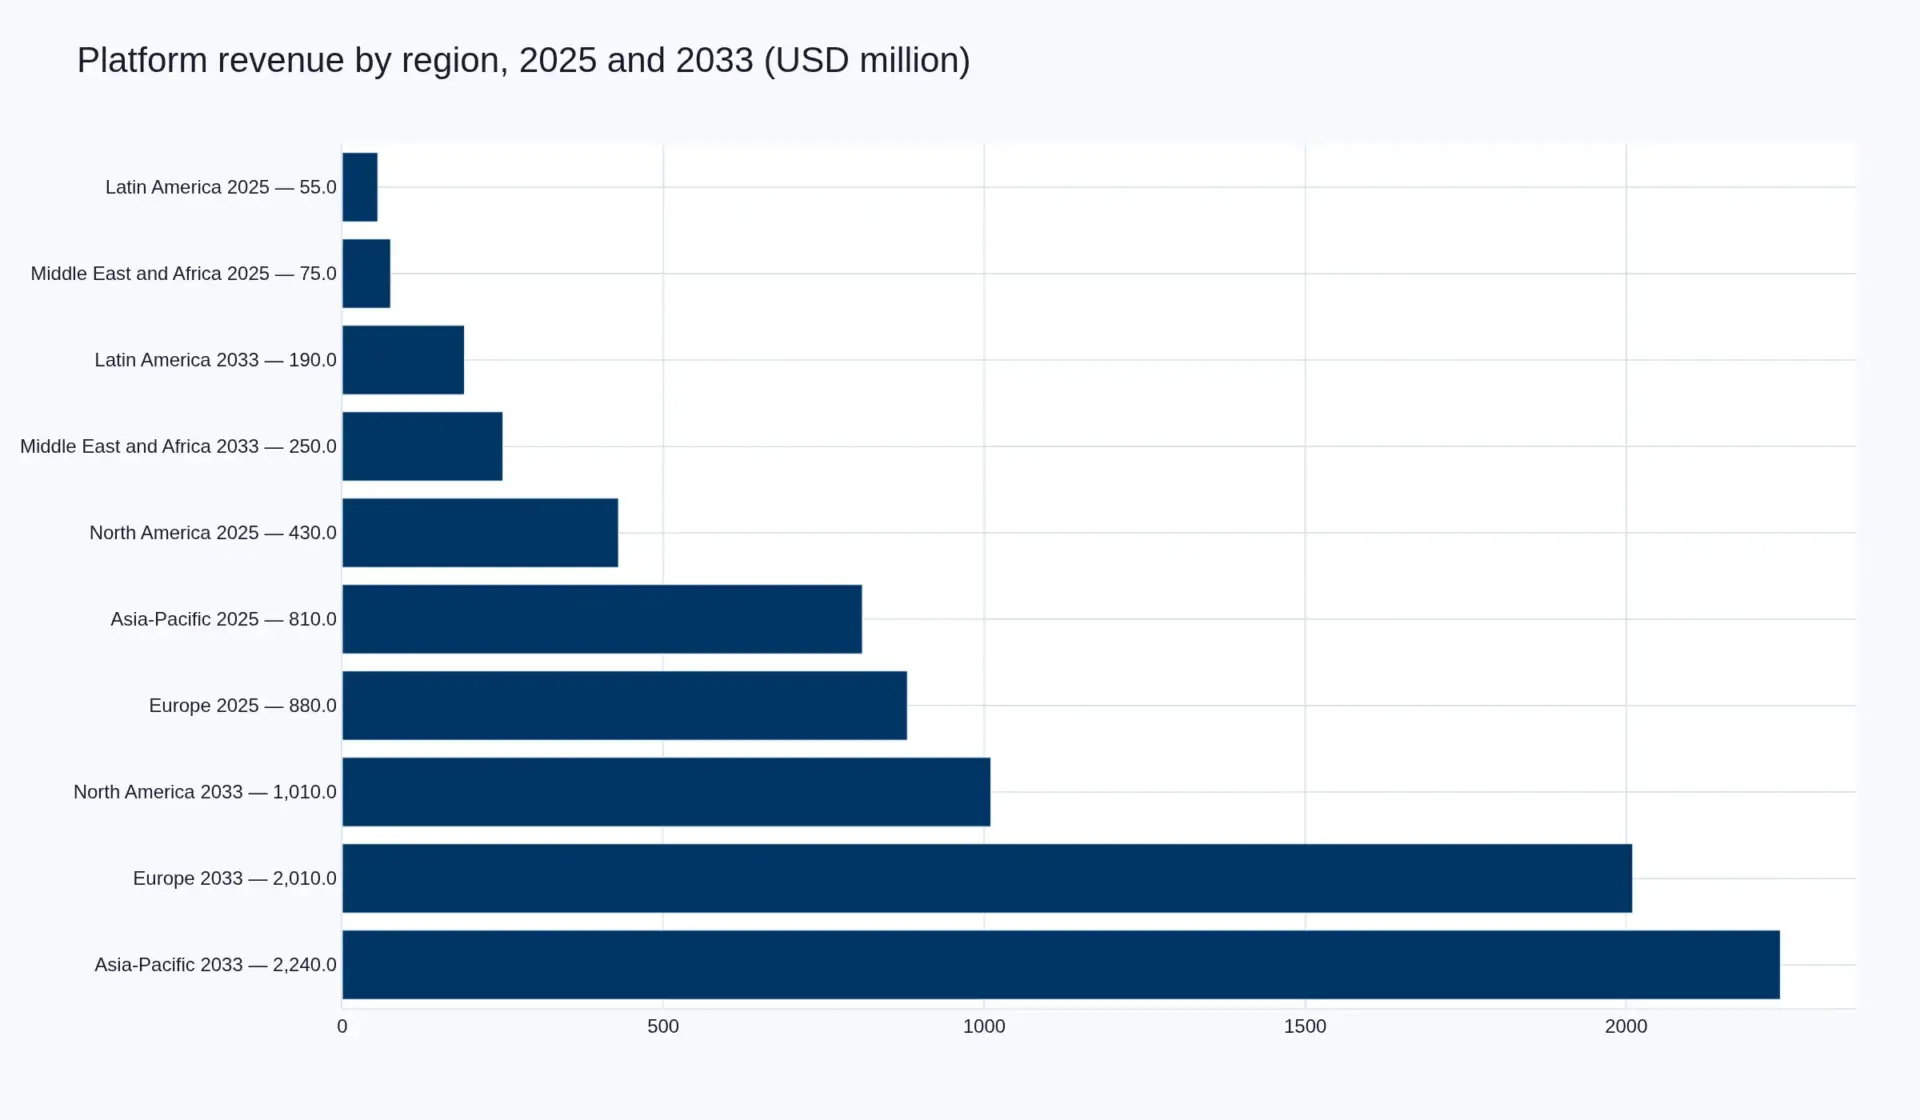
Europe carries the highest revenue per transaction because it carries the highest fee. RingGo charges a 20 pence convenience charge per transaction at Bromley, Lewes, Eastbourne and Rother, plus an optional 10 pence for a text reminder. The region’s structural event is the National Parking Platform, which converts the app from a walled garden into a routing decision: a driver chooses the app, the platform routes the session, and the fee becomes the thing being competed for rather than the thing being collected.
Asia-Pacific is where the fee never existed. ETCP in China manages close to 600 million transactions a month — 7,200 million a year, 53.73 times ParkMobile’s 2024-era 134 million — across roughly 5,000 facilities and more than 3 million spaces in 60 cities, with payment taken by plate recognition at the barrier rather than by a driver opening anything. Revenue per transaction in this model is a few fen paid by the operator, not a convenience fee paid by the motorist, which is why the region can hold 36.00 per cent of volume-weighted activity and 36.00 per cent of value on very different arithmetic.
North America is the most expensive market per transaction and the most exposed. ParkMobile’s 59 million registered users and 134 million transactions in 2023, San Francisco’s move from 17 to 36 per cent app share in six years and the USD 0.35–0.50 fee band make the region the laboratory for fee regulation — and California has already begun, with a statute that permits three cities to remove the meter only on condition that they keep a cash route and halve the penalty.
Middle East and Africa is small, fast and state-priced. Dubai’s RTA publishes a tariff per zone and charges nothing for payment through its own applications or WhatsApp, with a 30 fils penalty attached to SMS. That is the cleanest available demonstration that the transaction fee is a policy variable: the same operator, the same hardware, the same card rails, and a different number because a regulator decided the number.
Latin America is the fastest-growing region from the smallest base, and its growth is a digitisation story rather than a fee story: cash-heavy on-street systems converting directly to plate-linked mobile accounts, often with the fee absorbed by the operator because the alternative is uncollected revenue.
Sources
Every figure in this report traces to one of the sources below, or to Pheonix’s own construction where the text says so. No market-research publisher is cited anywhere in this report.
Audited accounts and company filings
- Chicago Parking Meters LLC, audited financial statements for the year ended 31 December 2024 — parking revenues of USD 160,945,228 and credit card and other fees of USD 8,296,389.
- Verra Mobility Corporation, Form 10-K for the year ended 31 December 2024 — Parking Solutions revenue of approximately USD 80.6 million and over 190 million parking transactions.
- Corpay, Inc., acquisition disclosures — the September 2023 acquisition of PayByPhone Technologies for approximately USD 301.9 million net of cash.
Municipal and programme reports
- Seattle Department of Transportation, 2025 Paid Parking Annual Report — phone and pay-station transactions for 2023, 2024 and 2025.
- San Francisco Municipal Transportation Agency, Contracts for Mobile Parking Payment and Related Services, 20 May 2025 — meter payment mix for FY2019 and FY2025.
- ParkOmaha, 2024 Annual Report — 1,555,173 on-street sessions and USD 6,196,995 of revenue.
- City of San Bruno, Request for Proposals for a Mobile Parking Payment Application, June 2025 — the zero-capex, end-user-fee procurement model and the revenue share question.
- City of Orlando, Parking System Modernization Project — the commitment to cashless, meterless operations by 1 October 2026.
- City of Dallas, pay by app — the USD 0.35 convenience fee per transaction.
- London Borough of Bromley, paying to park with RingGo — a 20 pence convenience charge per transaction plus 10 pence per optional notification.
Statute, regulation and competition
- California Vehicle Code section 22508 — parking payment zones by ordinance, and subdivision (e) as amended by SB 532 with effect from 1 January 2025.
- California Vehicle Code section 22508.2 — the three-city exception, the cash payment plan, the halved fine and the 1 January 2033 sunset.
- Department for Transport, Government teams with parking giants to ensure drivers can use preferred apps, 21 May 2025 — the National Parking Platform, 10 local authorities and over 500,000 transactions a month.
- Competition and Markets Authority, anticipated acquisition by EasyPark Group AS of Mobility 1 SAS, decision of 1 August 2024.
- Dubai Roads and Transport Authority, Pay Public Parking Fees — no additional fee through smart applications or WhatsApp, 30 fils on SMS.
Participant disclosures
- ParkMobile Go membership — transaction fees averaging USD 0.50, or about 15 per cent of the parking cost, and the exclusion of San Francisco.
- ParkMobile, 2023 Year in Review — 59 million users and 134 million parking transactions.
- Arrive (formerly EasyPark Group), 2024 Year in Review — more than 4,000 cities in over 20 countries, and the open-market model in Asbury Park.
- EasyPark Group, closing of the Flowbird Group acquisition, January 2025.
- Flowbird Group company filings (SIREN 444 719 272) — revenue of EUR 212.0 million and EBITDA of EUR 5.9 million in 2024.
- Parkopedia and ETCP, smart parking and payment services in China — approximately 600 million transactions a month across 5,000 facilities, and the Zhongyan driver survey.
Consumer and access evidence
- The AA, paying by cash to park, March 2025 — 40 per cent of drivers prefer cash, and 46 per cent of the over-65s.
- RAC, parking app difficulties, October 2025 — 73 per cent of recent app users reported difficulties; 6 per cent prefer QR.
- Baker v. ParkMobile, LLC, No. 1:21-cv-02182-SCJ, settlement information — the 2021 data security incident and the class settlement.
- Adyen, Pay by Bank — the absence of interchange and scheme fees on account-to-account payments, and a 49 per cent average saving against cards.
About this report
Pheonix Research sizes markets from disclosed primary anchors and publishes the construction. Where a figure is a Pheonix estimate rather than a disclosure, the text says so at the point of use. The research programme behind this report comprised 29 semi-structured interviews across six markets, eight open-ended conference-floor interviews at a European parking-industry exhibition, one closed roundtable with four municipal parking directors and 41 written survey responses, alongside the secondary evidence listed above. Findings that rest on that fieldwork rather than on a published statistic are identified as Pheonix’s own.
Table of Contents
Table of Contents
- Market Snapshot — value, volume, revenue per transaction and the three arms
- Executive Summary — the fee with no cost base, and four jurisdictions already repricing it
- What This Market Actually Sells — initiation, settlement, the session record, and the fee that pays for none of them
- Demand Drivers — machine withdrawal, municipal capital aversion, enforcement dependency, tariff inflation, embedded channels, access politics
- Segment and Product Split — driver-paid fees, turnover and licence revenue, data and integration
- Regional Analysis — Europe, Asia-Pacific, North America, Middle East and Africa, Latin America
- Competitive Landscape — three owners, one enormous absence, and the margins consolidation is buying
- Value Chain — five stages, one session, and where the fee sits between the cost and the price
- Investment Activity — what buyers pay for when the technology is cheap and the contract is not
- Technology and Innovation — the plate as the account, the switch as the market, and open banking
- Market Risk — five exposures and the one that is 46.22 per cent of revenue
- Regulatory Landscape — four regimes, and the gap where the fee should be
Competitive Landscape
7. Competitive Landscape
Three owners now hold most of the transactable volume in the Western half of this market, and the largest transaction processor in the world holds almost none of the Western fee. That inversion defines the competitive structure: concentration at the top, fragmentation at the edge, and a price that is competed for in exactly one layer of the stack.
| Owner | Platforms | Disclosed scale | Position |
|---|---|---|---|
| Arrive (formerly EasyPark Group) | EasyPark, ParkMobile, RingGo, Flowbird Group | Group revenue EUR 362.0m in 2024, operating result EUR 14.8m; Flowbird EUR 212.0m, EBITDA EUR 5.9m | 4,000+ cities in 20+ countries; the largest machine estate and the largest US app in one owner |
| Corpay, Inc. | PayByPhone | Acquired for approximately USD 301.9m net of cash, September 2023 | Described in Corpay’s own filing as the world’s second-largest mobile parking operator |
| Verra Mobility Corporation | Parking Solutions: pay stations, permits, transaction processing | USD 80.6m revenue on 190 million transactions across roughly 2,000 customers in 2024 | 9.17% of total company revenue of USD 879.2m; US and Canada, campus and municipal |
| ETCP (China) | Plate-recognition parking payment | Close to 600 million transactions a month; 5,000 facilities; 3 million+ spaces; 60 cities | The largest transaction count in the market, at the lowest revenue per transaction |
| The long tail | JustPark, Parkopedia, APCOA, Passport, T2 Systems, municipal in-house systems | Undisclosed | Distribution and integration without platform scale |
The merger that defined the market
On 1 August 2024 the Competition and Markets Authority cleared EasyPark Group’s anticipated acquisition of Mobility 1 SAS — Flowbird — finding no realistic prospect of a substantial lessening of competition. The transaction closed in January 2025, and the combined entity now trades as Arrive. The arithmetic is worth stating plainly: EUR 362.0 million of group revenue plus EUR 212.0 million of Flowbird revenue is EUR 574.0 million, which at USD 1.08 per euro is approximately USD 619.9 million — 27.55 per cent of the global platform layer Pheonix sizes for 2025 — a share flattered by Flowbird’s hardware revenue, which this market’s definition excludes.
What was bought was not margin. Flowbird’s 2024 EBITDA of EUR 5.9 million on EUR 212.0 million of revenue is a 2.78 per cent margin; Arrive’s operating result of EUR 14.8 million on EUR 362.0 million is 4.09 per cent. A business that has consolidated the two largest European platforms and the largest pay-and-display estate is running at a margin that would embarrass a car park operator. What it bought was the transaction count, the city contracts and the right to be the default screen when a driver arrives — assets that are cheap to own and expensive to replicate.
Concentration in the two fee markets
In the United Kingdom, PayByPhone and RingGo between them handle roughly 85 per cent of cashless parking, with RingGo alone present at about 17,000 locations. Those two brands now sit in different owners — RingGo inside Arrive, PayByPhone inside Corpay — which makes the UK a duopoly across two balance sheets rather than a single-supplier market. That structure survived for a decade because the fee was invisible: councils did not pay it, drivers did, and no procurement process compared it.
In the United States, ParkMobile reported 59 million users and 134 million parking transactions in 2023, and PayByPhone is its nearest competitor by Corpay’s own description. Verra Mobility’s parking segment is a different business — permits, citations, pay stations and processing for universities, municipalities and healthcare — and it processes 190 million transactions for USD 80.6 million, or USD 0.424 of revenue per transaction. That number is the most useful single benchmark in this report: it is what the systems layer earns when it sells a record rather than a fee.
Three layers, and only one of them is contested
The first layer is the brand and the switch: the app the driver opens, and the routing that decides which app may serve which asset. This layer is consolidating and is where the fee lives. The second is the processor and acquirer: card authorisation, tokenisation, chargebacks, settlement. It is invisible to the driver, priced at a published merchant discount, and dominated by parties who are not in this market at all. The third is the distribution and integration layer: parking operators such as APCOA, in-car platforms such as Parkopedia, and long-tail consumer apps such as JustPark. These participants can deliver transactions without owning the fee, which is precisely why they are the mechanism by which the fee gets competed away.
The absence is more consequential than any of the three. No platform owns the tariff. The tariff belongs to the city, the airport or the concessionaire, and is sized in parking management and concession operations; the gate and the machine belong to parking access and revenue control. The platform earns a fee on a price somebody else sets, from a customer somebody else owns, on an asset somebody else maintains. That is a good business while the fee is unchallenged and a fragile one the moment a regulator asks what the fee pays for.
What the bid list actually decides
The competitive arena is not the app store. It is the procurement document, and the document decides more about the market’s structure than any product decision does. San Bruno’s 2025 solicitation is a small but complete specimen: 84 pay stations, roughly 834 paid spaces, one year plus up to four renewals, no capital cost to the city, full disclosure of user transaction fees, and an invitation to propose a revenue share. Four requirements in one document set the terms on which the next five years of that city’s transactions are earned.
Three consequences follow. First, the winner is usually decided by integration rather than by fee: a platform that already talks to the enforcement system, the permit register and the access control estate is materially cheaper to adopt than one that does not, which is why systems vendors in parking access and revenue control keep appearing on shortlists they would not win on payment alone. Second, switching costs sit with the authority rather than the driver: the driver’s cost of changing app is a download, the city’s cost of changing platform is a re-integration, which is why a fee survives long after the market has stopped competing on it. Third, the long tail can win a city and cannot build a market — a regional operator can beat a national platform on service in one procurement and still have no way to price the fee differently, because the fee is set against the same benchmark everywhere.
There is a fourth consequence, and it is the one that decides how long this fee survives. A bid list that does not require fee disclosure produces a shortlist ranked on integration and on cost to the city — and the cost to the city is zero in every compliant bid. The variable that the driver actually pays is therefore the only variable the evaluation cannot compare, which means an authority can run a model procurement, select the better platform and still have no idea whether its drivers are paying more than the drivers in the next city. That is not a failure of the bidders. It is a failure of the specification.
The absence in the bid list is the number itself. No document reviewed for this report required a bidder to justify the fee against a cost, and only one required it to be disclosed at all. A market in which the price is neither disclosed at entry nor benchmarked afterwards does not behave like a competitive market, whatever the number of bidders.
Pheonix’s fieldwork finding — not a published statistic — is that the three largest platforms can each name their transaction count to the million and none can name its realised fee per transaction to the cent. That asymmetry between what is measured and what is charged is the clearest evidence that the fee is a pricing decision rather than a cost recovery, and it is why consolidation has been so easy: the acquirer buys volume and inherits a price nobody is defending.
Value Chain
8. Value Chain
The chain has five stages, and the fee sits between the fourth and the fifth with nothing underneath it. Trace one session and the structure becomes obvious.
| Stage | Who acts | What is charged | Who receives it |
|---|---|---|---|
| Tariff setting | City, airport or concessionaire | The parking tariff | The asset owner |
| Session initiation | Platform: app, web, IVR, SMS, QR, plate recognition, in-car | The convenience or service fee | The platform |
| Authorisation and risk | Acquirer, card network, processor, open-banking provider | Merchant discount and scheme fees | The acquirer and network |
| Settlement and remittance | Platform or acquirer | Spread and float | Platform, then asset owner |
| The record | Platform, then enforcement and audit | Licence, per transaction, or data fee | Platform, and the enforcement chain |
One session, priced
Take the average US on-street session implied by the ParkOmaha 2024 annual report: 1,555,173 sessions producing USD 6,196,995, or USD 3.98. The driver pays that tariff plus a platform fee of USD 0.35 in Dallas or San Francisco, or an average of about USD 0.50 according to ParkMobile’s own subscription page. The fee is therefore 8.79 per cent of the session at the published rate and 12.56 per cent at the realised rate.
What it costs to collect is disclosed by the largest metered concession in the United States. Chicago Parking Meters LLC recognised parking revenue of USD 160,945,228 in 2024 and credit card and other fees of USD 8,296,389 — 5.15 per cent. On a USD 3.98 session that is approximately USD 0.205. The platform fee is therefore 1.71 times the underlying processing cost at USD 0.35 and 2.44 times at USD 0.50. The remainder is not margin on processing. It is the price of the record, expressed as if it were the price of the payment.
The comparison is not an accusation of overcharging; it is a description of where the value is. A card authorisation is a commodity with a published price. A defensible statement that a specific plate was entitled to a specific bay at 14:07 is not, and the difference between USD 0.205 and USD 0.50 is what the market charges for knowing.
Who bears the cost, and who has no choice
The distribution of cost across the three parties is the most unusual feature of this chain. The asset owner pays nothing up front — San Bruno’s 2025 request for proposals requires a solution “funded through reasonable transaction fees paid by end users” with no capital expenditure from the city — and in many contracts receives a share of the fee as well. The platform pays the processing cost out of the fee. The driver pays the tariff and the fee, and has no mechanism to decline either: where the machine has been removed, the fee is the only route to compliance, and where it has not, the app is still the only way to extend a session without returning to the vehicle.
That is the structural defect. In an ordinary payment relationship the merchant bears the merchant discount because the merchant chose the acquirer. In parking the merchant is a public body that has outsourced the choice, the cost has been moved to a party that cannot negotiate, and the price is set by the supplier that was chosen. Pheonix’s fieldwork — 29 interviews across six markets, one closed roundtable with four municipal parking directors — found that no municipal interviewee could state the per-transaction fee in their own contract without consulting the agreement, while every platform interviewee could state it immediately. The party paying does not know the price; the party setting it does.
The record, and the hand-off that makes it valuable
A transaction becomes infrastructure at the moment it is read by something else. In a plate-based regime the session record is the credential: it is what the credential reader resolves against when a virtual permit is presented, and it is the input that decides whether the citation in on-street enforcement and digital permitting is issued or avoided. This is where the platform’s economics change character: a fee is a consumer price, contested and visible, while an integration is a switching cost, invisible and durable.
The chain is weakest exactly at that junction. The authority that benefits from an accurate record does not own the record, and the platform that owns the record is paid per transaction whether or not the record is right. Nothing in the standard contract prices accuracy. Pheonix’s assessment, from fieldwork rather than disclosure, is that the majority of cities cannot reconcile platform session data against their own enforcement data at the level of an individual session — which makes the citation, not the payment, the point at which this market’s quality is actually determined.
The clock, and who holds the money in between
Every stage of the chain is also a point in time, and the timing is where the platform’s working capital comes from. A session is authorised before it is priced: a driver starts it, extends it, sometimes overstays, and the amount is only final when the session closes, which may be hours later. The card is authorised at the start and captured at the end; the operator is remitted on a cycle; the city receives its tariff on a separate cycle again. Between those events the platform is holding money that belongs to somebody else.
That is not a criticism — it is the ordinary mechanics of merchant acquiring — but in this market it has an unusual consequence, because the party owed the money is a public body with an annual budget cycle and the party holding it is a private company with a monthly one. Pheonix’s fieldwork found that remittance frequency is negotiated contract by contract and is rarely surfaced in public documents; several municipal interviewees could not state their cycle without checking the agreement. A supplier that collects from the driver in real time and remits to the authority monthly is, in effect, extending itself credit against a public balance sheet — and charging the driver a fee for providing it.
The clock also determines what can be reconciled. A session that closes at 23:40 is available for reconciliation the next morning; a dispute over a citation issued at 23:41 depends on whether the enforcement system polled the platform’s data before or after the session closed. No participant publishes that interval, and it is the interval on which every contested citation turns.
Three margin pools, one of them exposed
The fee pool — USD 1,040.0 million in 2025, 46.22 per cent of revenue — is the largest, the least defensible and the most political. It has no cost base, it is not tariffed, and every structural force described in this report acts on it.
The contract pool — USD 855.0 million, 38.00 per cent — is the most secure, because it is priced in a procurement process and attached to a five-year term in most municipal contracts. It is also the pool that grows fastest among the two large arms, at 13.35 per cent.
The record pool — USD 355.0 million, 15.78 per cent — is the smallest and the only one whose product does not exist without the other two. It grows at 19.54 per cent, and every additional function a city asks of its parking data adds to it. If this market has a defensible future, it is here: not charging the driver for the privilege of paying, but charging the asset owner for knowing what happened.
Investment Activity
9. Investment Activity
This market has attracted a great deal of capital and almost no plant. The capital has gone into transaction counts, city contracts and default-screen position — assets that cost little to own and are expensive to dislodge — while the physical estate that once defined parking technology has been sold, merged and re-sold at margins that barely cover its cost of capital.
What has actually changed hands
The roll-up. Arrive, until recently EasyPark Group, is owned by Vitruvian Partners, Verdane and Searchlight Capital Partners. Its acquisition of Flowbird Group — cleared by the Competition and Markets Authority on 1 August 2024 and closed in January 2025 — brought the largest European app, the largest US app, the largest UK app and the largest pay-and-display estate under one owner. The combined 2024 revenue of EUR 574.0 million is roughly USD 619.9 million, and the group operates in more than 90 countries through brands that include ParkMobile, RingGo, Flowbird and EasyPark.
The strategic purchase. Corpay paid approximately USD 301.9 million net of cash for PayByPhone in September 2023 and placed it inside its Vehicle Payments segment, alongside fuel cards and toll payments. The logic is not parking. It is that a vehicle payment relationship — a card on file, a plate, a recurring authorisation — is a distribution channel into every other payment the vehicle makes.
The de-emphasised segment. Verra Mobility is the public comparator, and its disclosure is the most useful in the market because it separates parking from the tolling business that actually drives the valuation. Parking Solutions produced USD 80.6 million, or 9.17 per cent of USD 879.2 million, on 190 million transactions and roughly 2,000 customers. Its service revenue fell USD 0.7 million, or 1 per cent, and the fourth quarter was down 13 per cent to USD 19.7 million from USD 22.5 million as professional services declined. A segment that grows slower than its parent and earns USD 0.424 per transaction is not where a public company’s multiple comes from.
Why the multiples look the way they do
Two disclosed margins explain the shape of the deal flow. Flowbird earned EUR 5.9 million of EBITDA on EUR 212.0 million of revenue, a 2.78 per cent margin, on revenue that grew 5.53 per cent. Arrive earned an operating result of EUR 14.8 million on EUR 362.0 million, or 4.09 per cent, on revenue that grew 21.48 per cent. This is not a software business pretending to be hardware or a hardware business pretending to be software. It is a low-margin transaction business with a high-margin habit attached to it, and the habit — the fee — is the part under attack.
The disclosed prices are the only public valuation of the fee that exists. Corpay paid approximately USD 301.9 million for a business it described as the second largest mobile parking operator in the world, and Arrive acquired Flowbird and with it the machine estate that keeps an app installed in cities that have not yet replaced their pay stations. Neither price can be decomposed into fee revenue, because neither buyer disclosed the fee. What the market will pay for a transaction count is therefore the closest thing to a market price for the thing this report is about — and it is a price set by buyers who could not see it either.
What a buyer is therefore paying for is a count and a contract. The count is defensible because a driver who has registered a card and a plate does not switch apps to save 15 pence. The contract is defensible because municipal procurement runs on five-year terms; San Bruno’s 2025 request for proposals, for instance, offers one year plus up to four one-year renewals, and awards on a model with no capital cost to the city. Five years of a per-transaction fee on a rising tariff, funded by a party who did not negotiate it, is an unusually clean annuity — and it is why financial owners rather than industrial ones have ended up holding the largest platforms.
The structure of the capital
Almost all of the capital in this market is private, and almost all of it is deployed on the supplier side. The city contributes no capital: it contributes the asset, the tariff-setting power and the enforcement authority. The platform contributes the software, the processing relationship and the integration, and recovers it through the fee and the licence. The driver contributes both the tariff and the fee and receives, in exchange, a receipt he does not keep.
That structure has one measurable consequence for investors. Because the asset owner has no capital at risk, it has no incentive to defend the fee — and every incentive to add to it, since a share of the fee is revenue to a parking authority that is otherwise being asked to reduce its subsidy. Pheonix’s fieldwork, across 29 interviews and one closed roundtable with four municipal parking directors, found that revenue share is now a routine line in mobile payment procurements and is rarely disclosed publicly. A fee the city does not pay and may share in is a fee no city has a reason to police.
Three things an investor is underwriting
Strip out the technology narrative and every transaction in this market is a bet on three things: the length of the contract, the durability of the fee, and the cost of replacing the integration. The first is disclosed and mostly five years. The third is real but falling, because integration is increasingly APIs rather than bespoke work. The second is not disclosed, not benchmarked and not underwritten — and it is 46.22 per cent of the market’s revenue.
That asymmetry explains the pattern of ownership. Financial buyers have paid for platforms because the contract and the count are legible and the fee looked like an annuity attached to a rising tariff. Strategic buyers have paid because a card on file and a plate are a route into other vehicle payments. Neither has paid for the fee as a price with a defensible cost base, because there is not one — which means the underwriting assumption in every one of these transactions is that the fee persists by default rather than by contract.
The seller side is equally telling. Cities do not own equity in the platforms that collect their revenue, do not sit on their boards, and in most contracts do not audit the fee. A public body that has outsourced the collection of a statutory charge, retained the enforcement power and taken no capital risk has the governance profile of a customer, not an owner. If the fee is ever repriced by regulation rather than competition, the loss falls entirely on the private side of that relationship — which is exactly the allocation an investor should be paid for, and currently is not.
The next acquisition target is not another app. It is the data layer: occupancy inventory, session-to-citation reconciliation, and the analytics products that platforms are already piloting — ParkMobile Insights, for instance, was deployed in nine US cities including Philadelphia and Columbus, and the group reports digitising more than 2,000 kilometres of parking inventory with LiDAR and scanning vehicles. That is the only part of this market whose revenue rises when the fee falls.
Technology & Innovation
10. Technology and Innovation
The most important technology change in this market is the removal of the interface. Everything the platform charges for happens at a screen; every serious innovation in progress is an attempt to delete the screen. That is good for the driver, good for the transaction count, and structurally fatal to the fee.
The plate is becoming the account
China shows what the market looks like when the plate is the credential rather than the wallet. ETCP manages close to 600 million parking transactions a month — 7,200 million a year, 53.73 times ParkMobile’s 134 million — across roughly 5,000 facilities, more than 3 million spaces and 60 cities, with entry and exit captured by plate recognition at the barrier. No app is opened. No fee is presented to the driver. Payment is calculated from the entry and exit events and settled against a linked account, and the operator pays the platform a few fen per transaction.
Parkopedia’s survey work with Zhongyan found that under 1 per cent of respondents still pay for parking in cash and 40 per cent already pay through the vehicle’s infotainment system. Whatever the sampling limitations, the direction is unambiguous: the transaction is migrating from the phone to the vehicle and from the driver to the barrier.
In-car and app-less channels
Parkopedia’s integration with ETCP supports both “Access and Pay” and QR payment from the head unit, with payment settled through a saved card, Alipay or WeChat Pay. Dubai’s Roads and Transport Authority has gone further in one respect: it accepts payment through its own applications, through WhatsApp, through a chatbot, through parking machines and by SMS, and it charges an additional 30 fils only on the SMS route. Dubai’s App Clips flow lets a driver scan a code on the machine and settle through Apple Pay without installing anything.
That last example is the pattern to watch. The unit of innovation is not the app; it is the shortest possible path between a parked vehicle and a settled transaction. Every shortening of that path removes a screen on which a fee could be presented, which is why the fee survives longest in markets where the app is the only route — and why the markets that have shortened the path most are also the markets where the fee is zero.
Contactless, QR and the quishing problem
Tap-to-pay at the machine has been the quiet success of the last five years: it captures the driver who will not download software, at a card-present rate, with no platform fee at all. QR codes captured the opposite: a poster, a browser, a card form. The RAC’s 2025 survey of 1,709 UK drivers found just 6 per cent prefer to scan a QR code and pay by card, and warned about “quishing” — malicious stickers placed over genuine codes. Where a QR is the primary route, the payment is routed by whoever printed the sticker.
Open banking and the price of the rail
The payment rail underneath the fee is being repriced. Account-to-account payment over open banking removes interchange and scheme fees entirely; Adyen’s own comparison puts the average saving on local payment methods at 49 per cent against credit and debit cards. In a market where the disclosed cost of collection is 5.15 per cent of tariff revenue, a rail that costs a fraction of that does not merely improve margin — it removes the justification for the fee. If collection costs materially less, the number the driver pays has to be defended as a price for the record rather than a recovery of cost, which is a much harder argument in front of a regulator.
The same pressure comes from the card schemes themselves. Tokenisation, network token updates, PSD2 strong customer authentication in Europe and PCI DSS obligations all raise the fixed cost of running a payment form and lower the marginal cost of processing a correct one. The platforms that survive this are the ones that have already accepted the fee is a product price, not a cost recovery.
The switch: the only structural innovation
The National Parking Platform is the most consequential technical change in the market and it is not a product. It is a routing standard. It sits between the driver’s chosen app and the council’s parking system so that any approved app can transact any participating location, under the BPA’s not-for-profit stewardship, with the Department for Transport retaining oversight. Ten local authorities and more than 500,000 transactions a month at the point of transfer is small against the UK total; the significance is that it converts the app from a tenancy into a utility.
Once a driver can use any app, the fee becomes the only variable in the transaction, and it is set in front of a competitor. The US equivalent is not a standard but a pilot: ParkMobile’s open-market deployment in Asbury Park, New Jersey, where multiple apps serve the same inventory with different features and fee structures. The group’s own reporting is that mobile payments account for 75 to 80 per cent of monthly transactions in that model — which is the strongest available evidence that competition between apps raises digitisation while it compresses the fee.
Standards and the identity layer
Beneath the visible innovation sit three unglamorous standards that decide which business models are possible: PCI DSS for cardholder data, PSD2 strong customer authentication in Europe for the authorisation step, and the network tokenisation that lets a stored credential survive a card reissue. Together they push the market towards tokenised, app-less, plate-linked transactions — the same destination China reached without a card industry at all.
The unresolved standard is identity. A plate is not a person, a session is not a receipt and a permit is not a payment. Every party in this market maintains its own mapping and none is portable. Until a session record can be presented to a third party — an enforcement officer, an appeals body, another operator’s system — the platform’s control of the record remains its strongest asset. The first participant to make that record portable will do the market a favour and give away its own moat, which is why it has not happened.
What is not being built
Two obvious products do not exist. The first is a portable session record: a driver’s proof of payment is trapped inside the app that sold it, so an appeal against a citation depends on the enforcement system having read the same platform’s data. The second is a reconciliation layer between platform sessions and citation issuance, which is the one integration every municipal interviewee in Pheonix’s programme asked for and none had. Both would raise the value of the record and lower the value of the fee — which is precisely why the market has not built them.
Market Risk
11. Market Risk
The risks in this market are unusually legible, and unusually concentrated in one line of revenue. Six exposures matter; one of them is worth more than the other five combined.
| Risk | Revenue exposed | Likelihood by 2033 | Severity |
|---|---|---|---|
| Fee abolition or compression | USD 1,040.0m, 46.22% of 2025 revenue | High | High |
| Channel disintermediation: in-car and plate recognition | Entire initiation layer | Medium-high | High |
| Security or identity failure | Licence revenue and contract renewals | Medium | High |
| Access litigation and legislation | US fee arm and mandated-digitisation contracts | Medium | Medium |
| Contract concentration and municipal budget stress | USD 855.0m, 38.00% of 2025 revenue | Medium | Medium |
| Processing margin compression | Thin spread inside the fee | High | Low |
The fee is the position
The driver-paid fee carries 46.22 per cent of revenue and has no legal, contractual or cost-based defence. Four jurisdictions have already demonstrated the range of things that can happen to it. Dubai charges nothing for payment through its own applications and penalises only SMS. The UK’s National Parking Platform makes the app substitutable, so the fee is priced in front of a competitor. ParkMobile’s own open-market pilot in Asbury Park demonstrates that competing apps raise digitisation and differentiate on fee. And California makes mandatory mobile payment a conditional privilege rather than a commercial right.
Compression does not require any of those to become national policy. It requires one large city to conclude that a 12.56 per cent charge on a USD 3.98 session is indefensible in a cost-of-living environment, and to run a procurement that says so. Nothing in the procurement frameworks reviewed for this report prevents a city from setting a maximum fee; San Bruno’s request for proposals asks bidders to disclose “all user transaction fees” and to propose a revenue share, which is a city beginning to read the number for the first time.
Disintermediation is the slower, larger threat
A plate-read transaction requires no initiation, and an in-vehicle transaction requires no app. If the Chinese model propagates — under 1 per cent cash, 40 per cent in-car in the survey Parkopedia and Zhongyan ran — the platform’s role narrows to settlement and the record, both of which are cheaper per transaction than a consumer fee. This is why the segment most likely to grow is the one that sells to the asset owner: USD 2,330.0 million by 2033 against USD 855.0 million today.
The counter-argument is that Western cities own their tariffs and cannot readily move to plate-billed accounts without a statutory basis, since a plate-linked account requires the authority to bill a registered keeper for a parking session rather than a citation. That is a legal constraint, not a technical one, and it is the main reason the US and Europe will lag China on this transition by years rather than months.
Identity is the concentration risk nobody prices
Every transaction in this market is a locational record about an identifiable person and a vehicle. The 2021 data security incident at ParkMobile produced a certified class action — Baker v. ParkMobile, LLC, No. 1:21-cv-02182-SCJ, in the Northern District of Georgia — which settled with cash payments or in-app credits, with ParkMobile denying all claims. The cost of that episode is not the settlement. It is that a platform holding tens of millions of plate-linked identities is a target whose breach affects the city’s enforcement data, the operator’s revenue and the driver’s location history at once.
Regulators are beginning to say so. California requires any city operating a mobile-only payment zone to evaluate the impact on privacy in a report to its own governing body and to the transportation committees of the Legislature. A privacy impact assessment attached to a parking statute is a signal that the record is now understood as personal data rather than a receipt.
Access politics, and the risk of a mandated channel
The commercial risk in removing cash is not reputational. It is that the removal invites a statutory remedy that constrains the product. The evidence base for that remedy is already built: 40 per cent of UK drivers name cash as their first choice, rising to 46 per cent of the over-65s; 73 per cent of those who used a parking app in the previous year reported difficulties. California’s response — permit three named cities to remove the meter, require a cash plan including a mailed invoice requested through the app, and halve the fine — is the template. Any market where a city goes cashless without an access plan is a market where the platform inherits a legislative fight it did not choose.
Contract concentration
38.00 per cent of revenue comes from contracts with public bodies, mostly on five-year terms with renewals at the authority’s discretion. Those authorities are funded by the tariff, and the tariff is politically constrained; a parking authority under budget pressure has three options, and only one of them is to raise the tariff. The other two are to re-tender the platform contract on price, or to take a larger share of the fee. Both end in the same place.
What the register does not capture
Five of the six risks above land on the same 46.22 per cent. That correlation is the real exposure: a statutory fee cap, an app-of-choice switch, a plate-billed account, an access scandal and a privacy breach are different events with the same financial consequence, because each reduces either the price or the volume of the driver-paid transaction. A register that treats them separately understates the concentration by mistaking diversification of cause for diversification of effect.
There is a symmetrical case the register also misses. If the fee falls faster than the transaction count rises, revenue falls; if the count rises faster, revenue rises. At Seattle the count did not rise at all, which is the least favourable combination observed. At Asbury Park, where several apps compete for the same inventory, mobile payments reached 75 to 80 per cent of monthly transactions — the most favourable. The spread between those two outcomes is this market’s real forecast error band, and it is wider than the difference between any two published growth assumptions.
What would falsify this view
An honest forecast must state its own refutation. The strongest counter-evidence is that the fee has been rising, not falling. ParkMobile publishes USD 0.35 in Dallas and San Francisco and simultaneously tells subscribers that its fees average about USD 0.50, or 15 per cent of the parking cost — which means realised fees are already 42.86 per cent above the published rate in some zones. If fees are set zone by zone and revised with the tariff, then the fee is an escalator rather than an endangered line, and the compression assumed here would be wrong. The subscription model points the same way: USD 5.99 a month to remove the fee entirely implies a supplier confident that the fee is a price it controls.
Pheonix’s judgement is that both things are true at once — the fee rises where it is uncontested and falls where it is contested — and that the contested share grows every year as procurement scrutiny, app-of-choice switches and statutory conditions spread. That is why the forecast has the fee arm growing 7.75 per cent while losing 13.06 points of share.
Regulatory Landscape
12. Regulatory Landscape
Five regulatory regimes touch this market and not one of them prices the fee. That is the gap that explains almost every commercial oddity described in this report: a price with no cost base, charged by a supplier to a consumer on behalf of a public body that does not pay it and may share in it, is a price no instrument was written to govern.
| Regime | Instrument | What it prices | Who bears it |
|---|---|---|---|
| Tariff and traffic law | Ordinance, statute, zone designation | The parking tariff, and whether a digital-only channel is permitted at all | Asset owner and driver |
| Payment regulation | PCI DSS, PSD2 and strong customer authentication, interchange rules, scheme mandates | The cost of authorising and settling a card | Platform |
| Public procurement | Requests for proposals, concession and services contracts | The licence, the revenue share and the contract term | Authority, indirectly the driver |
| Competition law | Merger control and market studies | Concentration, not the consumer fee | Platform owners |
| Accessibility and equality | Disability access law, consumer protection, equality duties | The existence of a non-digital route | Authority and platform |
Tariff law is where the action is
California has run the only controlled experiment in the English-speaking world, and the statute is unusually explicit. Section 22508 of the Vehicle Code requires a local authority to establish parking payment zones and fix rates by ordinance, and subjects such an ordinance to local referendum. Subdivision (e), as amended by SB 532 with effect from 1 January 2025, then does something no other jurisdiction in this report does: it provides that a local authority may accept but shall not require payment of parking meter fees by a mobile device.
Section 22508.2 carves out a narrow exception. Only the City and County of San Francisco, the City of Long Beach and the City of Santa Monica may require mobile payment in a parking payment zone, and only on two conditions: signage within 100 feet of every space stating that payment is required and how it may be made, and an accessible and equitable parking cash payment plan adopted by ordinance, which must provide reasonably accessible alternative means of paying cash and must assess strategies including accepting cash against a mailed invoice requested through the mobile payment system. The city must consult racial equity, privacy protection and economic justice organisations in drafting it.
The conditions go further than process. The fine for failing to pay in a mobile-only zone without a meter is one-half the fine for failing to pay in a metered zone, except where the driver paid and overstayed. Each zone authority runs five years from creation, and the whole section sunsets on 1 January 2033. And the city must report to its governing body and to the transportation committees of the Legislature on equity, accessibility, privacy, traffic outcomes, implementation cost, citations issued and revenue generated.
Read together, those provisions are a template for how this market gets regulated everywhere. The state did not ban the digital-only channel; it made the channel conditional on an access route, priced the penalty for non-compliance at half the normal rate, imposed an evidence obligation, and put an expiry date on the whole experiment.
Payment regulation sets the cost, not the price
Card scheme rules, PCI DSS obligations and, in Europe, PSD2 strong customer authentication set what it costs a platform to authorise and settle a payment. They do not constrain what it charges for doing so. That asymmetry is the market’s defining regulatory feature: the cost side of the fee is heavily regulated and the price side is not regulated at all.
Open banking changes the cost side materially. Account-to-account payment removes interchange and scheme fees, and the payments industry’s own comparison puts the saving on local methods at 49 per cent against cards. As that rail takes share in the UK and Europe, the fee becomes harder to describe as a recovery and easier to describe as a margin — which is exactly the description a regulator or a procurement officer can act on.
Procurement is the de facto price regulator
In the absence of a statutory fee cap, the procurement document does the work. San Bruno’s 2025 request for proposals requires no capital expenditure from the city, funding through end-user transaction fees, full disclosure of user transaction fees, disclosure of any cost to the city for signage, marketing or integration, and a proposed revenue share. That last item is the most significant: it means the authority is not merely tolerating the fee but may become a beneficiary of it, which converts a consumer-protection question into a revenue question and makes the fee much harder to abolish from inside the authority.
Competition law has looked at the market and seen a different one
The Competition and Markets Authority cleared the EasyPark–Flowbird merger on 1 August 2024 without finding a substantial lessening of competition. That outcome is defensible on the market as the CMA framed it — competition in the supply of parking services to asset owners — but the market in which the driver pays USD 0.50 is a different market, and no merger authority has yet examined a fee it did not know existed. The UK’s National Parking Platform is, in effect, a private ordering that does what competition law did not: it makes the app substitutable and puts the fee in front of a rival.
Accessibility law is the constraint most operators underestimate
Every regime above ultimately reduces to a single question the market has not answered: if the machine is removed, what does a driver without a smartphone do? California’s answer is a cash plan, a mailed invoice and a halved fine. Dubai’s answer is to keep the machine, the SMS route and the tariff counter, and to charge nothing for the digital route. The UK’s answer is to keep cash where operators judge it viable and to let the market choose the app. Three different answers, one shared premise: the digital transaction cannot be the only route to compliance.
The instrument that does not exist
Every regime described above governs something adjacent to the fee. Tariff law governs the tariff; payment regulation governs the cost of collection; procurement governs the contract; competition law governs concentration; accessibility law governs the route. Nothing governs the price. There is no fee schedule, no disclosure requirement, no cap and no reference to a cost base in any of the five.
The closest precedent is interchange regulation, where a regulator determined that the cost of a transaction was a published number and set a ceiling against it. Applying that logic here would require three things this market does not currently produce: disclosure of the fee to the authority that grants the concession, a stated cost basis, and a benchmark against which the fee could be judged. Dubai has effectively done all three by setting the fee at zero and letting the tariff carry the cost. California has done the first by requiring bidders in effect to declare their fees and by making the digital-only route conditional. Neither is a template a platform would choose, which is why the industry’s preference for industry-designed interoperability, in the shape of the National Parking Platform, is also its best defence against a worse instrument arriving later.
For participants, the regulatory forecast is therefore not a fee cap. It is a set of conditions — an access route, a disclosure obligation, a privacy assessment and an expiry date — attached to any city that wants to remove the machine. Those conditions cost money to satisfy, they favour suppliers with municipal integration experience, and they are the most likely reason the contract arm of this market grows at 13.35 per cent while the fee arm grows at 7.75 per cent.