
Global graphite mining market Report, Size & Forecast 2026-2033
Global graphite mining market Forecast Snapshot 2026 - 2033
| Metric | Value |
|---|---|
| Base Year (2025) Market Size | 0.84 billion USD |
| Forecast Window | 2026 – 2033 |
| Market Direction | Strong positive |
| Baseline CAGR (2025–2033) | 15.71% |
| Optimistic Scenario CAGR | 18.21% |
| Conservative Scenario CAGR | 13.21% |
| Baseline 2033 Endpoint | 2.69 billion USD |
| Largest Expected Region (by share) | Not supplied – concentration in China excluded from scope |
| Fastest Growing Region | Not supplied – North American projects show fastest ramp in non‑Chinese supply |
| Top-Level Segment (by share) | Battery anode application (demand driver) |
| Fastest Growing Top-Level Segment | Spherical graphite for lithium‑ion battery anodes |
| Key Trends | Export restrictions tightening supply; regulatory delays postponing new production; government investment de‑risking North American projects |
| Future Focus | Non‑Chinese mine development 2028–2030; bio‑graphite alternative post‑2030 |
| Region‑wise Share Split (indicative) | North America: multiple advanced projects; Africa: operational surge (Mozambique) and pause (Madagascar); Europe: pre‑feasibility stage; China: dominant but excluded from supplied data |
Global graphite mining market Overview
The global graphite mining market was valued at approximately USD 0.84 billion in 2025 and is projected to reach USD 2.69 billion by 2033, growing at a baseline CAGR of 15.71% during the forecast period (2026–2033). The market covers natural graphite mining activities, including exploration, extraction, beneficiation, purification, and sizing of flake, amorphous, and spherical graphite. These materials are primarily used in lithium-ion battery anodes, as well as in industrial applications such as steelmaking, lubricants, and refractories. The analysis excludes synthetic graphite, downstream active anode material manufacturing, graphite recycling, and China’s domestic production dynamics. The 2025 market size is based on a single publicly available estimate.Market Drivers & Dynamics
According to Pheonix Research, growth across the Global Graphite Mining Market is primarily fueled by a structural supply shortage of non-Chinese natural graphite. This gap has been triggered by tightening export restrictions that impact roughly 47% of global graphite exports (2022–2024 average, OECD 2026), coupled with ongoing regulatory delays that continue to postpone new production from critical mining projects.
To mitigate these bottlenecks, public sector support—including funding via the U.S. Defense Production Act, Canadian tax credits, and strategic government grants—is helping de-risk developments across North America. However, most of these projects remain in the pre-production phase and remain dependent on securing successful financing.
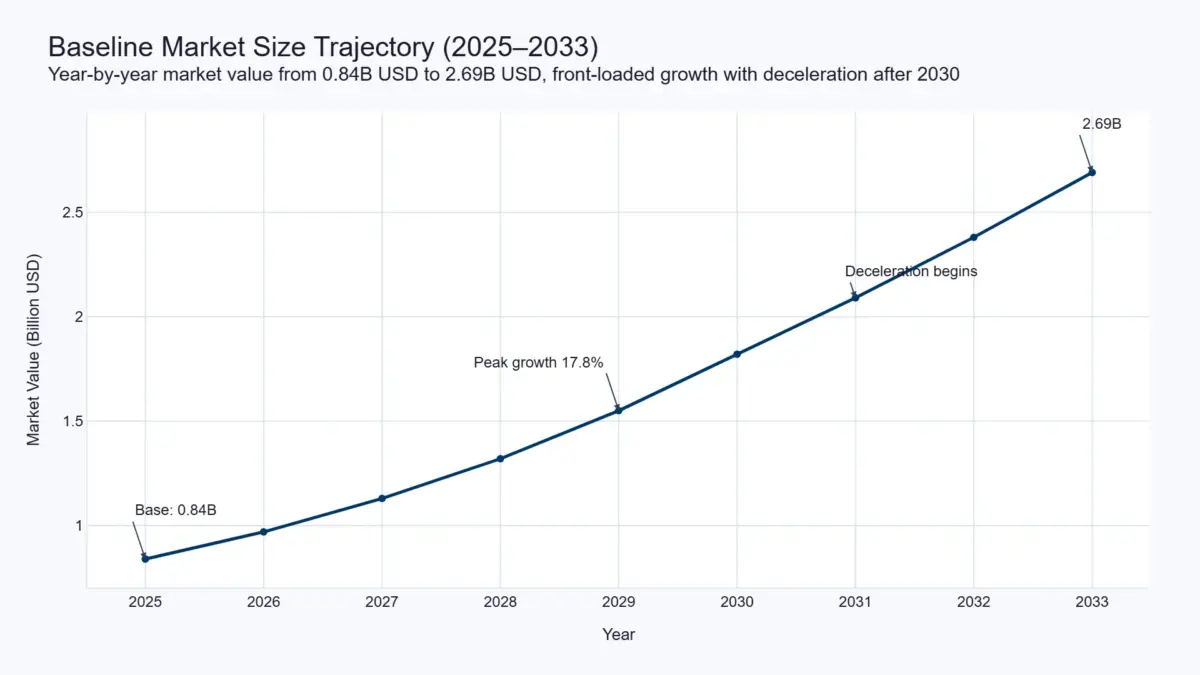
Overall, the market exhibits a distinct front-loaded growth shape, with peak annual increments projected for 2028–2030. This creates a finite, critical window for first-mover advantage before potential disruptions emerge from alternative bio-graphite technologies.
Key Takeaways
- The graphite mining market is forecast to grow from 0.84 billion USD (2025) to 2.69 billion USD (2033) at a baseline CAGR of 15.71%, driven by supply constraints and non‑Chinese project development.
- Export restrictions on graphite—47% of global exports subject to at least one measure in 2022–2024—are tightening supply and raising price expectations, creating a strong positive market direction.
- Regulatory delays (Graphite One Environmental Impact Statement adding at least one year; Mozambique’s new mining law mandating 15% state ownership and local processing) are postponing first production from new sources, sustaining supply‑demand imbalance.
- Government investment (U.S. $37.5M DPA agreement, Canadian C$1.38M grant, 30% clean‑tech tax credits) is de‑risking North American projects, but most remain pre‑production and dependent on financing.
- Growth is front‑loaded with peak annual increments in 2028–2030, favoring developers that achieve production in this window; alternative bio‑graphite from CATL/CarbonScape is a potential disruptor post‑2030.
Global Graphite Mining Market Forecast and Growth Trajectory
The baseline forecast shows the market rising from 0.84 billion USD in 2025 to 2.69 billion USD by 2033. The compound annual growth rate over this eight‑year period is 15.71%. In the optimistic scenario, assuming accelerated investment, successful permitting, and strong demand pull, the CAGR reaches 18.21%. In the conservative scenario, where project delays and financing gaps materialise more severely, the CAGR falls to 13.21%. The table below presents the authoritative year‑by‑year baseline market values and annual growth rates.| Year | Market Value (billion USD) | Annual Growth Rate |
|---|---|---|
| 2025 | 0.84 | — (base year) |
| 2026 | 0.97 | 15.71% |
| 2027 | 1.13 | 16.25% |
| 2028 | 1.32 | 17.10% |
| 2029 | 1.55 | 17.81% |
| 2030 | 1.82 | 16.80% |
| 2031 | 2.09 | 15.26% |
| 2032 | 2.38 | 13.90% |
| 2033 | 2.69 | 12.96% |
Primary Growth Drivers of Global graphite mining market: Supply Constraints and Policy Catalysts
Key Drivers
Export Restrictions on Critical Raw Materials
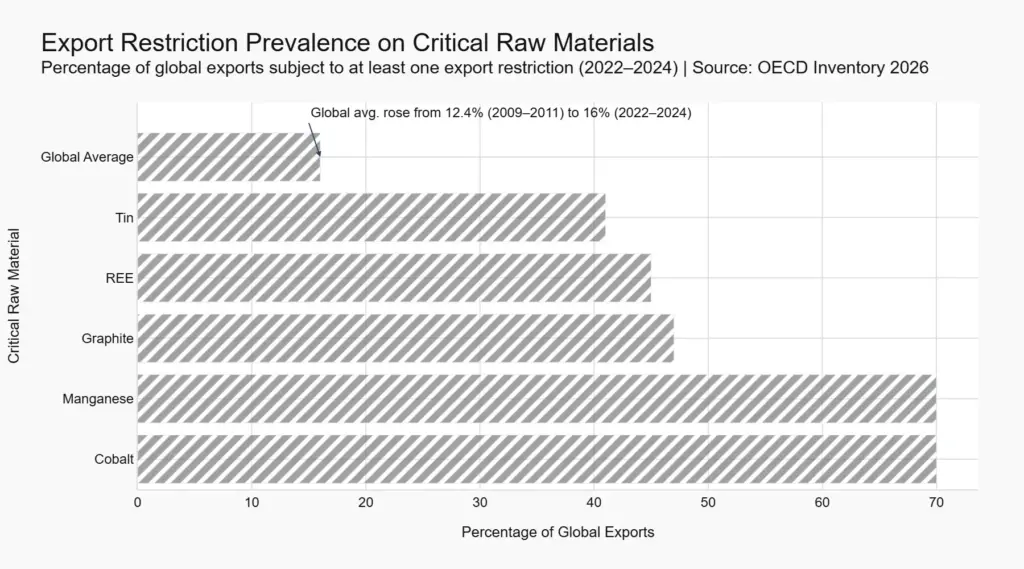
According to the OECD Inventory of Export Restrictions on Critical Raw Materials 2026, an estimated 47% of global graphite exports were subject to at least one export restriction measure over the 2022–2024 period. This is nearly three times the global raw materials average of 16% and far above the average of 12.4% recorded in 2009–2011. The restrictions (licensing, quotas, taxes) tighten the supply of natural graphite available to import‑dependent economies, placing upward pressure on prices and incentivising the development of new mines in non‑restricting jurisdictions. This mechanism is the single most powerful supply‑side catalyst underpinning the forecast.Regulatory Delays in New Mine Development
Regulatory processes are actively delaying first production from non‑Chinese projects. In July 2026, the U.S. Army Corps of Engineers required a full Environmental Impact Statement for Graphite One’s Graphite Creek project, adding at least one year to the permitting timeline and pushing expected completion from 2027 to 2029. In Mozambique, a new mining law signed in June 2026 mandates a minimum 15% non‑dilutable state ownership and a ban on exporting unprocessed minerals unless special approval is granted. These delays reduce the pace of new supply coming online, sustaining the current deficit and supporting market value growth.Government Investment and De‑Risking
Public sector funding is accelerating project feasibility and reducing capital risk. Graphite One secured a $37.5 million Defense Production Act Title III agreement. Focus Graphite received a C$1,378,700 grant from Natural Resources Canada under the First and Last Mile Fund. Canadian clean‑technology tax credits of up to 30% reduce effective capital expenditure for qualifying projects. These catalysts improve project economics and shorten development timelines, but most remain pre‑production and require future financing.Restraints
Project Execution and Financing Risks
Despite strong government support, nearly all non‑Chinese graphite projects are at pre‑feasibility or feasibility stage. Nouveau Monde Graphite raised ~$309.5M in equity in 2026, but the funds are earmarked for phased development and deployment remains conditional on milestones. Northern Graphite’s Okanjande restart is targeted for late 2027 but is subject to financing. The high capital requirements ($346.3M for Lac Carheil alone) and reliance on future equity or debt markets introduce execution risk that could push projects beyond the 2028–2030 peak window.Occupational Health Legacy
Historical cohort data from a Sri Lankan graphite mine (1987–1993) documented an average latency of 22.6 years before diagnosis of graphite pneumoconiosis. While modern dust controls reduce incidence, the long‑tail liability may deter investor appetite and increase insurance costs for new operations, particularly in jurisdictions with strict occupational health regulations.Opportunities
First‑Mover Advantage in the 2028–2030 Window
The front‑loaded growth profile means that developers achieving production between 2028 and 2030 will capture the highest annual market increments. Projects such as Graphite One (aiming for 2029 after the EIS delay) and Nouveau Monde (Phase 2 planning) are well positioned if they can secure final financing and permitting.Vertical Integration into Anode Manufacturing
Companies that integrate mining with active anode material production, such as Syrah Resources (Vidalia facility targeting 45 ktpa by 2029) and Nouveau Monde (44,100 tpa AAM), can capture higher margin and secure offtake agreements with battery manufacturers. This strategy de‑risks demand and creates competitive moats.Threats
Bio‑Graphite as a Disruptive Alternative
In July 2026, CATL (the world’s largest battery manufacturer) and Lochpine Capital took a 20% stake in CarbonScape, a company converting forestry byproducts into battery‑grade graphite. While no performance data was disclosed, the investment signals that non‑mining supply routes could erode demand for natural graphite mining post‑2030, especially if they achieve cost parity.Sovereign Risk in African Producing Countries
Mozambique’s new mining law retroactivity is uncertain, and sovereign debt pressures (U.S. DFC converting a $31M loan to equity in Syrah’s Balama mine) combined with energy price disputes (Mozal aluminium curtailment) create an unstable operating environment. Madagascar’s Vatomina mine paused production in mid‑2026 for optimisation, highlighting operational fragility in the region.Global Graphite mining market Segmentation
- by Product Type
- Flake Graphite
- Large Flake Graphite
- Medium Flake Graphite
- Fine Flake Graphite
- Microcrystalline Flake Graphite
- Amorphous Graphite
- High Carbon Amorphous Graphite
- Medium Carbon Amorphous Graphite
- Low Carbon Amorphous Graphite
- Industrial Grade Amorphous Graphite
- Spherical Graphite
- Battery Grade Spherical Graphite
- Purified Spherical Graphite
- Coated Spherical Graphite
- Ultra-High Purity Spherical Graphite
- Flake Graphite
- by Application
- Battery Anodes
- Electric Vehicle Batteries
- Energy Storage Systems
- Consumer Electronics Batteries
- Industrial Batteries
- Steel Industry
- Electric Arc Furnaces
- Foundry Applications
- Metallurgical Processing
- Ferroalloy Production
- Lubricants
- Industrial Lubricants
- Automotive Lubricants
- High Temperature Lubricants
- Specialty Lubricants
- Refractories
- Steel Refractories
- Furnace Linings
- High Temperature Components
- Industrial Refractory Products
- Battery Anodes
- by Mining Method
- Open-Pit Mining
- Underground Mining
- Surface Mining
- Integrated Mining & Beneficiation
- .by End User
- Battery Material Manufacturers
- Steel Manufacturers
- Industrial Material Producers
- Chemical & Specialty Material Manufacturers
Regional Insights
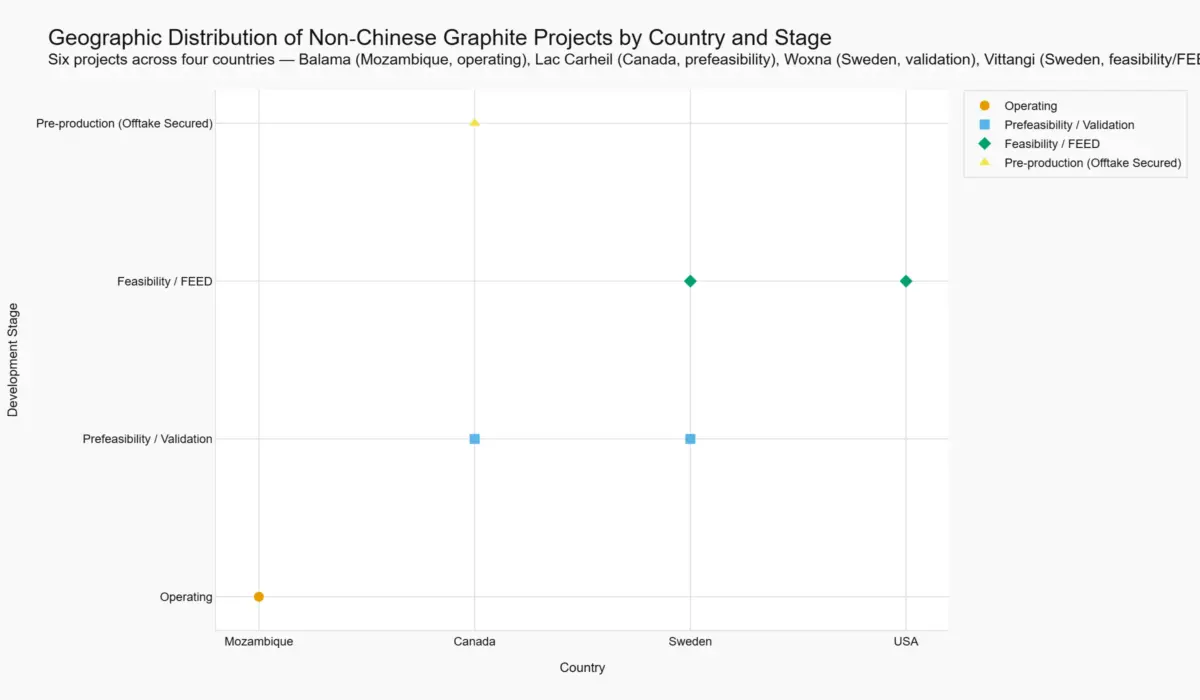
North America is the most dynamic region for non-Chinese graphite development. Projects in Quebec (Lac Carheil, Matawinie), Alaska (Graphite Creek), New York (Kilbourne), and Ohio (Graphite One anode facility) are advancing through feasibility and permitting. Canadian tax credits of up to 30% and U.S. DPA funding are strategic advantages. However, regulatory delays (Graphite One EIS) are pushing first production toward 2029.
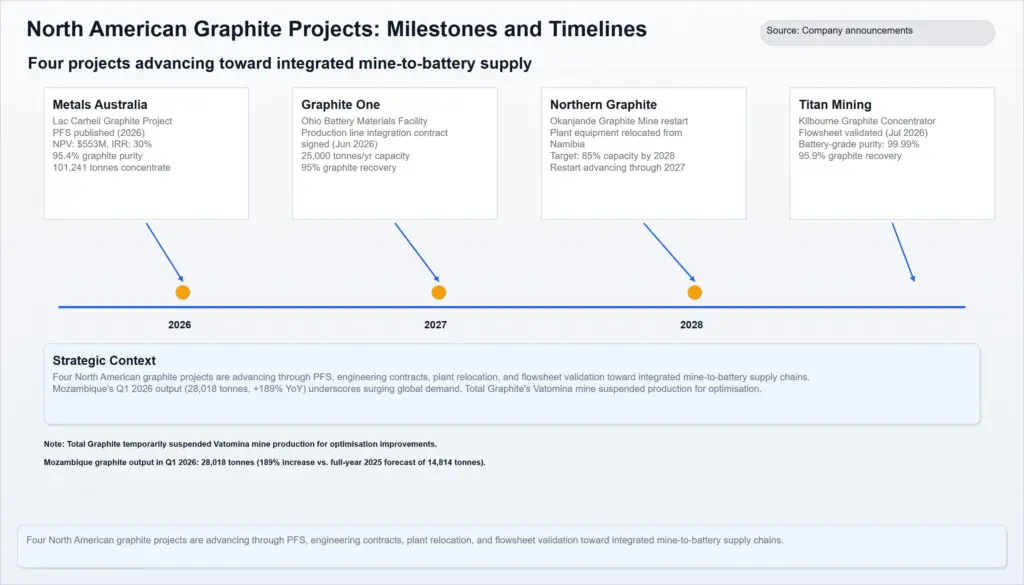
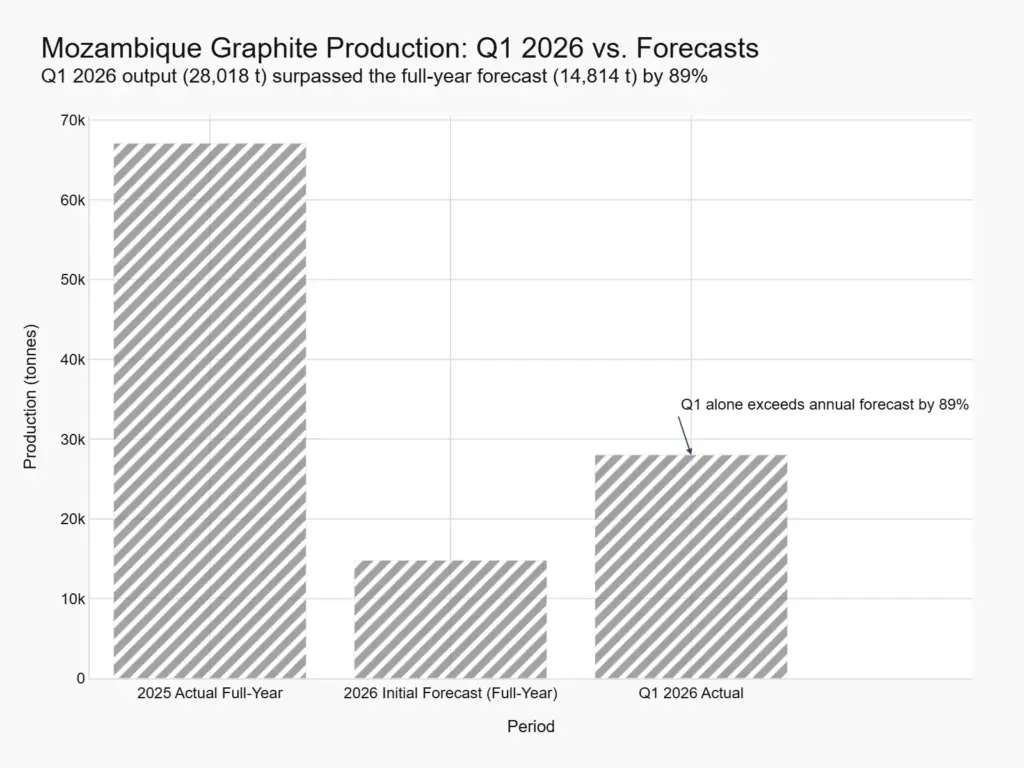
Africa presents a mixed picture. Mozambique’s graphite output surged to 28,018 tonnes in Q1 2026 (189% of the initial full-year government forecast), driven by operational consistency and a new entrant. Conversely, Total Graphite paused the Vatomina mine in Madagascar for optimisation, targeting a restart above 1,000 tonnes per month from December 2026. Sovereign risk, power crises, and new mining laws (Mozambique’s 15% state ownership) temper the region’s potential.
Europe hosts two Swedish projects: Talga’s Vittangi Anode Project (FEED stage) and Leading Edge Materials’ Woxna mine (purification validation at 99.96% purity). Both target the European battery anode chain but are at earlier stages than their North American counterparts.
No quantitative regional market shares are available, but North America and Europe are the primary new-supply frontiers, while Africa remains a swing producer.Leading Companies in the Global graphite mining market
-
Why the Market Is Moving Upward: Supply Constraints and Policy Momentum
The strong positive outlook for the graphite mining market is largely being driven by supply-side pressures. With 47% of global graphite exports subject to export restrictions, the amount of material available to import-dependent markets is becoming more limited. This is pushing battery anode manufacturers and steel producers to look for reliable non-Chinese sources. At the same time, regulatory delays are slowing the development of new mines that could help address the shortage. Together, these factors are creating a supply-demand imbalance that is supporting market value growth, even though physical volumes may remain constrained in the near term.
Government support is helping reduce some of the risks associated with developing new projects. Grants, tax credits, and military-related support can improve project feasibility and reduce capital requirements, but they do not remove the need for additional financing. The market is expected to see its strongest annual increases between 2028 and 2030 as several projects move from feasibility and permitting into construction and production. Developers that successfully bring projects online during this period could benefit from the strongest market conditions. After 2030, growth is expected to moderate as the first wave of projects matures and alternative supply options, including bio-graphite and silicon anodes, become more relevant. Continued investment will therefore remain important, as the market outlook depends on turning planned projects into operating mines before alternative technologies begin to reduce demand for natural graphite.Key Analytical Insights
- The front‑loaded growth shape is consistent across all three scenarios: the 2028–2030 period is decisive. Any project that fails to achieve production within this window will lose the benefit of the highest market increments.
- Export restrictions (47%) are the single most powerful driver, but their effect is conditional on projects actually overcoming permitting and financing hurdles. The market value growth is not purely volume‑driven but also price‑supported.
- Government funding is a necessary but not sufficient condition. Most developers still require additional equity or debt; the gap between government de‑risking and full financial closure represents a key fragility in the forecast.
- The absence of a detailed Chinese supply model and the reliance on a single‑source base year estimate are material limitations. The forecast should be updated as official production data and demand‑side metrics become available.
Table of Contents
1. Executive Summary
1.1 Market Snapshot (2026–2033)
1.2 Key Market Highlights
1.3 Forecast Assumptions & Scenario Overview
1.4 Demand-Supply Overview
1.5 Analyst Viewpoint
2. Market Overview
2.1 Introduction to the Global Graphite Mining Market
2.2 Market Definition & Scope
2.3 Industry Value Chain Analysis
2.4 Market Evolution & Historical Trends
2.5 Supply Chain Structure
2.6 Export Restrictions, Non-Chinese Supply Development & Battery Anode Demand
3. Global Graphite Mining Market Forecast Snapshot (USD Billion), 2025–2033
3.1 Base Year Market Size (2025)
3.2 Baseline Market Forecast (2033)
3.3 CAGR (2025–2033)
3.4 Market Direction
3.5 Largest Expected Region
3.6 Fastest Growing Region
3.7 Largest Segment
3.8 Fastest Growing Segment
3.9 Key Trends
3.10 Future Outlook
4. Market Forecast Scenario Analysis
4.1 Baseline Forecast Scenario
4.2 Optimistic Forecast Scenario
4.3 Conservative Forecast Scenario
4.4 Year-by-Year Market Forecast (2025–2033)
4.5 Growth Shape Analysis
4.6 Annual Growth Rate Analysis
4.7 Scenario Comparison & Market Implications
5. Market Dynamics
5.1 Drivers
5.1.1 Export Restrictions on Critical Raw Materials
5.1.2 Regulatory Delays Supporting Supply Deficit
5.1.3 Government Investment & Project De-Risking
5.2 Restraints
5.2.1 Project Execution & Financing Risks
5.2.2 Occupational Health Legacy
5.3 Opportunities
5.3.1 First-Mover Advantage (2028–2030)
5.3.2 Vertical Integration into Anode Manufacturing
5.4 Threats
5.4.1 Bio-Graphite as a Disruptive Alternative
5.4.2 Sovereign Risk in African Producing Countries
6. Market Segmentation by Product Type (USD Billion), 2025–2033
6.1 Flake Graphite
6.1.1 Large Flake Graphite
6.1.2 Medium Flake Graphite
6.1.3 Fine Flake Graphite
6.1.4 Microcrystalline Flake Graphite
6.2 Amorphous Graphite
6.2.1 High Carbon Amorphous Graphite
6.2.2 Medium Carbon Amorphous Graphite
6.2.3 Low Carbon Amorphous Graphite
6.2.4 Industrial Grade Amorphous Graphite
6.3 Spherical Graphite
6.3.1 Battery Grade Spherical Graphite
6.3.2 Purified Spherical Graphite
6.3.3 Coated Spherical Graphite
6.3.4 Ultra-High Purity Spherical Graphite
7. Market Segmentation by Application (USD Billion), 2025–2033
7.1 Battery Anodes
7.1.1 Electric Vehicle Batteries
7.1.2 Energy Storage Systems
7.1.3 Consumer Electronics Batteries
7.1.4 Industrial Batteries
7.2 Steel Industry
7.2.1 Electric Arc Furnaces
7.2.2 Foundry Applications
7.2.3 Metallurgical Processing
7.2.4 Ferroalloy Production
7.3 Lubricants
7.3.1 Industrial Lubricants
7.3.2 Automotive Lubricants
7.3.3 High Temperature Lubricants
7.3.4 Specialty Lubricants
7.4 Refractories
7.4.1 Steel Refractories
7.4.2 Furnace Linings
7.4.3 High Temperature Components
7.4.4 Industrial Refractory Products
8. Market Segmentation by Mining Method (USD Billion), 2025–2033
8.1 Open-Pit Mining
8.2 Underground Mining
8.3 Surface Mining
8.4 Integrated Mining & Beneficiation
9. Market Segmentation by End User (USD Billion), 2025–2033
9.1 Battery Material Manufacturers
9.2 Steel Manufacturers
9.3 Industrial Material Producers
9.4 Chemical & Specialty Material Manufacturers
10. Regional Market Analysis
10.1 North America
10.2 Europe
10.3 Africa
10.4 China (Market Context)
11. Regional Insights
11.1 North America – Fastest Growing Non-Chinese Supply Region
11.2 Africa – Operational Expansion & Sovereign Risk
11.3 Europe – Emerging Battery Anode Supply Chain
11.4 China – Export Restrictions & Global Market Influence
12. Supply Chain & Investment Analysis
12.1 Global Non-Chinese Mine Development Pipeline
12.2 Project Development Timeline (2025–2033)
12.3 Export Restriction Impact Analysis
12.4 Government Funding & Tax Incentives
12.5 Financing Risk Assessment
12.6 Battery Anode Supply Chain Development
13. Competitive Landscape
13.1 Market Structure Analysis
13.2 Competitive Positioning Matrix
13.3 Geographic Distribution of Non-Chinese Projects
13.4 Strategic Developments
13.5 Investment & Financing Activities
14. Company Profiles
14.1 Nouveau Monde Graphite
14.2 Graphite One
14.3 Syrah Resources
14.4 Talga Group
14.5 Metals Australia
14.6 Leading Edge Materials
14.7 Northern Graphite
14.8 Total Graphite
15. Strategic Intelligence & AI-Driven Insights
15.1 Pheonix Forecast Intelligence Engine
15.2 Export Restriction Intelligence Dashboard
15.3 Battery Material Supply Intelligence
15.4 Mine Development Risk Monitor
15.5 Investment Opportunity Intelligence
16. Investment & Growth Opportunities
16.1 North American Mine Development
16.2 Battery Anode Supply Chain Expansion
16.3 Vertical Integration Opportunities
16.4 Government Incentive Programs
16.5 Sustainable Graphite Processing
17. Why the Global Graphite Mining Market Remains Critical
17.1 Battery Supply Chain Security
17.2 Export Restriction Driven Supply Gap
17.3 Government Support for Critical Minerals
17.4 Strategic Importance of Non-Chinese Supply
17.5 Long-Term Growth in Electric Mobility
18. Key Analytical Insights
18.1 Front-Loaded Growth Window Analysis
18.2 Export Restriction Impact Assessment
18.3 Government Funding Effectiveness
18.4 Forecast Assumptions & Limitations
19. Methodology & Research Approach
19.1 Research Methodology
19.2 Forecast Modeling Framework
19.3 Data Sources
19.4 Assumptions & Limitations
20. About Pheonix Research
21. Disclaimer
Competitive Landscape
Global Graphite mining market Competitive Landscape
Key Takeaways
- At least five companies — Talga Group, Leading Edge Materials, Metals Australia, Nouveau Monde Graphite, and Graphite One — are advancing graphite projects in Sweden, Canada, and the United States, all targeting the battery anode supply chain.
- Vertical integration from mining through to active anode material production is a dominant strategy for Western juniors seeking to capture value and secure long-term offtake.
- An alternative production pathway — CATL-backed bio-graphite from forestry byproducts — introduces a potential disruptive technology that could reduce dependence on traditional mining.
- Government support, particularly U.S. Defense Production Act Title III funding, is a key competitive differentiator affecting project timelines and capital costs.
- Offtake agreements predominantly involve non-Chinese battery manufacturers, reflecting supply chain diversification away from China.
Market Structure and Strategic Positioning
The competitive landscape for non-Chinese graphite mining can be segmented by geography, stage of development, and end-market focus. These factors directly influence competitive advantage through access to capital, policy support, and customer relationships. The supplied evidence covers projects in Sweden, Canada, the United States, Mozambique, and Australia, with each project at a distinct stage — from operating mines to prefeasibility studies and Front‑End Engineering Design (FEED).
Sweden: Two Projects Targeting the European Anode Chain
In Sweden, both Talga Group and Leading Edge Materials are developing graphite projects that target the European battery anode supply chain. Talga’s Vittangi Anode Project is advancing through FEED, with record anode volume output from its EVA plant and 21 active customer qualification programs in premium high‑power battery sectors — including AI data centres, battery energy storage systems, defence, robotics, drones, and performance electric vehicles. The company reports strong customer‑backed support for financing discussions with multiple European states and funding agencies.
Leading Edge Materials is advancing its 100 % owned Woxna Graphite Mine and has achieved 99.96 % purity through a two‑stage alkaline process without energy‑intensive pre‑heating. The testwork used historical stockpiled ore that showed signs of oxidation — conditions known to reduce flotation efficiency — suggesting potential for even stronger performance from freshly mined material. The company targets both battery and high‑end industrial applications, with Benchmark Mineral Intelligence forecasting global natural flake graphite demand to more than double by 2035.
North America: Three Projects, Three Development Stages
Metals Australia completed a prefeasibility study (PFS) for its Lac Carheil Graphite Project in Quebec, Canada. The PFS outlines a 24‑year mine life with average annual production of 101,241 tonnes of flake graphite concentrate grading 95.4 % graphitic carbon. The study reports a pre‑tax NPV of AUD 790.8 million, after‑tax NPV of AUD 572.0 million, an IRR of 22 %, and a payback period of 4.2 years. Total capital expenditure is estimated at USD 346.3 million, with potential tax credits reducing effective CAPEX to about USD 249.6 million. The project is supported by a maiden Ore Reserve of 21.51 million tonnes at 11.14 % Cg, reflecting an 86 % conversion from indicated resources.
Nouveau Monde Graphite is developing the Matawinie Mine in Quebec, with planned production of 14,720 tonnes per annum of flake graphite and 44,100 tonnes per annum of active anode material. The active anode material is priced at an average of US$10,106 per tonne over the life of mine, with finished product purity of ≥99.90 % C(t). The company reports a total CAPEX of US$911 million for the integrated project and has secured a 13,000‑tonne‑per‑annum active anode material offtake agreement with Panasonic Energy.
Graphite One is developing its Graphite Creek resource in Alaska and has secured a US$37.5 million Defense Production Act Title III agreement from the U.S. Department of Defense to fast‑track its feasibility study by one year. The company’s supply chain strategy includes mining from Graphite Creek, processing through an advanced material and battery anode manufacturing plant expected to be sited in Washington State, and a co‑located recycling facility — forming a circular economy approach.
Mozambique: The Only Currently Operating Asset
Syrah Resources operates the Balama graphite mine in Mozambique, the only currently producing asset among the covered participants. In Q4 2025, Balama produced 34 kilotonnes at 76 % recovery and 95 % grade. Syrah is vertically integrating into the U.S. through its Vidalia active anode material facility, which at 11.25 kilotonnes per annum in 2024 is targeting 45 kilotonnes per annum by 2029, with a longer‑term target exceeding 100 kilotonnes per annum. The company’s historical investment in Mozambique totals US$580 million.
Competitive Comparison
| Participant | Project / Location | Stage | Product & Capacity | Purity | Key Offtake / Customer | Government Support |
|---|---|---|---|---|---|---|
| Talga Group | Vittangi Anode Project, Sweden | FEED | Talnode®‑C anode; 21 active qualification programs | Not specified | Dainen Materials (LOI, binding term sheet targeted Sep 2026) | Discussions with European states and funding agencies |
| Leading Edge Materials | Woxna Graphite Mine, Sweden | Purification validation | Large‑flake concentrate for battery & industrial applications | 99.96 % C(t) via two‑stage alkaline process | Not yet disclosed | Not specified |
| Metals Australia | Lac Carheil, Quebec, Canada | Prefeasibility (PFS completed) | 101,241 tpa flake graphite concentrate | 95.4 % graphitic carbon | Not yet disclosed | Potential tax credits reducing effective CAPEX to about USD 249.6 M |
| Nouveau Monde Graphite | Matawinie Mine & Bécancour Plant, Quebec, Canada | Pre‑production (Phase 2 planning) | 14,720 tpa flake; 44,100 tpa active anode material | ≥99.90 % C(t) for AAM | Panasonic Energy (13,000 tpa AAM offtake) | Not specified |
| Graphite One | Graphite Creek, Alaska, USA | Feasibility (fast‑tracked) | Integrated mining + anode manufacturing + recycling | Not specified | Not yet disclosed | US$37.5 M DPA Title III agreement |
| Syrah Resources | Balama, Mozambique | Operating | 34 kt (Q4 2025); 95 % grade | 95 % graphitic carbon | POSCO Future M, Westwater, Graphex, BTR Indonesia | Not specified |
Corporate Strategies: Vertical Integration, Technology, and Offtake
Beyond geographic positioning, competitive differentiation is driven by business model choices — particularly the degree of vertical integration, technology pathways for purification, and the structure of offtake agreements. Government funding further shapes which projects can accelerate timelines.
Vertical Integration as a Dominant Strategy
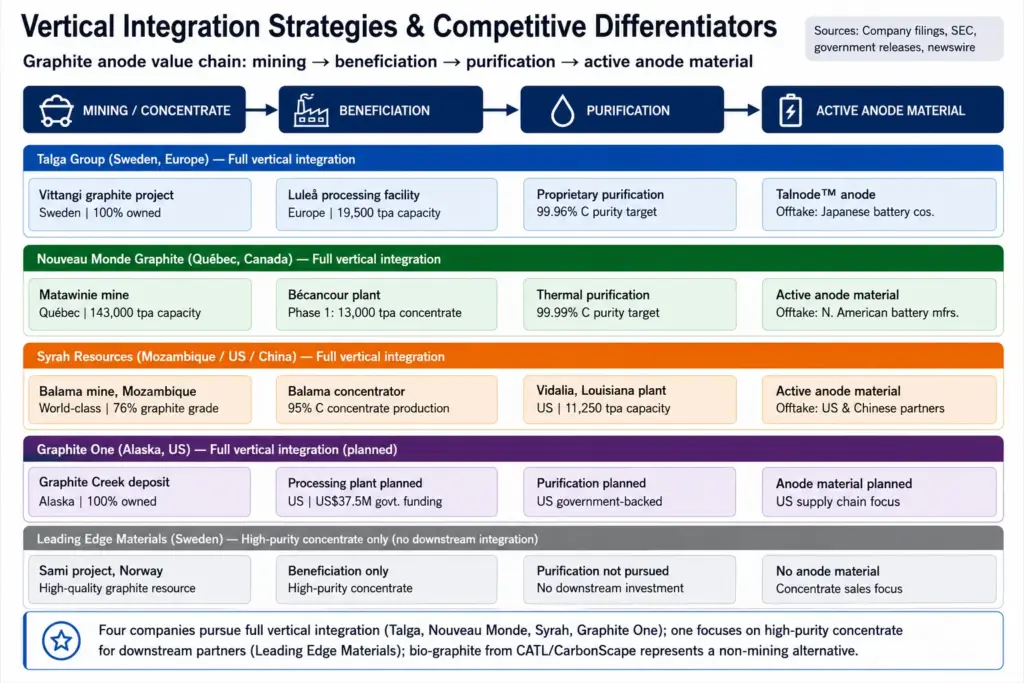
Several companies are pursuing full integration from mine to active anode material, a strategy that captures more value per tonne and strengthens customer relationships. Nouveau Monde Graphite exemplifies this approach: it controls the Matawinie Mine for flake graphite production and is building a dedicated battery material plant in Bécancour, Quebec, to supply Panasonic Energy with 13,000 tonnes per annum of active anode material. The company has acquired a 143,000-square-metre brownfield site adjacent to its greenfield site to accelerate commissioning, using a two-stage approach to optimise costs and reduce time to market. Syrah Resources follows a similar model, with the Balama mine supplying natural graphite to its Vidalia active anode material facility in the United States. Vidalia operated at 11.25 kilotonnes per annum in 2024, with a 2029 target of 45 kilotonnes per annum and a longer-term target exceeding 100 kilotonnes per annum. Syrah has executed offtake agreements with POSCO Future M, Westwater, and Graphex, and reports sales to BTR Indonesia, reflecting an ex-China customer focus.
Graphite One’s strategy encompasses three links: mining at Graphite Creek in Alaska, an advanced materials and battery anode manufacturing plant in Washington State, and a co-located recycling facility, creating a circular economy approach to a complete U.S.-based graphite anode supply chain. Talga Group is vertically integrated through its Vittangi Anode Project in Sweden, with its EVA plant already producing record anode volumes for customer qualification programs. The company has signed a non-binding Letter of Intent with Japanese battery materials firm Dainen Materials for supply of Talnode®-C, with a binding term sheet targeted by September 2026 and a definitive long-term Strategic Anode Offtake Agreement aimed for execution by December 2026.
Technology Pathways
Purification technology represents a key differentiator. Leading Edge Materials achieved 99.96 % purity through a two‑stage alkaline process without energy‑intensive pre‑heating, using historical stockpiled ore — conditions that typically reduce flotation efficiency. The company notes that large‑flake retention from flotation is a key value driver for premium applications. Metals Australia’s PFS for Lac Carheil targets 95.4 % purity at the concentrate stage, positioning the project as a feed source for downstream purification. Nouveau Monde’s active anode material achieves ≥99.90 % purity, and the company’s Phase‑1 facility has already assimilated shaping processes — mechanical transformation that reduces flake size and rounds graphite for battery use — to inform Phase‑2 engineering.
Government Funding as a Competitive Accelerator
Government support is emerging as a decisive factor in project timelines. Graphite One secured a US$37.5 million DPA Title III agreement with the U.S. Department of Defense, using funds appropriated by the Inflation Reduction Act, to fast‑track its feasibility study by one full year. Talga reports strong customer‑backed support for financing discussions with multiple European states and funding agencies, seeking non‑dilutive capital. While not quantified, this policy dimension favours projects in jurisdictions with explicit critical‑minerals strategies.
Offtake Patterns: Diversification Away from China
The offtake landscape shows a clear pattern: agreements are predominantly with non‑Chinese battery manufacturers and materials companies. Nouveau Monde’s offtake with Panasonic Energy, Talga’s LOI with Dainen Materials, and Syrah’s agreements with POSCO Future M, Westwater, Graphex, and BTR Indonesia all reflect supply chain diversification. Syrah explicitly reports engagement with nine ex‑China active anode material customers.
Emerging Competitive Threat: Bio‑Graphite
An alternative production route is emerging through CATL’s investment in CarbonScape, announced in July 2026. CarbonScape converts forestry byproducts into battery‑grade graphite, offering a pathway that does not require traditional mining. While the supplied evidence does not specify production volumes or purity, CATL — the world’s largest EV battery manufacturer — backing this technology signals a potential disruptive shift that could alter competitive dynamics for mining‑based projects.
Illustrate the competitive strategies of key players through the value chain: mining → beneficiation → purification → active anode material production, with callouts for offtake partners and government funding. Supplied company announcements, SEC filings, government releases, and newswire reports covering Talga, Nouveau Monde, Syrah, Graphite One, and Leading Edge Materials. Four companies pursue full vertical integration (Talga, Nouveau Monde, Syrah, Graphite One); one focuses on high‑purity concentrate for downstream partners (Leading Edge Materials); bio‑graphite from CATL/CarbonScape represents a non‑mining alternative.
Value Chain
Graphite mining value chain: convergence of North American development and African production shifts
The graphite mining value chain covers exploration, feasibility studies, mine development, extraction, beneficiation through concentration and flotation, purification, and size classification before graphite reaches battery anode, steelmaking, lubricant, and other industrial markets. In 2026, the supply chain is showing a clear regional split. North American projects are making progress on integrated mine-to-battery supply chains through stronger project economics and engineering milestones, while African operations are seeing both sharp production increases and temporary production pauses. These developments are changing the near-term global supply landscape. The sections below follow the supported stages of the value chain using company announcements and government data from mid-2026.
North American project development accelerates
Several North American–linked graphite projects have passed critical technical and economic milestones, moving from planning into implementation phases. These projects collectively de-risk the upstream and midstream stages of the graphite value chain—exploration, ore reserve definition, concentrator design, and purification—positioning them to supply the growing North American battery anode market.
| Project | Participant | Activity | Geography | Key metrics | Status |
|---|---|---|---|---|---|
| Lac Carheil | Metals Australia | Prefeasibility study (PFS) for open-cut mine and flake graphite concentrate plant | Quebec, Canada | NPV $790.8M AUD ($553M USD); IRR 22%; annual production 101,241 t at 95.4% Cg; mine life 24 years; maiden ore reserve 21.51 Mt at 11.14% Cg | PFS completed; advancing to final feasibility; qualifies for 30% Canadian clean-tech tax credits (effective capex $249.6M USD) |
| Ohio advanced graphite materials facility | Graphite One | Production line integration contract signed with global engineering provider | Ohio, USA | Engineering & integration for procurement and installation of manufacturing equipment | Execution milestone; subject to project financing |
| Okanjande mine restart | Northern Graphite | Processing plant relocated 85 km from Okorusu to Okanjande | Namibia (operated by Canadian company) | Relocation completed safely and on schedule; plant reassembly in progress; targeted restart late 2027 | Relocation milestone achieved; restart subject to financing |
| Kilbourne Graphite Project | Titan Mining | Concentrator flowsheet validation and purification testing | New York, USA | Locked-cycle testing: 95.9% C(t) concentrate at 91.4% recovery; purification produced ≥99.90% Fixed Carbon | Flowsheet validated, exceeding PEA design basis; supporting Feasibility Study |
Metals Australia’s Lac Carheil PFS, published in June 2026, confirmed a pre-tax NPV of $790.8M AUD ($553M USD) and a 22% internal rate of return, with annual production of 101,241 tonnes of flake graphite grading 95.4% graphitic carbon over 24 years. The project’s maiden ore reserve of 21.51 million tonnes at 11.14% graphitic carbon represents an 86% conversion of indicated resources. The project qualifies for Canada’s clean technology manufacturing investment tax credits of up to 30%, which could reduce effective capital costs to $249.6M USD. Separately, Graphite One engaged a global engineering provider in June 2026 for production line integration at its planned Ohio advanced graphite materials facility, a step that moves the project into detailed engineering. Northern Graphite completed the 85 km relocation of processing equipment from the former Okorusu site to the Okanjande mine in Namibia on schedule, targeting a restart of mining and processing operations by late 2027, subject to financing. Titan Mining validated the Kilbourne concentrator flowsheet in July 2026: locked-cycle testing produced a 95.9% carbon concentrate at 91.4% recovery, exceeding the PEA design basis, and subsequent purification yielded ≥99.90% fixed carbon, confirming battery-grade capability. These results support the ongoing Kilbourne Feasibility Study and Titan’s plan to build what it describes as the first fully integrated U.S. graphite supply chain in over 70 years.
African production: surge and suspension
Investment Activity
Investment: Global Graphite mining market
Public Sector as Investment Catalyst
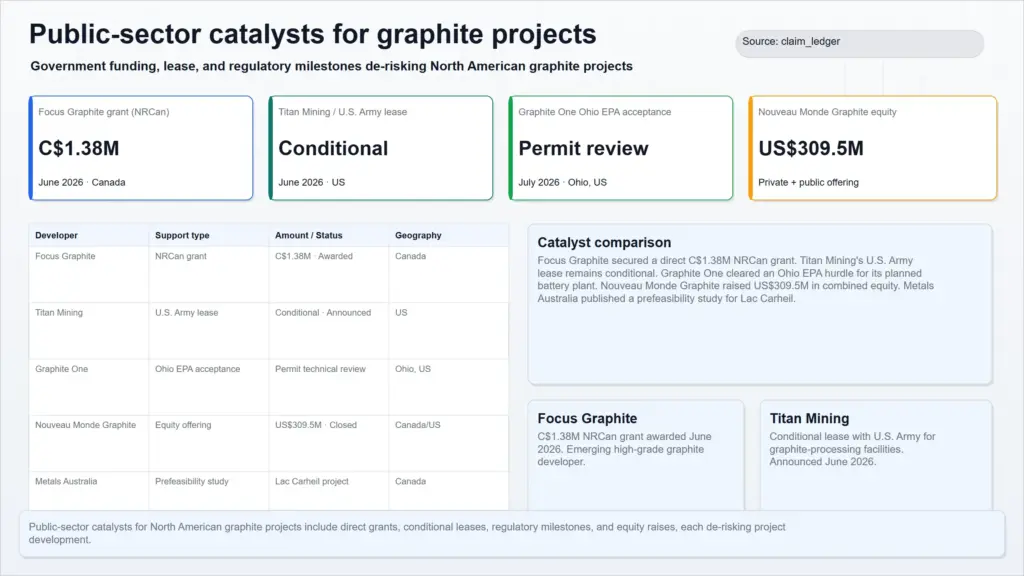
Government funding, strategic leases, and regulatory approvals are shaping the risk profile of early-stage graphite projects in North America. Focus Graphite secured up to C$1,378,700 under Natural Resources Canada’s First and Last Mile Fund to advance road and power infrastructure planning for its Lac Knife project in Quebec. The non-repayable contribution is part of the C$3.6 billion Critical Minerals Investment Package announced at PDAC 2026.
Titan Mining’s subsidiary Empire State Mines received conditional U.S. Army selection notices for enhanced-use leases at two U.S. sites to develop graphite-processing capacity. The partnership, announced in June 2026, allows Titan to build facilities on military land, reducing site acquisition and permitting risk.
Graphite One cleared a key permitting milestone in July 2026 when the Ohio EPA accepted its air permit application as complete and commenced technical review for the planned Active Anode Materials facility in Conneaut, Ohio. The facility is designed for initial production of 10,000 tonnes per year, with expansion to 25,000 tonnes per year.
| Project / Company | Funding Type | Amount / Value | Status | Jurisdiction |
|---|---|---|---|---|
| Focus Graphite – Lac Knife | NRCan First and Last Mile Fund grant | C$1,378,700 | Executed Contribution Agreement | Canada (Quebec) |
| Titan Mining – Empire State Mines | U.S. Army enhanced-use lease | Not disclosed | Conditional selection notices | USA (two sites) |
| Graphite One – Conneaut AAM facility | Ohio EPA air permit acceptance | Not applicable (regulatory) | Technical review commenced | USA (Ohio) |
Corporate Financing and Project Execution
Graphite developers are raising capital and advancing engineering milestones, though most remain dependent on future financing. Nouveau Monde Graphite (NMG) closed a US$213 million private placement in May 2026 with Canada Growth Fund, Investissement Québec, and ENI at US$1.84 per share, and a separate US$96.5 million public offering of subscription receipts in April 2026, for combined gross proceeds of approximately US$309.5 million. The funds are earmarked for the phased development of the Matawinie Mine.
Graphite One engaged a leading global engineering firm in June 2026 for production line integration services at its planned Ohio battery materials facility, a step that reduces execution risk, though the contract is explicitly subject to project financing. In July 2026, the company also achieved the Ohio EPA air permit acceptance noted above.
Northern Graphite completed the relocation of processing plant equipment from the former Okorusu site to the Okanjande mine in Namibia, a distance of approximately 85 km. The move was based on a 2023 preliminary economic assessment that confirmed the technical and economic viability of this approach. The company targets a production restart at Okanjande in late 2027, subject to financing, and plans to supply a joint venture anode facility in Yanbu, Saudi Arabia, targeting initial production in 2028.
Technology Diversification and Alternative Feedstocks
Beyond conventional mining, investment is flowing into bio-based graphite. CATL, the world’s largest EV battery manufacturer, and Lochpine Capital took a combined 20% stake in CarbonScape Ltd., a New Zealand company that converts forestry byproducts into battery-grade graphite. The deal includes plans to test CarbonScape’s technology at CATL demonstration facilities in China and target commercial production by the end of the decade.
The investment responds to projected demand growth: Benchmark Mineral Intelligence expects the rest of the world to face deficits of both natural and synthetic graphite until at least 2031, and CarbonScape notes that more than 75% of current battery graphite comes from oil-based feedstock. While the investment amount was not disclosed, the involvement of CATL provides a potential pathway to scale and may validate alternative graphite production routes for the battery supply chain.
Project Economics and Feasibility Benchmarks
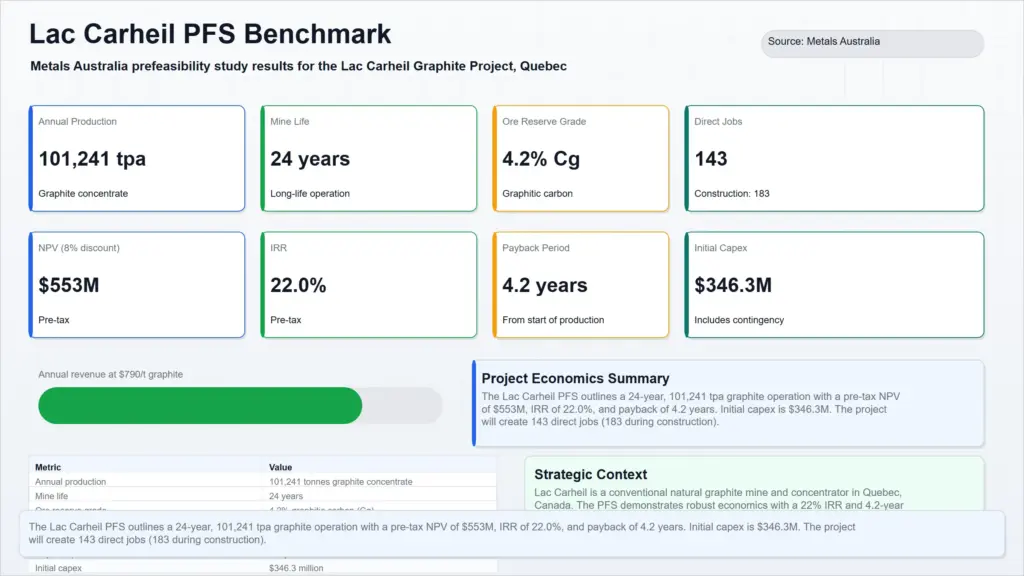
Metals Australia reported prefeasibility study (PFS) results for its Lac Carheil Graphite Project in Quebec in July 2026. The upstream mine and flake graphite concentrate plant is designed to produce 101,241 tonnes per year of high‑purity graphite concentrates over a 24-year project life. The study reports a pre‑tax net present value of US$553 million at an 8% discount rate, a 22.0% internal rate of return, and a payback period of 4.2 years. The project is underpinned by a maiden ore reserve of 21.51 million tonnes grading 11.14% Cg, containing approximately 2.4 million tonnes of graphite. Capital expenditure is estimated at US$346.3 million. The project will create 143 full‑time jobs from 2030, increasing to 183 over the mine life. These metrics provide a financial benchmark for Quebec graphite projects, though the capital requirement is substantial and the project remains at the pre‑feasibility stage, with a final feasibility study yet to be completed.
| Metric | Value |
|---|---|
| Annual production | 101,241 tonnes high‑purity graphite concentrates |
| Project life | 24 years |
| Ore reserve grade | 21.51 Mt @ 11.14% Cg (2.4 Mt contained graphite) |
| Pre‑tax NPV (8% discount) | US$553 million |
| IRR | 22.0% |
| Payback period | 4.2 years |
| Capital expenditure | US$346.3 million |
| Jobs (ramp‑up to steady state) | 143 (2030) to 183 (steady state) |
Technology & Innovation
Technology Developments in Graphite Processing: 2026 Milestones
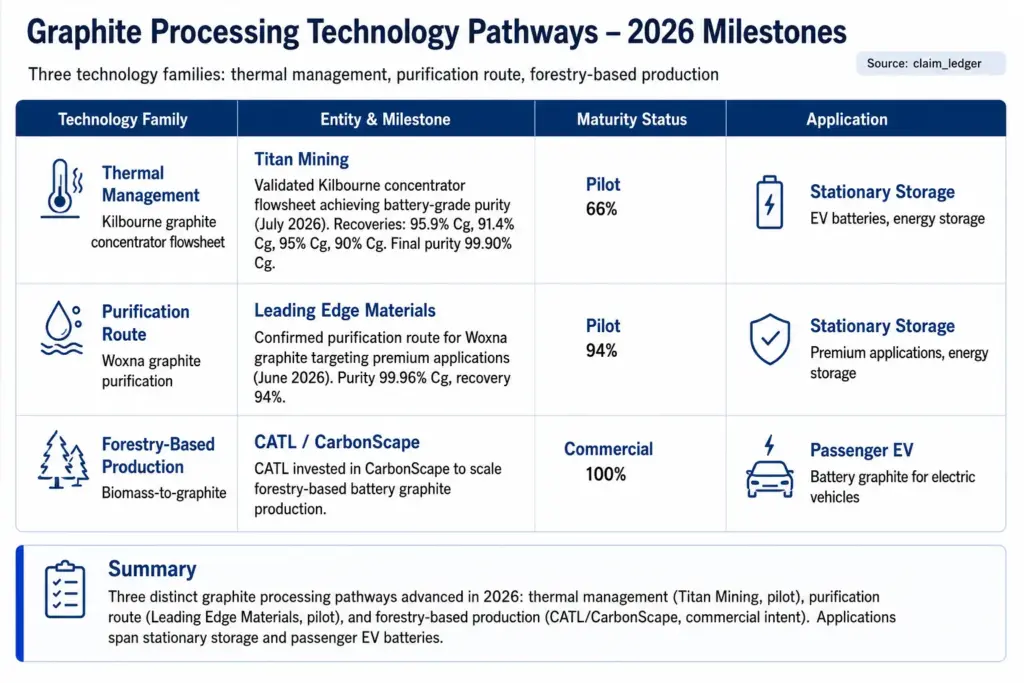
In 2026, three separate technology developments show how graphite processing is moving closer to battery-grade requirements. Titan Mining has validated its concentrator flowsheet, Leading Edge Materials has confirmed its purification route, and CATL has invested in forestry-based graphite. Together, these developments help reduce technical uncertainty across mine-to-battery supply chains while opening up additional sourcing options for electric vehicle and energy storage applications.
Key Takeaways
- Titan Mining’s Kilbourne validation proves that a fully integrated US graphite supply chain—from mine to battery-grade spherical graphite—is technically feasible. Concentrator performance exceeded its Preliminary Economic Assessment (PEA) design.
- Leading Edge Materials’ Woxna testwork demonstrates that a large-flake concentrate combined with a simple two-stage alkaline purification can achieve ≥99.96% purity, positioning the project for premium battery and industrial applications despite using oxidized stockpiled material.
- CATL’s investment in CarbonScape indicates that bio-based graphite is gaining credibility as a complementary supply source, potentially reducing dependence on traditional mining and offering an alternative route to commercial scale.
- All three announcements occurred between June and July 2026, signaling an acceleration in processing technology readiness within the graphite mining sector.
Advancements in Graphite Concentration and Purification
Two independently reported projects have de-risked the processing steps necessary to produce battery-grade graphite from conventional mining. Titan Mining’s Kilbourne project in the United States and Leading Edge Materials’ Woxna project in Sweden each validated key process stages, with implications for regional supply chain viability and downstream off-take.
Titan Mining: Kilbourne Concentrator Flowsheet Validation
In July 2026, Titan Mining announced positive results across its full graphite processing chain for the Kilbourne Graphite Project. Locked-cycle testing produced a graphite concentrate of 95.9% total carbon (C(t)) at 91.4% recovery. These figures exceed the PEA design assumptions of 95% concentrate grade and 90% recovery. The company also confirmed its preferred commercial purification process, which consistently yields battery-grade purified graphite with ≥99.90% fixed carbon. Titan stated that these results de-risk the ongoing Feasibility Study and support its plan to build the first fully integrated US graphite supply chain in over 70 years. Downstream pilot-stage yields were reported as above industry average, though no specific yield percentage was supplied for that stage.
Leading Edge Materials: Woxna Purification Route Confirmation
In June 2026, Leading Edge Materials reported testwork on ore from its 100%-owned Woxna Graphite Mine. Flotation testwork produced a high-grade concentrate with 94% carbon purity, retaining more than half of all particles as large flakes—an important indicator for premium graphite applications. A simple, industrially practical two-stage alkaline process (without an energy-intensive pre-heating step) achieved 99.96% loss on ignition (LOI), making it the preferred route for commercial scale-up. The testwork was conducted on historical stockpiled material that showed signs of oxidation, which is known to reduce flotation performance. The company expects fresh ore to perform better, implying further upside in concentrate grade and recovery.
| Technology / Participant | Concentrate Grade (C(t) or carbon) | Recovery | Purification Method | Final Purity | Notes on Commercial Readiness |
|---|---|---|---|---|---|
| Titan Mining – Kilbourne concentrator flowsheet | 95.9% C(t) | 91.4% | Preferred purification process (method not specified in source) | ≥99.90% fixed carbon | Exceeded PEA design basis; Feasibility Study ongoing; first integrated US graphite supply chain targeted |
| Leading Edge Materials – Woxna graphite | 94% carbon purity | Data not provided | Two-stage alkaline process (no pre-heating step) | 99.96% LOI (loss on ignition) | Testwork on oxidized stockpiled material; fresh ore expected to perform better; preferred scale-up route identified |
Both projects confirm that concentration and purification can achieve battery-grade specifications, though at different stages of maturity. Titan’s results include integrated concentrator and downstream performance, while Leading Edge’s work focuses on purification from flotation concentrate. The absence of recovery data for the Woxna flotation stage limits direct comparison, but the high LOI purity and large-flake retention indicate suitability for premium applications. These achievements strengthen the feasibility of building regional graphite supply chains in North America and Europe.
Investment in Forestry-Based Graphite as a Complementary Supply Route
In July 2026, Contemporary Amperex Technology Co. Ltd. (CATL), the world’s largest EV battery manufacturer, invested in New Zealand–headquartered CarbonScape Ltd. The company converts forestry byproducts into graphite for use in lithium batteries. CATL will collaborate with CarbonScape with a view to scaling up production of bio-based graphite to meet demand from global automotive and energy-storage industries. The investment signals that non-mined graphite is gaining credibility as a complementary supply source. However, no numeric performance data—such as purity targets, process yields, or production costs—were disclosed in the announcement, preventing direct comparison with the mining-based projects. The partnership structure and CATL’s strategic backing suggest a potential acceleration toward commercial-scale production, but timelines remain unspecified.
Market Risk
Risk Analysis : Global graphite mining market
The graphite mining market was valued at approximately USD 0.8379 billion in 2025, based on a single-source estimate, and supplies natural flake and amorphous graphite for lithium-ion battery anodes, steelmaking, and other industrial applications. This chapter looks at the key risks affecting mine development and production in Alaska, Mozambique, Madagascar, and historical occupational health data from Sri Lanka, using disclosures and reports available as of mid-2026. The focus is on natural graphite mining and primary beneficiation; synthetic graphite, downstream purification beyond beneficiated concentrate, trade restrictions, and risks associated with Chinese mines are outside the scope.
Graphite One’s flagship project on the Seward Peninsula faces at least a one-year permitting delay after the US Army Corps of Engineers required a full Environmental Impact Statement. The project is also facing community opposition related to subsistence resources in the Imuruk Basin. In Mozambique, a new mining law requiring a minimum 15% non-dilutable state ownership and local processing before export creates additional regulatory uncertainty for foreign operators, while the mining ministry has not clarified whether the rules will apply retroactively to existing operations. In Madagascar, Total Graphite has paused production at its Vatomina mine for operational optimisation and is targeting a restart above 1,000 tonnes per month from December 2026, temporarily removing this supply from the market.
Mozambique’s sovereign debt pressures and disputes over electricity pricing, highlighted by the curtailment at the Mozal smelter, also raise concerns about infrastructure reliability and investor confidence for graphite mining projects. Occupational health remains another long-term risk. Historical cohort data from a Sri Lankan mine recorded graphite pneumoconiosis in 18 cases across three screening rounds. The data indicate that improved dust control can reduce the prevalence of the condition, but the average 22.6-year period from exposure to diagnosis highlights the long-term occupational health liabilities that can remain associated with graphite mining.
Regulatory and Community Risks in New Graphite Supply Hubs
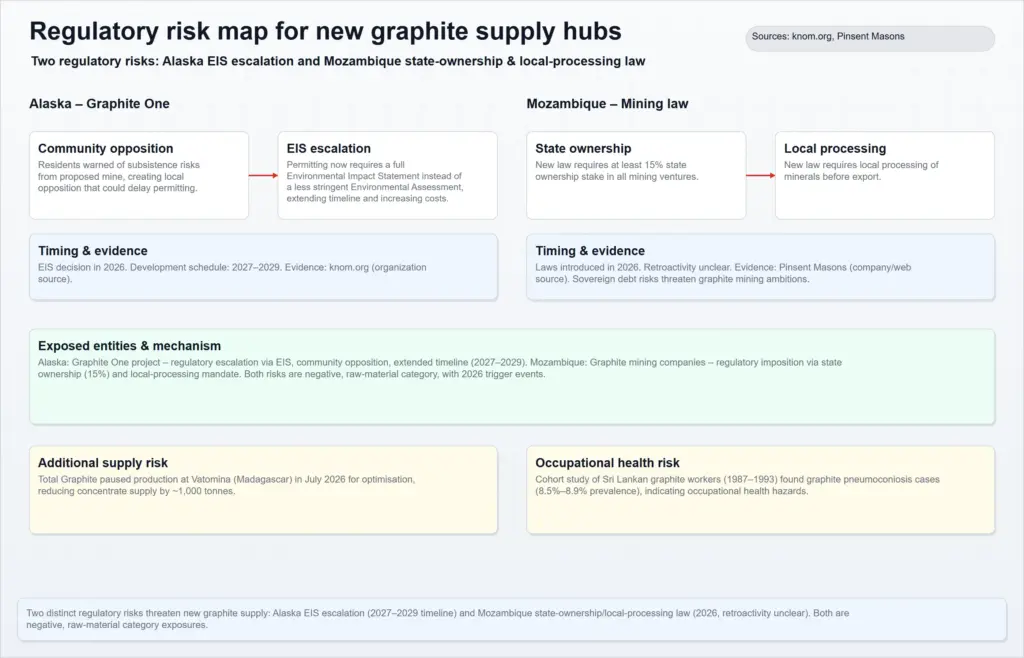
Two distinct regulatory shocks are injecting timeline and cost uncertainty into emerging graphite mining centres. In Alaska, the US Army Corps of Engineers notified Graphite One in July 2026 that a full Environmental Impact Statement (EIS) would be required instead of the less stringent Environmental Assessment previously anticipated. The decision extends the permitting timeline by at least one year: the FAST‑41 permitting dashboard had forecast all permits complete by 2027; the EIS process now pushes that target toward 2029. The Corps also extended its Section 106 review under the National Historic Preservation Act after the project unearthed ancient Indigenous artifacts. The observed event is the regulatory escalation; the direct implication is a construction delay that postpones first production and raises pre‑development capital expenditure.
Community opposition compounds the permitting risk. Residents of Brevig Mission and Teller, supported by the Norton Bay Watershed Council, warned of threats to subsistence resources in the Imuruk Basin. A public meeting scheduled during a subsistence period was postponed; Graphite One is returning to Brevig Mission on 28 July 2026. Bering Straits Native Corporation, an Alaska Native Corporation that has invested in the project, agreed with the EIS decision, acknowledging the need for more comprehensive consultation. The social license risk is actively delaying engagement rather than the permitting process itself.
In Mozambique, new mining legislation signed in June 2026 requires a minimum 15% non‑dilutable state ownership in all mining ventures, channelled through a new National Mining Company. Export of minerals before local processing is banned unless special approval is granted. The mining ministry has yet to clarify whether the law applies retrospectively to existing operations that operate under separate long‑term agreements. For foreign graphite developers, this introduces uncertainty over project valuation, cost structures, and future cash flow. The mechanism is sovereign regulatory imposition; affected participants include all graphite mining companies operating or planning projects in Mozambique, notably Syrah Resources at Balama and Total Graphite’s Montepuez development.
Operational and Financial Risks Affecting Existing Graphite Production
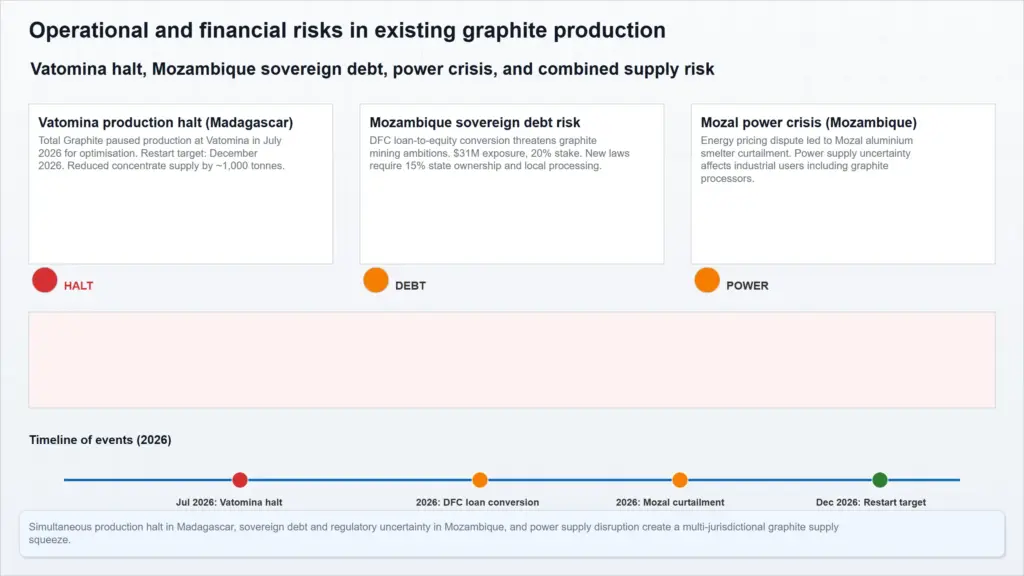
Beyond regulatory hurdles, ongoing operations face production halts and sovereign‑level financial strains. Total Graphite paused production at its Vatomina mine in Madagascar in July 2026 following an independent technical review that identified necessary upgrades in geology assessment, mine planning, infrastructure, and plant optimisation. Five diamond drill holes have been completed; the drilling programme continues through the fourth quarter. The company targets a production restart above 1,000 tonnes per month starting December 2026, subject to drilling progress. This temporary removal of concentrate supply tightens the short‑term availability of natural graphite, particularly for buyers without diversified sourcing.
In Mozambique, sovereign debt and energy policy risks threaten the broader graphite mining ecosystem. The US International Development Finance Corp. is converting a US$31 million loan to Syrah Resources into an estimated 20% equity stake in the Balama graphite operation—a move that signals both strategic backing and the degree of financial strain. Simultaneously, a dispute over electricity pricing between the government and South32 led to a curtailment of operations at the Mozal aluminium smelter in March 2026. This power crisis raises costs and reliability concerns for energy‑intensive miners, including graphite beneficiation. The combination of debt exposure and energy insecurity undermines Mozambique’s attractiveness as a stable supply hub. Market analysts quoted in reporting caution that raw resource potential alone will not guarantee success.
Occupational Health Legacy and Workforce Risk in Graphite Mining
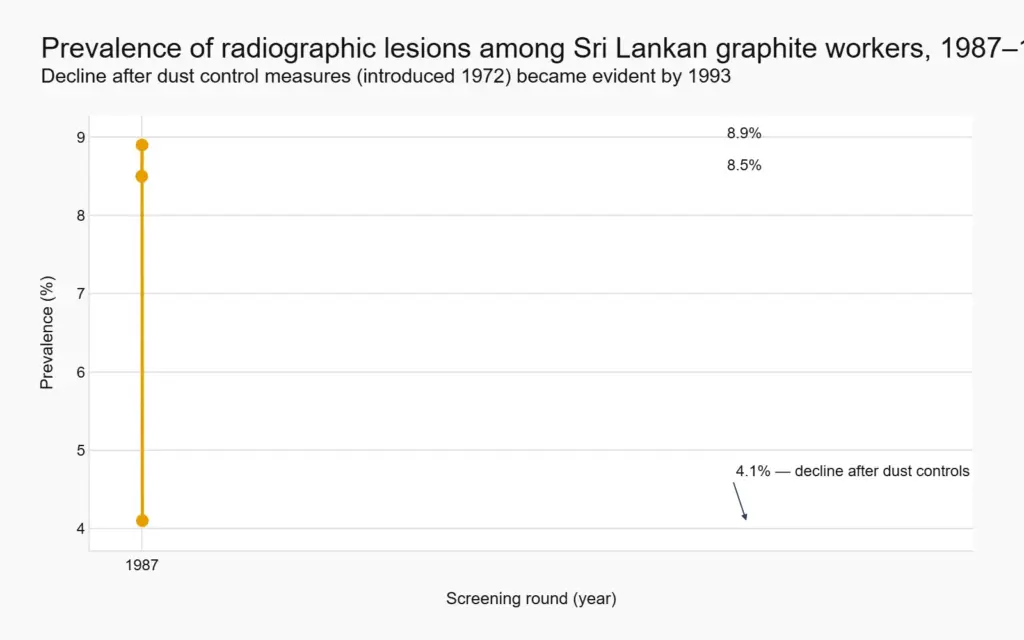
Historical cohort data from a graphite mine in Sri Lanka, studied in three rounds (1987, 1990, 1993), document the long‑term lung disease risk to miners. Radiographic lesions were found in 8.5% of workers in 1987, rising slightly to 8.9% in 1990, then declining to 4.1% in 1993. Clinical examination of those with lesions detected a total of 18 cases of graphite pneumoconiosis and seven cases of active pulmonary tuberculosis across the three rounds. Five workers developed pneumoconiosis during the study; the average duration of exposure before diagnosis was 22.6 years. The decline in prevalence in 1993 is attributed to dust control measures introduced in the mine after 1972.
This evidence is historical (last study round 1993) and from one specific Sri Lankan operation, but it illustrates a persistent risk legacy: graphite dust exposure, even with controls, can produce disease after more than two decades. For current mine operators, the implication is long‑tail liability for occupational health claims and the need for rigorous, well‑documented exposure management programmes. The data also show that effective controls can materially reduce disease prevalence, but the long latency means that even mines with modern dust suppression may face delayed compensation or regulatory action as workers age.
Regulatory Landscape
Scope of this Chapter
United States: NEPA Permitting Escalation at Graphite Creek
In July 2026, the U.S. Army Corps of Engineers informed Graphite One Inc. that its Graphite Creek Project on Alaska’s Seward Peninsula would require a full Environmental Impact Statement (EIS) under the National Environmental Policy Act (NEPA), rather than the less rigorous Environmental Assessment (EA) previously underway. The Corps also indicated it needed additional time to complete a Section 106 review under the National Historic Preservation Act, prompted by the discovery of ancient Indigenous artifacts on the site.
The decision adds at least one year to the permitting timeline. The Graphite One project had been listed on the federal FAST-41 dashboard, which holds agencies to tight schedules for infrastructure projects; that dashboard had previously projected all permits complete by 2027. With the EIS requirement, completion is now expected in 2029. The company had been potentially months away from key federal permits before the announcement.
For Graphite One, the extended timeline raises questions about project financing, partner agreements, and first production estimates. The mine is the only advanced graphite project in the United States and is intended to supply raw graphite for battery anodes. The delay pushes back the availability of domestic graphite for U.S. battery manufacturers, who will continue to rely on imports—increasingly from jurisdictions with their own export restrictions—for the near term. No alternative domestic graphite projects are at an equivalent stage of development.
Global Export Restrictions on Graphite: OECD Inventory 2026
| Material | Share of exports restricted |
|---|---|
| Graphite | 47% |
| Cobalt | 70% |
| Manganese | 70% |
| Rare-earth elements | 45% |
| Tin | 41% |
| Global raw materials average | 16% |
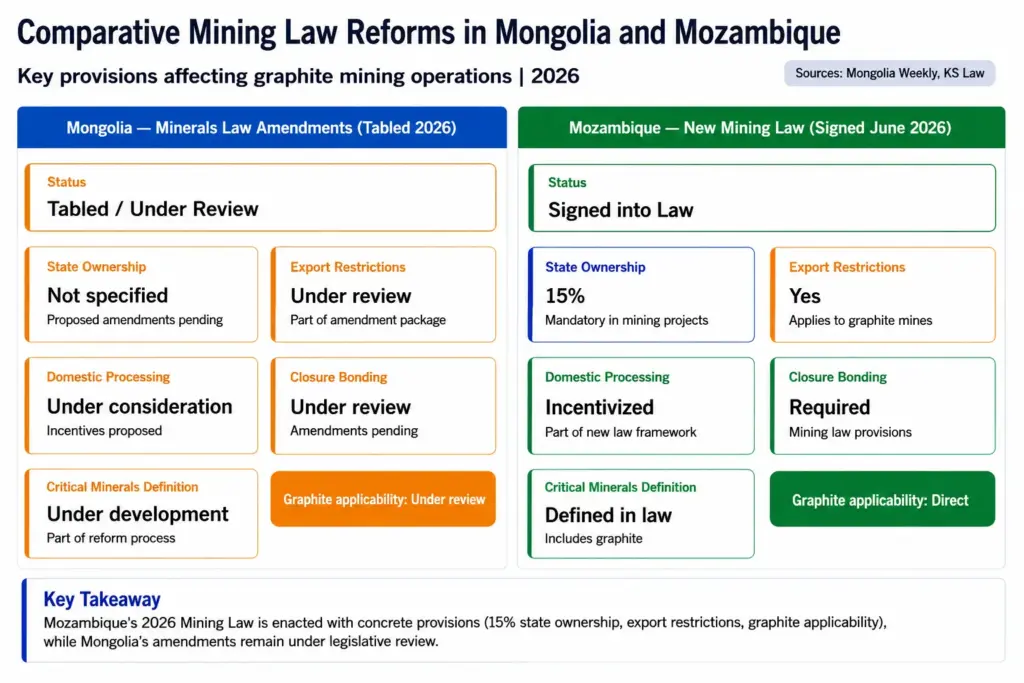
Mining Law Reforms in Key Graphite Producers: Mongolia and Mozambique
Mongolia: Minerals Law Amendments (tabled May 26, 2026)
On May 26, 2026, the Government of Mongolia tabled a comprehensive overhaul of its Minerals Law, directly affecting graphite mining companies operating in the country. The draft, which must pass parliamentary review and receive presidential promulgation before taking effect, introduces several provisions directly relevant to graphite mining. It establishes Mongolia’s first legal definition of \”critical minerals\” (Article 4.1.32), defines \”economically significant by-product minerals and elements\” (Article 4.1.33), and sets out a new regulatory framework for mineral beneficiation. Royalty reductions are proposed to incentivize domestic processing. The amendment also mandates financial bonding for mine closure, reclamation, and post-closure monitoring, with funds secured via international financial institutions or deposited with the environmental authority according to a schedule based on total life-of-mine (Article 27.1.16). These changes alter the investment calculus for graphite explorers and developers, increasing closure liability while offering incentives for vertical integration.
Mozambique: New Mining Law (signed June 3, 2026)
On June 3, 2026, Mozambique’s President signed a comprehensive revision of the mining law, replacing Law No. 20/2014. The new law requires the State—acting through a newly created national mining company, Empresa Nacional de Minas (ENM)—to hold a minimum 15% free-carried, non-dilutable participation in all mining projects at any stage of the value chain. It also prohibits the export of unprocessed or semi-processed mineral products without explicit ministerial authorization. The government has 180 days to propose a list of strategic minerals, which ENM will have exclusive rights over. The law applies to all mining operations except petroleum, natural gas, and associated gas. Importantly, it contains no express transitional provisions for existing mining agreements, licenses, or pending applications, injecting uncertainty into ongoing graphite operations. Mozambique is one of the world’s largest graphite producers, and these provisions directly affect graphite mining companies and mines that supply natural graphite for battery anodes and other industrial applications.
| Country | Legal instrument | Status | Key provisions affecting graphite | Effective / expected date |
|---|---|---|---|---|
| Mongolia | Minerals Law Amendments | Tabled May 26, 2026; pending parliamentary approval | Critical minerals definition; royalty cuts for domestic processing; financial closure bonding (Art. 27.1.16); beneficiation framework | Not yet enacted |
| Mozambique | New Mining Law (replaces Lei No. 20/2014) | Signed into law June 3, 2026 | 15% free-carried state participation (ENM); export restrictions on unprocessed minerals; strategic minerals list within 180 days; no transition provisions for existing licenses | Immediate upon signature; strategic minerals list due by November 2026 |
These two reforms, in major or emerging graphite producers, increase state control and operational requirements. For graphite mining companies operating in or considering investment in Mongolia or Mozambique, the combination of mandatory state participation (Mozambique), export restrictions on raw material (both countries), and new closure bonding obligations (Mongolia) raises the cost and risk of project development. The absence of transitional rules in Mozambique creates immediate uncertainty for existing mine operators and their supply contracts with downstream buyers.