
Global Airport Parking & Pre-Booked Reservation Platforms Market Report, Size, Share and Forecast 2026–2033: A Bay Is Perishable — a Booking Is an Asset
1. Market Snapshot
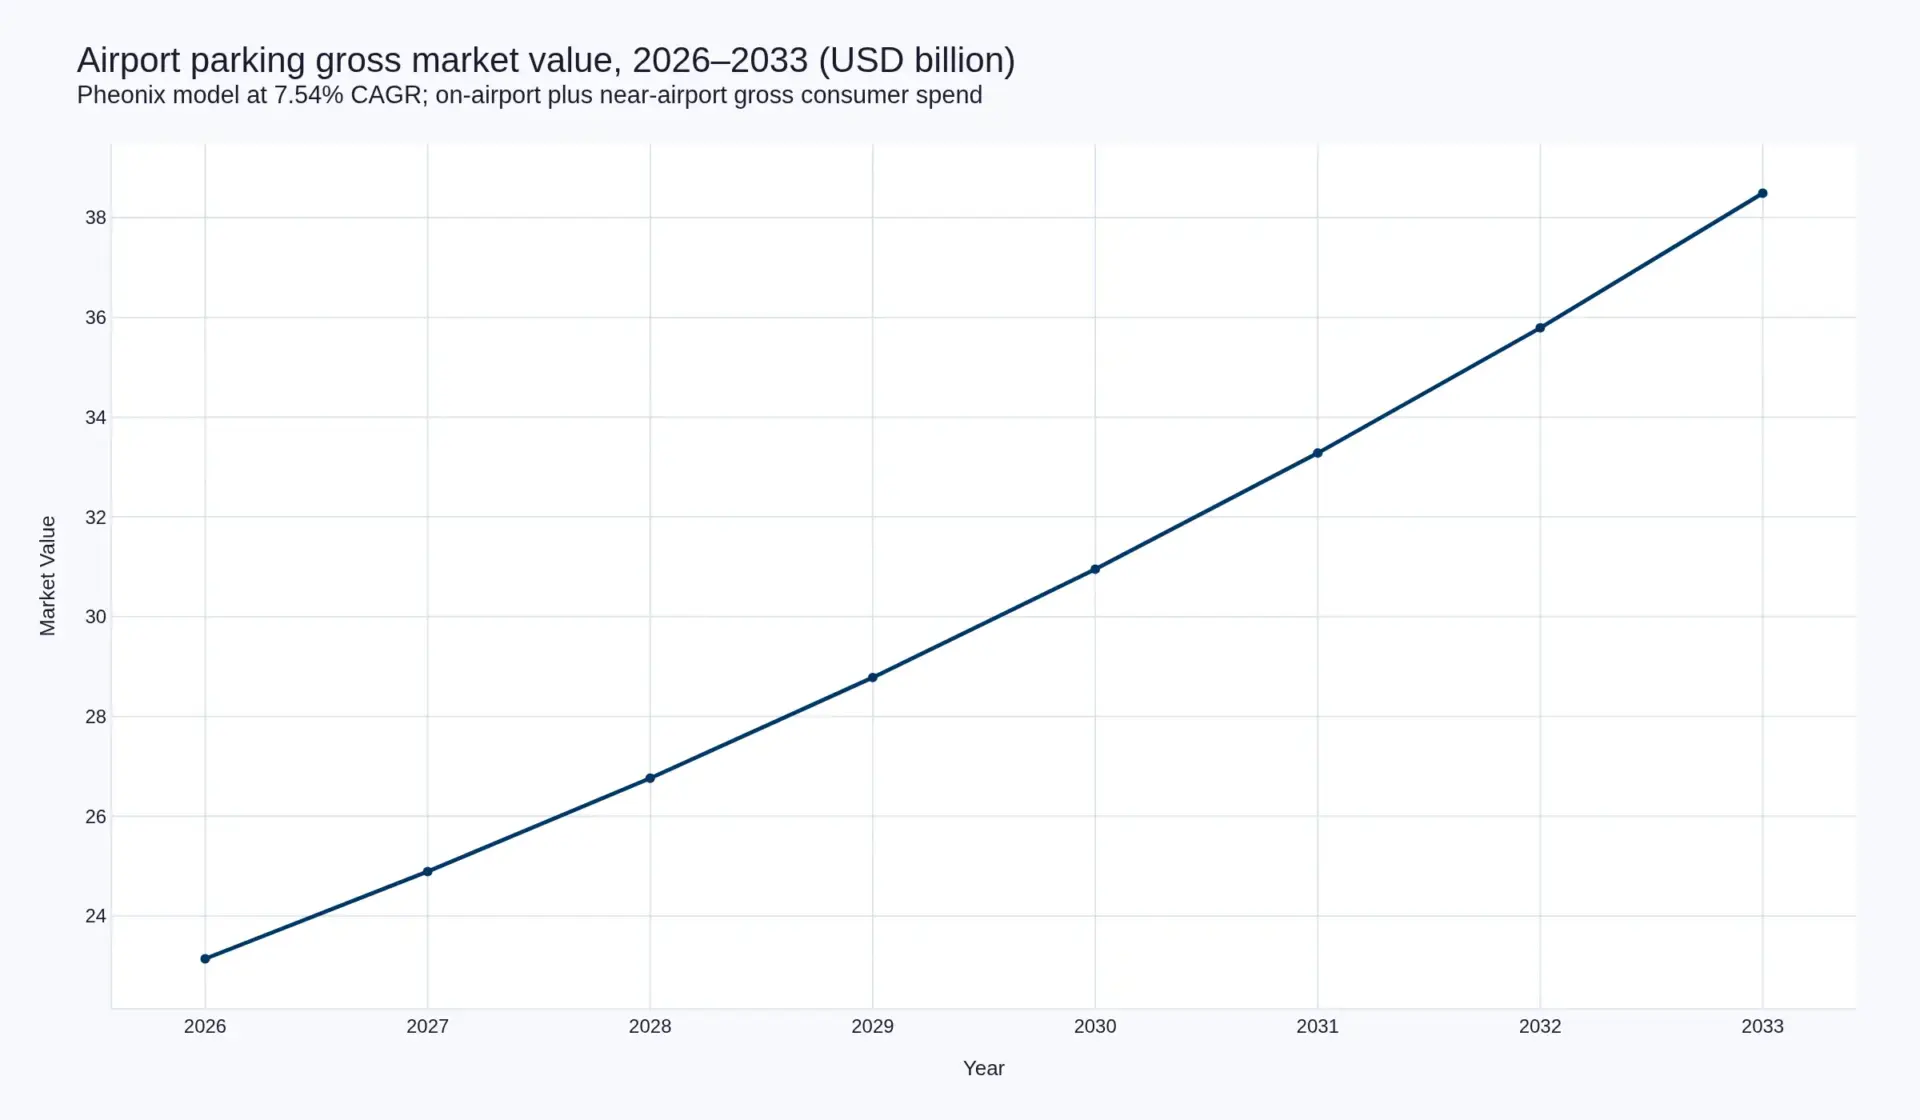
Airport parking is a USD 21.52 billion gross market in 2025, the base year for this forecast, and USD 23.14 billion in 2026, its first year. By 2033 it reaches USD 38.49 billion, a compound annual growth rate of 7.54 per cent from that base. That is the number this report is built to defend, and it is a number about money rather than about cars. The volume underneath it — 1,020 million parking stays in 2025, 1,050 million in 2026, rising to 1,290 million by 2033 — grows at 2.98 per cent. The four-and-a-half-point gap between value growth and volume growth is the subject of the report. It is not inflation in any general sense. It is what happens when a perishable bay is converted into a dated, priced, committed reservation, and when the party holding that reservation acquires the right to set the price.
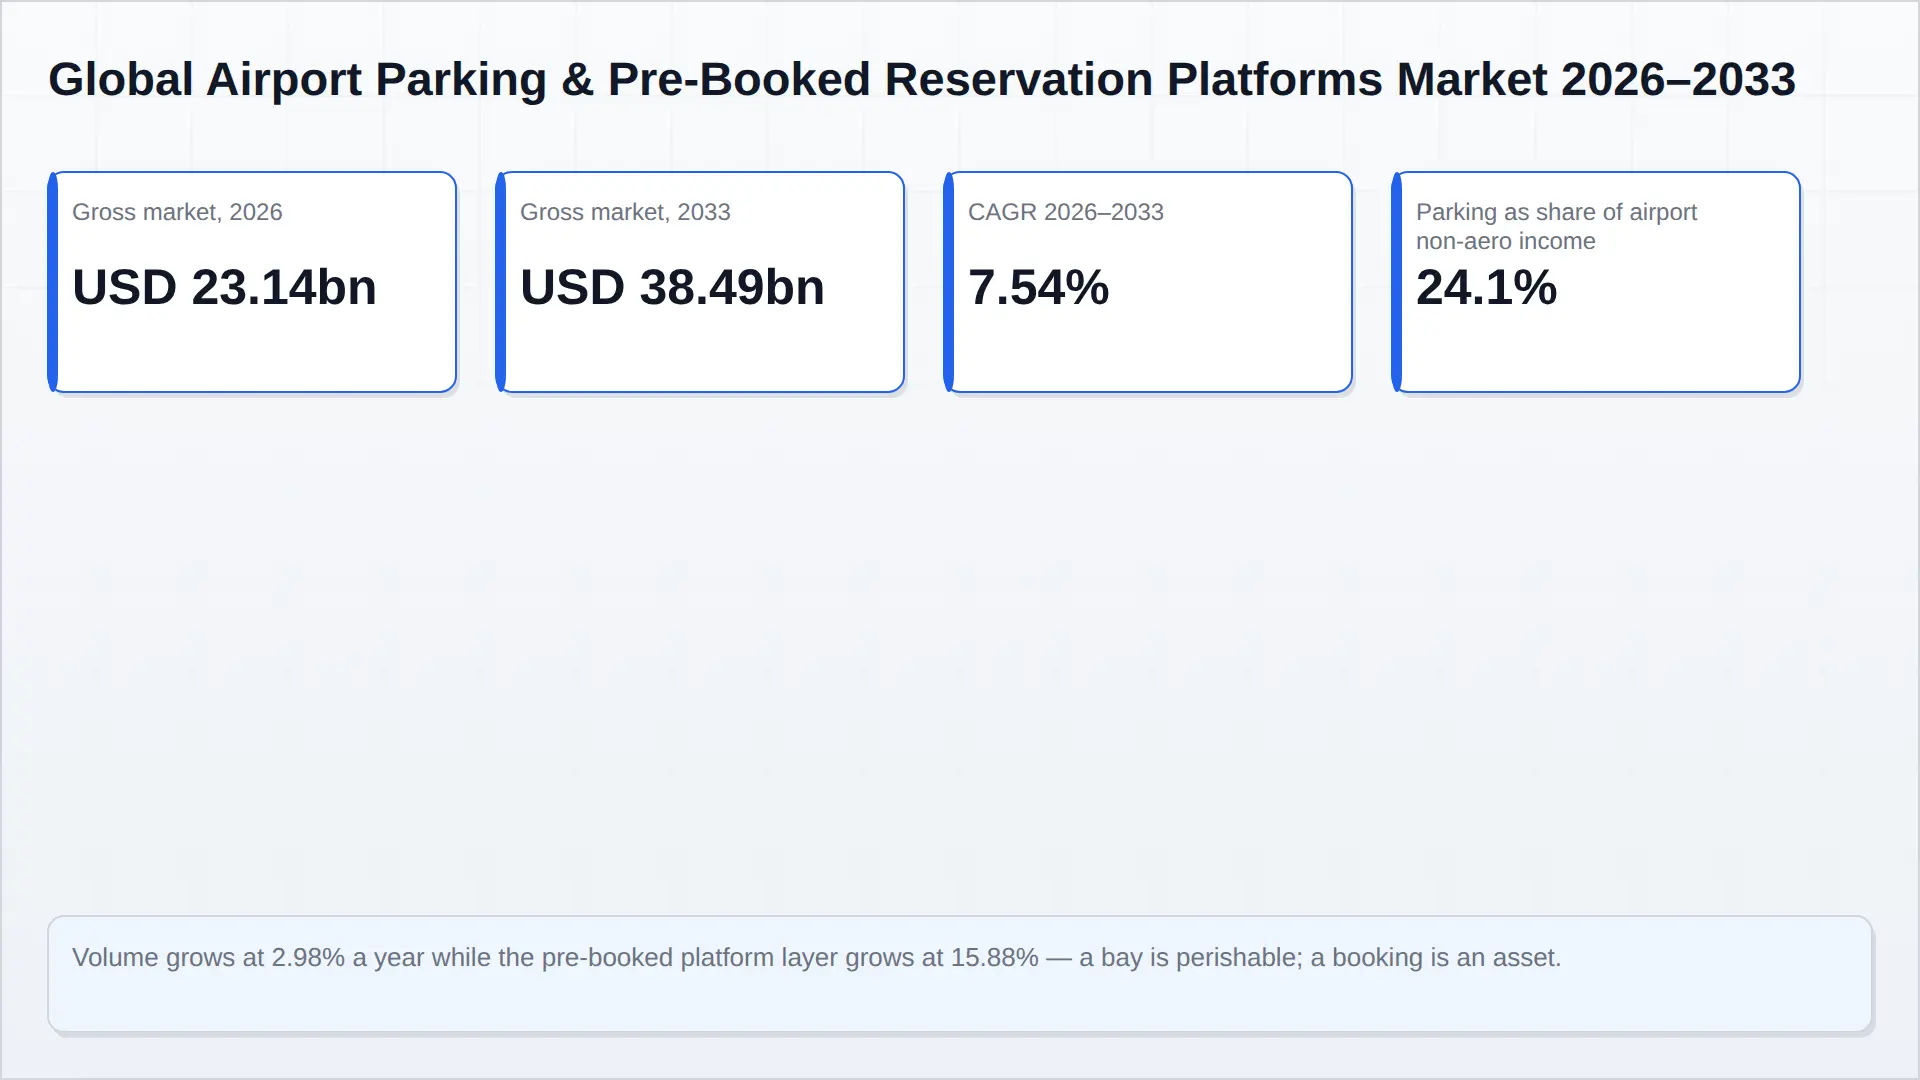
The forecast is stated against a 2025 base year. On that base the market is USD 21.52 billion of gross value on 1,020 million stays, or USD 21.10 per stay. The table below carries it forward one year to 2026, the first forecast year, at USD 23.14 billion on 1,050 million stays; the two are the same line one year apart, since 21.52 billion grown at the report's own 7.54 per cent is 23.14 billion. The stat block at the head of this page prints the base-year figure — USD 21,520 million — and every other figure in this report is stated on the 2026 forecast year unless the text says otherwise. That 21.52 billion is the model's own discount of the 2026 anchor back one year at the report's own growth rate, not a passenger-derived estimate. The top-down route further down this section — ACI's USD 1.82 per passenger applied to 9.8 billion passengers, grossed up at 18 per cent for capacity that sits outside the airport fence — lands at USD 21.10 billion, about 2 per cent lower. The difference is ordinary variance between a bottom-up construction and a top-down one, and the bottom-up figure is the one this forecast, its charts and its headline are built on.
| Metric | 2026 | 2033 | CAGR |
|---|---|---|---|
| Gross market value | USD 23.14bn | USD 38.49bn | 7.54% |
| Parking stays | 1,050m | 1,290m | 2.98% |
| Revenue per stay | USD 22.04 | USD 29.83 | ≈4.4% |
| On-airport gross revenue | USD 19.61bn | USD 32.62bn | 7.54% |
| Near-airport (off-airport) gross revenue | USD 3.53bn | USD 5.87bn | 7.54% |
| Pre-booked gross booking value | USD 7.41bn | USD 17.32bn | 12.9% |
| Platform fee revenue (net) | USD 0.37bn | USD 1.04bn | 15.88% |
Two definitions carry the whole document. Gross market value is what the driver pays, at the barrier and online, at and around airports; it is not the operators' turnover, and it is not a fee pool. Platform fee revenue is the thin layer those bookings throw off — commissions, booking fees, cancellation and amendment charges — and it is roughly 1.6 per cent of the gross market in 2026. The first number is what makes parking matter to an airport. The second is what makes it investable to a platform.
The derivation is bottom-up rather than borrowed. ACI World's 2026 Airport Economics Report, built on financial-year-2024 data from more than 1,000 airports, puts non-aeronautical income at 36.7 per cent of total airport revenue and non-aeronautical revenue at USD 7.57 per passenger. Car parking is 24.1 per cent of that non-aeronautical income globally and 43.2 per cent in North America. Parking is therefore USD 1.82 per passenger and 8.84 per cent of everything an airport earns. Applied to the 9.8 billion passengers ACI World projects for 2025 and the 9.4 billion it confirmed for 2024 in its September 2025 demand update, that yields USD 17.88 billion of on-airport parking revenue in 2025, against USD 17.15 billion in 2024.
Everything above that line is Pheonix's own construction and is stated as such. Passenger volume is carried forward at the 3.4 per cent compound rate ACI World uses in its Airport Traffic Forecasts 2024–2053; yield per passenger is inflated at 3 per cent to 2026 and 4 per cent thereafter, on the evidence of pre-booking mix and dynamic pricing described in sections 3 and 10. Near-airport private capacity is added at 18 per cent of the on-airport base — capacity that appears in no airport's accounts because it sits outside the fence, and whose scale is visible instead in The Parking Spot's 70-plus locations across more than 45 airports and in the 70-plus US airport operations run by Metropolis following its May 2024 acquisition of SP Plus. Forecast risk sits on the volume line, not the value line: if ride-hailing continues to take access share at the rate described in section 4, stays grow slower than passengers, and price has to carry more of the total.
2. Executive Summary
Five findings hold the report together.
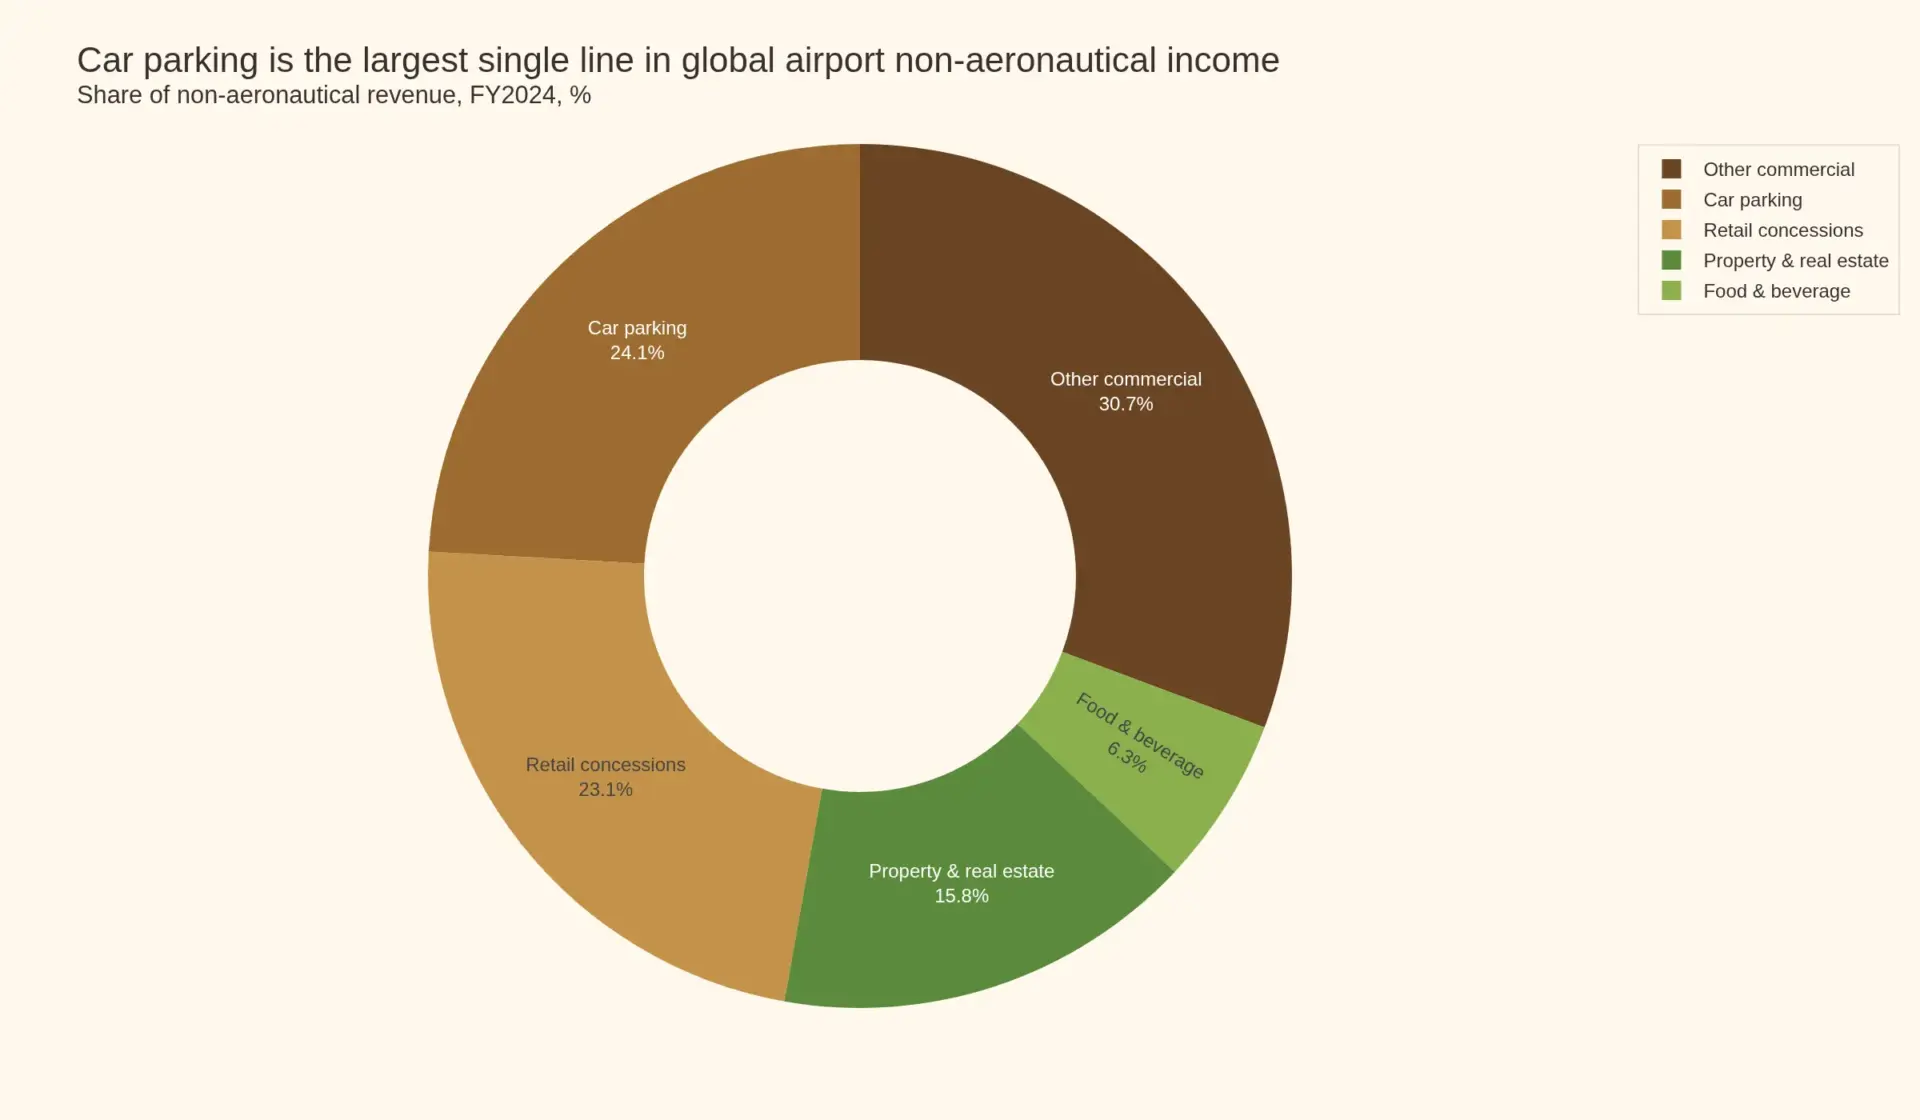
One: parking is the second-largest commercial line at an airport, and it is the one most exposed to being repriced. At 24.1 per cent of non-aeronautical income, car parking is the largest single commercial line at a global airport, just ahead of retail concessions at 23.1 per cent, and it is more than one-and-a-half times property and real estate at 15.8 per cent and nearly four times food and beverage at 6.3 per cent. In North America it is 43.2 per cent — the single largest commercial line by a distance. Parking is not a car-park business attached to an airport. It is, in the United States especially, the commercial engine of the airport.
Two: this is two markets wearing one name, and they are digital and physical respectively. The long-stay product is increasingly sold before the driver leaves home; the short-stay product is still overwhelmingly bought at the barrier on the day. The penetration figures do not describe a curve, they describe a split: Dallas Fort Worth reports that 25 per cent of its parkers prebook online and that the programme has gone from 45,000 customers in its first year to its millionth customer in February 2026; Charlotte Douglas reports that approximately 65 per cent of all its parking is reserved online, across 16,000 of its 25,000 spaces; and in Australia and New Zealand, online booking accounts for over 90 per cent of revenue in the long-stay market while short-stay remains drive-up. Any single "online penetration" number for this market is an artefact of the stay-length mix it was measured on.
Three: the platform layer is thin, and it is where the growth is. Pheonix puts pre-booked gross booking value at USD 7.41 billion in 2026, or 32 per cent of the gross market, rising to USD 17.32 billion by 2033 as the pre-book share moves to 45 per cent. A 5 per cent net take in 2026 widening to 6 per cent as cancellation, amendment and ancillary fees attach produces USD 0.37 billion of platform fee revenue now and USD 1.04 billion in 2033 — a 15.88 per cent CAGR against 7.54 per cent for the market. The fee pool is small. The control it buys is not, because the platform decides which inventory is released and at what price, and the airport that outsources that decision has outsourced its yield.
Four: ride-hailing is substituting for the drive-up parker and paying the airport to do it. At Boston Logan, Massport reports that nearly 30 per cent of all passengers arrived at or departed the airport in an Uber or Lyft in 2024 — the most common mode of access — and approved raising the ride-app fee from USD 3.25 to USD 5.50 per trip from July 2025 and to USD 7.50 from July 2027. Ride-app drop-off fees alone generated USD 15.6 million for Massport in fiscal 2024, up from USD 13.7 million. Every passenger lost to a ride-app is a bay not sold, and a fee collected instead. That trade is now explicit in airport ground-transport policy, and it is the reason volume in this market grows at 2.98 per cent while passengers grow at 3.4 per cent.
Five: regulation decides who is allowed to capture the upside, and it is tightening on the funnel rather than on the asphalt. In the United States, parking revenue is airport revenue: under the FAA's revenue-use rules and Grant Assurance 25, it may be spent only on airport capital or operating costs, which makes parking a cost-recovery instrument and pushes concessions toward revenue-share structures. In the United Kingdom, the pricing of the booking itself is now regulated: under the Digital Markets, Competition and Consumers Act 2024, the CMA's price-transparency guidance makes drip pricing unlawful, with penalties of up to 10 per cent of turnover or GBP 300,000. A pre-booked parking funnel that advertises a nightly rate and adds a booking fee at checkout is the exact fact pattern the guidance was written for.
The strategic consequence is a contest over one decision: who releases inventory to the booking layer, and at what price. Airports hold the land and, in the United States, a statutory duty to monetise it for airport purposes. Operators hold the assets, the shuttles and the labour. Platforms hold the customer, the price comparison and the data. Section 8 traces that contest through the value chain; section 7 through the companies now consolidating around it.
A summary of the headline findings above is published as a press release: Airport Parking Reaches USD 38.49 Billion by 2033 at 7.54 Per Cent.
3. What This Market Actually Sells
A bay is inventory with a clock attached. An hour of short-stay capacity that goes unsold at 09:00 has no value at 10:00 — it cannot be stored, moved or sold later. That single physical fact explains almost everything about how this market is priced, and why the arrival of the booking layer changed its economics rather than merely its distribution.
Sold at the barrier, a bay is sold once, to whoever turns up, at a price published in advance and visible to nobody in particular. Sold in advance, the same bay becomes a contract: a date, a duration, a price, a payment, and a set of terms governing what happens if the flight is cancelled or the trip shortens. The driver is no longer buying a space. They are buying certainty of access, a price locked before the day, and an exit right. Airports discovered, over roughly a decade, that they can charge for all three.
The evidence that price and mix rather than traffic are doing the work is in the operators' own disclosures. Aena — which runs 46 Spanish airports plus Luton — reported car-park revenue of EUR 204.1 million in 2024, up 13.3 per cent on EUR 180.2 million, against passenger growth in Spain well below that. Its 2025 car-park line came in at EUR 221.8 million, up a further 8.7 per cent, outstripping passenger growth again. Fraport's 2024 group accounts put parking revenue at EUR 108.4 million against EUR 101.6 million in 2023, a 6.7 per cent increase inside a Retail and Real Estate segment that grew 7.6 per cent. These are two very different airport systems — one a state-controlled multi-airport network with a relatively low car-mode share, the other a single hub with strong rail substitution — and both extracted more from parking than their passenger numbers alone would justify.
What exactly is being sold has become more granular. Pheonix's reading of live booking funnels across on-airport and near-airport products finds five distinct things priced inside a single reservation: the space itself; the duration tier, which is where most of the discounting happens; the access permission, whether a barrier ticket, a number-plate read or a QR code; the amendment right, which is now sold explicitly as flexibility; and increasingly an ancillary attached to the stay — valet, car wash, EV charging, lounge access, or a hotel night. The last of these is why park-and-fly bundles have become a competitive product rather than a marketing afterthought.
The booking layer performs three functions for the airport, and they are separable. It provides price discovery, by putting the airport's rate into a comparison set the driver can see. It controls inventory release, by deciding what share of capacity is offered in advance at what price curve. And it manufactures commitment, by converting an uncertain arrival into a forecast the operator can staff against. The second function is the one that matters. The Transportation Research Board's 2025 study of airport parking reservation systems records Phoenix Sky Harbor releasing roughly 20 to 25 per cent of its inventory across products to its online booking system, and New Orleans raising the share released from 10 to 20 per cent in response to demand. Every point of inventory released is a pricing decision, and the airport that lets a platform set it has handed over the only lever that moves yield on a fixed asset.
The customer relationship is the asset that accumulates behind the booking. The same study records Phoenix holding more than 140,000 customer accounts in its pricing and reservation system, with average revenue per online transaction rising from USD 72 in 2019 to USD 87 in 2023. Charlotte Douglas reports over 250,000 members in its parking loyalty programme. In a business where the physical product is identical across competitors — a marked rectangle within a shuttle ride of a terminal — the account, the booking history and the ability to re-price to a known repeat customer are the only durable differentiation available.
That is why the market should be read as two revenue pools and not one. The gross pool, USD 23.14 billion, is what asphalt, shuttles, barriers and labour turn over. The net pool, USD 0.37 billion in 2026, is what the reservation layer earns for intermediating it. They grow at 7.54 per cent and 15.88 per cent respectively, and the faster one owns the pricing power.
4. Demand Drivers and Structural Forces
Passenger growth is the base rate, and it is slower than the headlines suggest. ACI World confirmed 9.4 billion passengers for 2024 and projected 9.8 billion for 2025, with international traffic growing at 13.3 per cent in 2024 and expected to add 5.3 per cent in 2025 against 2.4 per cent for domestic. Its long-term forecast settles at 3.4 per cent a year from 2024 to 2043, reaching 17.7 billion passengers. Parking volume grows at 2.98 per cent in this report — below that base rate, deliberately, for the substitution reason set out below.
Airport finances are the accelerant. ACI's 2026 Economics Report finds total airport revenue in 2024 still approximately 2 per cent below 2019 and non-aeronautical revenue approximately 9 per cent below, despite traffic having passed pre-pandemic levels. The regional spread is wide: North America 13.6 per cent above 2019, Latin America 9.1 per cent above, Europe 5.5 per cent below, Asia-Pacific and the Middle East 13.9 per cent below, Africa 23.8 per cent below. An airport whose commercial income has not recovered has two options — wait for retail to come back, or extract more from the assets that did. Parking is the asset that did. That is the mechanism behind Aena's 13.3 per cent and 8.7 per cent car-park growth in consecutive years.
Stay length is the real demand variable. Pre-booking penetration is not a technology curve, it is a function of how far ahead the trip is planned. A leisure traveller going away for eleven days books a fortnight out and compares four products. A business traveller returning the same evening drives up and pays what the board says. This is why the Australian and New Zealand evidence shows over 90 per cent of long-stay revenue booked online while short-stay remains drive-up, and why airports in that region do not even offer pre-booking below a minimum duration — Perth requires a two-hour minimum. Any forecast that applies a single online-penetration rate across the whole market will be wrong in both directions at once.
Ground-access substitution is the structural threat, and it is already priced. Ride-hailing has moved from marginal to dominant at some airports: nearly 30 per cent of Logan's passengers used Uber or Lyft in 2024, the most common access mode, and Massport's response was to raise the per-trip fee to USD 5.50 in July 2025 and USD 7.50 in 2027 while stating the goal as moving more people in fewer vehicles. The same policy logic — charge the mode that consumes kerb, subsidise the mode that fills the garage — is now standard in ground-transport planning. The enforcement layer that makes a kerb restriction or a priority lane actually stick is priced separately in the Global Road Safety & Enforcement Systems Market Report 2026–2033. For this market it means parking volume per passenger falls as passengers rise, and the airport recovers part of the difference through a fee that is not parking at all.
Capacity is fixed in the medium term, which converts demand growth into price. A new multi-storey deck is a five-to-seven-year capital project with a civil-engineering cost base; expansions at constrained European and North American hubs are contested locally on traffic grounds. When supply cannot respond, demand growth lands on rate. That is the mechanical reason the value line in this report grows at 7.54 per cent against a volume line of 2.98 per cent.
Electrification is a yield opportunity disguised as a compliance cost. A long-stay parker is stationary for days, which makes airport car parks the best-situated charging location in the transport network for slow, cheap, high-utilisation charging — and the only one where the vehicle is guaranteed to be idle for the duration. Operators have begun bundling charging into the stay rather than metering it separately, because it raises the price of the bundle without raising the price of the space. How quickly that parc turns over, and therefore how quickly charging demand at a deck arrives, is set by the dynamics covered in the Global Automotive Market Report 2026–2033. Pheonix's conversations with operators suggest charging attachment is being used as a retention product on the pre-booked long-stay segment first, where the customer is identifiable and the dwell time longest.
Labour and shuttle costs determine the off-airport model's viability. Near-airport operations are a transport business wearing a parking business's clothes: continuous shuttle service to the terminal is the product, and driver wages are the largest variable cost. The Parking Spot's model — 70-plus locations, 45-plus airports, shuttle to terminal as the core promise — is viable at scale and fragile below it. This is the cost structure that decides whether the off-airport share of this market rises or consolidates into a handful of operators.
5. Segment and Product Split
The market is best cut by where the car sits and how far ahead the decision was taken, not by the type of operator. The two dimensions interact: stay length predicts channel, and channel predicts margin.
| Segment | 2026 share | 2033 share | Channel and pricing behaviour |
|---|---|---|---|
| On-airport long-stay | 33% | 36% | Pre-book dominant; advance-purchase discounting; highest revenue per stay |
| On-airport short-stay and hourly | 26% | 22% | Drive-up dominant; published tariffs; least price elasticity |
| Near-airport off-airport (shuttle) | 15% | 15% | Aggregator and brand-site mix; priced at a discount to on-airport |
| Valet and meet-and-greet | 8% | 9% | Pre-book almost exclusively; premium and labour-intensive |
| Park-and-fly hotel and bundled stay | 7% | 7% | Pre-book only; sold as a package with a room night |
| Season, contract, staff and tenant parking | 6% | 6% | Contracted, invoiced, low transaction cost |
| Ancillary attached to the stay | 5% | 5% | EV charging, wash, lounge, amendment and cancellation fees |
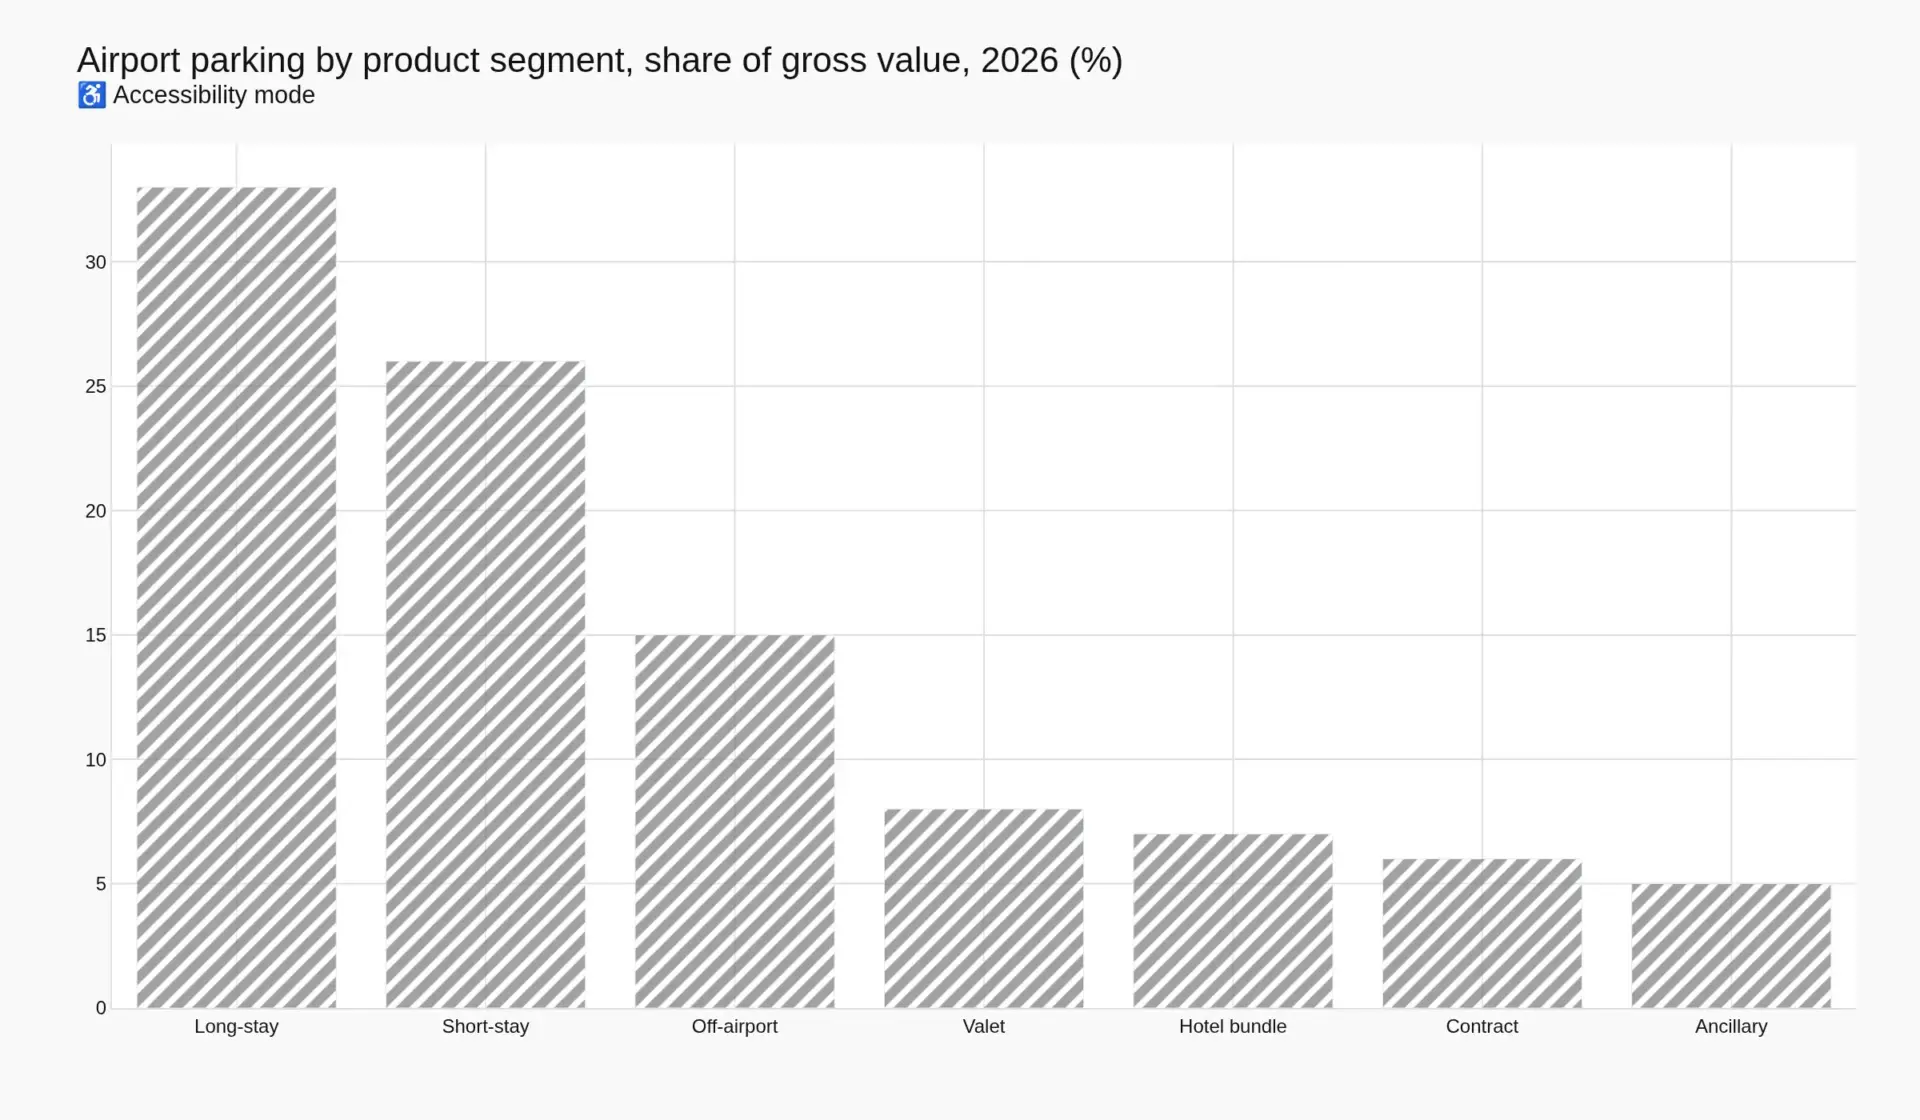
Long-stay is the profit centre and the digital one. It carries the longest dwell, the highest ticket and the most planning lead time, which is why it is where pre-booking has all but completed its migration in mature markets. The consequence for pricing is that competition happens before the trip, in a comparison set of five to fifteen products across on-airport and near-airport alternatives, rather than at a barrier where the driver has already committed to the journey. That is a permanent change in the balance of power between seller and buyer, and operators have responded by differentiating on things the comparison set cannot easily show: guaranteed entry, barrier-free exit, shuttle frequency, bay width, and the terms on which a booking can be moved.
Short-stay is the laggard and the defensible one. Its decline in share is a composition effect, not a contraction: volume tracks passenger numbers and drop-off/pick-up activity, and it is the segment least exposed to aggregator competition because nobody shops for 90 minutes of parking. It is also the segment most exposed to ride-hailing, since a short-stay bay and a ride-app pickup are substitutes for exactly the same trip. Pheonix expects its share to fall from 26 to 22 per cent by 2033 while its absolute revenue still grows.
Near-airport is a transport business with a parking price tag. The 18 per cent premium Pheonix applies to the on-airport base in the sizing model is deliberately conservative given how visible the segment is: The Parking Spot alone runs 70-plus locations across more than 45 airports, and Metropolis operates 70-plus US airport parking operations after absorbing SP Plus. Off-airport capacity is priced 30 to 50 per cent below on-airport long-stay in most US markets, which means its revenue share understates its volume share. Its economics hinge on shuttle cost per passenger, and that is why the segment is consolidating.
The ancillary layer is small and the fastest-moving. Five per cent of gross value, but it is where the platform's take widens from 5 to 6 per cent in this forecast. Amendment and cancellation charges are a booking-layer product, not a parking product: they exist because the reservation created a right that could be varied, and they monetise the driver's uncertainty about their own trip. EV charging is the other half, and it prices dwell rather than distance.
Across all seven segments, the channel split is the figure that matters: 32 per cent of gross value moves through a pre-booking in 2026, rising to 45 per cent by 2033, or USD 7.41 billion to USD 17.32 billion. The airport that has not built a first-party booking channel by the end of that window will be buying its own customers back from somebody else.
6. Regional Analysis
Regional shares in this market track two things and not one: how much of an airport's commercial income parking represents, and how much of the passenger base arrives by private car. North America scores high on both. Europe scores high on the first and low on the second at its hub airports. Asia-Pacific has the traffic growth and the weakest parking yield per passenger.
| Region | 2026 share | 2033 share | What sets the number |
|---|---|---|---|
| North America | 41% | 40% | Parking at 43.2% of non-aeronautical income; most developed off-airport and pre-book layer |
| Europe | 27% | 27% | Mature concessions, high rail substitution at hubs, tightening price-transparency rules |
| Asia Pacific | 22% | 23% | Fastest traffic growth, retail-led commercial mix, lowest parking yield per passenger |
| Middle East & Africa | 6% | 6% | Hub concentration, high car dependency in the Gulf, revenue recovery furthest behind |
| Latin America | 4% | 4% | Airport modernisation cycle, concession-led operating models |
North America is the centre of gravity for the reason the ACI data makes unavoidable: parking is 43.2 per cent of non-aeronautical revenue there, against 24.1 per cent globally, inside a region whose total airport revenue is 13.6 per cent above 2019 while the global average is 2 per cent below it. Every structural feature of the mature market is present: the largest operator runs 70-plus airport operations and collects over USD 2 billion of parking revenue for its airport partners; DFW's pre-book programme reached a million customers; Charlotte books roughly two-thirds of its parking online. It is also the region where ride-hailing has advanced furthest, and where the airport response — charge the kerb, fill the garage — is most developed. The landside real estate that competes with parking for the same kerb, from rental desks to ride-app pick-up zones, is sized in the Global Car Rental Market Report 2026–2033.
Europe holds its share rather than growing it. Parking is a smaller slice of a commercial mix led by retail at 26.7 per cent of non-aeronautical income, and Europe's total airport revenue remains 5.5 per cent below 2019. But the operating base is dense and professional: APCOA runs 830 travel-sector locations including 60 airports; Indigo manages more than 80,000 airport car-park spaces worldwide with its Indigo Neo advance-reservation platform; Q-Park and National Car Parks hold national positions. The regulatory direction is European and British rather than American: the Digital Markets, Competition and Consumers Act 2024 makes drip pricing unlawful in the UK, and the EU's Omnibus Directive 2019/2161 applies the same total-price logic across the single market. A booking funnel is now a regulated artefact in Europe in a way it is not yet in the United States.
Asia Pacific is where traffic grows fastest and yield lags most. ACI puts the region's total airport revenue 13.9 per cent below 2019 — the widest gap after Africa — and its commercial mix is retail-led at 38.8 per cent of non-aeronautical income. Airport parking in the region is frequently bundled into concession packages with ground handling and property, priced administratively rather than dynamically, and pre-booking is a newer behaviour. That combination means the region's share of value grows only one point to 2033 while its share of passengers grows faster, which is another way of saying the yield gap is the opportunity.
Middle East and Africa holds six per cent on hub concentration. Gulf hubs combine very high car dependency with a single-operator concession model, which produces high parking yields at a small number of sites. Africa remains 23.8 per cent below 2019 on total revenue and is not a pre-booking market at scale; where it appears, it appears through airport modernisation programmes rather than through consumer demand for advance purchase.
Latin America holds four per cent and is the quiet improver. Revenue is 9.1 per cent above 2019, above the global average, and the concession model that dominates the region's airports has brought international operators in with their reservation platforms attached. Indigo, for instance, uses its airport deployments in Brazil and Canada to model passenger flows and manage demand — the same data capability that in North America is being sold as yield management.
Table of Contents
Competitive Landscape
7. Competitive Landscape
This market has a structure that is easy to misread because the companies that own the customer are rarely the companies that own the concrete. Three populations compete, and they compete for different things: landowner-operators who hold the asset and the concession, contracted operators who hold the labour and the shuttles, and platform specialists who hold the booking. Consolidation is happening along the vertical seam between the second and third, which is why the largest single event in the market was an operator buying a platform — or, more precisely, buying the company that had already built one.
Metropolis Technologies is now the reference competitor in North America. It completed its acquisition of SP Plus in May 2024 and, on its own account, manages 70-plus US airport parking operations including 14 of the thirty busiest, collecting over USD 2 billion in parking revenue for its airport partners. In 2025 its aviation division employed more than 5,000 people, handled over 32 million vehicles, shuttled more than 63 million passengers, and its AeroParker reservation platform accepted over 5 million parking bookings. That last figure is the important one. Five million bookings is not a side business attached to a parking operator; it is a distribution channel with its own pricing data, and it sits inside the same company that runs the barrier.
APCOA Parking is the European equivalent in scale and in strategy, running 830 travel-sector locations including 60 airports alongside rail and hotel portfolios. Its published positioning is explicitly about defending airport clients against off-airport competition, and it has moved into valet, car washing, EV charging and traffic management as differentiators the aggregators cannot replicate. Indigo approaches the same market from a mobility-platform angle, managing more than 80,000 airport car-park spaces worldwide with advance reservation through Indigo Neo, 24-hour remote control centres, 3D wayfinding and cross-booking with other Indigo services.
Below those two sit the national and specialist operators. Q-Park holds a dense Western European portfolio and has been a persistent bidder for airport concessions. National Car Parks remains the largest UK-facing brand and a fixture in airport tenders. ABM Industries brings airport parking inside a much broader aviation services contract, which matters because it lets an airport buy parking, janitorial and passenger services in one procurement — a bundling logic that squeezes specialist operators out of some tenders. The Parking Spot is the clearest pure play on near-airport off-airport parking: 70-plus locations serving more than 45 airports, founded in 1998, with the Park ‘N Fly brand now inside its fleet. Its product is a shuttle promise, and its competitive weapon is price.
On the platform side proper, Holiday Extras is the most instructive company in the market and the one most people miss. The Kent-based business sells airport parking, hotels, lounges and transfers as bundled pre-travel products through its own site and app, serving over 8 million travellers a year. Its filed accounts for the year to 31 March 2025 show turnover of GBP 436.8 million, down 11.5 per cent from GBP 493.4 million, with operating profit of GBP 9.7 million against GBP 18.3 million and average employees of 871. It also owns the plumbing: Park-IT and Chauntry’s Parkspace sit inside the group as reservation and inventory systems sold to car-park operators. A company that both sells the booking and licenses the reservation engine to the operator is competing at two levels of the value chain simultaneously, and its revenue decline in the most recent year is a warning about how hard the intermediary position is to hold when on-airport operators build their own channels.
The landowner-operators are the fourth population and are not usually treated as competitors at all. Aena earned EUR 221.8 million from car parks in 2025 across its Spanish network; Fraport earned EUR 108.4 million in 2024 at Frankfurt and its international subsidiaries. Both also own the booking channel in part, and both have shown a willingness to run yield management in-house. When an airport does that, the platform layer’s take is at risk rather than the operator’s fee.
The hardware and access-control layer is where the previous report in this segment sits, and the boundary is porous: SKIDATA, Amano, Flowbird (now trading as Arrive following its 2025 acquisition by EasyPark Group), WPS, Designa and HUB Parking Technology all supply the barrier, the ticket and increasingly the cloud layer that a reservation must talk to. A booking platform that cannot write to the PARCS is not a booking platform; it is a lead-generation page.
| Group | Representative players | What they hold | Pheonix-estimated gross revenue managed, 2026 |
|---|---|---|---|
| Operator-platform integrators | Metropolis / SP Plus, APCOA, Indigo | Concessions, labour, reservation engine | USD 9.5–10.5bn |
| National and specialist operators | Q-Park, NCP, ABM, The Parking Spot | Leases, contracts, shuttle capacity | USD 6.0–7.0bn |
| Landowner-operators | Aena, Fraport, airport authorities | The land, the garage, the tariff | USD 4.5–5.5bn |
| Platform and distribution specialists | Holiday Extras, aggregators | The customer, the comparison set | USD 1.5–2.5bn |
| Access and payment technology | SKIDATA, Amano, Flowbird, HUB, Designa | The transaction perimeter | Not gross; equipment and software revenue |
Two structural observations follow. First, competition in this market is fought at the concession tender rather than in the consumer’s browser: a ten-year airport contract turns over once, and the winner takes the whole local market. Second, the position that looks weakest — the mid-sized operator with no platform and no airport — is the one most likely to be acquired, because the buyer is not buying bays but the contract book and the reservation integration. Pheonix expects further consolidation along the operator-platform seam through 2033, with the scarce asset being the airport concession and the second-scarcest being a booking engine already certified against multiple PARCS systems.
Value Chain
8. Value Chain
The chain runs from a piece of land to a confirmed booking, and each stage captures a different kind of margin. Reading the chain correctly is what separates an operator’s view of this market from an investor’s, because the stage with the least capital captures the most pricing power.
| Stage | Who sits there | How it is paid | Margin character |
|---|---|---|---|
| Land and capacity | Airport authority, landowner | Concession rent, revenue share, or direct operation | High, fixed, concession-cycle risk |
| Operations and labour | Contracted operator | Management fee, lease spread, or revenue share | Thin and volume-sensitive |
| Access perimeter | PARCS and ANPR vendors | Equipment sale, licence, per-transaction fee | Moderate, sticky, replacement-cycle |
| Reservation engine | Platform vendor or in-house | SaaS fee, per-booking fee, or bundled | High gross margin, integration moat |
| Distribution | Brand site, aggregators, travel intermediaries | Commission and booking fee | High gross, high acquisition cost |
| Ground transport | Operator, shuttle contractors | Bundled in the parking price | Low, labour and fuel exposed |
| Energy and ancillary | Operator, charging networks | Per kWh, per wash, per amendment | Rising, attachment-dependent |
The landowner sets the shape of everything downstream. An airport decides, once a decade, whether to operate parking itself, lease the asset, or grant a management contract. In the United States the default has increasingly been direct operation with a contracted management layer, which is why an operator can report collecting USD 2 billion of parking revenue for its airport partners while the airports themselves remain the economic owners of the asset. In Europe the concession and lease models dominate, with revenue share or minimum guaranteed rent. The contract form determines who bears demand risk, who funds capital, and — critically — who is allowed to set price.
Operations is the thinnest margin in the chain and the most exposed to input costs. Labour, fuel, insurance, maintenance and the shuttle fleet are all operator costs, and none of them scale down when a stay is cancelled. This is why operator economics improve with density — 70-plus airport locations let Metropolis spread fleet maintenance, procurement and management overhead across a large base — and why small operators in single airports are structurally fragile. It is also why the off-airport model is a transport business first: The Parking Spot’s promise is continuous shuttle service to the terminal, and the operating cost of that promise is the business.
The access perimeter is the quiet chokepoint. A reservation must become a physical permission: a barrier that opens, a plate that is recognised, a session that starts and stops. Where that handshake is poor, the customer experiences the failure at the exit, in the rain, with a queue behind them. Pheonix’s reading of booking funnels and operator disclosures suggests that the quality of PARCS integration — not price — is the main determinant of which platform an operator will license, and that this is why hardware vendors such as SKIDATA, Amano, Flowbird, HUB and Designa retain pricing power well above what a commodity supplier would command. The barrier is not a commodity if the booking layer depends on it.
The reservation engine is where the economics invert. It requires no asphalt, no staff and no shuttles, and it earns a fee on every booking that passes through it, whether or not the bay was full. Its costs are integration, certification and support. Its asset is the price curve: the mapping of how much inventory to release at what price at which lead time, and the ability to change both without retendering a concession. That curve is now the most valuable intellectual property in the market, and it is why an operator will pay for a platform and a platform will pay for software.
Distribution is the stage with the widest spread and the most competition. A brand site sells its own inventory at the highest net yield; an aggregator sells the same inventory at a discount and takes a commission; a travel intermediary bundles parking with a hotel night and takes a margin on the bundle. The three channels coexist inside the same airport, which means the same bay is simultaneously on sale at three prices — a situation that is normal in airline distribution and still relatively new in parking. Pheonix’s interviews with airport commercial teams indicate that managing channel conflict, rather than acquiring more channels, is now the main commercial headache in the segment. On the corporate and fleet side of that same channel, the payment rails that settle a transaction against a vehicle rather than a cardholder are mapped in the Global Fuel Card & Fleet Payment Solutions Market 2026–2033.
Where the chain is being re-cut. Two integrations are underway. Horizontal integration joins the operator to the platform, so that the party holding the barrier also holds the booking. Vertical integration joins the airport to the customer, so that the landowner keeps the account rather than renting it from an intermediary. Both are attempts to own the same thing — the customer record and the price decision — and neither has won. What is settled is that the stage which neither integrates nor owns a scarce asset, the mid-sized operator with a fixed tariff and no booking engine, is the stage under the most pressure.
Supply-chain note. The physical supply chain here is short: civil works, access hardware, payment terminals, vehicles and fuel. Scarcity sits in two places only — certified integration with installed PARCS estates, and skilled parking operations management at airport scale. Everything else is procurable. That is the honest summary of where negotiating power lies in this chain, and it is why the market’s M&A has been about capability rather than about capacity.
Investment Activity
9. Investment Activity
Capital in this market moves along two tracks that are rarely discussed together, because the asset-heavy track is invisible in deal flow and the asset-light track is small in absolute terms. The first is airport capital expenditure on garages, access systems and shuttle fleets. The second is acquisition capital moving into the companies that own the booking. Both are rising, and they are connected: an airport that has just spent nine figures on a multi-storey deck has a strong reason to make sure the deck is priced properly, which means buying or building yield capability.
The clearest signal is the direction of acquisition. The most consequential deal in the market was an operator buying a platform: Metropolis’s completion of the SP Plus acquisition in May 2024 brought with it a national operations footprint and a reservation engine, and the company’s own account of the period since describes two years of investment in the passenger experience from home to curb — reservations, optimised pricing and shuttle operations as one product. That is not a parking acquisition. It is the acquisition of a distribution channel by an operator that had the contracts but not the bookings.
The same logic runs at smaller scale through the travel-intermediary layer. Holiday Extras holds Park-IT and Chauntry’s Parkspace inside its group — a reservation and inventory system sold to car-park operators — alongside a consumer business turning over GBP 436.8 million. Owning the software as well as the funnel means the group earns whether the traveller books direct or the operator books direct, which is a rational hedge for a business whose own revenue fell 11.5 per cent in its most recent year. On the hardware side, the acquisition of Flowbird by EasyPark Group, with the combined business now trading as Arrive, consolidates payment and access across on-street and off-street estates and puts a payments balance sheet behind a barrier manufacturer.
Why the booking is the scarce asset. Bay capacity in a mature market is fixed and locally monopolistic; a concession is won on a ten-year cycle and lost the same way. What changes hands more easily, and what compounds in value, is the certified ability to price and sell capacity across multiple operator systems. A reservation engine that already talks to SKIDATA, Amano, Flowbird and HUB installations is worth more to a buyer than an operator with a hundred car parks and no integration, because the integration is the part that takes years and cannot be bought at a reasonable price twice.
Airport capital expenditure is the other half of the story, and it is being financed on parking. In the United States, parking revenue is airport revenue within the meaning of 49 U.S.C. 47107(b) and 47133 and Grant Assurance 25, and is therefore available for airport capital and operating costs and for nothing else. That ring-fence is a credit positive: it makes parking a dedicated revenue stream behind airport debt rather than a pot an airport’s owner can raid. It is also why airports invest directly in parking capacity in a way they rarely do in retail, and why the parking line is scrutinised by bond investors as a separate instrument. Aena’s litigation over whether it must disclose detailed airport-parking revenue — a case that reached Spain’s Supreme Court — is best read as a dispute about exactly that: how much of a ring-fenced, debt-supporting revenue line must be shown separately to the market that lends against it.
What the capital is being spent on. Four categories account for most of it. Barrier-free access infrastructure, because number-plate entry and exit removes both the ticket and the staffed booth and converts every entry into a data event. Reservation and pricing software, because the margin difference between a fixed tariff and a managed one is larger than the cost of the software by an order of magnitude. Shuttle fleet renewal and electrification, because the off-airport model’s cost base is diesel and drivers. And charging infrastructure in long-stay decks, which is the one capital item that both raises the ticket price and hedges the substitution risk from ride-hailing, since a charged car is a reason to drive to the airport rather than be dropped at it.
How the two pools should be valued differently. The gross pool turns over USD 23.14 billion in 2026 and grows at 7.54 per cent; it is a real-asset business with concession risk, labour exposure and bond-like cash flows at the airport level. The fee pool turns over USD 0.37 billion and grows at 15.88 per cent; it is a software business with high gross margins, low capital intensity and a customer-acquisition cost that is paid once per booking. Any investor valuing the two on the same multiple is mispricing both. The fee pool’s absolute size also caps the size of the deals available in it, which is precisely why platform assets change hands inside larger operator acquisitions rather than as standalone transactions.
Three things that would move capital the other way. Airport in-housing of the booking channel, which converts a platform from a toll collector into a supplier and is already visible at airports running their own reservation systems and loyalty programmes. Price-transparency enforcement, which compresses the fee headroom a platform can add at checkout. And continued ride-hailing penetration, which shrinks the volume the fee is charged on. Pheonix’s conversations with concession bidders indicate that bid models now carry the reservation channel as a separate line rather than inside the parking revenue build — a change from five years ago, and the clearest evidence that the market itself has accepted the split this report is built on.
Technology & Innovation
10. Technology and Innovation
The innovation in this market is not in the hardware and it is not in the cars. It is in the handshake between a booking and a barrier, and in the pricing decision that sits behind it. Judged by patents, nothing much is happening; judged by unit economics, a great deal is. Pheonix rates innovation intensity high and patent activity low for exactly this reason — the improvements are process and data improvements, and they are protected by integration and contract rather than by claims.
The barrier is dissolving into the number plate. The ticket, the booth and the cash drawer are being replaced by a camera at the entry, a camera at the exit and a record that ties the two to a booking. It is a better product for the driver — no ticket to lose, no queue to pay — and a better product for the operator, because it removes labour from the most expensive point in the process and makes every entry a data event. It is also the precondition for everything else in this chapter: you cannot run dynamic pricing on an estate that cannot identify who is in front of it. The technology itself is mature and supplied by established vendors; what is scarce is the certified integration between the reservation system and the installed access-control estate, which is different at every airport and often different within one airport.
Pricing has moved from a tariff to a curve. The most consequential operational change in the last decade is that airports stopped publishing a rate and started managing a yield. The Transportation Research Board’s 2025 study of airport parking reservation systems documents Phoenix Sky Harbor implementing automated pricing that pulls demand data from its access-control and booking systems and adjusts rates by historical utilisation, demand, season, day of week, weekday versus weekend and stay duration. That is airline revenue management applied to asphalt, and it is only possible because the booking system and the PARCS talk to each other. The same study records average revenue per online transaction at Phoenix rising from USD 72 in 2019 to USD 87 in 2023 — a 21 per cent increase in realised yield over a period when the product did not change at all.
Inventory release is now a managed variable rather than a policy. Phoenix releases roughly 20 to 25 per cent of its inventory across products to its online booking system; New Orleans doubled its released share from 10 to 20 per cent in response to demand. The sophistication is in the segmentation of that release: release more long-stay inventory early at a discount and hold short-stay inventory back, or the reverse in a market with constrained supply. Managing that curve requires a forecast of no-shows, and no-show prediction is the least visible and most valuable piece of software in the market — a pre-booked bay that nobody occupies is worse than an unsold one, because it was sold at a discount and cannot be resold.
Mobile and account-based distribution has changed who the customer is. Dallas Fort Worth sells parking through its own app and admits pre-booked customers through dedicated lanes; Charlotte runs a loyalty programme with over 250,000 members; Phoenix holds more than 140,000 accounts in its reservation system. Each of those is a direct relationship that reduces dependence on an intermediary, and each depends on the booking platform being able to authenticate a returning customer and price to them individually. In this market the account is worth more than the app, and the app is worth more than the website.
Electrification is the most underrated technology shift, because it prices dwell rather than distance. A car in a long-stay deck is stationary for two to fourteen days, which is the ideal duty cycle for slow charging at low cost and high utilisation. Operators have begun bundling charging into the stay rather than metering it, which raises the package price without repricing the space, and using it as a retention product on the pre-booked segment where the customer is identifiable. The technical constraint is grid capacity at the garage rather than the chargers themselves, which makes this a capital-planning problem at the airport rather than a purchasing decision by the operator — and therefore slow, uneven and a durable source of differentiation between airports that planned for it and those that did not.
Payment is the least glamorous and most fragile layer. Strong customer authentication under the second Payment Services Directive applies to card-not-present bookings in Europe, which means the payment step is where a funnel leaks. Stored cards, tokenisation and plate-linked wallets all exist to remove friction at that step, and every one of them adds a data-protection obligation. Chargebacks on cancelled travel are a real cost line in a business where trip cancellation is common and the terms are contested, and Pheonix’s review of booking terms across the segment found wide variation in cancellation windows — a commercial differentiator that is presented as customer service and functions as risk transfer.
What is not yet happening, and should be watched. There is no common open standard for the reservation-to-PARCS interface across vendors, so every new operator integration is a project. Standards work in adjacent areas of mobility suggests this will eventually be solved, and the vendor that opens its interface first trades lock-in for distribution. Autonomous vehicles remain a long-horizon substitution risk rather than a technology question for this forecast period; the nearer-term version is a robotaxi drop-off that consumes kerb space and reduces the case for parking a car at all. And forecasting quality — the ability to predict both demand and no-shows at product level — is where the next genuine margin improvement will come from, because everything else in the chain is already instrumented.
Market Risk
11. Market Risk
The risks in this market are asymmetric in an unusual way: the physical business is exposed to volume, and the platform business is exposed to regulation. A single operator can absorb a bad traffic year; it cannot absorb losing a concession. A platform can survive a bad traffic year easily, because its fee base is small and diversified across sites, but it cannot survive a rule change that removes the fee from the checkout page. This section sets out the material risks in that frame.
| Risk | Likelihood | Impact | Who carries it |
|---|---|---|---|
| Ride-hailing and autonomous substitution of drive-up parking | High | High on volume, moderate on value | Operators and airports |
| Price-transparency and drip-pricing enforcement | High | Moderate | Platforms and intermediaries |
| Concession loss or re-tender on worse terms | Medium | Severe, site-concentrated | Operators |
| Air-traffic shock (pandemic, conflict, tariffs) | Medium | High, temporary | All parties |
| Data protection and cyber exposure from ANPR | Medium | Moderate to high | Operators, airports |
| Labour and fuel cost inflation | High | Moderate, margin-compressive | Operators, especially off-airport |
| Airport in-housing of the booking channel | Medium | High for platforms | Platforms and intermediaries |
| Capex overrun or planning refusal on new decks | Medium | Moderate | Airports |
Substitution is the defining risk and it is already measurable. Nearly 30 per cent of Logan’s passengers used a ride-app in 2024, the most common single access mode at that airport, and Massport’s own framing of its fee increases — to influence behaviour and fund ground-transport investment, with the stated aim of moving more people in fewer vehicles — is a policy that deliberately shrinks the parking market per passenger. Pheonix models volume growth at 2.98 per cent against passenger growth of 3.4 per cent precisely because of this wedge. The offsetting factor is that the airport captures a ground-transport fee instead, but that fee is not parking revenue, does not appear in this market’s value, and does not accrue to the parking operator.
Price-transparency enforcement is the risk the platform layer systematically underweights. Under the Digital Markets, Competition and Consumers Act 2024, the CMA’s price-transparency guidance requires the total price up front, treats hidden mandatory charges as an omission, and carries penalties of up to 10 per cent of turnover or GBP 300,000. A pre-booked parking product that quotes a daily rate in the search results and adds a booking or administration fee at checkout is squarely within scope. The commercial consequence is not just compliance cost: the fee is a revenue line, and removing it from the checkout either raises the displayed price — hurting conversion — or removes the margin. Pheonix expects the winners in the UK and EU to be platforms that have already rebuilt their pricing to a total-price basis and can show a lower headline number as a result.
Concession concentration is the risk that ends companies. A parking operator at a single airport is a business with one customer. Contract terms typically run five to ten years with revenue-share or minimum-guarantee structures, and re-tender is competitive, political and frequently influenced by local employment considerations. The loss of a major concession is not a bad year; it is a step change in the asset base. This is the main reason operators diversify across sites and why the largest have 60 to 70-plus airport relationships rather than a handful.
Air-traffic shocks hit gross value harder than they hit fees. ACI World’s long-term forecast assumes 3.4 per cent annual growth to 2043, but its own commentary lists geopolitical tension, economic instability, tariffs and supply-chain bottlenecks as short-term drags, and the 2020-22 period demonstrated that passenger traffic can fall by more than half and take four years to recover. In a severe shock, gross parking revenue falls with passengers and with the discretionary long-stay trip; platform fee revenue falls proportionately but from a much smaller base, and the platform’s fixed costs are lower. The asymmetry favours the asset-light layer in a downturn and the asset-heavy layer in a recovery.
Data protection is a live operational risk because of how the product is delivered. The UK Information Commissioner’s guidance on automatic number-plate recognition is explicit that a vehicle registration mark is, in most circumstances, personal data, that a data protection impact assessment is expected before deployment, that camera numbers should be minimised, that signage must be prominent and that retention must be governed. A booking platform that stores plate data to enable barrier-free exit is a controller of personal data with a retention obligation, and a breach at a multi-airport operator is a multi-jurisdiction incident. This is a risk that grows in direct proportion to the success of the barrier-free model.
Labour inflation is the operator’s permanent headwind. Metropolis employed more than 5,000 people in its aviation operations in 2025; the off-airport model is built on continuous shuttle service. Wages are the largest controllable cost in the chain and the least compressible, since the service promise is a person in a vehicle. Automation helps at the barrier and in the back office, not on the shuttle.
The disintermediation risk runs the other way for platforms. Every investment an airport makes in a first-party booking channel and loyalty programme reduces the platform’s share of that airport’s bookings. Charlotte’s 250,000-member programme and Dallas Fort Worth’s million-customer pre-book base are not marketing exercises; they are the airport building a direct relationship so that it does not have to rent one. Pheonix regards this as the most underappreciated structural risk in the market and treats it as the reason the fee pool’s 15.88 per cent growth should be read as a forecast with a wide band rather than a trend line.
Regulatory Landscape
12. Regulatory Landscape
Regulation in this market operates on three frontiers, and only one of them is about parking as most people understand it. The first is the contract frontier: how an airport may grant, structure and account for a parking concession, and what it may do with the money. The second is the funnel frontier: how a pre-booked price must be displayed to a consumer. The third is the camera frontier: what an operator may do with a number plate. A business in this market can be fully compliant on the first and fail on the third without noticing.
| Instrument | Jurisdiction | What it settles |
|---|---|---|
| 49 U.S.C. 47107(b) and 47133; Grant Assurance 25; FAA Order 5190.6C ch. 15 | United States | Airport revenue, including parking, may be used only for airport capital or operating costs |
| ADA 2010 Standards for Accessible Design, sections 208 and 502 | United States | Accessible space ratios and accessible routes in parking facilities |
| Digital Markets, Competition and Consumers Act 2024; CMA price-transparency guidance (CMA209) | United Kingdom | Total price must be shown up front; drip pricing unlawful; penalties up to 10% of turnover or GBP 300,000 |
| Parking (Code of Practice) Act 2019 | United Kingdom | Code governing private parking enforcement, including ANPR-based charges |
| UK GDPR and Data Protection Act 2018; ICO ANPR guidance | United Kingdom | Vehicle registration marks as personal data; DPIA, signage, minimisation and retention duties |
| GDPR (EU) 2016/679; ePrivacy Directive 2002/58/EC | European Union | Lawful basis, retention, tracking consent |
| Omnibus Directive (EU) 2019/2161 | European Union | Price presentation, including total price and price-reduction claims |
| PSD2 (EU) 2015/2366 | European Economic Area | Strong customer authentication on card-not-present bookings |
| Directive 2014/23/EU on concession contracts | European Union | Award of airport parking concessions |
The contract frontier is where the economics are decided. In the United States, Congress first restricted the use of airport revenue in the Airport and Airway Improvement Act of 1982, and the rule survives today in 49 U.S.C. 47107(b) and 47133, enforced through Grant Assurance 25 and the FAA’s compliance manual: all revenues generated by a public airport must be expended for the capital or operating costs of the airport, the local airport system, or other facilities directly related to air transportation. Parking revenue is airport revenue. It cannot be paid to a city’s general fund, it cannot be used to hold down local taxes, and it cannot be redeployed outside the airport enterprise. The commercial consequences are larger than they look. Parking becomes a cost-recovery instrument, so an airport has a structural reason to keep the service in-house or under tight contractual control rather than to extract maximum rent from a third party. It becomes security for airport debt, so bond documents will specify how the parking line is reported and what covenants attach to it. And it becomes politically visible, because any change in parking charges is a change in a ring-fenced public revenue stream.
Concession structure follows from that. A lease transfers demand risk and capital to an operator but takes pricing control away from the airport. A management contract keeps control and risk with the airport and pays a fee. A revenue share splits the difference and is the form most common in European airports. Each has a different regulatory exposure: a lease looks more like a property transaction, a management contract more like a services procurement, and a concession more like an award of a right to exploit a public asset, which in the European Union brings Directive 2014/23/EU and its publication, duration and risk-transfer requirements into play. The procurement route matters commercially because it determines how long a contract can run, and a ten-year concession is what makes an airport worth entering for an operator with capital to deploy.
The funnel frontier is new and it is where the platform layer is exposed. The UK’s Digital Markets, Competition and Consumers Act 2024 replaced a consumer-protection regime enforced case by case with one where the competition authority sets out what compliance looks like in advance. Its price-transparency guidance requires the total price to be given up front in any invitation to purchase, treats a mandatory charge — a booking fee, an administration fee, a compulsory surcharge — as something that must be inside that total, and states that hiding such charges until later in the process is unlawful. The penalty ceiling is 10 per cent of turnover or GBP 300,000, whichever is greater, and the regime applies to anyone who advertises or promotes a product at any point in the purchase process, which includes an aggregator as much as an operator. In the European Union the Omnibus Directive 2019/2161 has moved in the same direction on price presentation and on how reductions may be claimed.
There is a second-order effect that matters more than the fine. A platform whose economics depend on a checkout fee cannot simply delete the fee; it must either raise its headline price, which damages conversion against a rival that bundles the fee in, or absorb the cost. Pheonix regards the total-price requirement as the single largest regulatory force acting on platform margins in this market over the forecast period, and it is live in the UK now.
The camera frontier is the one most operators are least prepared for. Barrier-free operation requires reading a number plate at entry and at exit, storing it against a booking, and retaining it long enough to resolve disputes. The ICO’s ANPR guidance treats a vehicle registration mark as personal data in most circumstances and expects a data protection impact assessment, a documented and justifiable camera count, prominent signage with contact details, retention and disposal policies, and governance able to answer subject access requests. It also points to the Surveillance Camera Code of Practice where that applies. In the UK, enforcement charges issued using ANPR data sit under the Parking (Code of Practice) Act 2019 as well, so the same plate read is simultaneously a payment token, a personal-data record and, potentially, the basis of a penalty charge.
One further frontier worth naming: ground access. Local ground-transport policy can reprice a market without touching parking regulation at all. Massport’s decision to raise the Logan ride-app fee from USD 3.25 to USD 5.50 per trip from July 2025 and USD 7.50 from July 2027 was taken under airport ground-transport authority, not parking law, and it changes the relative cost of the two competing access modes directly. Similar kerb-pricing structures exist at European and Australian airports. For a parking operator, this is the regulatory risk that arrives from a different department.
Assessment. Compliance cost in this market is small relative to gross revenue and material relative to platform fee revenue — the ratio that matters. The jurisdictions with the most demanding funnel rules, the UK and the EU, also happen to be those where pre-booking is most mature, which means the burden falls exactly where the margin is thinnest. Pheonix expects regulatory complexity to remain high through 2033 and to increase on the data and pricing dimensions rather than on the concession dimension, where the rules are old, settled and understood.