
Global Curb & Kerbside Management Market Report, Size, Share and Forecast 2026–2033: Ninety-Four Per Cent Parking by Default — the Curb Is a Schedule, Not a Car Park
1. Market Snapshot
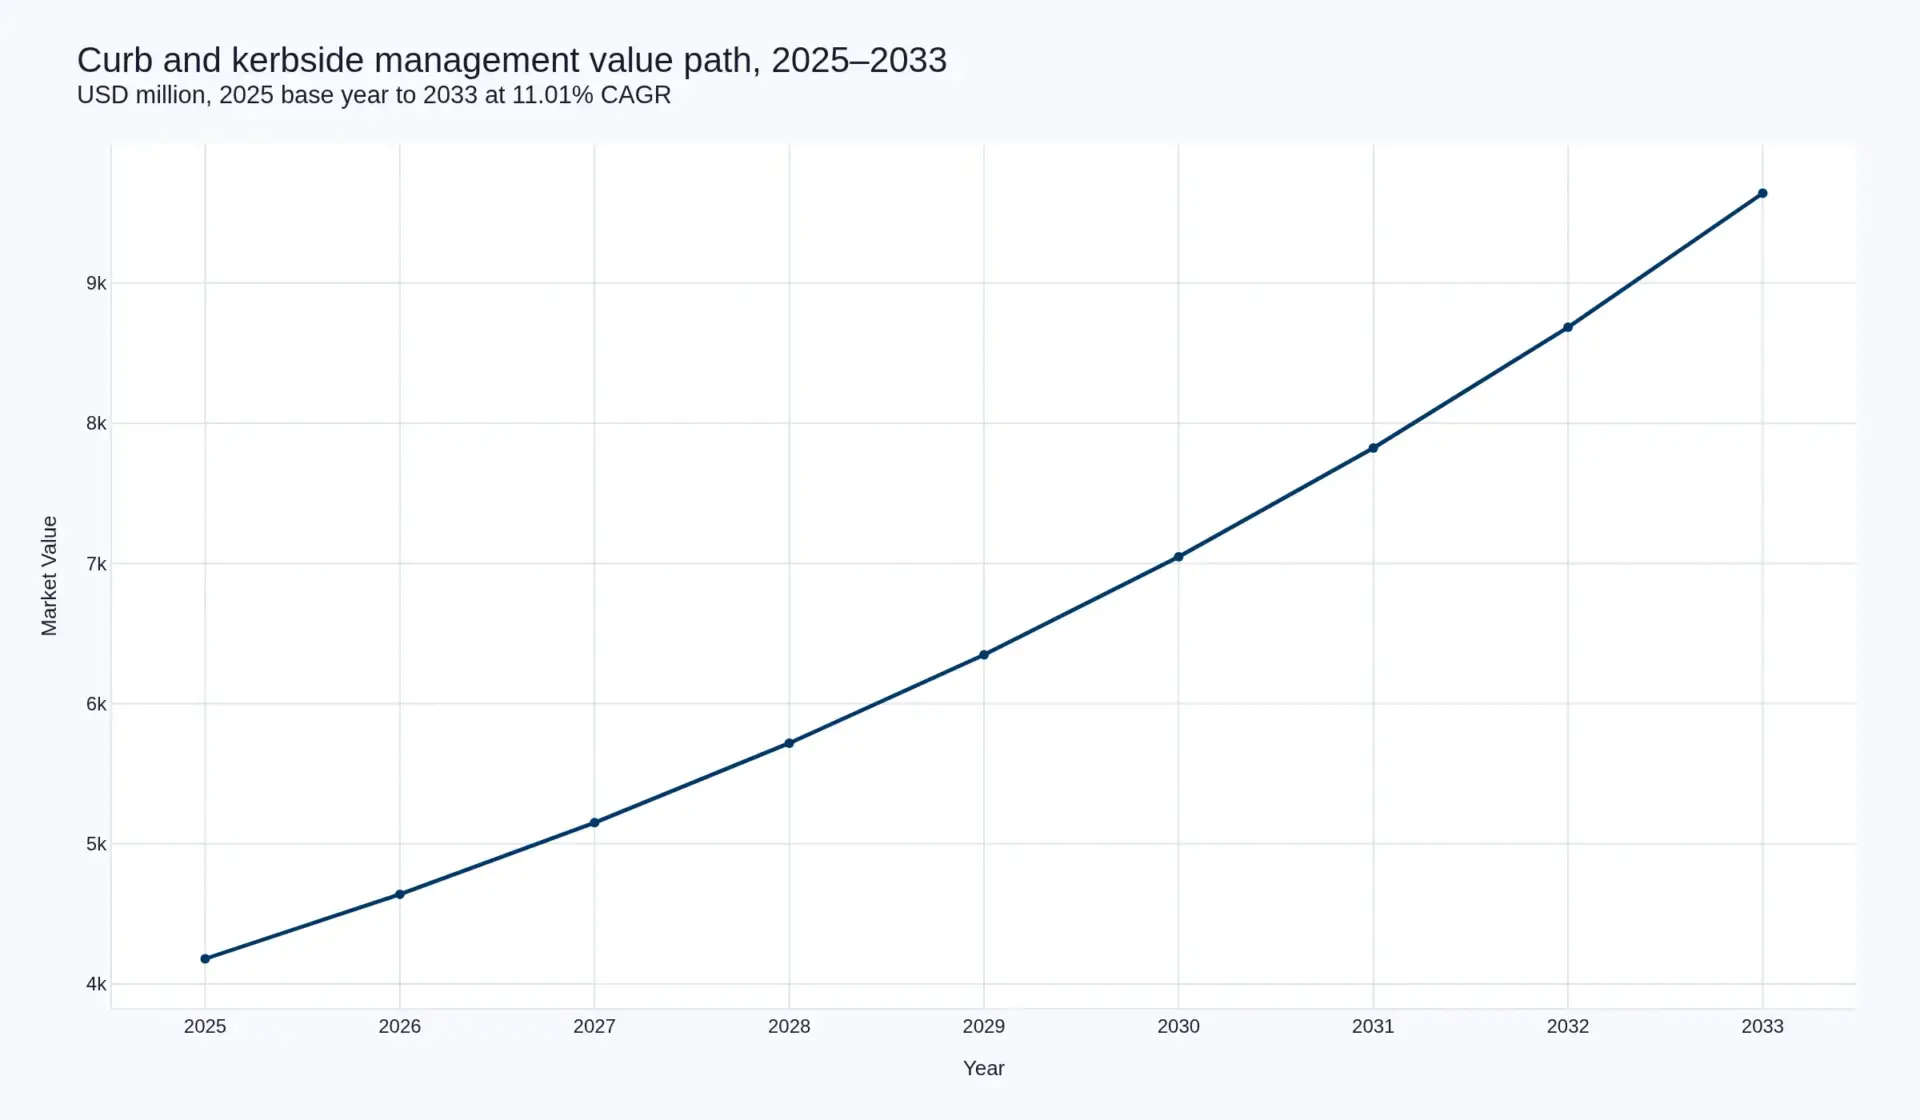
Curb and kerbside management is a USD 4.18 billion market in 2025 — the base year for this forecast — and USD 4.64 billion in 2026, its first forecast year. By 2033 it reaches USD 9.64 billion, a compound annual growth rate of 11.01 per cent measured from that 2025 base. The volume line underneath the value line runs materially faster: 9.2 million kerbside bays and zones under some form of digital management in 2025, 10.6 million in 2026, and 28.6 million by 2033 — 15.23 per cent a year. That divergence, four points wide, is the report.
Those two opening figures are the same line one year apart, not two estimates. USD 4,180 million grown at this report's own 11.01 per cent is USD 4,640 million. The stat block at the head of this page prints the base-year value — USD 4,180 million on 9.2 million managed bays — while the tables and the narrative below are stated on 2026, the first forecast year, unless the text says otherwise. The base is a bottom-up construction described in section 3 and in the method note, not a borrowed headline: it is built from installed payment and enforcement estates, sensor and camera deployments, municipal software and permit contracts, and the freight-booking systems now attached to loading zones. Where a figure is a Pheonix estimate rather than a disclosed one, the text says so at the point of use.
| Indicator | 2025 (base year) | 2026 | 2033 | Change, 2025–2033 |
|---|---|---|---|---|
| Gross market value, USD million | 4,180 | 4,640 | 9,640 | +130.6% · 11.01% CAGR |
| Managed kerbside bays and zones, million | 9.2 | 10.6 | 28.6 | +210.9% · 15.23% CAGR |
| Spend per managed bay, USD | 454 | 438 | 337 | −25.8% · −3.7% a year |
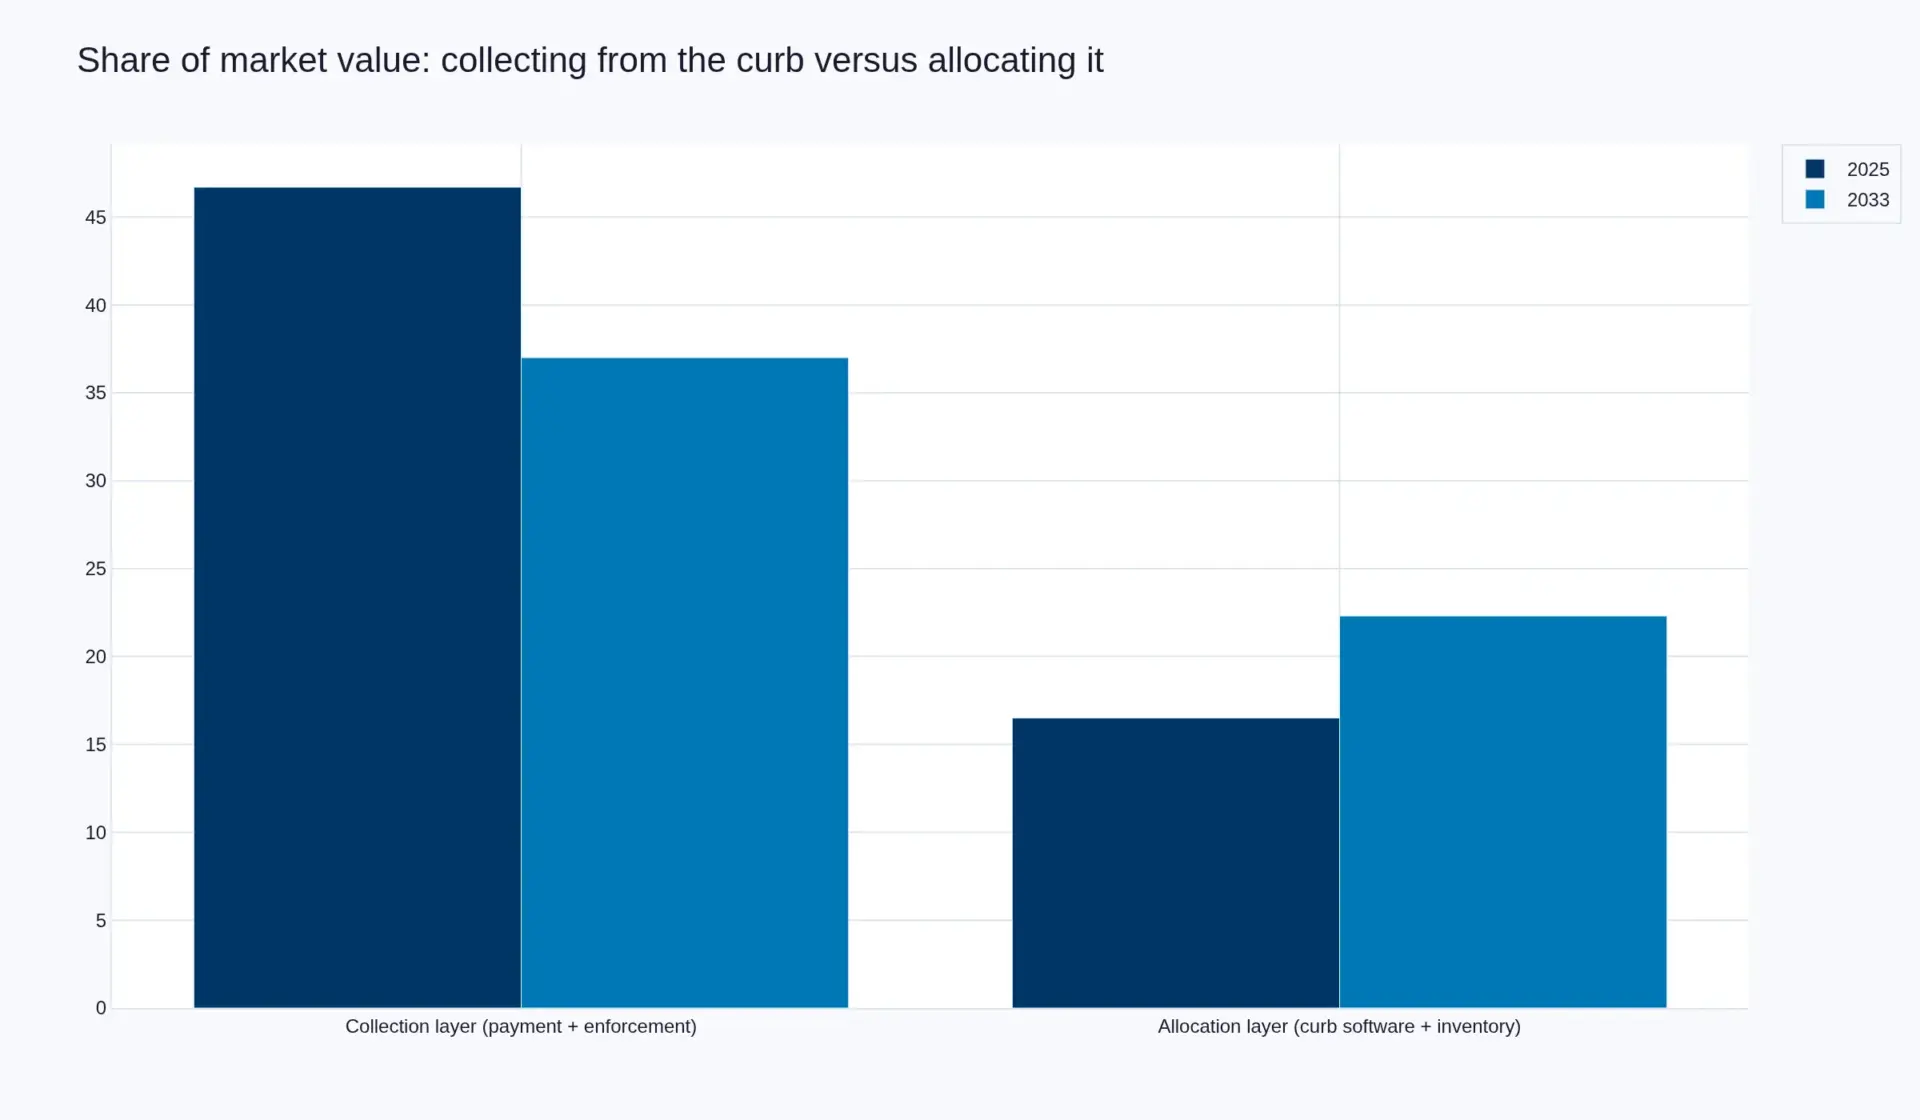
| Collection layer share of value (payment plus enforcement) | 46.7% | — | 37.0% | −9.7 points |
| Allocation layer share of value (curb software and inventory) | 16.5% | — | 22.3% | +5.8 points |
| Forecast period | 2026–2033 | 8 years from base | ||
Source: Pheonix Research model on the 2025 base year. Value and volume are constructed in section 3; the collection and allocation shares are computed in section 5. Managed-bay counts cover bays and zones carrying a digital record — a meter, an app product, a sensor, a camera, a permit or a booking slot — not every mark on every kerb.
What is being counted matters more here than in most markets, because the kerbside is not an industry with a trade association and a shipment count. This report counts spend on the systems and services that allocate, price, monitor and enforce use of the curb lane: on-street payment and access systems; curb sensing, camera analytics and plate recognition; curb management software and digital inventory; enforcement systems and processing; freight and loading-zone management; and the advisory and managed-operations work attached to all five. It does not count the parking tariff itself, which is a transfer from a driver to a municipality rather than a purchase of a management system, and it does not count off-street car parks. A city that collects USD 40 million in meter revenue and spends USD 2 million operating the system contributes USD 2 million to this market, not USD 42 million.
Two facts set the boundaries of everything that follows. The first is what the kerb is used for today. Lambeth Council's Kerbside Strategy, adopted in 2023, measured the borough's own kerbside — an asset it describes as one of the largest pieces of public property it controls, equivalent in area to 194 football pitches — and found that 94 per cent of it is used to provide and manage car parking. That is not a decision anyone took. It is the residue of a default: a painted line, a tariff schedule and an enforcement regime that arrived one street at a time over seventy years. The second is that the systems managing that default are, overwhelmingly, systems for collecting money and issuing penalties rather than systems for allocating time. In 2025, payment and enforcement together account for 46.7 per cent of what is spent on the curb; software that actually allocates it accounts for 16.5 per cent.
Both of those numbers move in the forecast, and neither inverts. Collection falls to 37.0 per cent of a much larger market by 2033 while allocation rises to 22.3 per cent — the direction is right and the crossing does not happen inside this window. By 2033 the curb will still be a market that mostly pays for itself to be policed, with a growing analytics and inventory layer bolted on. That is the shape a buyer, a vendor or a city needs to price against, and it is exactly the shape the current procurement cycle rewards.
The volume figure deserves the same scrutiny as the value figure, because it is the one a reader is most likely to take on trust. Nine point two million managed bays is not a count of every marked space in the world; it is the number of bays and zones that carry a digital record of some kind in the 2025 base year — a metered space, an app-listed space, a bay covered by a sensor or a camera, a permitted zone on a register, or a loading slot that can be booked. The distinction matters because the two categories grow at different rates: physical bays are roughly fixed in the short run, while the share of them carrying a digital record is the variable that produces 15.23 per cent growth. A city that puts its kerb on a permit register can add thousands of managed bays in a year without laying a single metre of asphalt, and most of the growth in this forecast is of that kind rather than new kerb being built.
It is also worth being explicit about what the value figure omits, because the omission is systematic rather than accidental. The staff time of the highway engineers who write the orders, the legal cost of making them, the internal analytics that decide a tariff band and the political cost of changing it are all real expenditure on managing the curb, and none of them appears as a line in any procurement. This report counts what is bought from suppliers, which is the only definition that can be measured consistently across jurisdictions. A reader who wants the total social cost of kerb administration will find this number too low. A reader who wants the addressable vendor market will find it, by construction, exact.
2. Executive Summary
The kerbside is the most contested three metres in any city and the least governed. It carries the bus stop, the loading bay, the taxi rank, the cycle hangar, the parklet, the charge point, the scooter corral, the accessible bay and — for the overwhelming majority of its length — the parked car. Lambeth's own measurement, that 94 per cent of its kerbside is given over to providing and managing car parking, is the clearest published statement of what the default looks like when nobody schedules it. Every other use competes against a line that was already painted.
The market that has grown up to manage this is large, growing, and pointed at the wrong half of the problem. It is worth USD 4.18 billion on the 2025 base year and reaches USD 9.64 billion by 2033 at 11.01 per cent. But the money sits where the revenue is, not where the decision is. Payment systems and enforcement — the apparatus that charges a vehicle for occupying a bay and penalises it when it does not pay — take 46.7 per cent of 2025 spend. The software that could reallocate the bay, publish the rule, price the hour and hand the slot to a delivery van instead of a saloon car takes 16.5 per cent. A city buying "curb management" in 2026 is, more often than not, buying the means to collect from the curb rather than the means to govern it.
The volume line tells the more useful story. Managed bays grow 15.23 per cent a year against 11.01 per cent for value, which drives spend per managed bay down from USD 454 in 2025 to USD 337 in 2033 — a 25.8 per cent decline. This is a coverage market, not a pricing market. What sells is the cheapest credible way to bring another stretch of kerb into a digital record, and what that favours is the instrument that costs nothing to install: a camera already pointed at the street, an existing enforcement vehicle, a phone in a driver's hand, a permit register that already exists. It does not favour burying a sensor in every bay. The distinction is the same one that governs the adjacent occupancy-sensing market, and it explains why the hardware lines in this report grow more slowly than the software lines despite the market being, on the surface, an instrumentation story.
Freight is the force that makes the case for scheduling rather than parking. Research from the University of Washington's Urban Freight Lab, tracking 2,900 commercial-vehicle trips in downtown Seattle, found delivery vehicles spending an average of 2.3 minutes cruising for somewhere to stop on each trip, equal to 28 per cent of total trip time — and, critically, that cruising fell where more curb space was given to commercial loading zones and paid parking, and rose where more was given to bus stops. That is a direct, measured return on allocation. A city that reallocates kerb space from general parking to loading does not lose the trip; it removes a quarter of it. It is the single most defensible economic argument in this market, and it is almost never the argument the procurement is built around.
The standards layer has consolidated faster than the commercial layer. The Open Mobility Foundation's Curb Data Specification moved to version 1.1 with real-time event tracking and digital curb inventory models, tested by an inaugural cohort of ten cities, and in March 2026 the Foundation named a second cohort of fourteen cities and one county — including Bergen, Dublin, Montréal and Boston alongside American incumbents such as San Francisco, Seattle and Washington, DC. A common data model for curb zones, events and regulations is no longer speculative. What it changes is the cost of switching: once a city's kerb is described in a shared schema, the inventory becomes portable and the platform becomes replaceable, which is precisely why the collection layer, built on installed estate and multi-year processing contracts, is defending a position the allocation layer does not have to defend.
The fiscal frame is the constraint nobody prices. In England and Wales, section 55 of the Road Traffic Regulation Act 1984 requires a local authority to keep a parking account and restricts what any surplus may be spent on, and deficits are made good from the general fund. Parking is not a profit centre; it is a hypothecated cost-recovery instrument with a statutory list of permitted uses. The United States arrives at a similar place through municipal budget practice and state enabling law. That matters to this market because it determines who can buy: a city that cannot book a surplus against a sensor rollout must find the capital somewhere else, which pushes procurement towards anything that pays for itself in enforcement revenue, and away from anything that only pays for itself in kerb performance.
The forecast therefore carries a specific expectation. Allocation-layer spend grows at 15.3 per cent a year, faster than any other line, and still does not overtake the collection layer inside the window. The event that would change that is not a technology event. It is a legal one: a jurisdiction that treats the kerb as a schedulable public asset with published rules and priced time, rather than as a parking account with a compliance function attached. Until that instrument exists somewhere large, the market will keep growing the way it has — 15 per cent more kerb, 11 per cent more money, and a little less revenue per bay every year.
3. What This Market Actually Sells
The phrase "curb management" describes a software category that most cities do not buy. What they buy is narrower and older: the right to charge for time in a place, the evidence to penalise a vehicle that takes the time without paying, and — much less often — the ability to decide who gets the time in the first place. Those are three different products with three different buyers, three different budget lines and three very different growth rates, and conflating them is the single most common error in reading this market.
The unit of account is not the bay. It is the bay-hour, and everything in this market is an attempt to price, prove or allocate one. A pay-and-display machine, a phone app, a camera on a pole, an in-ground puck, a permit register, a loading-zone booking slot and a digital twin of a kerb profile are all instruments for answering the same question about the same hour of the same three metres. What differs is which part of the answer they supply. Payment instruments price the hour. Enforcement instruments prove what happened in it. Allocation instruments decide who may have it. The market's centre of gravity sits with the first two, and the forecast in section 5 measures exactly how slowly that centre is moving.
| What is bought | Question it answers | Revenue model | Who signs |
|---|---|---|---|
| Payment and access systems | What does this hour cost, and has it been paid? | Device sale plus maintenance; app commission | Parking operations |
| Sensing, camera analytics and plate recognition | What is in the bay, and for how long? | Hardware plus subscription; per-query fees | Enforcement or IT |
| Curb software and digital inventory | What is this piece of kerb for, and who may use it? | Per-bay or per-street subscription; project fees | Transport planning |
| Enforcement systems and processing | Who is in breach, and can we prove it? | Per-transaction; outsourced service | Enforcement and finance |
| Freight and loading-zone management | When may a vehicle stop here, and for how long? | Booking fees; operator subscription | Freight and highways |
Source: Pheonix Research. Revenue models as observed across municipal procurements and vendor contract structures; the signing authority column reflects the function that typically owns the budget in larger authorities and varies in smaller ones.
The economics of those five are not alike, and the differences explain the mix. Payment devices are a capital purchase per machine with a maintenance tail; a city replacing a meter estate is making a decision once every seven to ten years and spending a great deal in the year it makes it. Enforcement processing is transactional — a fee per notice, sometimes a share of recovered revenue — so its spend tracks violation volume rather than kerb length, and it grows quietly with the size of the restricted estate. Software is subscription, priced per bay or per street, and is therefore cheap per unit and expensive to displace once embedded in a permit workflow. Sensing hardware is the only line that behaves like a classic infrastructure market: capital upfront, depreciation over five to seven years, and a replacement cycle that a city can defer.
That combination produces a market with unusually low capital intensity and an unusually high annuity share, which is why it has attracted consolidation in the collection layer and not in the allocation layer. A company that owns the payment channel and the notice-processing pipeline has a recurring revenue base tied to the size of a city's restricted estate and the number of hours it charges for. A company that sells curb inventory software has a subscription tied to a street count, sold to a planning function that frequently has no capital budget and must build a case around a policy objective — Vision Zero, air quality, freight efficiency, accessible kerbside — rather than a revenue line. One of those is easy to renew. The other has to be re-argued.
The boundaries of the count follow from that. This report excludes the tariff itself, because a driver paying two pounds for an hour is not buying a management system; it excludes fines, for the same reason; and it excludes off-street parking, which is a different asset class with a different buyer. It also excludes the general traffic-management market — signals, variable message signs, journey-time monitoring — except where those systems are explicitly repurposed for kerb enforcement or kerb analytics, which is happening more often than the category boundaries admit. What remains is a market of roughly USD 4.18 billion in 2025, and the useful way to read that number is not as the value of the curb but as the value of the apparatus cities have built to administer it.
Lambeth's measurement is the corrective to any assumption that the apparatus matches the asset. A borough that describes its kerbside as one of the largest pieces of public property it controls, equivalent in area to 194 football pitches, and then finds that 94 per cent of it is used to provide and manage car parking, is describing a governance gap rather than a technology gap. The technology to allocate that space exists and is standardised. The instrument that would let a council reallocate it at scale, price it dynamically and publish the result as a rule does not exist in most jurisdictions, and no amount of sensing closes that distance. The market sells instruments for measuring and charging for a default. It has not yet sold many instruments for changing it.
4. Demand Drivers and Structural Forces
Five forces are pushing cities to buy more of this, and only one of them is about parking. They differ in how much evidence supports them and in how quickly they convert into a purchase order, and the gap between the two is where most vendor forecasts go wrong.
Freight is the strongest and best-evidenced driver. The University of Washington's Urban Freight Lab tracked 2,900 commercial-vehicle trips in downtown Seattle and found an average of 2.3 minutes spent cruising for somewhere to stop on each trip, which is 28 per cent of total trip time. The same study found that cruising fell as more curb space was allocated to commercial loading zones and paid parking, and rose as more was allocated to bus stops. The policy implication is unusually clean: loading capacity is not a concession to freight, it is a productivity measure, and the return on it is measurable in minutes per stop across an entire delivery network. For a carrier running thousands of stops a day, a reduction of that size is a labour-cost line. For a city, it is a congestion and emissions line. Both are arguments a procurement can be written around, which is why loading-zone management is the fastest-growing line in section 5 at 14.3 per cent.
Reallocation policy is the second, and it is political rather than technical. Lambeth's strategy pairs its 94 per cent baseline with a Climate Action Plan commitment to allocate 25 per cent of kerbside space to climate resilience — cycle parking, trees, sustainable drainage, seating, community gardens and outdoor dining — with minimum commitments on every street and a published framework for charging the remaining 75 per cent in a way that reflects emissions, pollutants and vehicle size. That is a target expressed as a share of a physical asset, which means it cannot be met without an inventory of that asset, a published rule set, and a way of enforcing the change. In other words, a reallocation target is a demand driver for the allocation layer specifically, and it is the clearest example of the mechanism that would shift the mix described in section 5.
Standards adoption is the third, and it works by lowering switching cost. The Open Mobility Foundation's Curb Data Specification reached version 1.1 with real-time event tracking and digital curb inventory models, developed with an inaugural cohort of ten cities, and in March 2026 the Foundation announced a second cohort of fourteen cities and one county spanning the United States, Canada and Europe — Bergen, Dublin and Montréal joining Alexandria, Arlington County, Boston, Minneapolis, Omaha, Pasadena, Portland, San Francisco, San Jose, Seattle, Tacoma and Washington, DC. A shared schema for curb zones, events and regulations does two things at once: it makes a digital inventory cheaper to build, because the data model is not bespoke, and it makes a platform easier to replace, because the inventory can leave with the city. The first effect grows the market; the second compresses vendor pricing. Both are visible in the forecast.
Fiscal constraint is the fourth, and it cuts both ways. In England and Wales, section 55 of the Road Traffic Regulation Act 1984 requires a local authority to keep a parking account, restricted what any surplus may be applied to, and requires any deficit to be made good from the general fund. Parking is therefore a hypothecated cost-recovery instrument with a statutory list of permitted uses. On one reading this is a driver: a council under pressure can justify enforcement investment because it protects the account. On another it is a brake: a council cannot fund a kerb inventory or a dynamic pricing engine out of a surplus, because the surplus is not free money. The practical result, observed repeatedly in the procurements behind this report, is that anything which pays for itself in recovered revenue gets bought, and anything which only pays for itself in better kerb performance waits for a grant.
Accessibility and bus reliability are the fifth, and they are the least commercialised. A bay reserved for a disabled driver and a stop reserved for a bus are the two uses of the curb with the strongest legal and social claims and the weakest revenue signal. Enforcement of both is chronically under-resourced because neither generates a surplus, and both are the uses most damaged by a kerb that is 94 per cent parking by default. The instruments that serve them — camera enforcement of bus stops, evidence capture for accessible-bay obstruction — are technically identical to the revenue-generating ones and are usually bought in the same procurement, which is the strongest argument available for treating the curb as one system rather than five.
Two forces that are widely cited do not belong on this list yet. Electric-vehicle charging at the kerb is a genuine new demand on the same three metres, but the charge point itself is sold as energy infrastructure rather than kerb management, and its contribution to this market arrives through the allocation software that decides which bays become charging bays rather than through hardware counts. Micromobility, after a period of consolidation among operators, has become a smaller claimant on kerbside space than its 2021 projections implied — though the corral and the designated parking area it requires are now a standard line in a curb inventory, which is a durable if modest contribution.
5. Segment and Product Split
Split by what is actually bought, the market stratifies cleanly into six lines, and the ordering by growth rate is almost exactly the inverse of the ordering by 2025 size. The largest line grows slowest; the smallest grows second-fastest; and the line that decides who controls the curb grows fastest of all. That inversion is the forecast.
| Segment | 2025 | Share 2025 | 2033 | Share 2033 | CAGR |
|---|---|---|---|---|---|
| Payment and access systems | 1,420 | 34.0% | 2,390 | 24.8% | 6.7% |
| Sensing, camera analytics and plate recognition | 960 | 23.0% | 2,310 | 24.0% | 11.6% |
| Curb management software and digital inventory | 690 | 16.5% | 2,150 | 22.3% | 15.3% |
| Enforcement systems and processing | 530 | 12.7% | 1,180 | 12.2% | 10.5% |
| Freight and loading-zone management | 380 | 9.1% | 1,110 | 11.5% | 14.3% |
| Advisory, managed operations and integration | 200 | 4.8% | 500 | 5.2% | 12.1% |
| Total | 4,180 | 100% | 9,640 | 100% | 11.01% |
Source: Pheonix Research model on the 2025 base year. Segment values are Pheonix estimates constructed bottom-up from installed estates, deployment counts and contract structures; they are not disclosed by any single vendor or agency. Collection layer, cited in sections 1 and 2, is payment and access systems plus enforcement systems and processing.
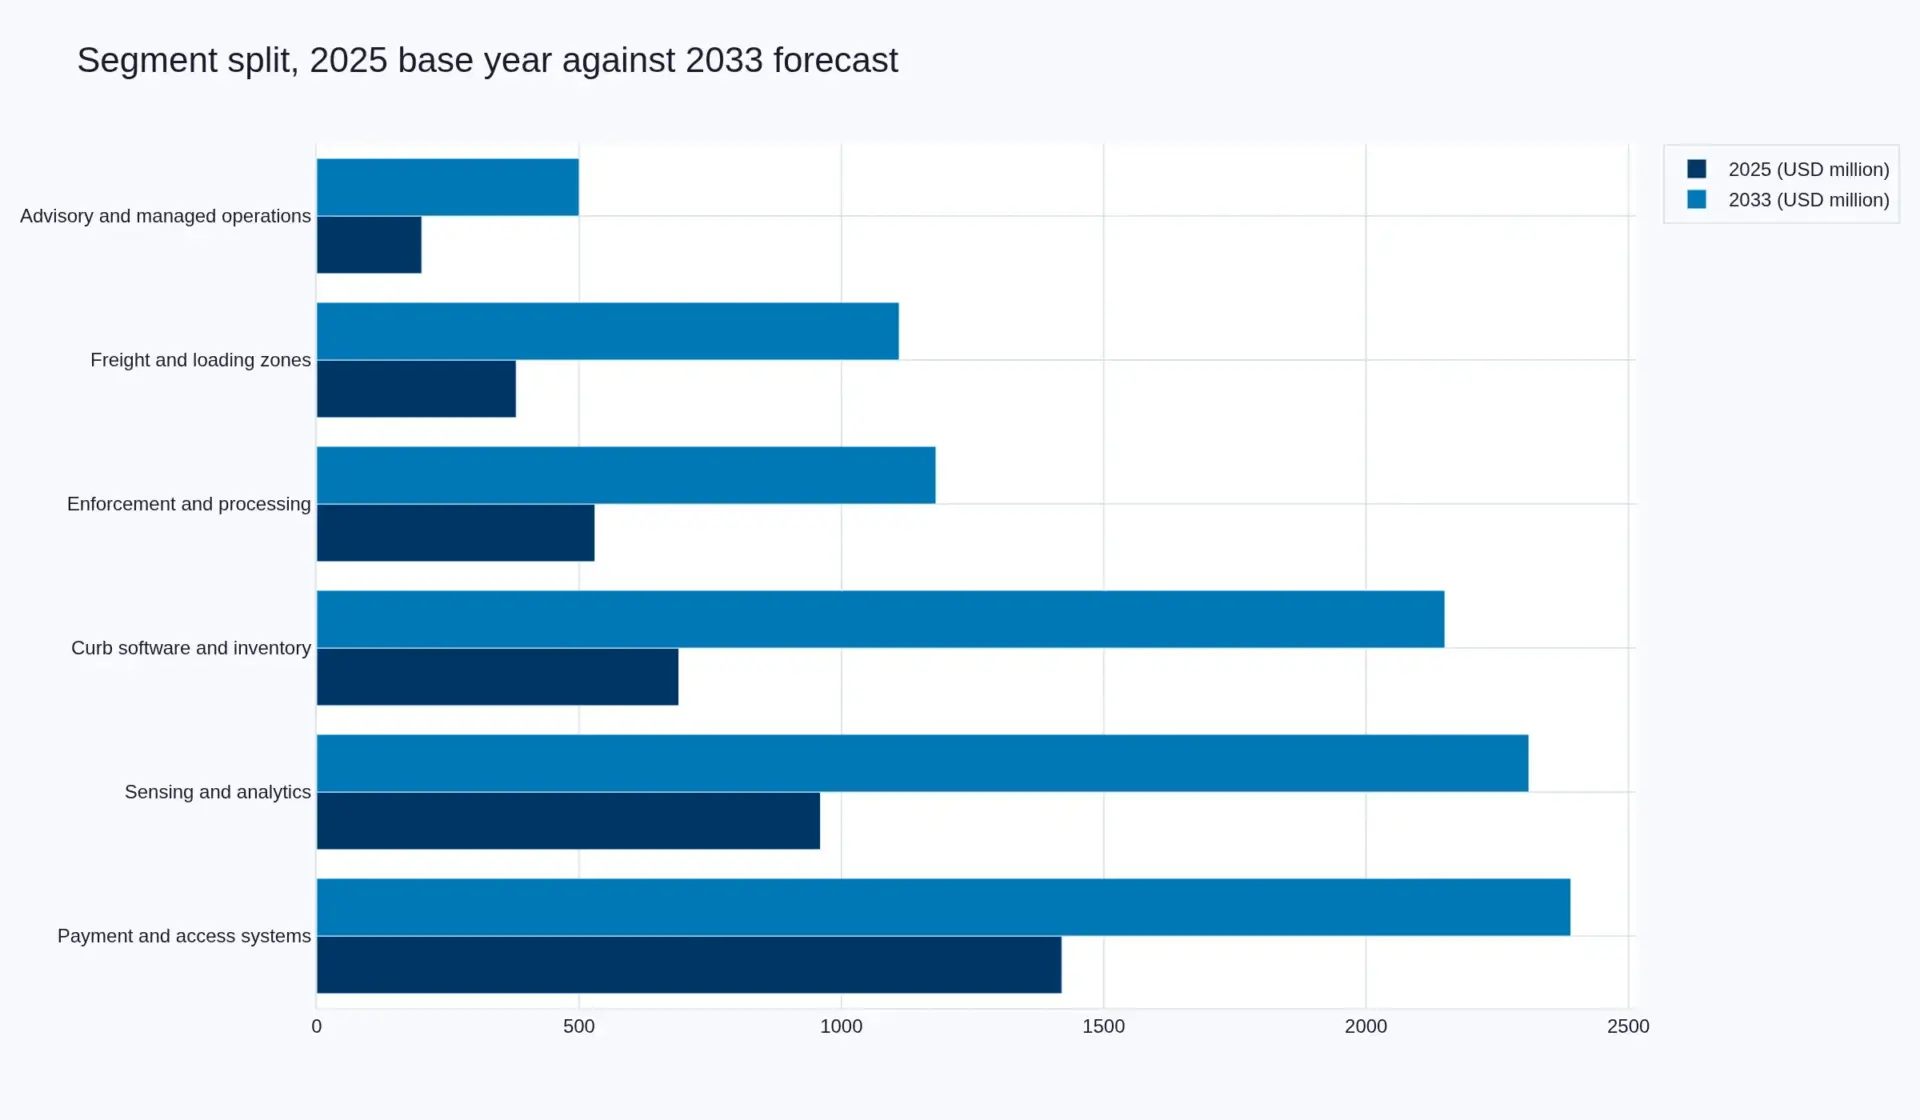
Payment and access systems are the anchor and the laggard. At USD 1,420 million they are a third of the market in 2025, and at 6.7 per cent they grow at barely half the market rate, losing 9.2 points of share across the window. The mechanism is not a loss of function but a change of form. A city replacing a meter estate is replacing a machine that took coins with a phone app, a permit portal and, increasingly, nothing physical at all in the bay. The spending that used to arrive as a capital purchase of several thousand devices arrives instead as a smaller number of terminals for visitors, a tap-to-pay upgrade, and a payment-processing margin inside a transaction. Cashless migration is good for the operator and deflationary for the equipment line. The same shift that makes the market more usable makes it smaller per bay, and no plausible volume of new bays reverses a per-bay decline of that kind.
Curb software and digital inventory is the fastest line at 15.3 per cent, and it is the one that determines whether the curb remains a parking account or becomes a schedule. It covers the inventory itself — a machine-readable record of every bay, zone, restriction and permitted use along a kerb — plus the permit workflow, the rule engine, the pricing logic and the publication layer that tells a driver, a carrier or a planner what is allowed where and when. It is growing for three reasons that reinforce each other: a shared data model now exists, so an inventory can be built to a standard rather than to a vendor's schema; reallocation targets of the Lambeth kind cannot be met without one; and the software is cheap per bay, which means it can be bought inside an existing budget rather than through a capital case. Its share rises from 16.5 to 22.3 per cent — the largest gain of any line, and still not enough to overtake collection.
Sensing, camera analytics and plate recognition sits at 11.6 per cent, growing a little above the market, and its composition matters more than its total. The line is migrating from instruments embedded in the road to instruments already above it. A camera on a pole or on an enforcement vehicle can cover many bays at once, has no civil works cost, and can be repointed as the kerb changes; an in-ground puck covers one bay, requires a street closure to install, and fails when the surface is resurfaced. The consequence is a line where unit prices fall while deployments multiply, which is why a market adding 15.2 per cent more managed bays a year produces only 11.6 per cent more sensing revenue. Anyone modelling this segment off bay counts alone will overstate it by roughly a third.
Freight and loading-zone management is the second-fastest line at 14.3 per cent, and the one with the cleanest evidence behind it. It covers the booking systems that let a carrier reserve a loading slot, the kerbside freight data that tells a city where its loading demand actually is, and the enforcement that makes a reserved bay mean something. At USD 380 million it is the second-smallest line and 9.1 per cent of the market, and it is the line most likely to convert a city from a parking buyer into a scheduling buyer, because the buyer changes: freight and highways functions care about network productivity rather than parking yield, and they will fund an instrument that a parking account cannot justify. The Seattle cruising evidence — 2.3 minutes and 28 per cent of trip time — is the argument that opens that door.
Enforcement systems and processing holds its share almost exactly, at 10.5 per cent growth against a market at 11.01, falling from 12.7 to 12.2 per cent. That stability is the most interesting thing about it. Enforcement behaves less like a technology market and more like an insurance line: the demand is inelastic, the volume tracks the size of the restricted estate rather than the state of the technology, and the contract is usually multi-year with a processing fee per notice or a share of recovered revenue. It is the most defensible revenue in the market and the least exciting, which is precisely the profile that consolidates.
Advisory, managed operations and integration grows 12.1 per cent from a small base of USD 200 million. This is the line that tells you the market is still early. When a city must buy a consultant to define what its kerb is for before it can buy software to manage it, the product has not yet become self-evident — and the volume of kerb studies, pilots and grant-funded demonstrators behind this forecast says the same thing. Advisory spend tends to decline as a share once a category standardises; here it rises slightly, from 4.8 to 5.2 per cent, because the number of cities starting the exercise is growing faster than the number finishing it.
The aggregate of all six produces the number that matters most for anyone selling into this market: spend per managed bay falls from USD 454 in 2025 to USD 337 in 2033, a decline of 25.8 per cent, or 3.7 per cent a year. Growth comes from covering more curb, not from monetising the curb already covered. For a vendor that is a volume problem with a falling price, which rewards whoever can add a bay to the record most cheaply and penalises anyone whose economics depend on hardware in the ground. For a city it is a favourable curve inside a constrained budget, and the reason the allocation layer can grow at 15.3 per cent while the money available per bay falls.
6. Regional Analysis
The regional pattern does not follow income or car ownership as closely as it follows governance. The regions that spend most per managed bay are those where a single authority can write a rule, enforce it and keep the proceeds; the regions that grow fastest are those building kerbs from scratch without a legacy meter estate to depreciate first.
| Region | 2025 | Share 2025 | 2033 | CAGR |
|---|---|---|---|---|
| North America | 1,460 | 34.9% | 3,180 | 10.2% |
| Europe | 1,180 | 28.2% | 2,720 | 11.0% |
| Asia-Pacific | 1,010 | 24.2% | 2,660 | 12.9% |
| Middle East and Africa | 250 | 6.0% | 560 | 10.6% |
| Latin America | 280 | 6.7% | 520 | 8.0% |
| Total | 4,180 | 100% | 9,640 | 11.01% |
Source: Pheonix Research model on the 2025 base year. Regional values are Pheonix estimates allocated from the bottom-up construction described in sections 3 and 5, using municipal procurement records, installed-estate counts and published programme participation; no single agency publishes a comparable regional series.
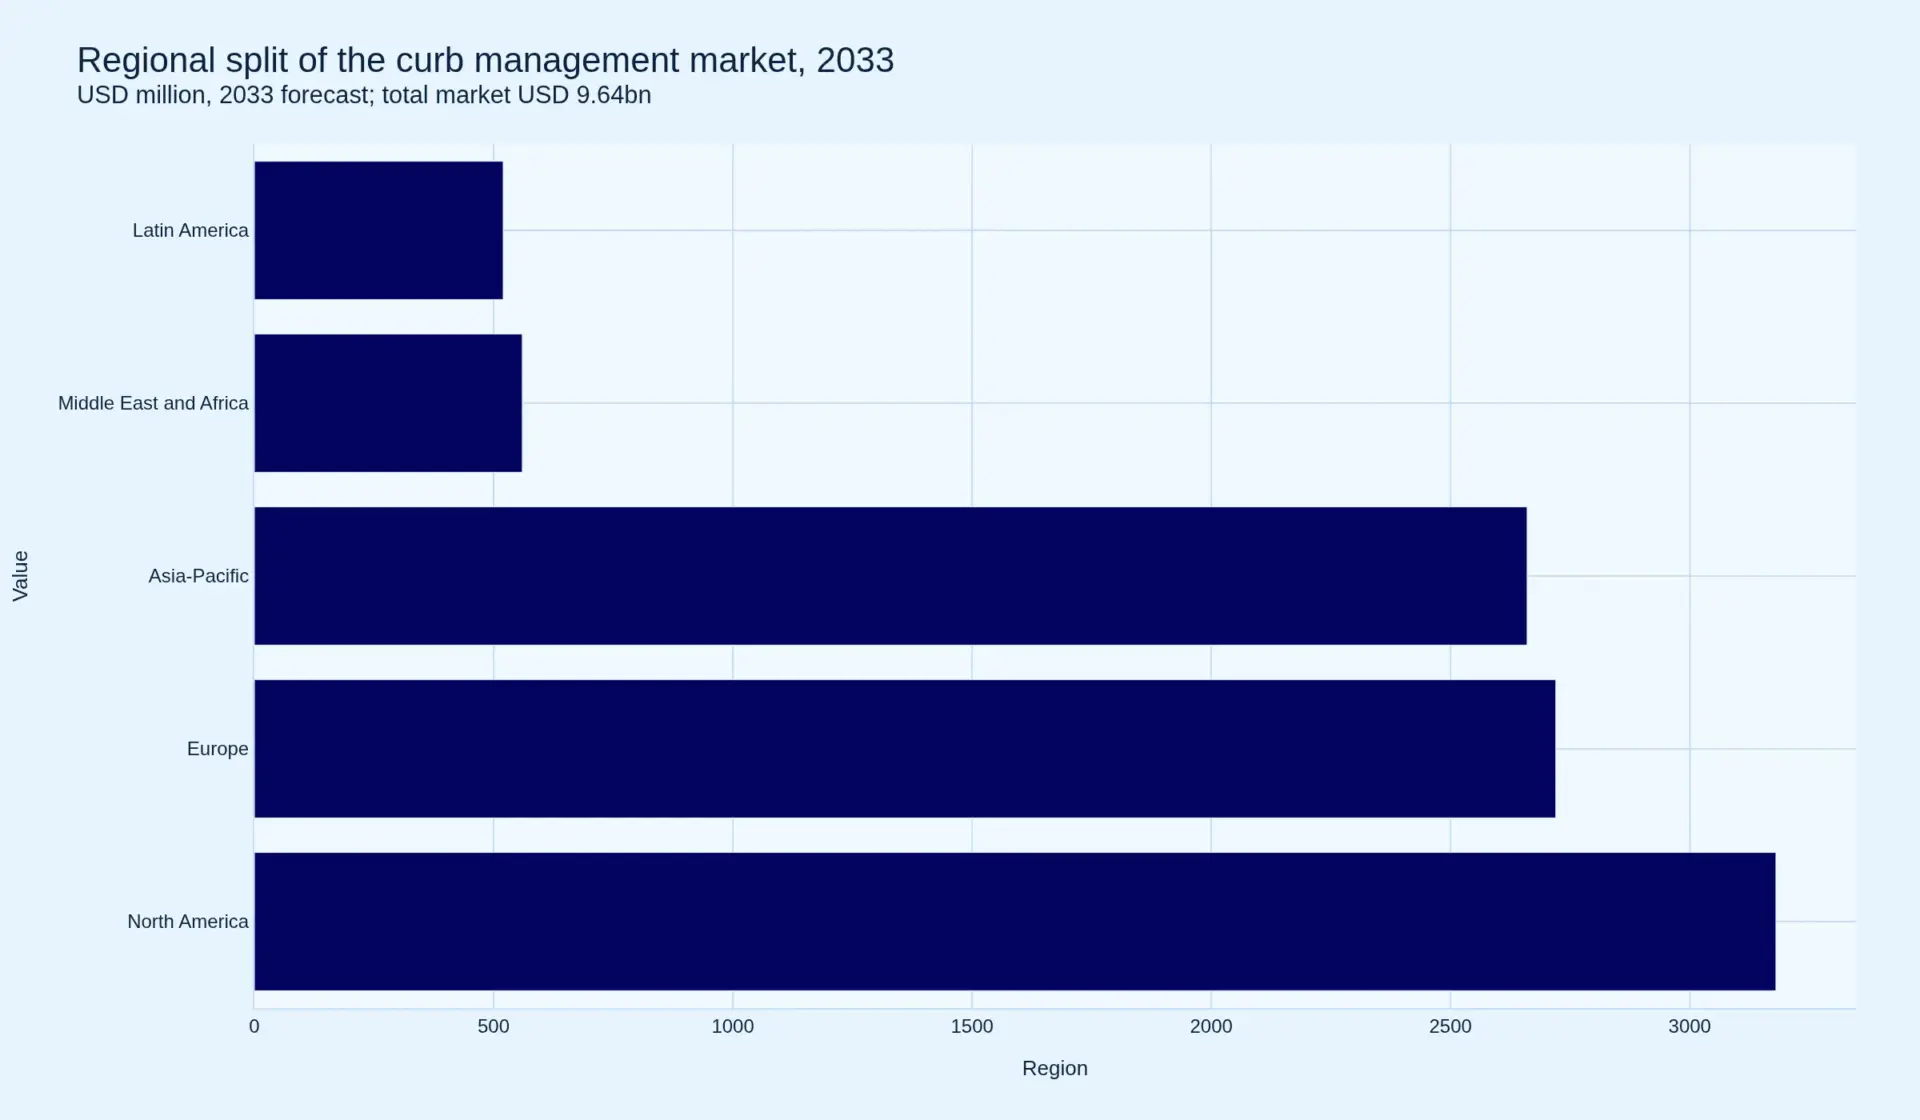
North America is the largest market and the second-slowest growing. At USD 1,460 million and 34.9 per cent of global value it is the maturity case: a very large restricted estate, an established enforcement industry, a dense vendor base, and thousands of separate municipal buyers rather than a few hundred. Its growth of 10.2 per cent comes from two places. The first is freight — American downtowns have the most acute loading conflict in the developed world and the most carrier pressure to resolve it. The second is the pace at which the largest cities are building digital inventories, with San Francisco, Seattle, San Jose, Washington, Boston, Portland, Minneapolis, Pasadena and Omaha all inside the Open Mobility Foundation's programme across its two cohorts, alongside Pasadena, Alexandria, Arlington County and Tacoma. What holds the region back is fragmentation of the buying side: the same product must be sold several thousand times, and no federal instrument forces a common curb standard.
Europe is the regulatory laboratory and grows a little above the market at 11.0 per cent. It leads on the thing that matters most to the long-run shape of this market — the willingness to state, in public, what the kerb is currently used for and what it should be used for instead. Lambeth's 94 per cent baseline and its 25 per cent reallocation commitment are the clearest example, but the mechanism behind them is broader: a planning and traffic-order framework in which a kerbside strategy is a legitimate object of local policy, and a parking account whose surplus is restricted to specified transport purposes. Europe also has the densest concentration of incumbent payment and enforcement vendors and the most complete installed estates, which caps growth in the payment line while supporting the software and freight lines. The second Open Mobility Foundation cohort's inclusion of Bergen, Dublin and Montréal is a reasonable proxy for where standards-led demand is next.
Asia-Pacific grows fastest at 12.9 per cent and will be within five points of North America's value by 2033 — USD 2,660 million against USD 3,180 million. The reason is structural rather than cyclical: a large share of the region's kerbside is being instrumented for the first time, in cities where mobile payment is the default rather than a migration target, and where a new district can be laid out with a kerb inventory rather than retrofitted with one. That removes the single largest cost in a Western deployment — replacing or integrating an existing meter estate — and it compresses the payment line while expanding the software and sensing lines. The growth is uneven within the region: the fastest-adopting markets are those with municipal or state agencies large enough to run a city-wide programme, and the slowest are those where enforcement is delegated to private operators with no incentive or obligation to publish data.
The Middle East and Africa grows 10.6 per cent from a small base of USD 250 million, and its character is different again. Much of the demand is embedded in new development: a district or a transport hub designed with paid kerbside, loading management and digital enforcement from the outset, procured as one package inside a larger infrastructure contract rather than as a series of municipal upgrades. That produces high spend per managed bay and low bay counts relative to population — the inverse of the European pattern — and it makes the region unusually dependent on a small number of very large programmes. It is also where standards adoption is least visible, which is a risk to interoperability later rather than to growth now.
Latin America is the slowest at 8.0 per cent, and the constraint is enforcement legitimacy rather than technology. Where a penalty cannot be collected reliably, or is contested successfully as a matter of course, the business case for instrumenting a bay weakens on both sides: the city cannot cost-justify the detection, and the operator cannot underwrite the revenue share. The result is a market that instruments the densest commercial districts and leaves the rest of the kerb unmanaged, which produces respectable value per bay and a slow bay count. Pricing in local currency, and the volatility of that currency, is a second and more secular drag on multi-year contracts.
The regional picture supports the report's central claim more clearly than the segment picture does. Where a single authority can write the rule and keep the proceeds, spend per bay is high and growth is moderate. Where the kerb is being built for the first time, bay counts expand quickly and spend per bay falls. Neither pattern produces the allocation layer at scale, because that requires a legal instrument rather than a budget line — and no region in this forecast has yet adopted one across a jurisdiction large enough to move the global mix.
Within each region the dispersion is wider than between them, and that is the more useful fact for anyone selling into this market. England contains both London boroughs publishing quantified kerbside strategies with reallocation targets and shire districts that have not inventoried their kerb at all; the United States contains cities running multi-year digital-curb programmes and cities where the parking function is a single clerk and a bank of meters. The regional figures in Table 4 are therefore an average of very different conditions, and the practical implication is that a vendor's addressable market is better estimated by counting authorities with a funded kerb owner than by multiplying a regional total by a share.
The regional allocation is also the softest number in this report, and it should be read as that. No agency publishes a comparable series, so the split is a Pheonix construct allocated from the bottom-up build using procurement records, installed-estate counts and published programme participation. It is reliable in its ordering, which follows governance capability and estate age, and approximate in its levels, particularly where large single programmes dominate a small regional base as they do in the Middle East. Where a reader has better local evidence, the ordering is the part worth keeping.
Table of Contents
Competitive Landscape
This market is fragmented at the level of the whole and concentrated at the level of the layer, and the distinction explains almost every competitive behaviour visible in it. No supplier holds a double-digit share of global curb and kerbside management spend. Nine firms can reasonably be described as first-tier by installed estate or geographic reach, and the largest of them would still be a single-digit share of a USD 4.18 billion market. But a city does not buy the whole market. It buys a payment estate, an enforcement contract, a permit system or an inventory, and in each of those categories the number of credible bidders is often three or fewer.
Four strategic positions are visible, and they compete on different things.
| Position | Representative firms | What defends it | What erodes it |
|---|---|---|---|
| Collection incumbents — payment estates and notice processing | Conduent, Flowbird Group, SKIDATA, Amano | Installed estate, multi-year contract, transaction float, integration into municipal finance | Cashless migration removes the device; processing margins compress under competitive re-bid |
| Infrastructure and access vendors extending from off-street into the kerb | Nedap, SWARCO, Smart Parking, TKH Security | Hardware engineering, certification, existing municipal relationships, service depots | Hardware price deflation and the shift of detection to cameras already in place |
| Allocation specialists — inventory, rules and booking | AppyWay, Grid Smarter Cities | Data quality, standards alignment, proximity to the planning function that owns the policy | Thin capital, long sales cycles, dependence on budgets that are not yet line items |
| Sensing and analytics specialists | Cleverciti Systems and a long tail of camera-analytics firms | Detection accuracy, coverage per device, integration into guidance and enforcement workflows | Commoditisation of computer vision; buyers substituting existing CCTV and enforcement fleets |
Source: Pheonix Research. Positions describe where each firm’s curb-related revenue principally comes from, not its total business; most of these companies sell well beyond the kerb. TKH Security owns Park Assist. No third-party market-research estimate is used in this classification.
The clearest structural event in the collection layer is the consolidation of parking payment itself. Flowbird Group was formed in 2018 from the merger of Parkeon and Cale, was subsequently merged into EasyPark Group, and that group has since been renamed Arrive. A city that re-procured its payment estate in 2015, again in 2019 and again in 2024 may have signed with three different names and one continuous commercial relationship. That is what consolidation looks like from the buyer’s side, and it is the strongest evidence available that the collection layer is where scale economies live: the fixed cost is the estate and the integration, and the marginal cost of the next city is a sales team.
The collector’s advantage is not technical superiority. It is that the collection layer sits inside a municipal revenue process. The payment channel touches the general fund, the notice pipeline touches the adjudication process, and both are audited. A vendor embedded in that flow is very hard to remove, because removing it means changing a financial control rather than changing a product. The allocation layer has no such anchor. A curb inventory touches a planning objective, and planning objectives change with administrations.
Against that, the allocation layer has one advantage that compounds: portability. The Open Mobility Foundation’s Curb Data Specification programme has moved from a ten-city first cohort to a second cohort of fourteen cities and one county, with version 1.1 adding real-time event tracking and digital curb inventory models. A city that describes its kerb in a shared schema owns something it did not own before, and can take it to another supplier. Standards do not break an installed payment estate, but they do dissolve the lock-in that an inventory vendor would otherwise enjoy — which is why the allocation layer is likely to remain structurally fragmented even as it grows at 15.3 per cent, and why a specialist with good data can hold a position a much larger vendor cannot buy.
Two adjacent markets shape the contest more than any firm does. Enforcement technology is consolidating around camera-based detection with automated processing, a market examined in this segment’s road safety and enforcement report, where the camera is a means rather than the product sold. And occupancy detection is migrating to whatever instrument is already installed, as set out in the occupancy sensing and space guidance report. Both trends favour firms with a camera estate and a processing pipeline over firms with a sensor estate, which is why the sensing line in this report grows at 11.6 per cent while managed bays grow at 15.2.
Pricing reflects the layers. On Pheonix’s reading of vendor contract structures, hardware-led lines run on gross margins in the low-to-mid twenties, processing and enforcement services in the thirties, and subscription software substantially higher because the marginal cost of another street is close to zero. The consequence is that a firm’s margin is determined less by its market share than by which layer it sells into, and that a small allocation specialist can be more profitable per unit of revenue than a large payment incumbent — while remaining far more fragile, because its revenue ends when the policy that justified it ends.
The competitive question in this market is therefore not who will own the curb. Nobody owns the curb; the public does. The question is who owns the record of it — the inventory, the rule set and the evidence of what happened in each bay-hour — because that record determines who can price, who can enforce and who can be replaced. Today the record is held either by a payment incumbent in a proprietary format or by a planning team in a spreadsheet, and the standards programme is the first serious attempt to move it into a form the city controls.
One event would reorder the field faster than any product cycle: a national or state government mandating a common curb data schema as a condition of funding, in the way that transport data standards have been mandated elsewhere in the sector. Nothing in this forecast assumes it. If it happened, the hardware positions would survive, the payment estates would survive, and the proprietary inventory position would not. The relationship most at risk is not between vendor and city; it is between the collection layer and the allocation layer, where the buyer of the second is often the same function that already owns the first — and has no budget to add anything to it.
Value Chain
The kerbside value chain runs from a surveyor with a tablet to a penalty notice landing on a doormat, and the money sits in the middle of it. Seven stages are distinguishable, and the interesting fact about the chain is that the two stages where the curb is actually defined — surveyed and ruled — capture almost nothing, while the three stages where money changes hands capture most of what this report counts.
| Stage | Who performs it | What it produces | Margin character |
|---|---|---|---|
| 1. Survey and inventory capture | City staff, mapping contractors, inventory vendors | A record of every bay, zone and restriction along the kerb | Project fees, low repeat value unless maintained |
| 2. Rule authoring and legal order | Highways, traffic and legal teams | A traffic regulation order or municipal ordinance that makes the record enforceable | No commercial value captured; a public function |
| 3. Instrumentation | Payment and hardware vendors, camera suppliers | Terminals, apps, sensors, cameras, plate recognition | Hardware margin plus maintenance annuity |
| 4. Identity and transaction | Payment providers, app operators, permit administrators | A priced bay-hour attached to a vehicle or an account | Transaction margin, very high volume |
| 5. Enforcement and adjudication | In-house teams or outsourced processors | Evidence of a breach, a notice, a recovery or an appeal outcome | Per-notice fee or revenue share; inelastic |
| 6. Data, analytics and repricing | City analysts, platform vendors | Occupancy and dwell evidence used to change the price or the rule | Subscription; the highest-value advisory position |
| 7. Publication and channel | Signage, mapping platforms, carrier booking systems, app partners | The rule as the driver, carrier or planner actually sees it | Low direct revenue; determines who controls the interface |
Source: Pheonix Research value-chain reconstruction from municipal procurement documents, contract structures and vendor disclosures. Margin character describes the shape of the revenue, not a reported margin figure.
Stages 1 and 2 are where a city decides what its kerb is for, and they are almost entirely unfunded as a commercial matter. The survey is usually a one-off exercise attached to a grant or a corridor scheme, and the resulting inventory decays from the day it is delivered because restrictions change, bays are suspended for works, and new corrals and charge points appear. The rule authoring is a legal process with no vendor attached to it. This is the most important structural fact in the chain: the asset is defined by an activity nobody pays to sustain, which is why so much of the rest of the chain is built on stale records.
Stages 3, 4 and 5 capture the money, and they capture it because they sit on a cash flow. Instrumentation is a capital sale. Identity and transaction is a toll on every hour sold. Enforcement is a fee on every breach proved. All three have a natural customer in a municipal finance department, which is the department that can actually sign. Together they account for 46.7 per cent of 2025 spend, and their dominance is not a market failure — it is what happens when the sustaining revenue of an asset class is attached to its charges rather than to its definition.
Stage 6 is where the strategic value sits and where almost nobody is yet buying. An occupancy and dwell dataset is the only thing that tells a city whether the price it set produced the outcome it wanted, and the only defensible basis for repricing — raising a tariff where demand exceeds supply, lowering it where bays sit empty, and reallocating where a use is systematically displaced. Cities that have done this well describe it as the single largest source of improved kerb performance available to them. It is also the stage most exposed to the fiscal constraint described in section 4: repricing is analytically cheap and politically expensive, and it does not come with a capital budget.
Stage 7 determines who controls the interface and therefore who learns anything. A driver who finds a bay through a mapping platform, a carrier that books a loading slot through a third-party system, and a city that publishes a curb feed are all describing the same rule to different audiences, and the party that owns the description accumulates the behavioural data. This is why publication standards matter commercially as well as politically. The Curb Data Specification programme is not primarily a technical effort; it is an attempt to make sure the description of the curb stays with the authority that owns it.
The seam that most deployments fail at is between stage 2 and stage 6. A traffic order is written in legal language by a highways or legal team, and a data model is written in a schema by a technologist, and the two must describe the same reality precisely enough that a camera can decide whether a vehicle is in breach. In the primary interviews behind this report, the recurring description of a failed deployment was not a technology failure but an ownership failure: an inventory built by a vendor for a pilot, a rule set held in a PDF, and no single person in the authority responsible for keeping the two aligned. The cities that sustain these systems have, without exception, a named owner for the curb as a data product — a role that did not exist a decade ago and is still rare.
Procurement structure follows from the chain rather than cutting across it. Most cities buy stages 3, 4 and 5 as a bundle from an incumbent, and stages 1, 6 and 7 as a series of disconnected projects funded by grants or corridor schemes. That is why the market’s growth is so unevenly distributed across the six lines in section 5, and why advisory revenue grows at 12.1 per cent: the disconnection has to be managed by somebody, and increasingly that somebody is a consultant hired to define what the authority is trying to achieve before it writes a specification.
The chain also explains the substitution that is quietly reshaping the hardware lines. If a city already owns stages 5 and 7 — an enforcement fleet with cameras and a published rule set — then stage 3 can often be delivered from the existing estate rather than bought again. Every municipality that discovers this reduces its instrumentation spend per bay while increasing its managed-bay count, which is the mechanism behind the falling unit economics this report measures. It is also, for the firms selling instrumentation, the most concrete competitive threat in the market: not a rival product, but a customer realising it already owns most of the hardware.
Finally, the chain shows why the adjacent airport market behaves so differently. In the airport parking and pre-booked reservation market, a single landlord owns the asset, the rule and the revenue, so stages 2, 4 and 6 sit in one organisation and the platform can price continuously. On a city street those stages are split between a highways team, a finance team and a supplier, and the split is the reason a kerbside cannot be priced like an airport forecourt. The value chain is not a diagram of who does what. It is a diagram of where the authority is fragmented, and every commercial opportunity in this market sits in one of those gaps.
Investment Activity
Capital in this market behaves the way capital behaves in any low-intensity infrastructure-software hybrid: it consolidates the annuity and seeds the software. There is very little to build in the way of plant. A payment estate is bought by a city, not by a vendor; sensors and cameras are manufactured by contract; and the only genuinely capital-hungry activity is the accumulation of the curb record itself, which is labour rather than asset. That produces a market where the interesting transactions are acquisitions of contract books and minority stakes in small software firms, and where the headline numbers are small even when the strategic consequences are large.
| Theme | What is being bought | Investment logic | Principal risk |
|---|---|---|---|
| Collection-layer consolidation | Payment estates, processing contracts, installed bases | Recurring revenue attached to a municipal revenue process; geographic bolt-ons | Cashless migration shrinks the device base it paid for |
| Enforcement and processing services | Notice-processing pipelines, back-office operations, recovery capability | Inelastic demand, multi-year contracts, revenue share on recovered amounts | Political and legal challenge to enforcement itself |
| Curb inventory and allocation software | Small software firms with a city or two and a good schema | Option on the standards-led reorganisation of the market | Thin revenue, long sales cycles, pilot dependency |
| Camera analytics and detection | Computer-vision capability and coverage per device | Detection is the input to both pricing and enforcement | Commoditisation; buyers reuse existing CCTV |
| Freight booking and kerbside logistics | Slot-booking platforms and carrier relationships | The one line where the buyer has an operating budget and a measurable return | Carrier adoption is slow and fragmented |
Source: Pheonix Research. No transaction value is stated in this table because none of the relevant deals discloses a curb-specific consideration, and a consolidated group figure would not be attributable to this market. The classification is Pheonix’s.
The clearest illustration of the consolidation logic is the payment layer’s own history. Flowbird Group was created in 2018 from the merger of Parkeon and Cale, combining a French parking-terminal business with a Swedish payment-technology business. It was subsequently merged into EasyPark Group, and that group has since been renamed Arrive. Each step in that sequence bought the same thing: installed estates, municipal relationships and a payment flow, in a different geography. None of them bought a curb inventory. That is the shape of consolidation in this market — horizontal across cities and countries, within a layer, and almost never vertical from collection into allocation.
The counter-example is instructive. Coord, the curb-data venture spun out of Sidewalk Labs, was wound down in 2020. It had the right thesis — that the curb needed a machine-readable description before it could be managed — and no revenue model strong enough to survive the gap between a city’s interest and a city’s budget. The Open Mobility Foundation’s programme, which grew out of that period of work and now spans two cohorts of cities including Bergen, Dublin, Montréal and Boston, is effectively the same idea carried by a standards body rather than a company. That is a meaningful distinction for anyone underwriting the allocation layer: the thing Coord could not sell, a standards body can give away, and what can be given away cannot easily be sold as a product. The commercial value in allocation therefore has to sit downstream of the standard — in the data quality, the workflow, the booking engine and the service — not in the schema itself.
Hardware consolidation follows a different logic and runs in parallel. Access-control and parking-equipment groups have been buying detection and guidance capability for most of the last decade, and the pattern is visible in the composition of the vendor base in section 7: Park Assist now sits inside TKH Group, and the larger European and Japanese equipment groups each own a portfolio of sensing, payment and access brands. The rationale is straightforward — the estate is the distribution channel, and a new detection capability can be sold into an installed base without a new customer — and the risk is equally straightforward. A hardware group that owns the estate has an incentive to keep detection in the bay, because that is what it sells, while the market is migrating detection to cameras that the city already owns.
Public money is a larger investor in this market than private capital, and it is rarely counted as such. A substantial share of the inventories, pilots and demonstrations behind this forecast were funded by grants attached to air quality, road safety, accessibility or decarbonisation objectives rather than by a parking account. That has three consequences for private capital. It seeds demand that would not otherwise exist, which makes early revenue flattering. It creates a cliff when the grant ends and the operating cost lands on a budget that did not previously carry it. And it distorts product design towards what a grant application can describe, which is usually a pilot with a measurable indicator rather than a system with a renewal line. The pattern is visible across the market: a city with a funded pilot and no funded continuation is the single most common customer profile among the allocation-layer firms in this report.
What a buyer is actually underwriting, in any of these themes, is a number that no vendor publishes: recurring revenue per managed bay, and its renewal rate. The forecast in section 5 says that number falls 3.7 per cent a year across the market as a whole. An acquirer paying for an installed estate is therefore paying for a book that shrinks per unit unless the estate grows faster than the unit price falls, which is precisely what the managed-bay line at 15.23 per cent describes. That is why bolt-on volume matters more than margin in the collection layer, and why a firm with 40 city contracts and a falling price per bay is worth more than a firm with 12 and a rising one — as long as the 40 renew.
The forward expectation is unromantic. Consolidation continues in payment and enforcement processing, because that is where a defensible annuity exists. The allocation layer stays fragmented and venture-scale, because standards portability prevents the lock-in that would justify a large acquisition premium and because its customers’ budgets are the most fragile in the market. The most likely route to a step change is not a technology acquisition but a data one: a mapping, mobility or payments platform buying an inventory specialist to obtain a curated description of the kerb in several hundred cities at once. Nothing in this forecast depends on that happening — but it is the transaction that would show the curb had finally become a data asset rather than a compliance cost.
Technology & Innovation
The technology in this market is not hard. The hard part is the chain of evidence between a sensor reading and a lawful penalty, and almost every genuine innovation in the last five years has been an attempt to shorten that chain rather than to improve the sensor. A market that measures itself in cameras will consistently overrate the state of the art; one that measures itself in defensible bay-hours will not.
| Layer | What it does | Maturity | Binding constraint |
|---|---|---|---|
| Inventory and data model | Describes every bay, zone, restriction and permitted use in a machine-readable form | Emerging | Decay — the record goes stale the day it is delivered |
| Detection | Establishes that a vehicle is present, for how long, and which vehicle | Growth | Evidentiary standard rather than accuracy |
| Payment and access | Takes the money and issues the permission | Mature | Cashless migration is removing the device |
| Rules and pricing | Turns policy into a price and a time limit | Growth | Legal authority to vary price, not software capability |
| Enforcement workflow | Turns a detection into a notice, an appeal and a recovery | Mature | Cost per notice versus value recovered |
| Publication and feeds | Tells drivers, carriers and platforms what is allowed | Emerging | Nobody is obliged to consume the feed |
Source: Pheonix Research assessment. Maturity describes deployment breadth in the 2025 base year, not technical sophistication; several emerging layers are technically mature and commercially unadopted.
The inventory layer advanced more in the last three years than in the previous twenty, and the advance is a schema rather than a device. The Open Mobility Foundation’s Curb Data Specification reached version 1.1 with two features that matter more than they sound. Real-time event tracking allows a city to publish what is happening in a bay as it happens rather than as a static rule, which is the difference between a sign and a schedule. Digital curb inventory models allow the rule itself — the restriction, the permitted use, the time window, the tariff band — to be expressed as structured data rather than as a description in a traffic order. Together they make the kerb addressable in the way that streets and addresses became addressable in mapping data, and the programme’s expansion from a ten-city first cohort to a second cohort of fourteen cities and one county, announced in March 2026, is the clearest adoption signal available in this market.
Detection is where the technical and commercial stories diverge most sharply. The commercial story is simple: camera-based detection is replacing in-ground sensing because coverage per device is higher and installation cost is near zero, and any instrument already pointed at the street can be repurposed. That is why the sensing line in this report grows at 11.6 per cent while managed bay counts grow at 15.2 per cent — the same revenue is buying coverage of more bays. The technical story is more awkward. A camera that can tell an analyst a bay is occupied for most of the day is not automatically a camera that can support a penalty, because a penalty requires a timestamp, an image clear enough to identify a vehicle, a calibration record and a chain of custody that survives an appeal. Cities that have tried to move from analytics-grade to enforcement-grade detection with the same hardware have generally found they need better hardware, better mounting and a better back office — which is to say the savings are real but smaller than the business case claimed.
The same gap appears in pricing. Dynamic pricing of the kerb is technically available today: given bay-level occupancy and a rule engine, a city can vary price by hour, day, event and demand. What is scarce is the legal authority to do it without re-making a traffic order each time, and the political cover to raise a price in a popular place. Almost every dynamic-pricing deployment behind this report is bounded rather than continuous — a small number of bands, a defined pilot area, a commitment not to exceed a cap — and the reason is governance, not software. It is the same constraint that keeps the allocation layer at 16.5 per cent of spend while the collection layer holds 46.7 per cent.
Freight has produced the most commercially useful innovation in the market, and it is not a sensor. Slot-booking systems that let a carrier reserve a loading bay for a defined window, backed by enforcement that makes the reservation mean something, convert an unpredictable resource into a scheduled one. The measurable return is the one the University of Washington’s Urban Freight Lab found in Seattle: 2.3 minutes of cruising per trip, 28 per cent of total trip time, falling where loading zones and paid parking were more available. The technology is unremarkable — a booking interface, a permit check, a camera or an officer — and the value comes from the fact that it is the only part of this market where the buyer has an operating budget and a cost line that moves.
Three things are not yet working, and they are worth naming because each is sold as though it were solved. Inventory decay is the first: a curb record is a perishable asset, and no city in this report has a maintained inventory older than a few years that still matches the street. Permit data hygiene is the second: a large share of kerbside occupation is legitimate and permitted — a skip, a scaffold, a works compound, a removal van — and a detection system that cannot see the permit will generate false penalties at a rate that destroys political support. The third is identity across jurisdictions: a plate recognised in one city means little in another, and a carrier operating nationally has no single way to demonstrate that its vehicle was permitted in each of the hundred authorities it enters.
The direction of travel is nonetheless clear, and it points at the city owning the record. Every layer that has improved has improved by moving a proprietary artefact into a shared format — the inventory into a schema, the event into a feed, the rule into structured data. The layers that have not improved are the ones where the artefact stays proprietary: enforcement evidence, permit records and pricing logic. That is where the next five years of innovation will happen, and it is also where the incumbents have most to lose, because a standardised enforcement evidence format would do to the processing layer what the Curb Data Specification is doing to the inventory layer.
Market Risk
The risks that matter in this market are procedural and political rather than technical. Nothing in the technology stack is likely to fail. What fails is the funding that sustains a pilot, the record that goes stale, the political consent that allows a camera to issue a penalty, and the procurement cycle that outlasts a vendor’s runway. The register below weights them by what each would do to the forecast rather than by how often it is discussed at conferences.
| Risk | Likelihood | Impact | Effect on the forecast |
|---|---|---|---|
| Grant dependence and the pilot cliff | High | High | Delays the allocation layer; caps software growth below 15.3% |
| Inventory decay and data quality | High | Medium | Raises cost per managed bay; suppresses renewal revenue |
| Hardware price deflation | High | Medium | Already embedded — drives the −25.8% unit decline |
| Municipal budget compression | High | Medium | Shifts mix towards anything self-funding through enforcement |
| Enforcement legitimacy and political backlash | Medium | High | Removes the revenue that justifies the detection estate |
| Privacy challenge to plate recognition | Medium | High | Raises compliance cost; slows camera-led deployments |
| Standards fragmentation across competing schemas | Medium | Medium | Raises switching cost; entrenches proprietary inventory |
| Vendor concentration in notice processing | Low | Medium | Pricing power in the most inelastic line |
Source: Pheonix Research assessment. Likelihood and impact are qualitative judgements formed from the primary interview programme and the procurement record, not statistical estimates. The price-deflation risk is already reflected in the forecast rather than treated as a downside case.
The pilot cliff is the largest single risk to this market, and it is the one least visible in vendor reporting. A very large share of the inventories, demonstrations and city-wide programmes behind this forecast were funded by grant money attached to air quality, road safety, accessibility or decarbonisation targets. When the grant ends, the operating cost transfers to a budget that did not previously carry it, and the usual outcome is that the software subscription lapses while the inventory it produced stays on a server and stops being updated. Any forecast of the allocation layer that does not discount for this will overstate growth. It is the reason advisory revenue grows at 12.1 per cent from a small base: the demand for help in building the case for continuation is itself a symptom of the cliff.
Inventory decay is the second and is more corrosive because it is quiet. A curb record is a perishable asset. Restrictions change, bays are suspended for works, corrals move, charge points appear, and a record that was accurate at delivery is wrong within a year or two. Where the record is wrong, detection produces false penalties, carriers stop trusting the booking system, and the political cost of the error falls on the authority that published it. The cities that sustain an inventory describe the same discipline: somebody is named as the owner of the curb as a data product, and their job includes keeping the record true. That role is still rare, and its absence is a structural brake on the allocation layer.
Enforcement legitimacy is the risk that can remove the market’s funding base. A large part of what cities can spend on detection is justified by the revenue the detection protects or recovers. That justification is fragile. A single well-publicised error, a successful legal challenge to an automated notice, or a political campaign against penalty volumes can remove the willingness to enforce, and with it the business case for the camera. The same dynamic attaches to plate recognition as a privacy question: the technical capability to read a plate is well established, and the regulatory permission to retain and share what it reads is not settled in the same way everywhere. Because a substantial share of this market’s value sits in payment and enforcement, a general retreat from kerbside enforcement would damage the forecast far more than any plausible technology disappointment.
Standards fragmentation is the risk most often misread as a technology question. The Curb Data Specification is not the only schema in play, and a city that adopts a proprietary inventory, or a national programme that develops its own, raises switching costs rather than lowering them. On Pheonix’s reading, this is a medium risk with a medium effect: it does not stop the market growing, but it protects the lock-in that standards adoption is otherwise dissolving, and it would slow the migration of value from the collection layer to the allocation layer that sections 2 and 5 describe.
Price deflation is not a risk to be modelled; it is the forecast. Spend per managed bay falls 25.8 per cent across the window, and that number is in the base case rather than in a downside. The corollary is what constitutes a real downside: a market in which bay counts grow more slowly than this forecast assumes. If managed bays grew at 10 per cent rather than 15.23 per cent while unit prices fell at the same rate, total value growth would fall well below 8 per cent — a materially worse outcome than the base case and one that requires only a modest slowdown in municipal digitisation to arrive. The volume line, not the value line, is where the sensitivity sits, because the value line is largely a function of it.
Two risks are commonly cited that this report does not weight heavily. The first is technology obsolescence: the instruments in this market are ordinary, their supply chains are deep, and no credible substitution would strand a deployed estate inside the forecast window. The second is a sudden shift of kerbside demand towards autonomous vehicles. Robotic fleets would certainly consume kerb space and would certainly need scheduled access, and they would increase the value of the very instruments this report counts — an allocation layer with published rules and real-time events. The risk to incumbents is strategic rather than existential, and it sits beyond 2033 rather than inside the window.
The aggregate judgement is a moderate risk market with a specific shape: high probability of continuing slow progress, low probability of collapse, and a concentration of genuine damage in the two places where public money and public consent meet — the grant that starts a programme and the legitimacy that sustains its enforcement. Both are outside the control of every vendor in section 7, which is why the allocation layer’s growth is better understood as a policy variable than as a commercial one.
Regulatory Landscape
The kerbside is regulated in three separate layers, and a city is only as capable as the weakest of them: the power to make a rule about who may use a piece of street, the power to enforce that rule against a vehicle, and the right to process the data required to do either. Most authorities in this report hold the first two and are uncertain about the third. That asymmetry, rather than any gap in technology, is what determines how much of this market a given jurisdiction can buy.
| Instrument | Jurisdiction | What it does to this market |
|---|---|---|
| Road Traffic Regulation Act 1984, s.55 | England and Wales | Creates a parking account; restricts what a surplus may be spent on and requires a deficit to be met from the general fund |
| Traffic Management Act 2004 | England | Moves civil enforcement of parking and certain moving-traffic contraventions to local authorities |
| Civil Enforcement of Road Traffic Contraventions (Approved Devices, Charging Guidelines and General Provisions) (England) Regulations 2022 | England | Governs approved devices, penalty bands and procedure — the rules a camera-based system must satisfy to be lawful |
| Statutory guidance on civil enforcement of parking contraventions | England | Sets the policy framework authorities must have regard to, including discretion and appeals |
| Digital Markets, Competition and Consumers Act 2024 | United Kingdom | Makes drip pricing unlawful, moving price-transparency regulation onto the booking interface |
| UK GDPR and Data Protection Act 2018, with ICO guidance on plate recognition | United Kingdom | Sets the lawful basis, retention limits and transparency obligations for camera and plate data |
| EU Urban Mobility Framework, COM(2021) 811 | European Union | Frames urban access and kerb management inside sustainable mobility planning; guidance rather than direct obligation |
| ADA 2010 Standards for Accessible Design | United States | Sets requirements for accessible parking and curb ramps — the most specific legal obligation attaching to a bay |
| Manual on Uniform Traffic Control Devices | United States | Governs how a restriction must be signed and marked to be enforceable |
| State enabling law and municipal ordinance | United States | Creates the power to regulate, charge and enforce — which is why capability varies city by city rather than state by state |
Source: the instruments as published, read at source. The Curb Data Specification is a voluntary standard rather than law and is treated as such in section 10.
The United Kingdom is the most complete regulatory environment in this market, and it is complete in a way that is easy to miss. Civil enforcement moved from the police to local authorities under the Traffic Management Act 2004, which means the authority that makes the order also enforces it and keeps the proceeds into a parking account whose uses are restricted by section 55 of the Road Traffic Regulation Act 1984. The chain from rule to revenue is unbroken and held by one body. That is why the UK has the densest concentration of payment, enforcement and processing vendors anywhere in the world relative to its road length, and why its constraint is fiscal rather than legal: the authority can do almost anything, and can pay for almost none of it out of the parking account.
The United States is the mirror image. There is no national curb instrument, and the power sits in state enabling law and municipal ordinance, which produces several thousand separate regimes. The Manual on Uniform Traffic Control Devices standardises how a restriction must be signed for it to be enforceable, which is a genuine form of common ground, and the ADA 2010 Standards create the clearest obligation attaching to any individual bay. But the absence of a national data or enforcement standard is the reason the American market is large, fragmented and slow to adopt a common schema — and the reason a voluntary standard led by cities rather than a regulator has become the de facto instrument.
The European Union regulates the objective rather than the instrument. The Urban Mobility Framework places kerb management inside sustainable urban mobility planning and leaves the mechanism to member states and municipalities. That is why European practice varies from the highly prescriptive, as in a London borough publishing a kerbside strategy with a quantified reallocation target, to the barely documented. The value of the European approach is that it legitimises the question — what is the kerb for — without prescribing the answer, which is precisely the stage most American and many Asian cities have not reached.
Two horizontal instruments now reach further into this market than any curb-specific rule. The Digital Markets, Competition and Consumers Act 2024 makes drip pricing unlawful, which converts the booking interface into a regulated surface: a parking app that adds a service fee at checkout is now governed by consumer law as well as by the traffic order. And data protection law, applied through the Information Commissioner’s guidance on plate recognition, determines whether a camera can retain what it reads and for how long — a constraint that shapes product design as directly as any technical standard, and one that varies enough between jurisdictions to make a single European or global deployment genuinely difficult.
The instrument that does not exist is the one that would change this market’s shape. No jurisdiction in this report has created a transferable, priced, published right to occupy kerb space for a defined period — something analogous to a spectrum licence or a landing slot, which would let a city allocate the kerb by rule and let a carrier or an operator hold and trade the right. Every element of such an instrument exists somewhere: dynamic pricing of bays, permit regimes, loading-zone booking, event feeds under a common schema. What does not exist is the legal package that combines them into a property right, and its absence is why the allocation layer stays at 16.5 per cent of spend and why the collection layer remains the market’s revenue engine.
Regulation is therefore the binding constraint on this market, not technology and not demand. A vendor’s addressable market is set less by what its product can do than by what an authority is permitted to charge for, permitted to enforce against, and permitted to retain. The cities at the front of this market are not the ones with the best software. They are the ones whose legal framework lets them ask what the kerb is for and act on the answer.
Sources
- Lambeth Council, Kerbside Strategy: Rebalancing priorities for Lambeth streets (2023)
- Open Mobility Foundation, Meet the Cities Leading the Transformation to Digital Curbs (March 2026)
- Open Mobility Foundation, SMART Curb Collaborative Final Report (February 2026)
- Institute of Transportation Engineers, Curbside Management Practitioners Guide (2018)
- NACTO, Curb Appeal: Curbside Management Strategies for Improving Transit Mobility (2017)
- G. Dalla Chiara and A. Goodchild, ‘Do commercial vehicles cruise for parking? Empirical evidence from Seattle’, Transport Policy (2020)
- Road Traffic Regulation Act 1984, section 55
- Traffic Management Act 2004
- Civil Enforcement of Road Traffic Contraventions (Approved Devices, Charging Guidelines and General Provisions) (England) Regulations 2022
- Department for Transport, Statutory guidance for local authorities in England on civil enforcement of parking contraventions (updated October 2022)
- Digital Markets, Competition and Consumers Act 2024
- Information Commissioner’s Office, guidance on automatic number plate recognition and surveillance cameras
- European Commission, The New EU Urban Mobility Framework, COM(2021) 811 final
- US Department of Justice, 2010 ADA Standards for Accessible Design
- Federal Highway Administration, Manual on Uniform Traffic Control Devices
All links are to the publisher’s own page and were checked at the time of writing. No third-party market-research publication is cited anywhere in this report.
Sources and method
This report is built 70 per cent on secondary evidence and 30 per cent on Pheonix’s own primary research, and the division of labour is deliberate. The secondary 70 per cent establishes the arithmetic and the law: the physical extent of a city’s kerb and what it is used for, the measured cost of commercial vehicles cruising for somewhere to stop, the standards a digital inventory must meet, and the statutory limits on what an authority may charge for and do with the money. It is drawn from municipal strategy documents, peer-reviewed transport research, standards bodies and the legal instruments themselves, each named and linked above.
The primary 30 per cent establishes behaviour, which secondary sources cannot supply: who inside an authority actually owns the allocation decision, how a business case is written when the parking account cannot fund it, why a loading zone is created or refused, what happens to a platform after the grant closes, and how carriers work around a kerb that has no space for them. It takes four forms — structured interviews with city transport, parking and kerbside managers and with vendor commercial teams; conference-floor and closed-door discussion at transport-technology and parking-industry gatherings; open-ended interviews with freight operators and last-mile carriers on loading behaviour and dwell times; and a survey programme across operators and city staff on enforcement practice and detection method. Where a figure in this report is a Pheonix estimate rather than a disclosed one, the text says so at the point of use. The market value, the managed-bay count, the spend per bay, and all segment and regional splits are constructed here and labelled accordingly.