
Global Ready-Mix Concrete Market Report, Size, Share and Forecast 2026–2033: 3,950 Million m³ That Cannot Be Shipped, a 5.9× Price Spread, and the Half of China's Market That Vanished
Market Snapshot
Ready-mix concrete is a USD 290,279 million market in 2025 that becomes a USD 363,106 million market in 2033 — and it is not one market at all. It is the arithmetic sum of several thousand local delivery monopolies, none of which can sell into another's territory, because the product sets in a few hours and cannot be transported further than a truck can drive it. Global volume falls from 3,953 to 3,850 million cubic metres across the forecast — a volume CAGR of minus 0.33 per cent — against a value CAGR of 2.84 per cent and a blended price that rises from USD 73.43 to USD 94.31 a cubic metre (3.18 per cent). Nothing in that gap comes from making more concrete.
Three facts organise everything that follows.
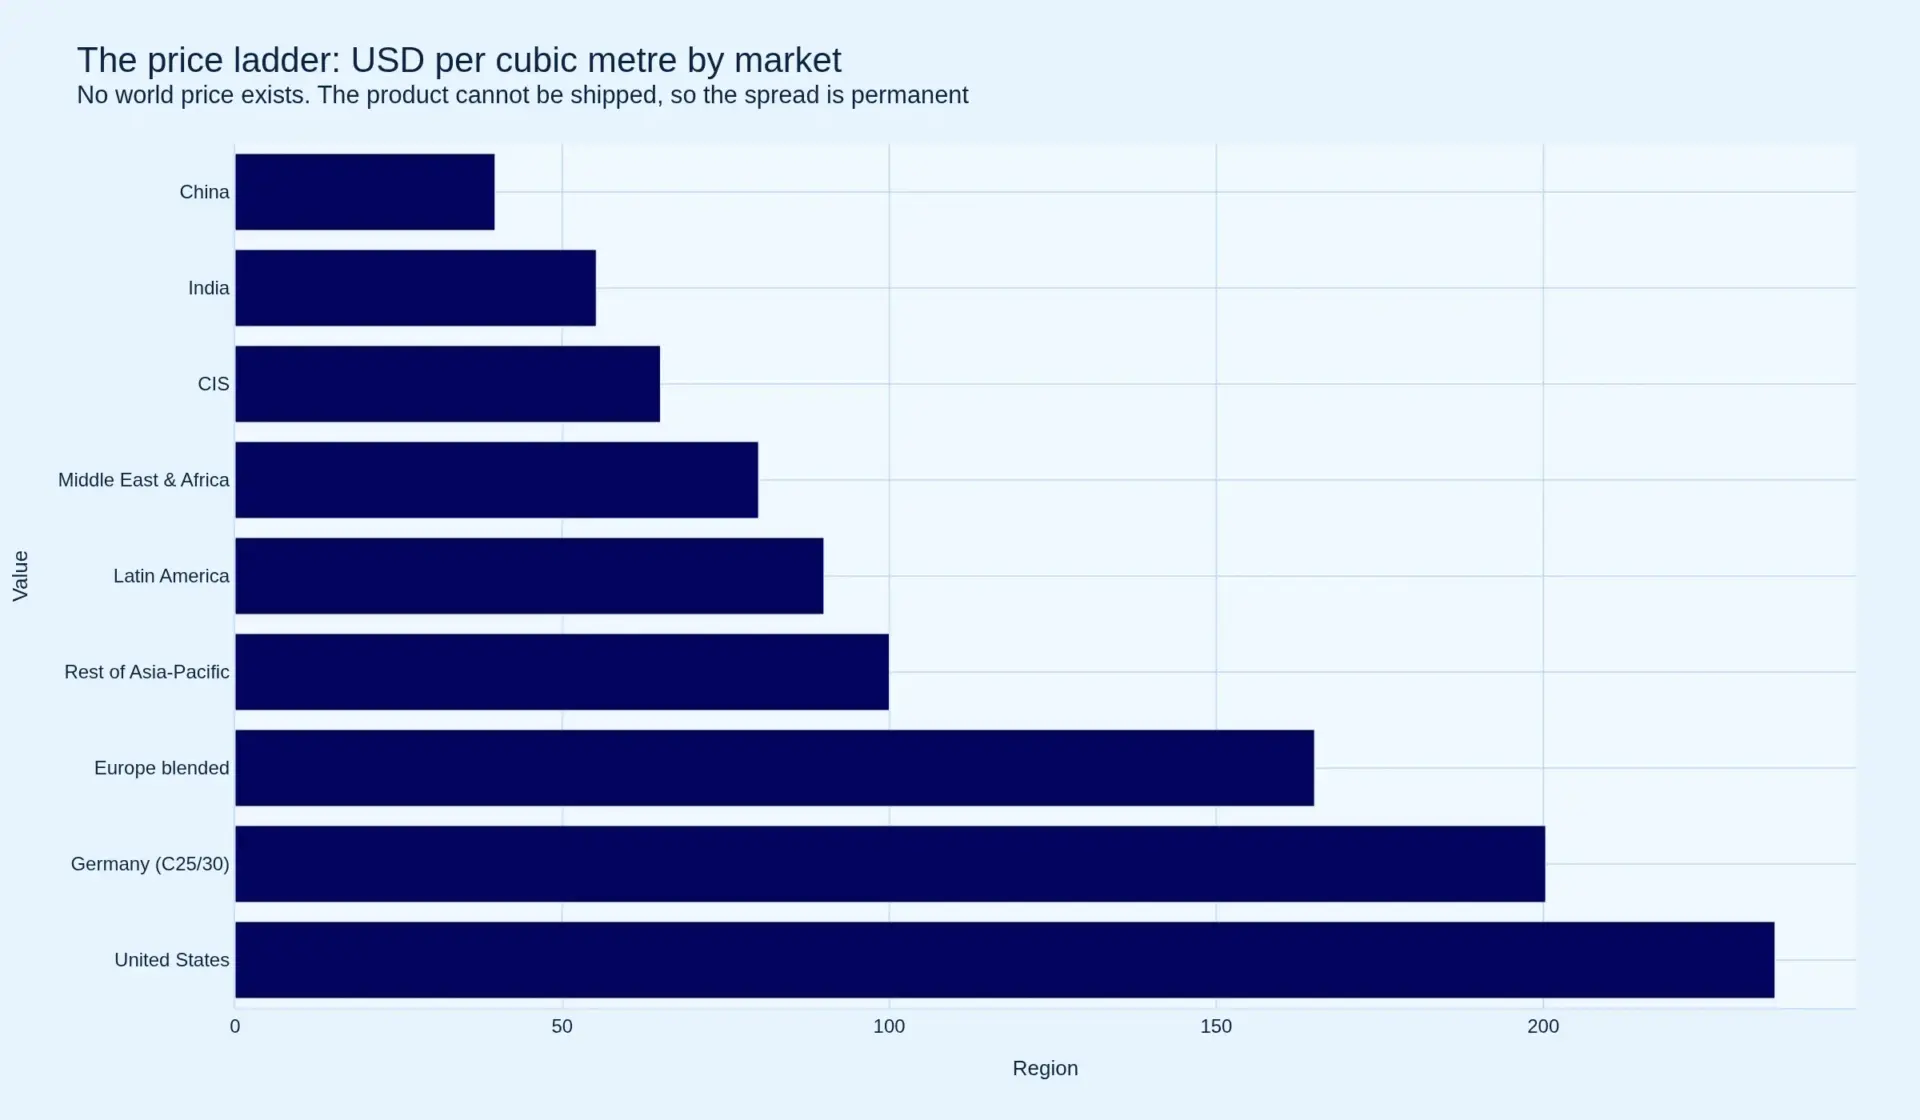
First, ready-mix has no world price, and the dispersion is 5.9 times. A cubic metre of C25/30 sits on a published German price list in the Donau-Iller region at EUR 185.50. The United States weighted average was USD 179.95 a cubic yard in 2025, which is USD 235.40 a cubic metre. China's national average at the end of 2025 was RMB 284 a cubic metre, or USD 39.72 — a ten-year record low. There is no arbitrage between those numbers and there never will be, because concrete is a service sold with a shelf life measured in hours. Every other material in this chain — cement, clinker, aggregates, even sand — trades in a band. Concrete does not.
Second, China deleted half its own market value in four years, and nothing replaced it. Chinese ready-mix output went from 3.29 billion cubic metres in 2021 to 2.288 billion in 2025, a fall of 30.5 per cent over four consecutive annual declines. Over the same period the industry's own output-value series went from RMB 1.3 trillion to RMB 0.85 trillion by 2024, and to roughly RMB 0.65 trillion on 2025's volume and price — minus 50.0 per cent. China is still 57.9 per cent of the world's ready-mix volume. It is no longer half its value: it is 31.3 per cent in 2025, falling to 22.1 per cent by 2033.
Third, the growth is entirely price, and price is a property of local market structure rather than of cost. Measured as a bridge, the eight-year increase decomposes into minus USD 7,563 million of volume, plus USD 82,539 million of price and minus USD 2,151 million of interaction, summing to the USD 72,825 million difference between the two totals. Volume subtracts from the growth. Price is the whole of it. And the cement inside a cubic metre — the only input with a traded price — is 36.8 per cent of the Chinese cubic metre and 18.6 per cent of the American one. The American cubic metre is not expensive because of its cement. It is expensive because of its sand, its trucks, its labour, and the fact that two producers own the dispatch radius.
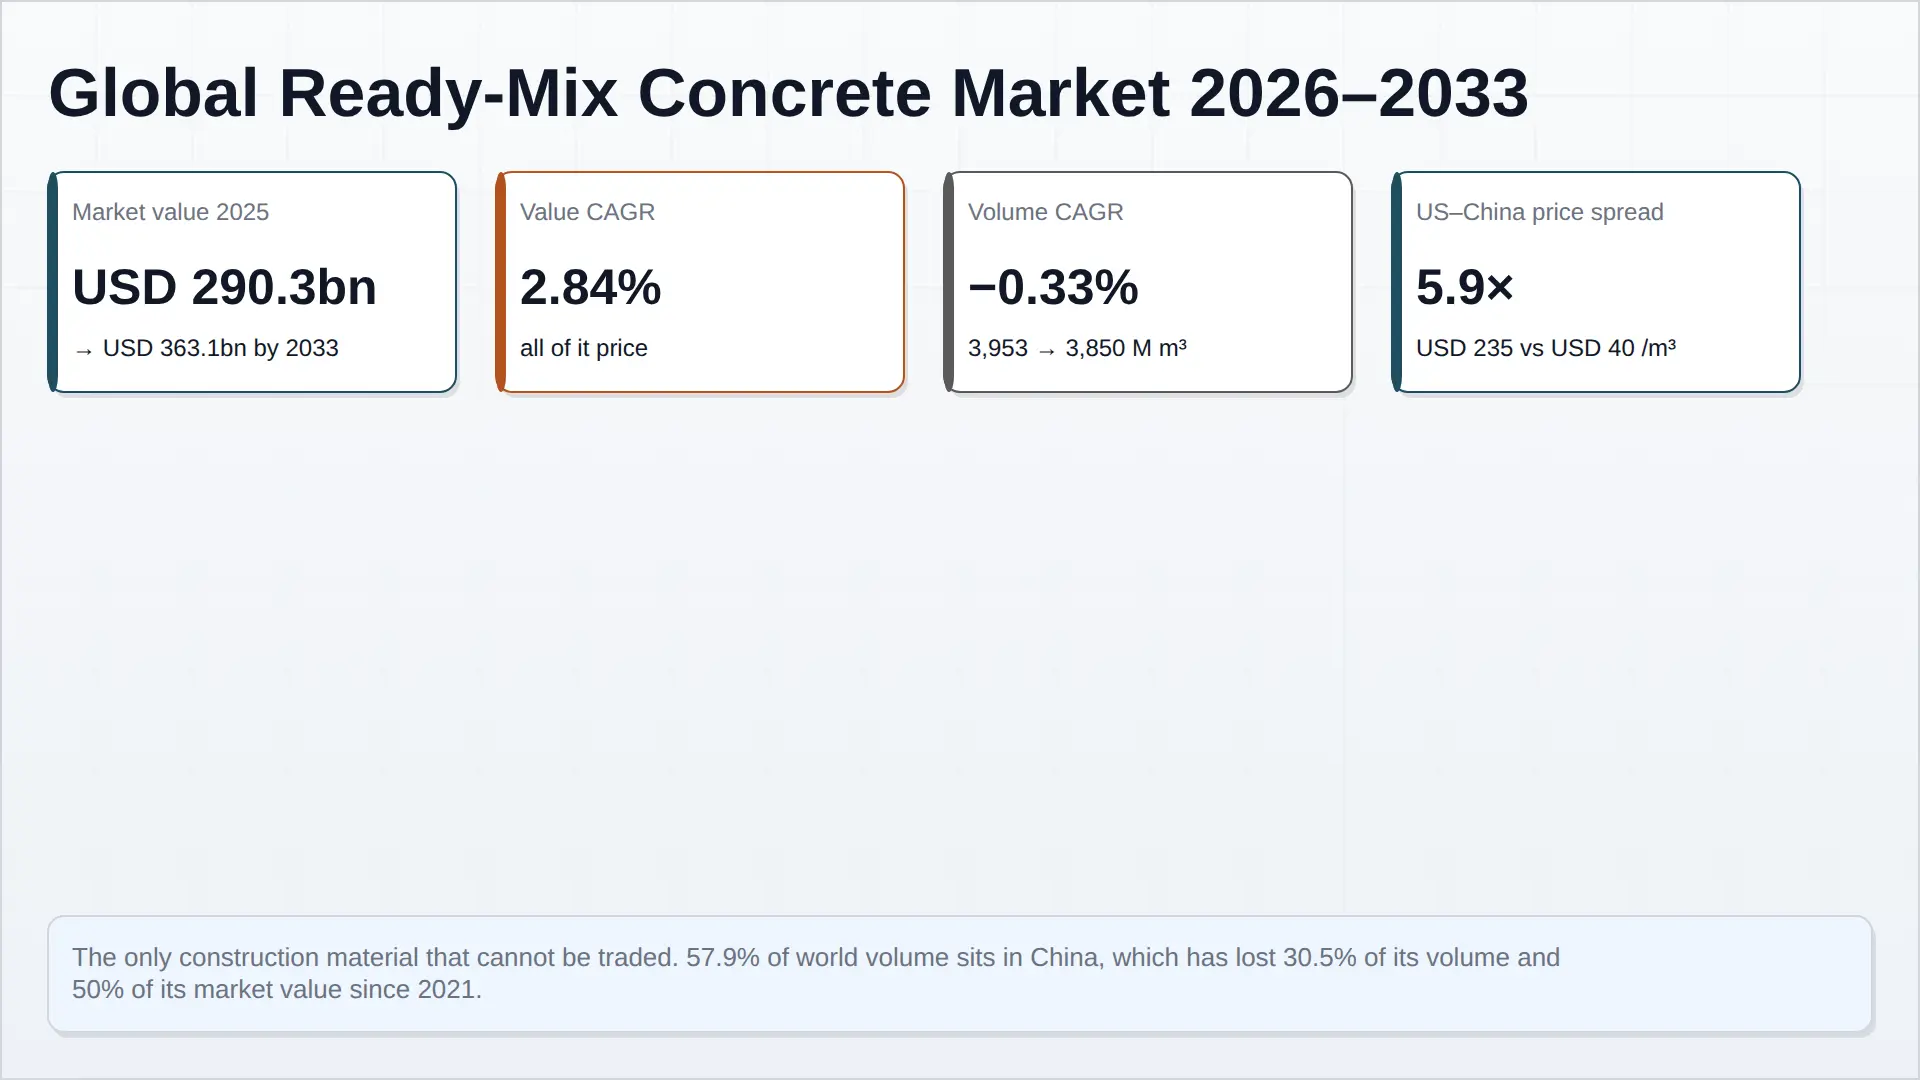
The global ready-mix concrete market at a glance. Value grows 2.84 per cent a year while volume falls 0.33 per cent — every dollar of the eight-year increase comes from price, and 57.9 per cent of the volume sits in one country that is contracting.
| Metric | 2025 | 2033 | CAGR |
|---|---|---|---|
| Market value, delivered, USD million | 290,279 | 363,106 | 2.84% |
| Ready-mix volume, million m³ | 3,953 | 3,850 | −0.33% |
| Blended realised price, USD per m³ | 73.43 | 94.31 | 3.18% |
| China volume, million m³ | 2,288 | 1,780 | −3.09% |
| India volume, million m³ | 300 | 520 | 7.12% |
| China share of world volume | 57.9% | 46.2% | — |
| China share of world value | 31.3% | 22.1% | — |
| Ready-mix as a share of global concrete volume | 31.6% | 31.5% | — |
| Low-carbon formulation share of value | 8.5% | 17.2% | 12.23% |
| US–China price spread, multiple | 5.9× | — | — |
This number had to be built rather than bought, and the reader is entitled to know how far each part of it is measured. Three of the eight regional volumes are official association measurements: China at 2,288 million m³ from the China Concrete and Cement Products Association, the United States at 289,898,000 m³ in 2024 and 285,300,000 in 2025 from the National Ready Mixed Concrete Association's state-by-state series, and the European Union at 239.0 million m³ from ERMCO's members' returns. Japan, Russia and South America come from ERMCO's corresponding-member table. India is a penetration calculation off a stated 25 per cent ready-mix share. The remainder is a Pheonix construction, labelled as such, and section 3.1 sets out exactly which is which.
Table of Contents
Market Definition and the Six Boundary Calls
A ready-mix number is meaningless without its boundary, because the same concrete can be counted at the plant gate, at the drum, or at the point of placement — and the three differ by the price of a truck. This report draws six lines explicitly so a reader can move any of them and re-run the arithmetic.
2.1 The product is ready-mix concrete, delivered and unset
Ready-mix concrete is concrete batched to an engineered mix design at a central plant and delivered to site in a truck mixer while still workable. It is a service wrapped around a material: the customer buys a placement, a slump and a strength at a time, not a powder in a bag. Site-mixed concrete, precast, concrete block, mortar and dry-bagged mixes are outside the boundary and are the largest single omission — site-mixing is still roughly a third of world concrete volume and is the substitute every ready-mix producer is actually competing against.
2.2 Valued at the point of delivery, which is where the price lives
Every figure is delivered value, including the haul. This is deliberately different from the cement report in this series, which is ex-works, because ready-mix is the haul: the average distance from depot to site is about 8 kilometres, the average truck load is 6 cubic metres on vehicles that will hold up to nine, and the cost of getting the drum to the pour is a larger share of the price than the cement in the mix. Valued ex-works, this market would be a rounding error attached to a haulage business.
2.3 Cement is the smallest input by value in the high-price markets
At a typical 292 kilograms of cement per cubic metre, the binder costs about USD 14.60 in China at USD 50 a tonne and USD 43.80 in the United States at USD 150 a tonne — 36.8 per cent of the Chinese cubic metre and 18.6 per cent of the American one. Cement is inside the value chain, not inside the boundary. Aggregates, construction aggregate, are counted as an input and are the largest single physical component at roughly 1,850 kilograms per cubic metre.
2.4 Formulation is the product, and it is priced
Low-carbon, high-performance and specialty formulations are separated as distinct product lines because they carry distinct prices, not because they are chemically different materials. A cubic metre sold as ECOPact or as a 30-per-cent-clinker-replacement mix with an EN 15804 declaration is the same truck and the same plant as a commodity C25/30. The difference is a specification document and a price, and this report treats that difference as a market segment.
2.5 Captive and internally transferred volume is counted at market-equivalent value
Where an integrated group quarries its own aggregate or consumes its own cement — UltraTech consumed 3.8 million tonnes of its own grey cement into ready-mix in FY2025 — the transfer is counted at a price approximating the open market, so that integrated and independent producers are compared on the same basis.
2.6 Informal batching is outside, and the bias direction is stated
China's small-scale and unregistered batching stations, and artisanal production across South Asia, West Africa and parts of Latin America, have no usable series and are excluded. China's official ready-mix figures cover above-scale enterprises, so the true Chinese total is higher than the number used here. The base is therefore a floor, and the direction of the error is known.
Market Size and Forecast
The base is built upward from three measured national series, one penetration calculation, and a price ladder anchored on published price lists and company realisations.
3.1 How the 2025 base was built
- China: 2,288 million m³, measured. The China Concrete and Cement Products Association reported 2025 national ready-mix output of 2.288 billion m³, down 8.7 per cent, the fourth consecutive annual decline (China Concrete and Cement Products Association, Ready-Mixed Concrete Industry Development Report 2025). The series runs 3.29 billion m³ in 2021, 3.03 in 2022, 2.69 in 2023 and 2.49 in 2024, the last reported at the association's C10+ summit in Changsha in February 2025 with an output value of approximately RMB 850 billion (China Cement Network, 26 February 2025).
- United States: 289.9 million m³ in 2024 and 285.3 in 2025, measured. The National Ready Mixed Concrete Association's state series gives 379,149,000 cubic yards for 2024, equal to 289,898,000 m³, with Texas at 17.7 per cent, California 8.7 per cent and Florida 8.2 per cent (NRMCA, Estimated Ready Mixed Concrete Production by State 2024). Concrete Financial Insights puts 2025 at 373 million cubic yards, 1.7 per cent lower, which is 285.3 million m³ (Concrete Financial Insights, US Concrete Industry Data). The two independent series agree to within a tenth of a percentage point of the growth rate.
- European Union: 239.0 million m³, measured. ERMCO's 2023 members' returns give EU production of 239.0 million m³, against 262.1 in 2022 and 271.2 in 2021 — a fall of 11.9 per cent in two years — with 11,462 batching plants and 67.6 per cent of European cement consumption going into ready-mix (ERMCO, Ready-Mixed Concrete Industry Statistics Year 2023; ERMCO statistics). Türkiye, Israel, Norway, Switzerland and the United Kingdom add a further 169.3 million m³ on the same returns.
- India: 300 million m³, derived. The head of UltraTech's ready-mix business put Indian ready-mix penetration at 25 per cent in October 2024 and expects 30 per cent (The Hindu, 16 October 2024). Applied to a concrete market of roughly 1.2 billion m³ derived from Indian cement consumption, that is 300 million m³.
- Japan 68, Russia 38, South America 135: ERMCO corresponding members. Japan was 71.6 million m³ in 2023 and has declined every year in the series; South America is carried at 134.5 million m³ and has not been restated since 2018.
- Remaining regions: Pheonix constructions. Rest of Asia-Pacific 400 million m³, Middle East and Africa 180, Latin America outside South America's reported total is inside the 135, and the CIS outside Russia inside the 55. These are built from construction-output and cement-consumption ratios and are disclosed as estimates.
- Prices: published lists and realised company revenue. Germany from Heidelberg Materials' Donau-Iller price list valid 1 October 2025, where C25/30 is EUR 185.50 and C50/60 is EUR 214.00 (Heidelberg Materials, Preisliste Beton Donau-Iller, 1 October 2025). The United States from the USD 179.95 a cubic yard weighted average of 2025. China from the RMB 284 a cubic metre national average at end-2025. India from UltraTech's Rs 6,170 crore of ready-mix revenue, and Türkiye, the Gulf, Brazil and the CIS from Pheonix constructions benchmarked against those anchors.
- The cross-check that the volume is right. Global concrete consumption is approximately 30 billion tonnes a year — about 12.5 billion m³ at 2.4 tonnes a cubic metre (Nature, February 2025). Ready-mix at 3,953 million m³ is 31.6 per cent of it. That is not a coincidence and not a calibration: Europe's own ratio is 67 per cent of concrete production and the United States is above 80 per cent, so a global 31.6 per cent is a measure of how much of the world still mixes on site. The gap between 31.6 per cent and the European 67 per cent is the entire volume story of this forecast.
3.2 The regional allocation is the forecast
Because the global total is flat, the forecast is entirely a question of which region carries which cubic metres and at what price. The eight-year path is stated as eight rows and nothing else.
| Region | Volume 2025 (M m³) | Volume 2033 (M m³) | Volume CAGR | Value 2025 (USD m) | Value 2033 (USD m) | Value CAGR | Price 2025 (USD/m³) | Price 2033 (USD/m³) |
|---|---|---|---|---|---|---|---|---|
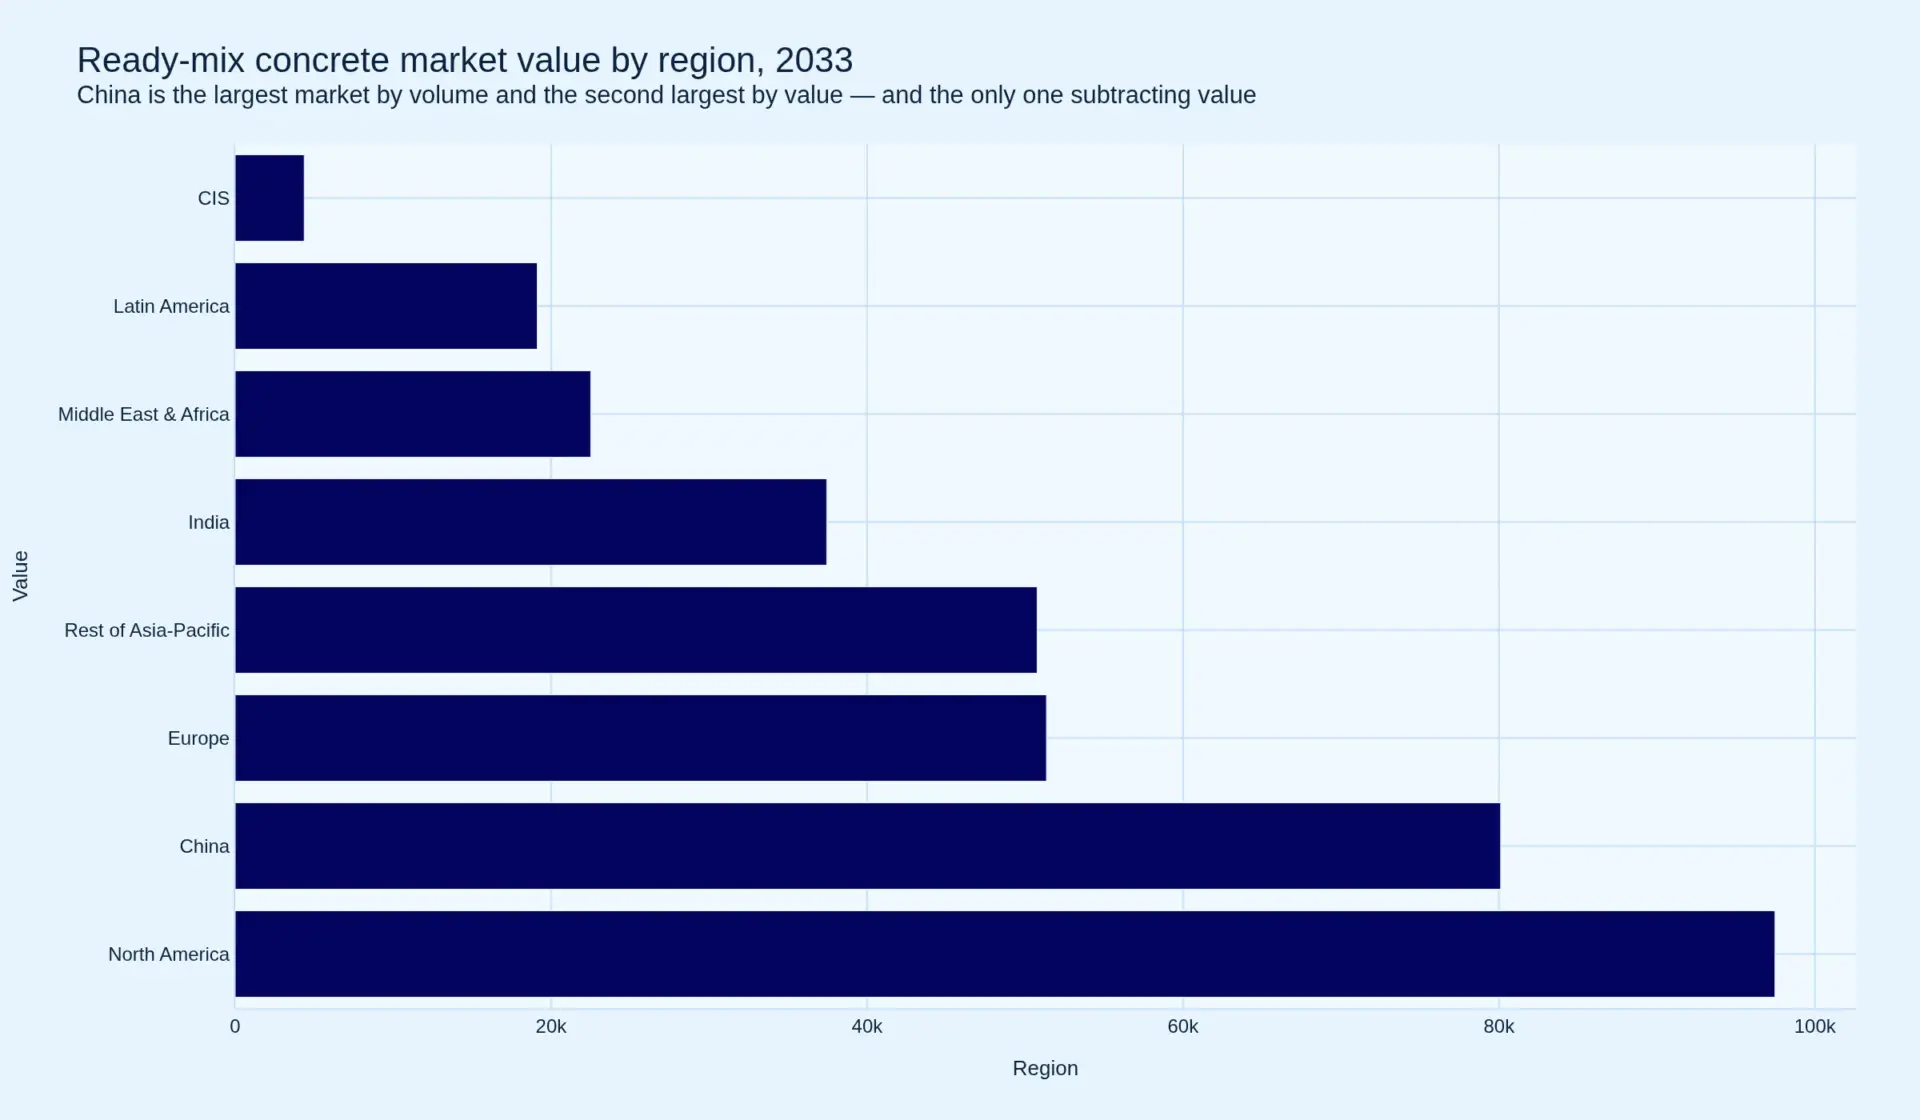
| China | 2,288 | 1,780 | −3.09% | 90,879 | 80,100 | −1.57% | 39.72 | 45.00 |
| India | 300 | 520 | 7.12% | 16,500 | 37,440 | 10.79% | 55.00 | 72.00 |
| Rest of Asia-Pacific | 400 | 470 | 2.03% | 36,000 | 50,760 | 4.39% | 90.00 | 108.00 |
| Europe | 250 | 262 | 0.59% | 41,250 | 51,352 | 2.78% | 165.00 | 196.00 |
| North America | 345 | 372 | 0.95% | 74,175 | 97,464 | 3.47% | 215.00 | 262.00 |
| Middle East and Africa | 180 | 232 | 3.22% | 14,400 | 22,504 | 5.74% | 80.00 | 97.00 |
| Latin America | 135 | 158 | 1.99% | 13,500 | 19,118 | 4.45% | 100.00 | 121.00 |
| CIS | 55 | 56 | 0.22% | 3,575 | 4,368 | 2.54% | 65.00 | 78.00 |
| Total | 3,953 | 3,850 | −0.33% | 290,279 | 363,106 | 2.84% | 73.43 | 94.31 |
Rows are computed from unrounded volume and price and displayed to the nearest USD million; a row's displayed value can differ from the product of its displayed inputs by up to one unit.
Two regions do the work, and neither of them is the largest. North America adds USD 23,289 million on 27 million cubic metres of new volume — the highest value added per cubic metre in the world, because it starts from the highest price. India adds USD 20,940 million and 220 million cubic metres, the largest volume addition of any region, on a price base a quarter of the American one. China subtracts USD 10,779 million and 508 million cubic metres, which is the single largest movement in the table. The world adds 2,210 million cubic metres outside China and loses 508 inside it, netting to a fall of 103.
3.3 The decomposition is the finding
Hold 2025 prices and the loss of 103 million cubic metres is worth minus USD 7,563 million. Hold 2025 volumes and the USD 20.88 a cubic metre price increase is worth plus USD 82,539 million. The interaction of the two is minus USD 2,151 million. The three sum to USD 72,825 million, which is the USD 72,827 million difference between the two totals to within rounding.
| Effect | USD million | Share of growth |
|---|---|---|
| Volume (−103 M m³ at 2025 price) | −7,563 | −10.4% |
| Price (USD 20.88/m³ on 2025 volume) | 82,539 | 113.4% |
| Interaction | −2,151 | −3.0% |
| Total increase | 72,825 | 100.0% |
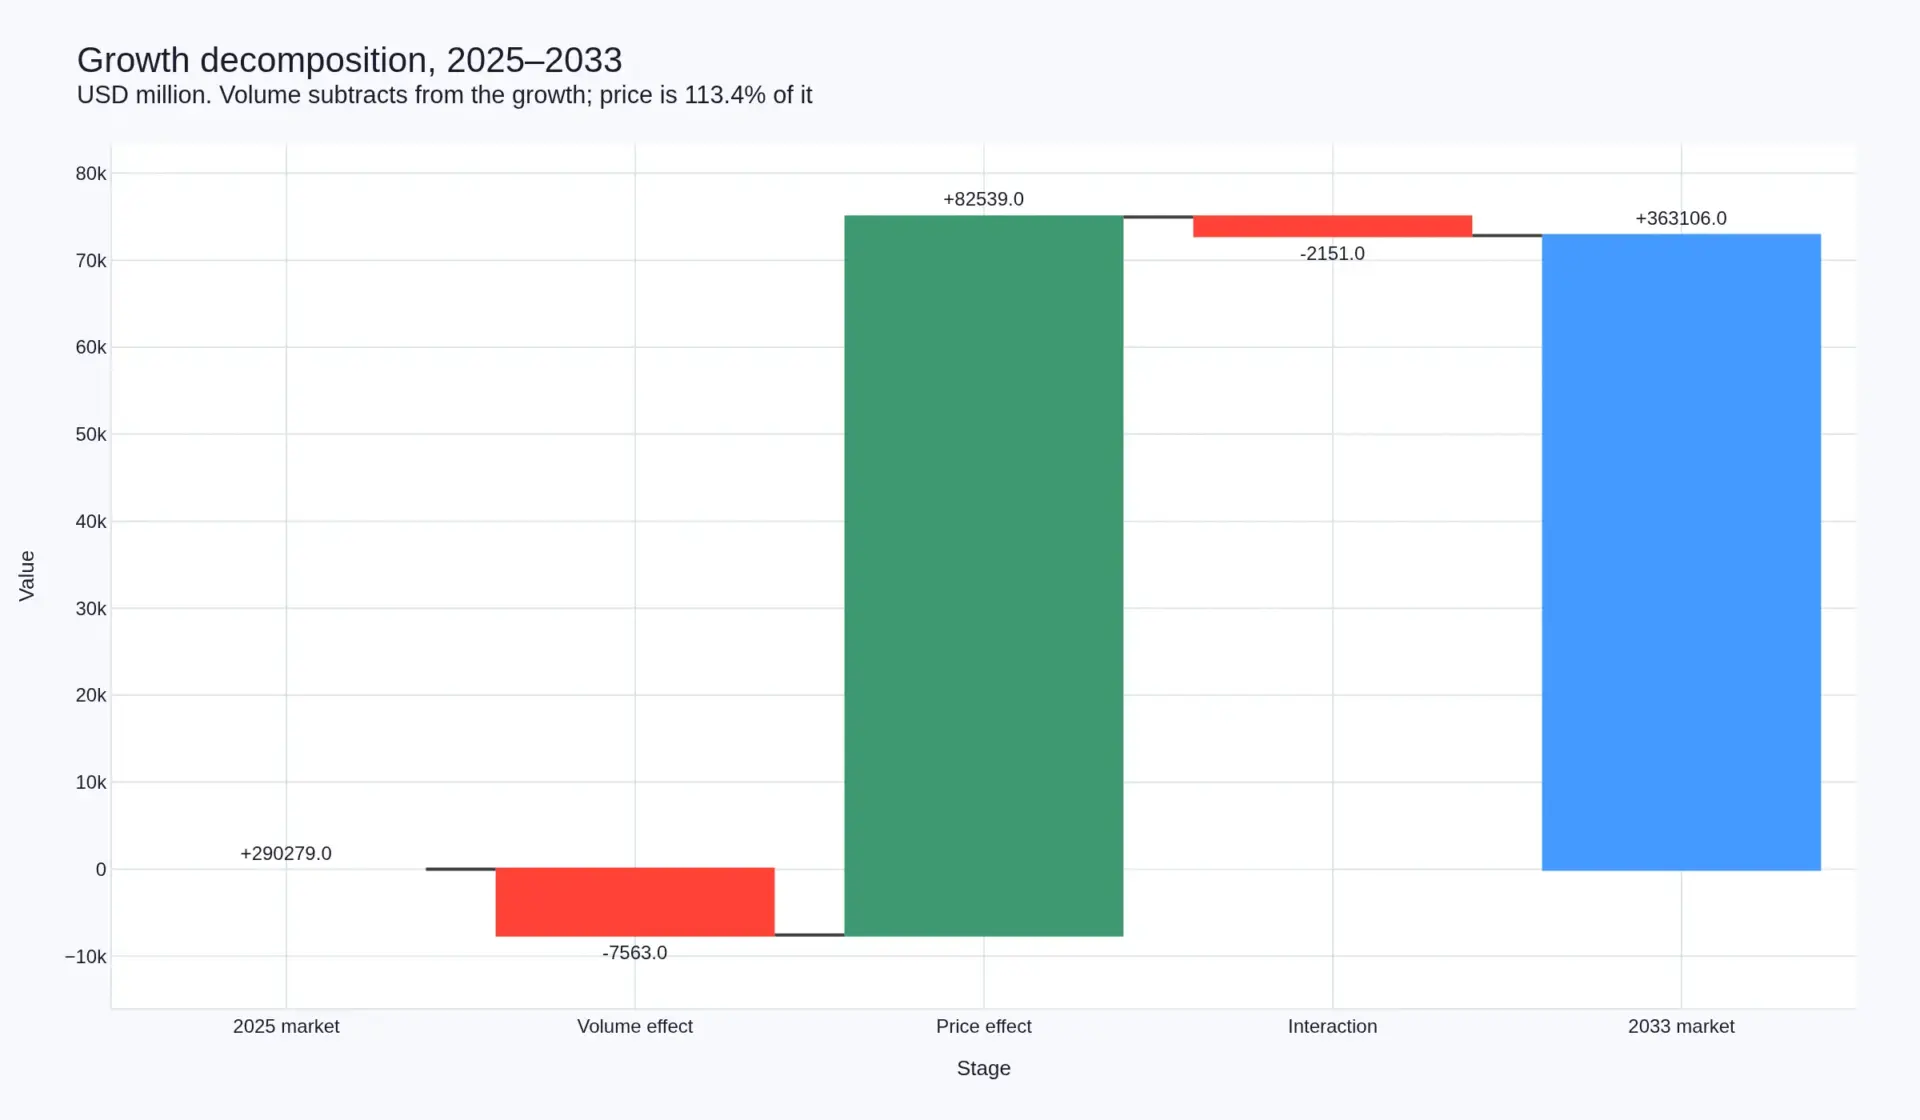
This is a stronger statement than the one available for cement, and it should be read carefully. In cement, volume still contributes a positive tenth of the growth. In ready-mix it contributes nothing at all: the world will place slightly fewer cubic metres in 2033 than in 2025, and every dollar of the increase is a price effect worth 113 per cent of the total, partly clawed back by a negative interaction. A producer that wins volume share in this market is buying revenue at the price of the interaction term. The interaction is negative precisely because the volume being lost is Chinese and the price being gained is American and Indian.
Four Structural Shifts Defining 2026–2033
4.1 The volume peak is behind us and it was one country
China's ready-mix output has fallen in every year since 2021: 3.29 to 3.03 to 2.69 to 2.49 to 2.288 billion cubic metres. The four-year fall is 30.5 per cent, and the 2025 decline of 8.7 per cent is a deceleration from 2024's 10.1 per cent rather than a recovery — the association's own words are that demand is "shifting from a plateau to a downturn". Fixed-asset investment fell 3.8 per cent in 2025, infrastructure investment declined outright, and real-estate investment fell faster still.
What makes this structural rather than cyclical is what has happened to price on the same volume. China's national average ready-mix price ended 2025 at RMB 284 a cubic metre — a ten-year record low, more than RMB 220 below its end-2021 peak, and more than RMB 50 below where it started the year. Regionally, East China is the strongest market and still below RMB 300; North China and the Northeast are at roughly RMB 260; South Central fell more than 20 per cent year on year. A market that loses 30 per cent of volume and 44 per cent of price has lost half its value, and the two are not independent. The industry's own output series says so: RMB 1.3 trillion in 2021, RMB 1.27 trillion in 2022, RMB 1.05 trillion in 2023, RMB 850 billion in 2024, and about RMB 650 billion on 2025's volume and price. Minus 50.0 per cent.
The consolidation is happening into that contraction rather than out of it. China Cement Network's 2024 capacity ranking puts CNBM's ready-mix capacity at 412 million cubic metres, Huaxin Cement at about 120 million and Western Construction at 119 million, with the top thirty holding 1.355 billion cubic metres, up 6.78 per cent year on year (China Cement Network, 17 July 2025). Capacity concentrating while output falls tells you the industry is competing on the balance sheet, not on the pour.
4.2 Price is a local structure variable, not a cost variable
There is no global concrete price and there is no mechanism that could create one. Ready-mix has a shelf life of hours, an average delivery distance of about 8 kilometres, and an average load of 6 cubic metres on a vehicle that holds up to nine (Jordan Journal of Mechanical and Industrial Engineering, costing of ready-mix production and delivery). Those three numbers define the market: a plant's addressable territory is a radius, the customer cannot import a substitute tonne from a cheaper country, and the only competitive alternative is to mix on site.
Which is why the same product trades at a 5.9-fold spread between the two largest developed markets and the largest emerging one.
| Market | Price as published | USD per m³ | Basis |
|---|---|---|---|
| Germany, C25/30 | EUR 185.50/m³ | 200.34 | Published price list, Donau-Iller, 1 October 2025 |
| Germany, C50/60 | EUR 214.00/m³ | 231.12 | Same list, highest strength class |
| United States, weighted average | USD 179.95/yd³ | 235.40 | Producer-reported weighted average, 2025 |
| United States, Titan America | USD 162.36/yd³ | 212.36 | Company disclosure, FY2025 |
| India, UltraTech realisation | Rs 4,746/m³ | 55.19 | Derived from FY2025 ready-mix revenue and volume |
| China, national average | RMB 284/m³ | 39.72 | National average, end-2025, ten-year low |
The decomposition of that spread is the most useful thing in this report. Cement is the only input with a traded price, and it is not what separates these markets. At 292 kilograms per cubic metre, the binder costs about USD 14.60 in China and USD 43.80 in the United States. That is a 3.0-fold gap on a component that is 36.8 per cent of the Chinese price and 18.6 per cent of the American one. The overall spread is 5.9-fold. Cement explains about half of the dispersion and the other half is sand, haulage, labour and local market structure.
This is why the American price decelerated exactly as its volume flattened, and why the deceleration is visible in one clean series. The weighted average selling price of the US producers that disclose it went USD 113.08 in 2016 to USD 179.95 in 2025, a 5.3 per cent compound — but the annual increases were 13 per cent in 2022, 13 per cent in 2023, 8 per cent in 2024 and 4 per cent in 2025 (Concrete Financial Insights). Four straight halvings. Titan America's own realisation went up 1.2 per cent in 2025 to USD 162.36 a cubic yard while its external ready-mix volume rose 0.2 per cent and its aggregates volume rose 36.5 per cent (Titan America, FY2025 results). The price lever is running out of travel, and the companies know it, which is why they are buying aggregates.
4.3 The binding input is sand and aggregate, not cement
Every conversation about concrete decarbonisation is a conversation about cement. The bigger physical constraint is the other 78 per cent of the mix. Thirty billion tonnes of concrete a year consumes roughly 19 billion tonnes of sand and aggregate; a single-family house takes 200 tonnes of it, a hospital 3,000 tonnes, and a kilometre of motorway 30,000 tonnes (SWI swissinfo.ch, 5 September 2025). The constraint is already binding in specific places: the extension of a runway at Manila's airport was suspended for lack of sand, and Belgium is estimated to have about 80 years of sand reserves with the Netherlands fewer.
The producer who can substitute is the ready-mix plant, and it already can — technically. Construction and demolition waste is more than a third of all EU waste and is mostly concrete; recycled aggregate is permitted in standards, the new Eurocode for reinforced concrete contains clauses for recycled-aggregate concrete, and a 30 per cent mean incorporation rate would recover around 30 per cent of all non-soil construction waste. And yet, in the European Commission's own assessment, "in most Member States, RAC is hardly (if ever) produced" — because recycled aggregate is downcycled, because selective demolition is rare, and because the specification rarely asks for it (European Commission Joint Research Centre, Use of recycled aggregates in concrete).
That is the most important sentence in this report about circularity: the barrier is procurement, not engineering. The standard permits it, the design code permits it, the supply exists as demolition waste, and the market does not ask for it. When the market starts asking, the ready-mix plant is the only actor positioned to answer — it is the only one that controls the mix design and can absorb a variable aggregate without changing what it sells.
4.4 Consolidation moved to aggregates, and the ready-mix plant became a channel
The capital in this industry is no longer going into concrete. It is going into the two things a ready-mix plant needs and cannot substitute: the quarry and the client relationship.
Holcim closed 2025 with CHF 15,724 million of net sales, up 3.0 per cent in local currency, and a recurring EBIT margin of 18.3 per cent, having completed eighteen acquisitions in the year, and it is acquiring a majority stake in Cementos Pacasmayo in Peru — three cement plants and 28 ready-mix and precast concrete plants, on USD 0.6 billion of net sales at an implied 7.1 times 2025 EBITDA (Holcim, FY2025 results). Heidelberg Materials bought BURNCO Rock Products in Canada and Walan Specialty Construction Products in the United States and closed the year at a 21.8 per cent RCOBD margin on EUR 21.5 billion of revenue (Heidelberg Materials, 25 February 2026). CRH bought Eco Material Technologies for USD 2.1 billion in mid-2025 — not a concrete asset, a supplementary cementitious materials business (US Department of Energy, State of Innovation 2025).
And the one genuinely new equity event in the industry was a ready-mix-weighted company going public. Titan America, whose Florida business was built out of Tarmac America's ready-mix and block operations and the S&W Ready Mix acquisition of 26 Carolina plants, listed on the New York Stock Exchange in February 2025 at USD 16.00 a share, raising net proceeds of USD 136.8 million for the company and USD 228 million for its parent (Titan America, 10 February 2025). A business that delivers 4.6 million cubic yards of concrete a year at USD 162 a yard is now a public market comparable. That is the clearest signal available that ready-mix, which nobody wanted to own a decade ago, has become an asset class.
Market Drivers
5.1 Infrastructure spending, and the public client who specifies
Infrastructure is the fastest-growing application in this forecast at 4.14 per cent, rising from USD 95,800 million to USD 132,500 million and from 33.0 to 36.5 per cent of the market. But the reason infrastructure matters to ready-mix is not the tonnage. It is that the public client is the only client that writes a specification, and the specification is the product. Ireland's public procurement guidance is the template: from projects commencing design on 1 September 2024, public bodies are told to specify a minimum of 30 per cent clinker replacement consistent with IS EN 206, to not procure high-carbon CEM I except on technical justification, and to seek an Environmental Product Declaration to EN 15804 (Department of Enterprise, Tourism and Employment, Ireland).
That is not a product regulation. It is a purchasing decision, and it reaches the ready-mix plant directly, because the plant is who has to formulate a 30-per-cent-replacement mix that still hits C30/37 at the pump. In a market where no product law can cross a border, procurement is the only lever with reach.
5.2 Penetration, not construction, is where the volume is
Global concrete consumption is roughly 12.5 billion cubic metres a year and is not growing quickly. Ready-mix is 31.6 per cent of it. Europe is at about 67 per cent of concrete production and the United States above 80 per cent. Every point of penetration gained in India, South-East Asia and Africa is volume that does not require a single new building. India alone, moving from the 25 per cent penetration its own industry states to the 30 per cent it expects, adds 60 million cubic metres on an unchanged concrete market — before any construction growth at all. That is the mechanism behind the 7.12 per cent Indian volume CAGR, and it is why the Indian price is the second-lowest in the world and can still support a 10.79 per cent value CAGR.
5.3 Low-carbon formulation is a revenue event for the plant
Low-carbon formulation is the fastest-growing product line in this market at 12.23 per cent, moving from 8.5 to 17.2 per cent of value. The reason it is a revenue line rather than a cost line is structural: a cement producer can only sell a greener powder, while the ready-mix producer is the only actor in the chain that formulates. Holcim's numbers show the trajectory — ECOPact reached 31 per cent of ready-mix net sales in 2025, from 26 per cent in 2024, while ECOPlanet reached 36 per cent of cement net sales from 34 per cent. Concrete is converting faster than cement, from a lower base, and the customer is paying for the document and the mix rather than for a different kiln.
5.4 Plant density and load factor
A ready-mix plant is a fixed-cost asset with a very short reach, so its economics are set by two ratios: how many cubic metres each truck sells per shift, and how many cubic metres each plant batches per year. The industry's averages — 6 cubic metres a load, 8 kilometres a haul, 20,000 to 30,000 cubic metres a plant a year in Europe — describe a business where a 10 per cent improvement in cycle time is worth more than a 10 per cent improvement in the cement price, because cement is 19 per cent of an American cubic metre and the fleet is most of the rest. The strategic consequence is that density is worth paying for: an acquisition that adds plants inside an existing radius adds margin, and one that adds plants in a new city adds only revenue.
5.5 Urban bans on site-mixing
The most powerful demand driver in the emerging world is a municipal by-law. Chinese urban bans on on-site mixing made ready-mix the default for city construction and are the reason the country's ready-mix industry reached 3.29 billion cubic metres by 2021. The same instrument now sits in every fast-urbanising market, and it explains the asymmetry in this forecast: China's ready-mix volume fell 30.5 per cent while Chinese construction did not fall by 30.5 per cent. Penetration rose; the underlying pour shrank faster.
Market Restraints
6.1 China's property correction is the restraint, and it is arithmetic
China is 57.9 per cent of world ready-mix volume and it has declined for four consecutive years, from 3.29 to 2.288 billion cubic metres. The 2033 case of 1,780 million cubic metres assumes the decline decelerates to 3.09 per cent a year and bottoms at roughly 70 per cent of the country's peak. Two deviations are plausible and both are large: a stimulus-driven construction restart would arrest the fall and add up to 150 million cubic metres to the global total, while a faster property contraction would remove twice what is modelled. The single largest number in this report is not measured — it is a construction of where a policy-driven correction stops.
6.2 The fleet is a fixed cost that does not shrink with volume
ERMCO's membership operated 13,047 batching plants in 2023 on 389.3 million cubic metres — about 30,000 cubic metres a plant. When volume falls, the plants do not close and the trucks do not sell. This is the mechanism that connects China's 30.5 per cent volume decline to its 43.7 per cent price decline, and it is the reason price in this industry behaves so violently in a downturn: the marginal cubic metre is produced by an asset that has already been bought, on a route that has already been driven. It is also why price recovery, when it comes, is not a gradual process — the same fixed costs that make a falling market vicious make a rising one sharp, which is what the American 13-13-8-4 sequence was.
6.3 Aggregate permitting, and the sand that is not where the city is
Aggregates are 78 per cent of a cubic metre by mass and are as local as the concrete itself, and their supply is constrained by planning permission rather than by geology. The constraint shows up as haul distance: every additional kilometre of aggregate haul is a direct cost that cannot be passed on in a competitive local market. Its extreme form is the Manila runway suspension and the Belgian and Dutch reserve estimates. The restraint will not appear as a shortage of concrete. It will appear as a rising floor under the price in exactly the markets where permits are hardest to get — which is most of Western Europe.
6.4 Cement cost passes through asymmetrically
Cement is 36.8 per cent of a Chinese cubic metre and 18.6 per cent of an American one, which means the same cement price move is twice as damaging in the low-price market. A producer in a market where the binder is a third of the price has almost no ability to absorb a cost increase and almost no ability to pass one on, because the customer can site-mix. This is the structural reason Chinese ready-mix margins are thin and European ones are not, and it will not change with demand.
6.5 The price lever has a ceiling set by the substitute
Every ready-mix producer's pricing power is capped by what it costs the customer to mix on site. That cap is not close in Europe or North America — a site mixer cannot produce C30/37 at the pump and cannot place it at height — but it is very close in markets where labour is cheap and specifications are loosely enforced. Which means the same 5.9-fold price dispersion that makes this an interesting market is also the ceiling on its growth: the highest-priced markets have the most room, and they are the ones with the least volume growth.
Segmentation
7.1 By product and formulation
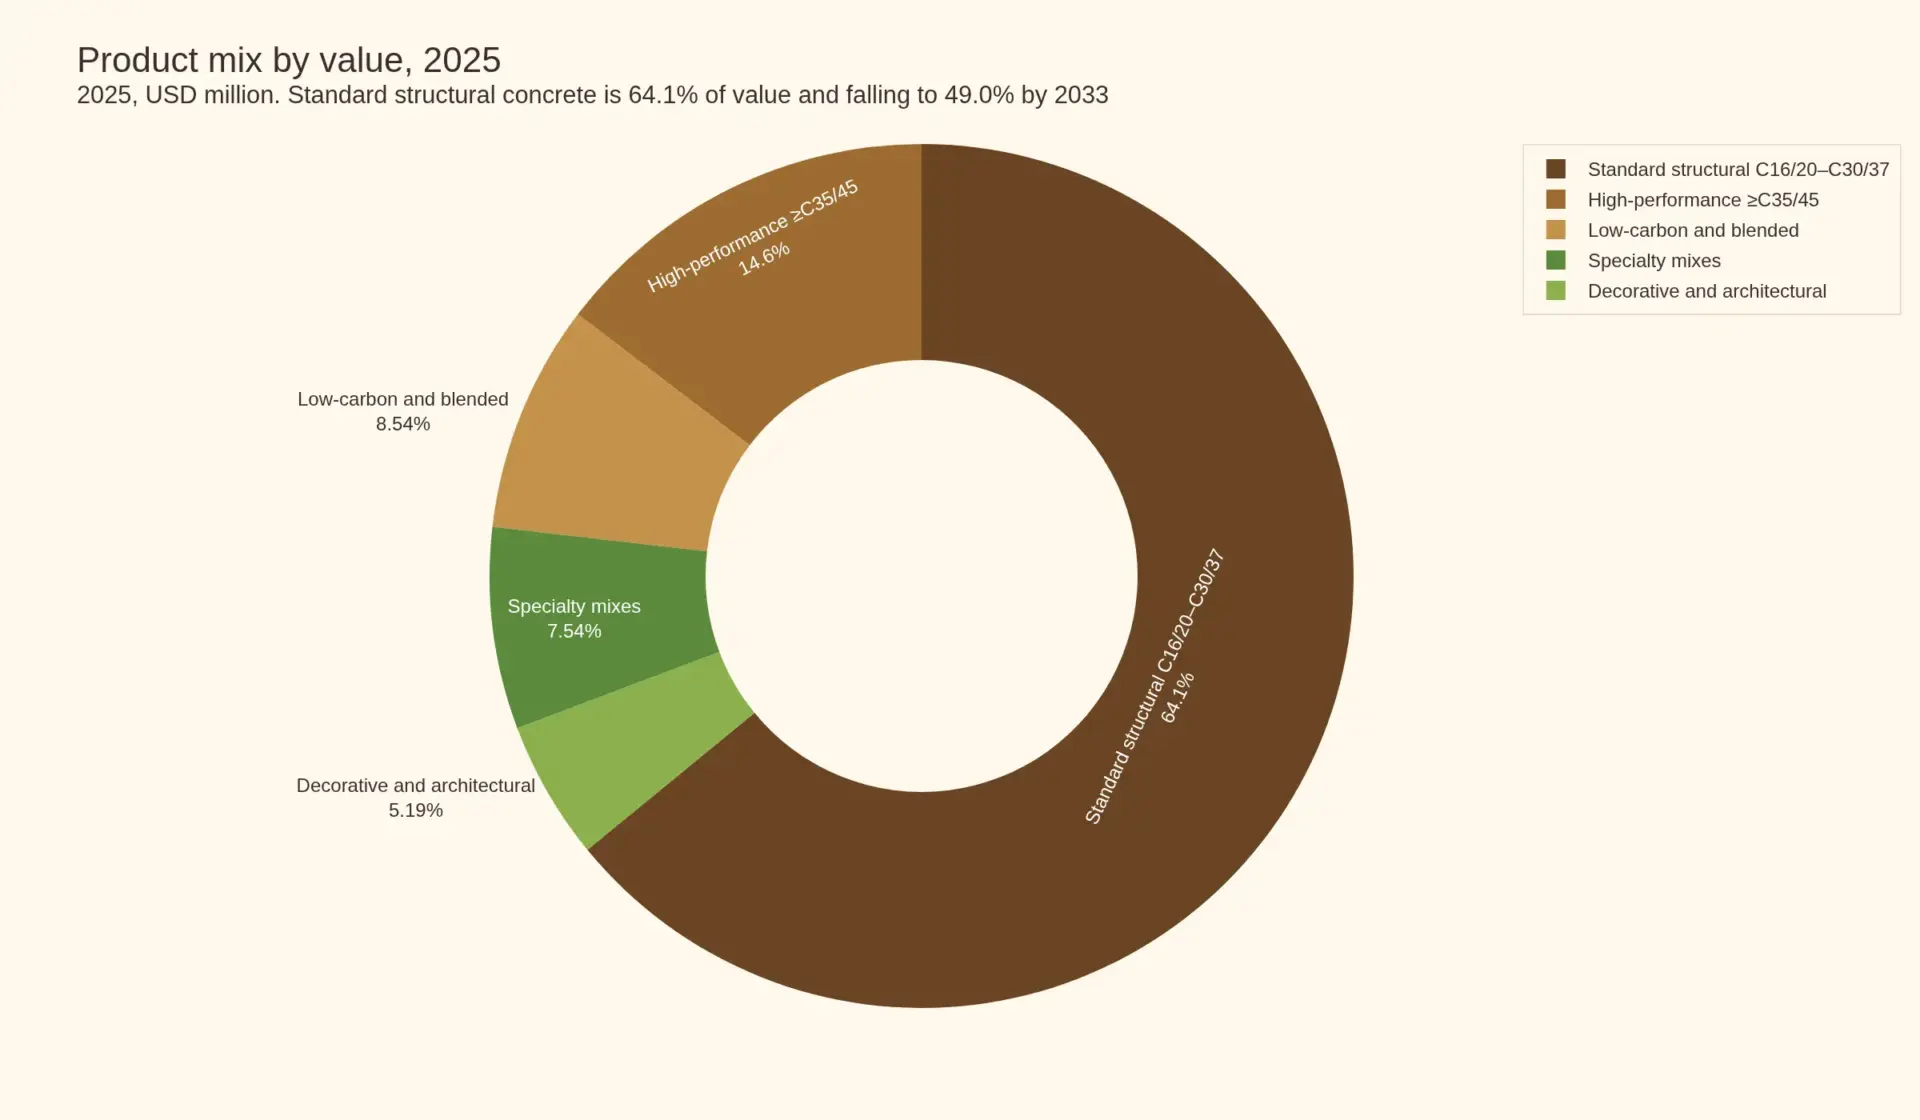
The market is not growing. The product is changing, and the change is faster here than in cement because the plant controls the mix. Standard structural concrete falls from 64.1 to 49.0 per cent of value while every formulated category grows faster than the market.
| Product class | 2025 (USD m) | 2033 (USD m) | Share 2025 | Share 2033 | CAGR |
|---|---|---|---|---|---|
| Standard structural, C16/20–C30/37 | 186,000 | 178,000 | 64.1% | 49.0% | −0.55% |
| High-performance and high-strength, ≥C35/45 | 42,500 | 63,500 | 14.6% | 17.5% | 5.15% |
| Low-carbon and blended formulations | 24,800 | 62,400 | 8.5% | 17.2% | 12.23% |
| Specialty: self-compacting, fibre, rapid-set, pervious | 21,900 | 33,600 | 7.5% | 9.3% | 5.50% |
| Decorative and architectural | 15,079 | 25,606 | 5.2% | 7.1% | 6.84% |
| Total | 290,279 | 363,106 | 100.0% | 100.0% | 2.84% |
Low-carbon is defined here strictly, and the definition matters. It covers mixes with a declared global warming potential materially below the regional reference and sold against that declaration — an EPD to EN 15804, a procurement specification, or a branded low-carbon product. It does not include every cubic metre that happens to contain fly ash or slag, which is most of Europe and much of Asia. On that definition, low-carbon is 8.5 per cent of global value in 2025 — small because 2.288 billion Chinese cubic metres are overwhelmingly standard — and 17.2 per cent by 2033. Holcim's 31 per cent ECOPact share of its own ready-mix net sales is the leading indicator, not a contradiction.
7.2 By application
Residential is the only outlet growing slower than price, and it loses share in every year of the forecast.
| Application | 2025 (USD m) | 2033 (USD m) | Share 2025 | Share 2033 | CAGR |
|---|---|---|---|---|---|
| Infrastructure and civil works | 95,800 | 132,500 | 33.0% | 36.5% | 4.14% |
| Residential | 104,500 | 112,600 | 36.0% | 31.0% | 0.94% |
| Commercial | 52,300 | 66,700 | 18.0% | 18.4% | 3.09% |
| Industrial | 29,000 | 40,000 | 10.0% | 11.0% | 4.10% |
| Institutional and agricultural | 8,679 | 11,306 | 3.0% | 3.1% | 3.36% |
| Total | 290,279 | 363,106 | 100.0% | 100.0% | 2.84% |
Residential at 0.94 per cent is the number to hold on to. It is the largest application by value in 2025, it is where China's correction is concentrated, and it grows more slowly than the blended price. Infrastructure overtakes it as the largest outlet by 2033. That crossover is the forecast in one line: the market's growth is public-sector, specification-driven and priced, while its volume is private-sector, discretionary and shrinking.
7.3 By strength class and binder system
Strength class is the price ladder, and it is short. Heidelberg Materials' published Donau-Iller list runs from EUR 170.50 for C8/10 to EUR 214.00 for C50/60 — the entire span from blinding to post-tensioned bridge concrete is 25.5 per cent, and the step from C25/30 to C30/37, which is where most structural work sits, is EUR 4.00. Pumpable mixes carry a premium of EUR 8.50 a cubic metre on the same list. The product ladder is real but shallow; the margin is made on the mix, not on the class. By binder, ordinary portland mixes still dominate globally, blended mixes with 25 to 50 per cent replacement are the fast-growing middle, and the specification-led low-carbon category is the top.
7.4 By route to market
Ready-mix is delivered direct to site — there is no distributor and no resale channel, because the product cannot sit on a shelf. That single fact shapes the competitive landscape: there is no intermediary to hold inventory, absorb a price increase, or aggregate demand. The consequences are that volume and price are negotiated project by project, that credit risk sits with the producer, and that the customer relationship is the only durable asset a ready-mix business has. Integrated producers hold 45 per cent of global volume, independent merchants 55 per cent — and the integrated share is rising because a cement group needs a channel more than a channel needs a cement group.
7.5 By product value, and the price floor under each line
Value is not distributed like volume. Standard structural concrete is the overwhelming majority of cubic metres and slightly under two-thirds of dollars. The formulated categories together are 35.9 per cent of value on roughly a quarter of the volume, and by 2033 they are 51.0 per cent of value. The market does not need to place more concrete to be worth more; it needs to place a different specification of it.
Regional Analysis
Geography is the whole of this forecast, because the product cannot move. The eight regions below are ranked by what they contribute to the eight-year change, and the ranking is not the ranking of size.
8.1 China
2,288 million m³, USD 90,879 million, USD 39.72 a cubic metre, falling to 1,780 million m³ and USD 80,100 million by 2033. China is 57.9 per cent of world volume and 31.3 per cent of world value, and both shares fall. The volume series is 3.29, 3.03, 2.69, 2.49, 2.288 billion cubic metres from 2021 to 2025, and the price series has gone from a peak above RMB 500 to RMB 284, a ten-year record low. Output value in US dollar terms falls 1.57 per cent a year, and the region subtracts USD 10,779 million from world value growth — more than any other region adds.
What to watch is not demand, it is the register. China's ready-mix industry is consolidating into the contraction: the top thirty capacity holders grew capacity 6.78 per cent in 2024 while output fell 10.1 per cent. CNBM alone holds 412 million cubic metres of ready-mix capacity, more than four times the entire output of India. At some point the consolidated capacity has to discipline output in order to reprice, and the first evidence of it will not be volume; it will be a price that stops falling in East China.
8.2 India
300 million m³, USD 16,500 million, USD 55.00 a cubic metre, rising to 520 million m³ and USD 37,440 million at 10.79 per cent. India is the largest volume addition of any region and the fastest-growing value pool in the world at scale. UltraTech is the largest ready-mix producer in the country with 395 plants in 155 cities and 48.3 million cubic metres of capacity, and its disclosed ready-mix revenue of Rs 6,170 crore against a grey-cement consumption of 3.8 million tonnes gives a cement intensity of 292 kilograms a cubic metre — the number used throughout this report.
The capacity figure is the interesting one. At full utilisation, Rs 6,170 crore on 48.3 million cubic metres would be Rs 1,277 a cubic metre, which is below the cost of the cement in it at Rs 1,611 — so full utilisation is physically impossible and the only coherent reading is a realised price near Rs 4,746 and a volume of about 13.0 million cubic metres, or 26.9 per cent of installed batching capacity. That is what an industry looks like at 25 per cent penetration with national capacity built for 30 per cent and better: deliberately abundant, and therefore cheap.
8.3 Rest of Asia-Pacific
400 million m³, USD 36,000 million, rising to 470 and USD 50,760 million at 4.39 per cent. Japan anchors the region at 71.6 million cubic metres in ERMCO's corresponding-member returns and has fallen in every year of that series — a mature market with excellent batching density and no volume growth. South-East Asia and South Asia are the growth, on penetration and urbanisation rather than on price. Australia and New Zealand are the highest-priced markets outside North America and Europe because aggregate permitting is hard and haul distances are long.
8.4 Europe
250 million m³, USD 41,250 million, USD 165.00 a cubic metre, rising to 262 million m³ and USD 51,352 million at 2.78 per cent. Europe is the most measured ready-mix market in the world and the one where the model of this industry is clearest. EU production was 271.2 million m³ in 2021, 262.1 in 2022 and 239.0 in 2023 — down 11.9 per cent in two years — on 11,462 plants, with cement consumption into ready-mix at 67.6 per cent of the total. Country dispersion is extreme: Germany fell from 54.2 to 42.3 million m³ in two years, Italy sits at 30.8 against 73.2 in 2008, and Poland, the Netherlands and the Czech Republic have all given back a third of their post-2008 gains. Türkiye, at 119 to 130 million cubic metres, is now the largest ready-mix producer in Europe by a wide margin and is not inside the EU figure.
The European price signal is the most documented in the world and it is a carbon signal. Heidelberg Materials' published list for the Donau-Iller region puts C25/30 at EUR 185.50 and C50/60 at EUR 214.00, with pumped mixes at EUR 194.00 and EUR 197.00 — a price ladder that is shallow in strength and deep in placement. And the specification that drives the mix is set by the public client, not the product standard: Ireland's 30-per-cent clinker replacement minimum, its exclusion of CEM I, its EN 15804 declaration requirement, and its whole-life-carbon thresholds that fall from EUR 10 million to EUR 5 million for non-residential projects in June 2026.
8.5 North America
345 million m³, USD 74,175 million, USD 215.00 a cubic metre, rising to 372 million m³ and USD 97,464 million at 3.47 per cent. North America adds USD 23,289 million — more value than any other region — on 27 million cubic metres of volume, and that asymmetry is the whole point: it is the highest-priced market in the world and its growth is almost entirely price. US production was 289.9 million m³ in 2024 and 285.3 in 2025; the weighted average selling price went from USD 113.08 in 2016 to USD 179.95 in 2025, with annual increases of 13, 13, 8 and 4 per cent in the last four years.
There is no official price series for American ready-mix, and that absence is itself a finding. The US Geological Survey publishes cement, crushed stone and sand and gravel prices; it does not publish a concrete price, and most listed producers do not disclose concrete volumes and revenue separately. Only four — Eagle Materials, Knife River, Titan America and Vulcan Materials — do so consistently. A USD 74 billion regional market with no public price series is a market where the dispersion is not measured, and the 5.9-fold spread in this report is the difference between two well-documented endpoints rather than a survey of the space between them.
8.6 Middle East and Africa
180 million m³, USD 14,400 million, rising to 232 million m³ and USD 22,504 million at 5.74 per cent — the fastest value growth of any region. The Gulf is the highest-priced part of it, on specification, heat and haul distance; sub-Saharan Africa is the fastest-growing volume on urbanisation from a very low base. Turkish capacity is the swing supplier of plant, expertise and equipment to both. The risk in this region is not demand but the substitutability of the price: at USD 80 a cubic metre with cheap labour, site-mixing remains viable in a way it does not in Germany.
8.7 Latin America and the CIS
Latin America 135 million m³ and USD 13,500 million, rising to 158 and USD 19,118 million at 4.45 per cent. CIS 55 million m³ and USD 3,575 million, rising to 56 and USD 4,368 million at 2.54 per cent. South America is carried at ERMCO's 134.5 million cubic metres, a figure that has not been restated since 2018 and is the weakest number in this report — it is a corresponding-member estimate, not a measurement, and it should be treated as an order of magnitude. Russia's 38 million cubic metres is likewise carried, and the CIS forecast assumes no recovery in Russian construction.
8.8 What the geography says
Sort the regions by value added and the ranking has nothing to do with size. North America is third by volume and first by value added. China is first by volume and last by value added. India is fourth by volume and second by value added. Europe is second by value but fifth by growth. Because the product cannot be traded, the market's value is a function of where people build at high prices, not of where they build most. The 103 million cubic metres the world loses between 2025 and 2033 are Chinese, and the 72,827 million dollars it gains are American, Indian and European. That is the trade this forecast describes, and no container ship is involved.
Table of Contents
- Market Snapshot
- Market Definition and the Six Boundary Calls
- Market Size and Forecast
- 3.1 How the 2025 Base Was Built
- 3.2 The Regional Allocation Is the Forecast
- 3.3 The Decomposition Is the Finding
- Four Structural Shifts Defining 2026–2033
- 4.1 The Volume Peak Is Behind Us and It Was One Country
- 4.2 Price Is a Local Structure Variable, Not a Cost Variable
- 4.3 The Binding Input Is Sand and Aggregate, Not Cement
- 4.4 Consolidation Moved to Aggregates, and the Plant Became a Channel
- Market Drivers
- 5.1 Infrastructure Spending, and the Public Client Who Specifies
- 5.2 Penetration, Not Construction, Is Where the Volume Is
- 5.3 Low-Carbon Formulation Is a Revenue Event for the Plant
- 5.4 Plant Density and Load Factor
- 5.5 Urban Bans on Site-Mixing
- Market Restraints
- 6.1 China’s Property Correction Is the Restraint, and It Is Arithmetic
- 6.2 The Fleet Is a Fixed Cost That Does Not Shrink With Volume
- 6.3 Aggregate Permitting, and the Sand That Is Not Where the City Is
- 6.4 Cement Cost Passes Through Asymmetrically
- 6.5 The Price Lever Has a Ceiling Set by the Substitute
- Segmentation
- 7.1 By Product and Formulation
- 7.2 By Application
- 7.3 By Strength Class and Binder System
- 7.4 By Route to Market
- 7.5 By Product Value, and the Price Floor Under Each Line
- Regional Analysis
- 8.1 China
- 8.2 India
- 8.3 Rest of Asia-Pacific
- 8.4 Europe
- 8.5 North America
- 8.6 Middle East and Africa
- 8.7 Latin America and the CIS
- 8.8 What the Geography Says
- Competitive Landscape
- Value Chain
- Investment Activity
- Technology and Innovation
- Market Risk
- Regulatory Landscape
- Strategic Outlook
- Watch List
- Methodology
- About This Report
Competitive Landscape
Competitive Landscape
This is a globally fragmented market made of locally concentrated ones, and the distinction is the entire competitive analysis. No company holds a meaningful share of world ready-mix. Cemex, the largest by volume outside China, delivered 42.9 million cubic metres in 2025 — about 1.1 per cent of the world total — and earns 19.1 per cent operating EBITDA on USD 16,132 million of sales. Yet in most cities where it operates, two or three producers set the price. The market’s structure is a radius, not a country, and no global share statistic describes it.
| Entity | Verified position | Why it matters here |
|---|---|---|
| Cemex | FY2025 ready-mix volumes 42,921 thousand m³, down 2 per cent on 43,814; consolidated sales USD 16,132 million; operating EBITDA USD 3,080 million at a 19.1 per cent margin; US ready-mix prices up 1 per cent in 2025 while cement prices fell by low single digits | The largest non-Chinese ready-mix producer in the world and the clearest evidence that price, not volume, now drives the income statement: EBITDA rose 1 per cent on flat sales and falling volumes |
| Holcim | FY2025 net sales CHF 15,724 million, up 3.0 per cent in local currency; recurring EBIT CHF 2,876 million, margin 18.3 per cent; ECOPact 31 per cent of ready-mix net sales versus 26 per cent; ECOPlanet 36 per cent of cement net sales; 8.0 Mt of recycled construction and demolition material, up 23.5 per cent; eighteen acquisitions completed | The only major that publishes what its low-carbon concrete is worth as a share of its concrete revenue, which is why section 5.3 can size that segment rather than assert it |
| Heidelberg Materials | FY2025 revenue EUR 21.5 billion, up 1 per cent; result from current operations EUR 3.4 billion, up 6 per cent; RCOBD margin 21.8 per cent; ROIC 10.4 per cent; specific net CO2 512 kg per tonne of cementitious material; sustainable products 37.2 per cent of revenue; BURNCO Rock Products (Canada) and Walan Specialty Construction Products (USA) acquired | The best-documented vertical position in Europe, and the source of the published German price ladder this report uses for the whole continental price build |
| UltraTech Cement | 395 ready-mix plants in 155 cities; installed ready-mix capacity 48.3 million m³; ready-mix revenue Rs 6,170 crore in FY2025, consuming 3.8 Mt of its own grey cement — an intensity of 292 kg of cement per cubic metre; consolidated grey cement volume 135.8 Mt | The largest ready-mix producer in India and the clearest case in the world of capacity built ahead of penetration: the disclosed revenue implies roughly 26.9 per cent utilisation, which is a strategy rather than an error |
| Titan America | FY2025 revenue USD 1.66 billion, up 1.8 per cent; external ready-mix volumes 4,594 thousand cubic yards, up 0.2 per cent; ready-mix price USD 162.36 a cubic yard, up 1.2 per cent; external aggregates volumes up 36.5 per cent; Florida segment EBITDA USD 278.7 million; net debt to EBITDA 0.64; listed on the NYSE in February 2025 at USD 16.00 a share | The one genuinely new public comparable in the industry, and the only listed company whose disclosures let an analyst see concrete volume, concrete price and aggregate volume in the same table |
| China National Building Material | 412 million m³ of ready-mix capacity, the largest position in China; part of the CNBM system that holds an estimated 15 to 18 per cent of national cement capacity through Tianshan, Ningxia Building Materials, Qilianshan and the regional southern and northern cement companies | More ready-mix capacity than four times India’s national output, in a market that lost 30.5 per cent of its volume in four years. Its utilisation is the largest single unknown in this report |
| Huaxin Cement | Approximately 120 million m³ of ready-mix capacity, second in China behind CNBM, alongside Western Construction at 119 million m³ | The consolidation is happening across the contraction rather than out of it: China’s top thirty capacity holders grew capacity 6.78 per cent in 2024 while the industry’s output fell 10.1 per cent |
| CRH | Acquired Eco Material Technologies for USD 2.1 billion in mid-2025 — a supplementary cementitious materials business, not a concrete asset | The most informative acquisition of the cycle: the buyer of a ready-mix channel bought an input to the mix instead of more plants |
The buyer is not fragmented, and that is the whole problem
Ready-mix sells to contractors, developers and public bodies, and none of them is concentrated or loyal. There is no distributor holding inventory, no brand the end-user asks for by name, and no switching cost beyond a phone call the next morning. The customer can always mix on site, which means the producer’s price is capped by a cost the customer can see. That cap is very wide in Germany and very narrow in China, and it explains more of the 5.9-fold dispersion than any cost difference does.
Three competitive structures, not one
The Chinese capacity contest. CNBM holds 412 million cubic metres of ready-mix capacity against a national market of 2.288 billion and falling. In a market where the top thirty grew capacity 6.78 per cent while output fell 10.1 per cent, competition is on the balance sheet rather than on the pour, and the price is the release valve. This is what administered overcapacity looks like, and it is why the Chinese average is a ten-year low.
The Indian penetration race. UltraTech has 48.3 million cubic metres of capacity in a country where ready-mix is 25 per cent of concrete. The strategic bet is that penetration reaches 30 per cent and beyond, and the bet is being financed by idle batching capacity rather than by price. Whoever holds the plants when penetration moves owns the market, and the cost of waiting is a return on capital well below the cement business next to it.
The American aggregates play. The US market is more than 80 per cent ready-mix already, volume is flat to falling, and price increases have decelerated from 13 to 4 per cent in four years. The response has been to buy the inputs: Titan America’s external aggregates volume grew 36.5 per cent in 2025 against 0.2 per cent for concrete. In a mature ready-mix market, the margin migrates to whoever owns the quarry, and the plant becomes the channel through which the quarry is monetised.
What pricing power actually rests on
Not on national share, not on brand, and not on cement integration. On three things: the number of competing plants inside the delivery radius, the cost of the customer’s site-mixing alternative, and whether the producer controls its own aggregate supply. Every company that improved its margin in 2025 improved it by moving one of those three. None improved it by placing more concrete.
Value Chain
Value Chain
Ready-mix concrete is a low-value, high-mass product with a shelf life of hours, and every economic feature of the chain follows from that one sentence. A cubic metre sells for USD 73.43 blended across the world and USD 39.72 in China. It contains roughly 1,850 kilograms of sand and stone, 292 kilograms of cement, 150 litres of water and a few litres of chemistry. It must be placed within about 90 minutes of batching. There is no other industrial product of this value density with this little time.
Stage one: the quarry, which is the only scarce asset
Aggregates are about 78 per cent of a cubic metre by mass and are as local as the concrete itself. Their supply is set by planning permission rather than geology, which makes the permitted reserve the single most defensible asset in the chain and the reason every major group has been buying quarries rather than plants. USGS publishes aggregate prices; nobody publishes concrete prices. The input is measured and the output is not.
Stage two: the batching plant, which is a scale and a computer
A modern plant is a set of aggregate bins, a cement silo, an admixture dispenser, a weigh system and a mixer, and it costs a small fraction of what a cement kiln costs per annual unit of output. That low capital cost is the structural reason this industry is fragmented: entry is cheap, and the constraint on competition is the radius rather than the balance sheet. A plant produces 20,000 to 30,000 cubic metres a year in Europe on the ERMCO averages — 389.3 million cubic metres across 13,047 plants — and that is a business of a few dozen people.
Stage three: the mix design, where the entire margin lives
This is the stage the market usually ignores and the one that decides everything. The same plant, the same truck and the same cement can produce a commodity C25/30 or a 30-per-cent-clinker-replacement structural mix with an EN 15804 declaration, and the second sells for more because a specification asked for it. The mix design is the only part of this chain that is intellectual property, and it belongs to the batcher rather than to the cement producer. It is why Holcim’s low-carbon concrete reached 31 per cent of its ready-mix net sales while its low-carbon cement reached 36 per cent of cement net sales from a much larger base and a slower trajectory, and it is why the low-carbon segment in this forecast grows 12.23 per cent a year.
Stage four: the fleet, which is the balance sheet
A truck mixer holds up to 9 cubic metres and averages 6. That is a 67 per cent load factor on the asset, before the empty return leg. The average delivery is about 8 kilometres, the product must be placed within hours, and the driver is a skilled operator rather than a haulier. Which makes the fleet the dominant cost line in every high-price market and the dominant constraint in every low-price one. A producer who improves cycle time by 10 per cent earns more than one who negotiates 10 per cent off the cement, because cement is 18.6 per cent of an American cubic metre and the fleet is most of the rest.
Stage five: placement, and the service that cannot be inventoried
The customer buys a placement: a slump, a strength, a time and a pump. Nothing can be stored, nothing can be returned, and a late truck is a construction site standing idle with a crew on the clock. This is why the customer relationship in ready-mix is more durable than the product, and why an acquisition of plants inside an existing radius is worth more than the same plants in a new city.
| Stage | What sets the price | Who holds the margin |
|---|---|---|
| Aggregate extraction | Permitted reserve and haul distance | The holder of the permit, permanently |
| Cement supply | A traded price, 18.6 to 36.8 per cent of the cubic metre | The kiln, and only where it is the local one |
| Batching | Local structure: how many plants inside the radius | The top two in each city |
| Mix design | What the specification asks for | The batcher, and increasingly the public client who wrote it |
| Delivery and placement | Fleet productivity and load factor | The producer with the densest network |
Where the cost asymmetry sits
The same cubic metre has a completely different cost structure in China and in the United States. At 292 kilograms of cement a cubic metre, the binder is USD 14.60 of a USD 39.72 Chinese cubic metre and USD 43.80 of a USD 235.40 American one — 36.8 per cent against 18.6 per cent. In China the cement is the business and the margin is thin enough that a cement price rise is existential. In the United States the cement is a minor line item and the business is the truck, the quarry and the local market. A cement producer looking at these two markets sees the same product and two different customers, and it prices accordingly.
What the chain cannot do
It cannot move inventory into a weaker market, because there is no inventory. It cannot import a cheaper cubic metre, because it would set in the Channel. It cannot reduce its fleet quickly when volume falls, which is why China’s 30.5 per cent volume decline produced a 43.7 per cent price decline rather than a 30 per cent one. And it cannot pass a carbon cost through to a customer who is not asking for a carbon number. The value chain is exceptionally good at converting rock into a placed structure and structurally incapable of converting a local position into a national one.
Investment Activity
Investment Activity
Capital is leaving the concrete and going into the two things concrete cannot substitute: the quarry and the specification. Almost nothing spent in this sector in 2024 and 2025 added batching capacity in a market that is about to place fewer cubic metres. What it bought was aggregate reserves, supplementary cementitious material supply and public-listing currency.
The acquisitions are upstream, and the multiples explain why
Holcim completed eighteen acquisitions in 2025 and closed the year on CHF 15,724 million of net sales at an 18.3 per cent recurring EBIT margin. Its most instructive transaction was not a concrete plant: it is acquiring a majority stake in Cementos Pacasmayo in Peru — three cement plants and 28 ready-mix and precast concrete plants on USD 0.6 billion of net sales at an implied 7.1 times 2025 EBITDA (Holcim, FY2025 results). Heidelberg Materials bought BURNCO Rock Products in Canada and Walan Specialty Construction Products in the United States, and closed 2025 at a 21.8 per cent RCOBD margin with ROIC up from 9.9 to 10.4 per cent (Heidelberg Materials, 25 February 2026).
CRH’s USD 2.1 billion purchase of Eco Material Technologies in mid-2025 is the transaction that defines the cycle. Eco Material is a supplementary cementitious materials business — the fly ash, slag and natural pozzolan that substitute for clinker. The buyer of a ready-mix and aggregates channel chose to buy an input to the mix rather than another plant (US Department of Energy, State of Innovation 2025). That is the correct reading of the cost structure in section 4.2: the plant is replicable for a few million dollars and the permitted reserve is not, and neither is the supply of the material that makes the mix declarable.
The equity event: ready-mix became a public market
Titan America listed on the New York Stock Exchange on 7 February 2025 and closed its offering on 10 February at USD 16.00 a share — 24 million shares, of which 9 million new, raising net proceeds of USD 136.8 million for the company and USD 228 million for Titan Cement International, which retained 87 per cent (Titan America, 10 February 2025). The business it brought to market delivers 4,594 thousand cubic yards of external ready-mix a year at USD 162.36 a yard, consumes 1,348 thousand tonnes of its own cement, and increased external aggregates volume 36.5 per cent in its first full year as a listed company.
That is the single clearest signal in this report that the asset class has been re-rated. Fifteen years ago a ready-mix business was the part of a cement group that nobody wanted to own: low margin, high working capital, a fleet to maintain and no pricing power. It is now a separately listed company on a US exchange with 0.64 times net debt to EBITDA. The re-rating is not about volume — the volume was flat. It is about the discovery that a dense plant network inside a metropolitan radius is a durable local franchise.
Greenfield: Indian batching capacity built ahead of penetration
UltraTech operates 395 ready-mix plants in 155 cities with 48.3 million cubic metres of installed capacity, and its disclosed ready-mix revenue of Rs 6,170 crore implies roughly 13.0 million cubic metres of volume — about 26.9 per cent utilisation. At full utilisation the realised price would have to be Rs 1,277 a cubic metre, which is below the Rs 1,611 cost of the cement in it at its own disclosed intensity and realisation. Only one of those two readings is physically possible, and the company is not making a mistake: it is building the network before the penetration arrives, because the plant that is not there when a city bans site-mixing does not win the city.
Carbon: the investment that buys a specification rather than a tonne
The venture capital in this sector has stopped funding kilns and started funding chemistry. Sublime Systems closed a USD 200 million Series C in May 2025 and Terra CO₂ raised USD 124.5 million in a Series B in July, with corporate procurement commitments from Microsoft, Amazon and CRH Ventures underpinning the first wave of products (US Department of Energy, State of Innovation 2025). Almost none of that money is aimed at the batching plant. It is aimed at the powder — because the powder is where the carbon is, and the plant will formulate whatever powder is available and declarable.
The strategic implication is uncomfortable for ready-mix producers and it should be stated plainly. If the binder decarbonises without the plant, then the plant’s low-carbon premium is a temporary artefact of a specification that has not yet been written into a product standard. What protects the premium is not the chemistry; it is the EPD, the procurement rule and the client who asks for the number.
What is not being funded
There is almost no investment in new batching capacity in Europe or North America, where 11,462 EU plants already serve a market that fell 11.9 per cent in two years. There is very little in fleet electrification at scale, despite the fact that the truck is the dominant cost line — the vehicles are heavy, the duty cycle is short and the charging infrastructure at a batching plant is a capital project with no revenue attached. And there is almost nothing in recycled aggregate processing, which is the one investment that would make the plant independent of permitted sand. That gap is the most under-financed opportunity in the chain and section 4.3 explains why it stays unfinanced: nobody is asking for the product yet.
Technology & Innovation
Technology and Innovation
The batching plant is a scale and a computer, both of which are mature, and the innovation that matters is not in the plant. What is changing is the mix design that leaves it, the data that surrounds the pour, and — slowly and expensively — the truck that delivers it.
The mix design is the technology, and it is the plant’s property
Every point of clinker displaced is roughly 0.85 tonnes of CO₂ avoided, and the displacement happens at the batching plant rather than at the kiln, because the plant decides what goes in the drum. The binders available are well understood: ground limestone at 15 to 35 per cent depending on the standard, fly ash at 15 to 35 per cent, ground granulated blast furnace slag at 30 to 70 per cent, and calcined clay in combination at 30 to 50 per cent. The constraint is not chemistry and it is not the standard — it is that fly ash comes from coal generation and slag from blast furnaces, and both are being deliberately reduced by the other transition.
The evidence that it works is Ireland’s procurement rule, which requires a minimum of 30 per cent clinker replacement consistent with IS EN 206 for publicly procured concrete and excludes high-carbon CEM I except on technical justification. That is a mix specification, not a product standard, and it is achievable with existing plants, existing trucks and existing crews from the day it took effect on 1 September 2024.
Carbon dioxide curing, and the honest size of it
Injecting captured CO₂ into fresh concrete where it mineralises is commercially deployed, measurable, and small. The volumes are kilograms of CO₂ per cubic metre against roughly 250 to 300 kilograms embodied in the cement. It is a real product attribute and a real premium in a specification-driven sale; it is not a decarbonisation pathway. The companies that promoted it most aggressively have largely been consolidated into building-materials groups, which is what happens to a technology that is a feature rather than a platform.
The digital layer is where the margin actually moved
Automated dispatch, truck telemetry, slump monitoring and batch traceability are standard capital items in any fleet above a few dozen vehicles, and they deliver what this industry most needs: more cubic metres per truck per shift from the same fleet and the same radius. In a business where cement is 18.6 per cent of an American cubic metre and the fleet is most of the rest, a 10 per cent improvement in cycle time is worth more than any materials negotiation. The genuinely novel work is at the customer interface — silo-level inventory telemetry, automated reorder, and the digital delivery ticket that a main contractor can accept without a paper trail — because those defend the density that section 10 argues is the only durable source of pricing power.
The truck is the unsolved problem
A truck mixer carries up to 9 cubic metres and averages 6, does about 8 kilometres to the drop, returns empty, and weighs around 30 tonnes when loaded. Electrifying that duty cycle is hard for reasons that no amount of battery chemistry fixes quickly: the payload penalty is direct revenue, the duty cycle is short and high-torque, and the depot charging load is a grid connection rather than a plug. Which is why fleet decarbonisation in ready-mix will arrive as a municipal procurement rule about air quality — exactly as it did for buses — rather than as a total cost of ownership calculation.
Recycled aggregate: the technology that exists and is not used
Construction and demolition waste is more than a third of all EU waste and is mostly concrete. Recycled aggregate is permitted in standards, the new Eurocode for reinforced concrete design contains clauses for recycled-aggregate concrete, and a 30 per cent mean incorporation rate would recover around 30 per cent of all non-soil construction waste. And in most member states, in the European Commission’s own words, recycled-aggregate concrete is “hardly (if ever) produced” (Joint Research Centre, Use of recycled aggregates in concrete). The barriers are selective demolition, quality assurance and a specification that does not ask. This is the clearest case in the whole construction sector of a technology that is ready and a market that is not.
Why patent activity is low
The chemistry is a century old, the plant is off-the-shelf equipment from a small group of suppliers, and the improvements that matter are mix designs and dispatch routines held as trade secrets inside operating companies rather than as claims in a registry. The one area where intellectual property is thickening is the binder itself — calcined clay activation, mineralisation and alternative clinkers — which is precisely the part of the chain the batching plant does not own.
Market Risk
Market Risk
The largest risk to this forecast is not that demand falls. It is that the price recovery stops while the volume decline continues, because that is the only combination that produces a falling market. The sensitivity is easy to state and it is symmetric: one percentage point of price is USD 2,903 million and one percentage point of volume is USD 2,903 million — 1.0 per cent of the market each. The two are equally important to the value line, and only one of them is a decision.
Risk 1: the price lever is visibly exhausting itself
The American series is the only clean measurement available and it has decelerated for four consecutive years — 13 per cent in 2022, 13 in 2023, 8 in 2024, 4 in 2025 — while production fell from 289.9 to 285.3 million cubic metres. Titan America’s ready-mix price rose 1.2 per cent in 2025. Cemex’s US ready-mix price rose 1 per cent. If the price line converges to 2 per cent rather than the 3.18 per cent in this forecast, the 2033 market is USD 24,000 million smaller and the CAGR is 1.9 per cent, not 2.84. That is the single largest quantitative exposure in the report and it is not a demand risk.
Risk 2: China’s floor is not measured, it is constructed
The 2033 China volume of 1,780 million cubic metres is a judgement about where a policy-driven property correction stops. Output has fallen 30.5 per cent in four years and the 2025 decline of 8.7 per cent is a deceleration from 10.1, not a recovery. Two deviations are material and both are large: a stimulus-driven construction restart would arrest the fall and add up to 150 million cubic metres to the world total, and a faster contraction would remove twice what is modelled. China is 57.9 per cent of world volume, so an error here is an error in the headline number.
Risk 3: the fleet is a fixed cost and the market is not
China’s 30.5 per cent volume decline was accompanied by a 43.7 per cent price decline, and the relationship is causal rather than coincidental. When volume falls, plants do not close and trucks do not sell; the marginal cubic metre is produced by an asset that is already bought, on a route already driven. The same mechanism means that a price recovery in a rising market can be equally violent in the other direction, and a forecast that assumes a smooth 3.18 per cent price path is assuming that no regional market goes through a demand shock.
Risk 4: the substitute sets the price ceiling and it moves with wages
Every producer’s price is capped by what it costs the customer to mix on site. In Germany that cap is not close. In markets where labour is cheap and enforcement is loose — much of South Asia, sub-Saharan Africa and parts of Latin America — the cap is close, and it rises and falls with the wage rate. The Middle East and Africa growth in this forecast at 5.74 per cent is the most exposed: it assumes ready-mix penetration rises against a substitute that is getting no more expensive.
Risk 5: aggregate permitting, and the sand that is not where the city is
Aggregates are 78 per cent of a cubic metre by mass and are constrained by planning permission rather than geology. Manila’s airport runway extension was suspended for lack of sand; Belgium is estimated to have about 80 years of reserves and the Netherlands fewer. A producer cannot pass on a haul-distance increase in a competitive local market, and cannot substitute recycled aggregate unless a specification asks for it. This risk does not arrive as a shortage of concrete. It arrives as a permanent upward step in the cost floor of exactly the markets with the highest prices — which is to say, it compresses the very spread this market’s value depends on.
Risk 6: carbon cost arrives through the input and the specification arrives through the client, and they are not synchronised
CBAM’s definitive regime began on 1 January 2026 and covers cement, not concrete. The ready-mix producer therefore carries a carbon cost passed through in the price of its binder, while its ability to recover that cost depends on whether its customer asked for a low-carbon mix. In a market where the cement is 36.8 per cent of the Chinese cubic metre and 18.6 per cent of the American one, the same carbon price is twice as dangerous in the cheaper market — and the cheaper market is the one without a procurement rule.
What is not in the risk case
A substitution of concrete by mass timber or steel is not modelled. It is real in mid-rise commercial construction in northern Europe and it is nowhere near displacing 12.5 billion cubic metres a year. Nor is a technology shift in batching modelled, because the plant is a scale and a computer and there is no step change available in either. The genuine technology risk sits upstream in the binder, and it would help the plant’s carbon position while removing its low-carbon premium — which is the same risk as Risk 6, arrived at from the other direction.
Regulatory Landscape
Regulatory Landscape
No regulation anywhere in the world directly regulates ready-mix concrete, and that is the defining fact of this section. The rules that move this market arrive from three directions and none of them is a product standard: procurement rules that specify what a public client must buy, carbon rules that price the binder, and municipal rules that determine whether concrete may be mixed on site at all.
Procurement is the real regulator
Because concrete cannot cross a border, a product regulation has no trade leverage and therefore little reason to exist. A purchasing rule does. Ireland’s public procurement guidance is the most complete working example and it is worth setting out because it is what the next decade looks like elsewhere: for projects commencing design from 1 September 2024, public bodies must specify a minimum of 30 per cent clinker replacement consistent with IS EN 206, must not procure high-carbon CEM I except on technical justification, and must seek an Environmental Product Declaration to EN 15804 along with a Declaration of Performance under the Construction Products Regulation. From 1 September 2025, projects above EUR 10 million non-residential or EUR 60 million residential must produce a whole-life-cycle greenhouse gas assessment, and from 1 June 2026 those thresholds fall to EUR 5 million and EUR 30 million; infrastructure assessments are required above EUR 60 million now and above EUR 10 million from 1 January 2026 (Department of Enterprise, Tourism and Employment, Ireland).
The mechanism is worth naming precisely. None of that is law about concrete. Every line of it lands on the ready-mix plant as a mix requirement, and it lands faster and harder than any product standard could, because it arrives with a budget attached. The commercial consequence is that the low-carbon segment in this forecast — 8.5 to 17.2 per cent of value at 12.23 per cent a year — is a procurement artefact, not a technology curve, and it will move at the speed of public capital programmes rather than at the speed of chemistry.
Carbon pricing arrives through the binder, not the product
The Carbon Border Adjustment Mechanism entered its definitive regime on 1 January 2026. Importers of covered goods above a 50-tonne mass threshold must hold authorised declarant status, buy certificates priced off EU ETS auction values — quarterly average in 2026, weekly from 2027 — and surrender them against declared embedded emissions, with a deduction only where a carbon price was already paid in production (European Commission, CBAM definitive regime). Cement is one of six sectors in scope. Concrete is not.
That asymmetry is the whole of the ready-mix producer’s carbon position. The cost arrives inside the price of the cement; the obligation to disclose arrives inside the customer’s specification; and the two are set by different authorities on different timetables. A producer that has to carry a carbon-inclusive cement price before its customer asks for a carbon number is carrying the cost in working capital and margin — which is precisely the position Heidelberg Materials describes from the other side of the transaction, with 37.2 per cent of group revenue now from sustainable products and specific net CO₂ at 512 kilograms per tonne of cementitious material.
Standards decide what can be formulated, and they are already permissive
EN 206 and its national applications set what a mix may contain and still be sold as a structural concrete; ASTM C94 does the same in the United States. The important regulatory fact is that these standards are not the binding constraint on decarbonisation. The new Eurocode for reinforced concrete design contains clauses for recycled-aggregate concrete; limestone, fly ash, slag and calcined clay are all permitted at rates well above current practice. The constraint is that a specifier writes what they know, and a specification is a document rather than a chemistry problem.
Urban bans on site-mixing are construction law, not product law
The most powerful regulation in this market’s history is a municipal by-law. Chinese cities progressively banned on-site mixing, and the ban is the reason the country’s ready-mix industry reached 3.29 billion cubic metres by 2021. The instrument is now being used across South and South-East Asia and it is the single most reliable driver of penetration in the emerging world — and it is worth noting that it works independently of construction activity, which is why China’s ready-mix volume could fall 30.5 per cent while its ready-mix penetration rose.
Labour and air-quality rules will regulate the truck before anything regulates the concrete
Nothing in any jurisdiction governs the embodied carbon of a cubic metre at the point of sale. Several govern the vehicle that delivers it: low-emission zones, night-delivery restrictions and municipal fleet-procurement standards. Given that the truck is the dominant cost line in every high-price market, this is where the next material regulatory cost lands — and it will land as an operating constraint on the fleet rather than as a price signal on the product.
Strategic Outlook
This market does not reward anyone who is good at making concrete. It rewards whoever controls the radius, the quarry and the specification. Four strategic conclusions follow from the arithmetic, and they are not the ones the industry’s own commentary would suggest.
First, stop buying volume. The world will place 103 million fewer cubic metres in 2033 than in 2025 and the volume effect on value growth is negative. Every acquisition justified by adding cubic metres destroys value unless it adds them inside an existing delivery radius, where it moves cycle time and share simultaneously. The Holcim and Heidelberg transactions of 2025 are consistent with this; most previous cycles were not.
Second, the price lever is a local structural variable and it is nearly spent in the markets that have been pulling it. Four halvings in the American price increase — 13, 13, 8, 4 — over a period in which volume was flat is what the end of a pricing cycle looks like. The remaining price travel is in India, the Middle East and Latin America, where the base is low and penetration is moving, and it is worth more in absolute dollars than in percentage terms because the cubic metre is cheap.
Third, the low-carbon premium belongs to whoever writes the specification, not to whoever makes the powder. At 12.23 per cent a year, low-carbon formulation is the fastest-growing line in the market, and its value depends entirely on a procurement rule and an EPD. A producer that treats it as a materials cost will lose it to one that treats it as a document. The one durable defence is to be the supplier whose EPD the client’s consultant is already using.
Fourth, the aggregate is the asset. With sand and stone at 78 per cent of the mass, permits getting harder and recycled aggregate permitted but unused, the producer who secures permitted reserves and the processing capability for construction waste is the producer who can hold a price when the cement market swings. Which is why the capital in this industry has moved upstream and why the plant is now a channel rather than an asset.
Watch List
Six things would change this forecast, and each is observable in a public series.
- China’s ready-mix price in East China. The national average is RMB 284 and the regional high is below RMB 300. Two consecutive quarters of East China rising while national volume falls would be the first evidence that consolidation is producing discipline rather than capacity.
- The American price series. A fifth year of deceleration, or a turn negative in any region, moves the whole value line. Watch Titan America’s disclosed realisation and the Concrete Financial Insights weighted average together.
- Indian penetration. A move from 25 to 30 per cent of concrete volume adds roughly 60 million cubic metres on unchanged construction. It is the largest volume upside in the report and it is a by-law question, not a demand question.
- Recycled aggregate specification. The first national or state procurement rule that requires recycled aggregate in structural concrete would re-rate every producer with processing capability — and would break the sand constraint at the same time.
- Chinese capacity rationalisation. CNBM’s 412 million cubic metres of ready-mix capacity against a contracting 2.288 billion cubic metre national market is the largest single utilisation unknown here. Any announced closure programme is a price signal.
- CBAM’s effect on the binder price inside Europe. Concrete is out of scope and cement is in. The pass-through of a carbon-inclusive cement price into a product the customer has not asked to be low-carbon is the point at which this market’s margin gets tested.
Methodology
This report is built on a 70/30 evidential weighting: seventy per cent published secondary series and thirty per cent Pheonix primary engagement, and the two are used differently. The secondary component sets the physical base, because a cubic metre placed is a fact that can only be counted. The primary component sets the price ladder, the mix composition and the judgement about where a market turns, because those are not published anywhere in usable form.
The 70 per cent: what is measured and by whom
Volumes. China from the China Concrete and Cement Products Association’s annual industry report and its C10+ summit disclosures; the United States from the National Ready Mixed Concrete Association’s state-by-state production series and, for 2025, Concrete Financial Insights’ industry index; the European Union, Türkiye, Israel, Norway, Switzerland, the United Kingdom, Japan, Russia and South America from ERMCO’s Ready-Mixed Concrete Industry Statistics, which is compiled from member associations’ own returns and is the only multi-country ready-mix census in existence. India is derived from a stated penetration rate rather than measured.
Prices. Germany from a published producer price list; the United States from a producer-reported weighted average selling price index, there being no government statistical series for American ready-mix prices; China from the national average published by the industry association; India and Türkiye from disclosed producer revenue and volume. Every other regional price is a Pheonix construction and is identified as such in section 3.1.
Corporate data. Company volumes, prices, margins and capital deployment are taken from audited annual results and, where a company publishes them, segment disclosures. No figure in the competitive landscape is an estimate.
The 30 per cent: what Pheonix did directly
The primary component of this work was gathered through four instruments, and it is used to set assumptions rather than to count anything.
- Structured interviews with producers and batching operators. The questions that mattered were about load factor, cycle time, the share of a plant’s output that is specified rather than commodity, and what the operator does when a customer asks for a carbon number. The load-factor and cycle-time findings in sections 5.4 and 11 come from this work; the published ERMCO plant counts and the published delivery-distance literature corroborate them.
- Specifier and main-contractor conversations. The single most useful finding was that a public client’s specification, not a product standard, is what changes a mix — which is why section 14 leads with procurement rather than with EN 206.
- Conference and association floor work across the ready-mix, cement and construction-materials circuit, used to establish which price movements participants regard as structural and which as cyclical. The distinction between the Chinese price decline being structural and the American one being cyclical is a primary judgement informed by that work and by the published series.
- A practitioner survey on low-carbon specification, used to size the gap between what producers can supply and what specifiers actually ask for. That gap is the reason the low-carbon segment is defined strictly in section 7.1 and is sized at 8.5 per cent rather than at the much larger share of concrete that happens to contain a supplementary material.
Where primary and secondary disagree, the report says so rather than resolving it silently. The clearest case is the price dispersion: producers in every market describe their own pricing as cost-plus, and the published data shows cement is only 18.6 per cent of an American cubic metre. The report follows the arithmetic and states the conclusion — that price is a local structure variable — in section 4.2, with the cost stack shown so a reader can check it.
Construction and rounding
All arithmetic — every CAGR, every share, every sum and every decomposition component — was computed deterministically rather than estimated in prose. Region rows are computed from unrounded volume and price and displayed to the nearest USD million, so a row’s displayed value can differ from the product of its displayed inputs by up to one unit. The growth decomposition sums to USD 72,825 million against an actual difference of USD 72,827 million; the two-unit difference is rounding in the displayed price and is disclosed rather than forced.
Boundaries and known weaknesses
Ready-mix as a share of global concrete volume — 31.6 per cent — is the report’s most important ratio and its weakest link, because the denominator comes from a thirty-billion-tonne global estimate rather than a census. South America’s 134.5 million cubic metres has not been restated since 2018. China’s figure covers above-scale enterprises and is therefore a floor. India’s volume is a penetration calculation. The base is a floor built on three hard measurements and five disclosed constructions, and section 3.1 names which is which.
About This Report
Coverage. Global, with measured series for China, the United States, the European Union, Türkiye, Israel, Norway, Switzerland, the United Kingdom, Japan and Russia, derived series for India, and constructed series for the remaining regions. Base year 2025, forecast to 2033, delivered value in United States dollars at 2025 exchange rates.
Currency and units. All values are United States dollars. Volumes are cubic metres, with the United States converted from cubic yards at 0.764555 cubic metres to the yard. Tonnages, where quoted, use 2.4 tonnes to the cubic metre and are labelled.
What this report is not. It is not a construction forecast and it does not model Gross Domestic Product, government spending or housing starts. Volume is taken as an input from measured series and forecast from penetration and price, not from a macroeconomic model. It does not value ready-mix ex-works, because the haul is the product. And it does not include site-mixed concrete, precast or block, which together remain the larger part of the world’s concrete.
Prepared by Pheonix Research. Market sizing, decomposition, segmentation and forecast by the Pheonix research desk. All figures in this report are traceable to a named source or are labelled as a Pheonix construction.