
Global Cement Market Report, Size, Share and Forecast 2026–2033: 3.8 Billion Tonnes That Will Not Grow, and the 86 Per Cent of Growth That Is Price
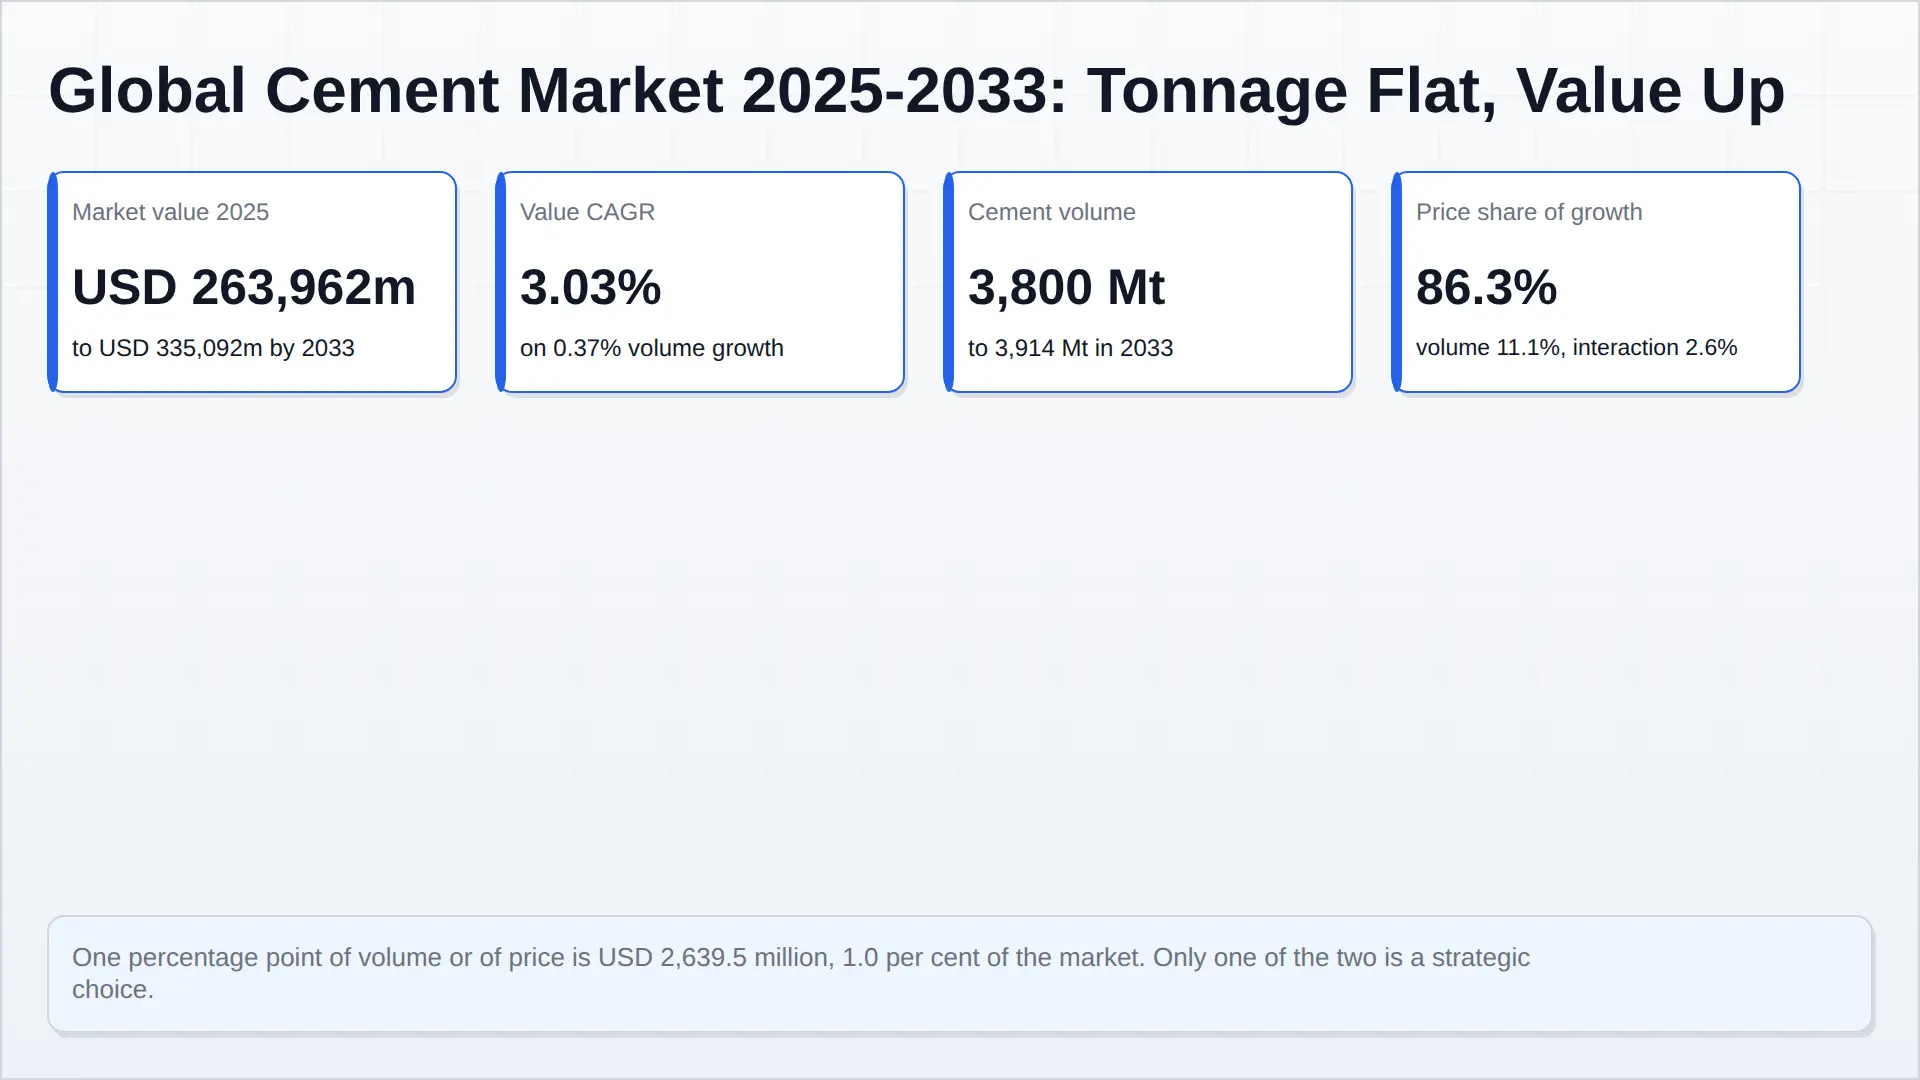
Cement is a USD 263,962 million market in 2025 that becomes a USD 335,092 million market in 2033, and 86.3 per cent of that increase is price. World production was 3,800 Mt in 2025 and will be 3,914 Mt in 2033 — a volume CAGR of 0.37 per cent against a value CAGR of 3.03 per cent. Measured as a bridge, the extra 114 Mt is worth USD 7,918 million at 2025 prices, the USD 16.15 per tonne price increase is worth USD 61,370 million at 2025 volumes, and the interaction USD 1,841 million; the three sum exactly to the USD 71,130 million increase.
The tonnage peak is already behind us. The US Geological Survey reports 3,900 Mt of world production for 2024 and 3,800 Mt for 2025, a 2.56 per cent fall in one year, and it has revised 2024 down from the 4,000 Mt it reported twelve months earlier; Cement Europe's approximately 3.89 Gt sits within 0.3 per cent of the revised figure. Almost the whole decline is one country. China fell from 1,800 to 1,700 Mt, a 5.56 per cent national decline, behind a policy regime that bans new clinker capacity outright and requires every producer to file a capacity-replacement plan by end-2025 for tonnage exceeding its project registration.
That last requirement is the most informative sentence in the file. If capacity has to be regularised against registration, a material share of Chinese capacity is off-register — so the 67.1 per cent utilisation that registered capacity and a 0.71 clinker factor imply is an upper bound, not a measurement. In a market where 48 per cent of the world's cement is made by one country running below two-thirds of its registered capacity, demand growth cannot fix price. Only output discipline can, and in China output discipline is now a policy instrument.
Carbon became a price rather than a cost in 2026. At 0.60 tonnes of CO2 per tonne of cement, 3,800 Mt carries 2,280 Mt of CO2 — 6.2 per cent of global energy emissions — and at EUR 80 per tonne that is EUR 48 per tonne of cement, or 42.1 per cent of a German ex-works price of EUR 113.98. CBAM's definitive regime began on 1 January 2026 and is designed to replace free allocation exactly as free allocation is withdrawn. A producer at 512 kg of CO2 per tonne of cementitious material, which is Heidelberg Materials' 2025 figure, now carries a 15 per cent cost advantage on carbon alone against one at 600 kg — wider than most producers' margin per tonne.
The mix shift is the second engine, and it is unambiguous. Ordinary portland cement falls from USD 89,490 million to USD 88,320 million over eight years; blended cement rises from USD 103,360 million to USD 147,840 million and composite cement from USD 45,600 million to USD 63,640 million. The market is not growing. The product is changing — and the fastest clinker substitution in the world already happened in the United States, where blended cement is 63 per cent of shipments and 95 per cent of that is portland-limestone, achieved on cost with no carbon price at all.
Geographically the split is a policy curve rather than a development curve. The two regions that lose volume are the two with the most explicit capacity governance — China by decree and Europe by carbon price. Middle East and Africa adds 155 Mt and USD 23,608 million and is the only region rising on both volume and price for structural reasons, with Dangote Cement operating 55 Mta across eleven countries against an 80 Mta target for 2030. India adds 190 Mt at 4.34 per cent and is the only large market where volume growth and price recovery are happening at once.
Market Snapshot
Cement is a USD 263,962 million market in 2025 that becomes a USD 335,092 million market in 2033, and almost none of the difference comes from making more cement. The world produced 3,800 Mt in 2025, will produce 3,914 Mt in 2033, and that is a volume CAGR of 0.37 per cent against a value CAGR of 3.03 per cent. The gap is price and mix, and it is not a rounding artefact: measured as a bridge, 86.3 per cent of the entire eight-year increase in market value is the price effect, 11.1 per cent is volume and 2.6 per cent is the interaction between them.
| Metric | 2025 | 2033 | CAGR |
|---|---|---|---|
| Market value, ex-works, USD million | 263,962 | 335,092 | 3.03% |
| Cement volume, million tonnes | 3,800 | 3,914 | 0.37% |
| Blended realised price, USD per tonne | 69.46 | 85.61 | 2.65% |
| China volume, Mt | 1,700 | 1,330 | −3.02% |
| India volume, Mt | 470 | 660 | 4.34% |
| Middle East and Africa volume, Mt | 545 | 700 | 3.18% |
| China share of world volume | 44.7% | 34.0% | — |
| Estimated global cement CO2, Mt | 2,280 | — | — |
The tonnage peak is behind us, and it happened in the source data before it happened in the commentary. The US Geological Survey's 2026 Mineral Commodity Summaries put world cement production at 3,900 Mt for 2024 and 3,800 Mt for 2025 — a fall of 2.56 per cent in one year (USGS, Mineral Commodity Summaries 2026: Cement). Two details make that more than a cyclical dip. First, the same series reported 4,000 Mt for 2024 a year earlier, so the level has been revised down as well as declined; Cement Europe's own statistics report, at approximately 3.89 Gt, sits within 0.3 per cent of the revised figure, which is what corroboration looks like. Second, the fall is almost entirely one country: China went from 1,800 Mt to 1,700 Mt, a 5.56 per cent national decline, while India rose from 440 to 470 Mt, Vietnam from 91 to 100 Mt, Egypt from 53 to 64 Mt and Türkiye from 85 to 89 Mt. The world did not stop building. China stopped being the reason the world was building.
Which is why this is no longer a volume industry. A market that adds 114 Mt over eight years — 14 Mt a year, against 3,800 Mt of installed base — cannot grow its way to a better return. It can only reprice. The rest of this report is about how that repricing is happening, who is doing it, and which of the three mechanisms behind it (consolidation, carbon, specification) is actually durable.
Market Definition and the Five Boundary Calls
Every cement number depends on where you draw the line, and the lines that matter are five. This report draws them explicitly so a reader can move them and re-run the arithmetic.
2.1 Grey cement, ex-works, one stage
The market is grey cement — cement as a hydraulic binder, including ordinary portland cement and every blended and composite product sold as cement — valued ex-works at the plant gate. It excludes ready-mix concrete, mortar, aggregates, and the logistics between plant and customer. This is the boundary the producers themselves report on, and it is the only one on which a per-tonne price can be compared across countries without a delivery-radius argument attached.
2.2 White cement is inside, and it is small but expensive
White and special cements (oilwell, sulphate-resisting, rapid-hardening) are 60 Mt in 2025 — 1.6 per cent of volume — and carry a price roughly 2.7 times the grey blend. They are kept inside the boundary because they compete for the same kiln and the same clinker, and excluding them would understate the value of the product mix shift. They are 4.8 per cent of value.
2.3 Merchant clinker is inside the market and outside the cement
Around 320 Mt of clinker moves between plants and across borders as clinker rather than as cement. It is included as a separate product line at a clinker price, because a market defined as "cement" that silently excludes the trade in its own intermediate would misprice exactly the trade flows that arbitrage carbon costs. This is the one product row that is not cement, and it is labelled as such.
2.4 Captive and imported volumes are inside; informal production is not
Integrated producers' captive consumption is counted at transfer-equivalent value. China's small-scale and unofficial output is not, and neither is artisanal production in parts of South Asia and West Africa, because neither has a usable series. The direction of the resulting bias is known and stated: the base is a floor.
2.5 The value boundary excludes carbon
No emissions cost is included in the price basis, including in Europe where one is now materially present. The forecast prices it in as it arrives. A reader who wants a carbon-inclusive number should read section 4.2 and add it.
Market Size and Forecast
The base is built upward from one published physical statistic and a price ladder that is anchored where evidence exists and disclosed where it does not.
3.1 How the 2025 base was built
- Physical output: 3,800 Mt of cement in 2025, from USGS country data (MCS 2026): China 1,700, India 470, Vietnam 100, Türkiye 89, United States 84, Iran 68, Brazil 67, Egypt 64, Indonesia 64, Russia 59, Saudi Arabia 54, Japan 44, Mexico 42, South Korea 37, all other countries 860.
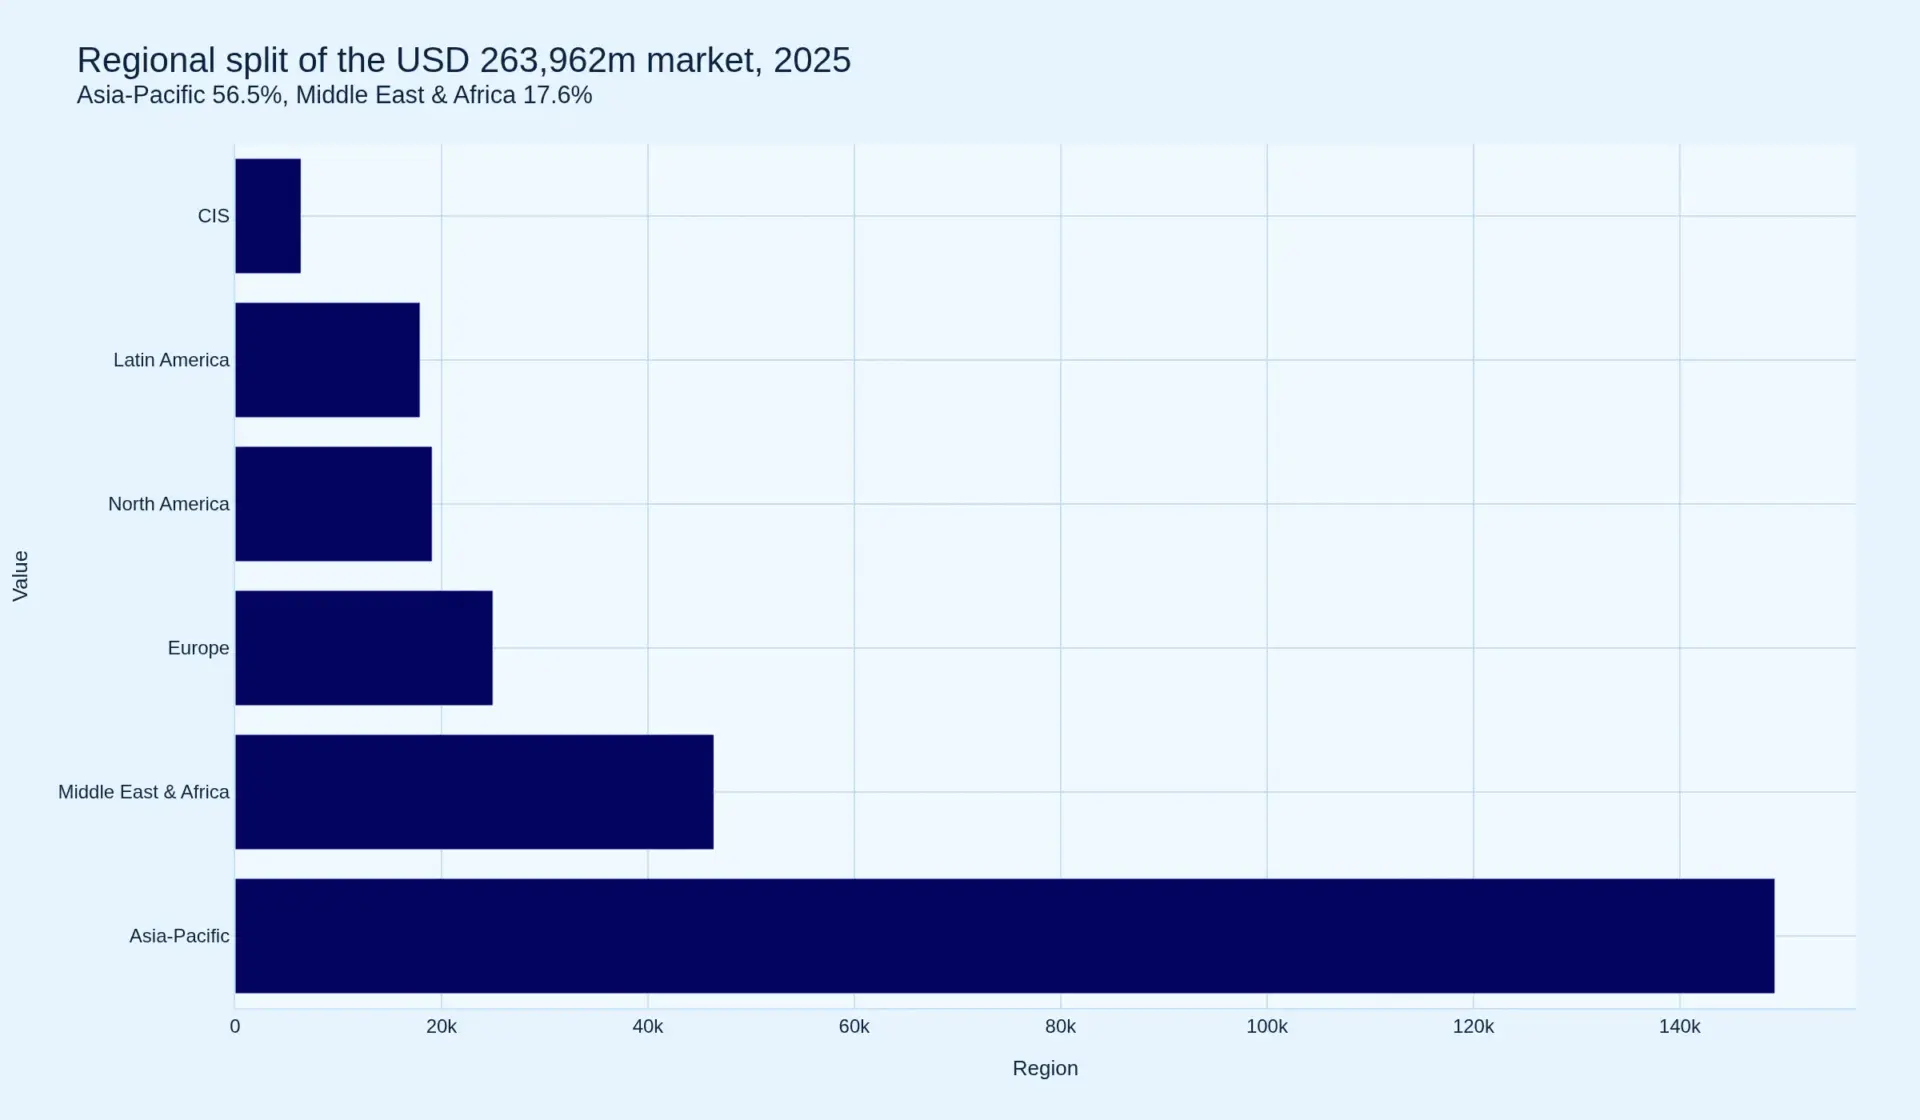
- Regional allocation: a Pheonix grouping of those countries into six regions — Asia-Pacific 2,665 Mt, Middle East and Africa 545 Mt, Europe 185 Mt, Latin America 177 Mt, North America 139 Mt, CIS 89 Mt — that sums to 3,800 Mt exactly.
- Price per region: derived from company realisation and official statistics, not from survey averages. UltraTech's FY2025 consolidated net sales of Rs 74,936 crore on 135.83 Mt of volume is Rs 5,517 per tonne, or USD 64.9 at Rs 85 to the dollar (UltraTech Cement, FY2025 results). German ex-works cement averaged EUR 113.98 per tonne in August 2025. European, North American, Latin American, Middle Eastern and African levels are set around those anchors and disclosed as Pheonix constructions.
- Product split: five product classes with separate volumes and prices, summing to the same 3,800 Mt and the same USD 263,962 million (section 7.5).
3.2 The regional allocation is the forecast
Because the global total barely moves, the forecast is almost entirely a question of which region carries which tonnes. The eight-year path is stated as six numbers and nothing else:
| Region | Volume 2025 (Mt) | Volume 2033 (Mt) | Volume CAGR | Value 2025 (USD m) | Value 2033 (USD m) | Value CAGR |
|---|---|---|---|---|---|---|
| Asia-Pacific | 2,665 | 2,600 | −0.31% | 149,210 | 178,620 | 2.27% |
| Middle East and Africa | 545 | 700 | 3.18% | 46,392 | 70,000 | 5.28% |
| Europe | 185 | 176 | −0.62% | 24,975 | 30,800 | 2.66% |
| North America | 139 | 146 | 0.62% | 19,090 | 24,528 | 3.18% |
| Latin America | 177 | 200 | 1.54% | 17,915 | 23,600 | 3.51% |
| CIS | 89 | 92 | 0.42% | 6,380 | 7,544 | 2.12% |
| Total | 3,800 | 3,914 | 0.37% | 263,962 | 335,092 | 3.03% |
Rows are computed from unrounded volume and price and displayed to the nearest USD million; a row's displayed value can differ from the product of its displayed inputs by up to one unit.
Two regions do the work. Middle East and Africa adds USD 23,608 million of value on 155 Mt of new volume, and it is the only region where both volume and price rise for structural rather than cyclical reasons. Asia-Pacific loses 65 Mt and still adds USD 29,410 million, because it is where the price recovery has the furthest to travel from the lowest base. Europe loses 9 Mt and adds USD 5,825 million, which is what a carbon-driven repricing looks like when demand is flat.
3.3 The decomposition is the finding
Hold 2025 prices and the extra 114 Mt is worth USD 7,918 million. Hold 2025 volumes and the USD 16.15 per tonne increase is worth USD 61,370 million. The interaction of the two is USD 1,841 million. The three sum to USD 71,130 million, which is exactly the difference between the two totals.
| Effect | USD million | Share of growth |
|---|---|---|
| Volume (114 Mt at 2025 price) | 7,918 | 11.1% |
| Price (USD 16.15/t on 2025 volume) | 61,370 | 86.3% |
| Interaction | 1,841 | 2.6% |
| Total increase | 71,130 | 100.0% |
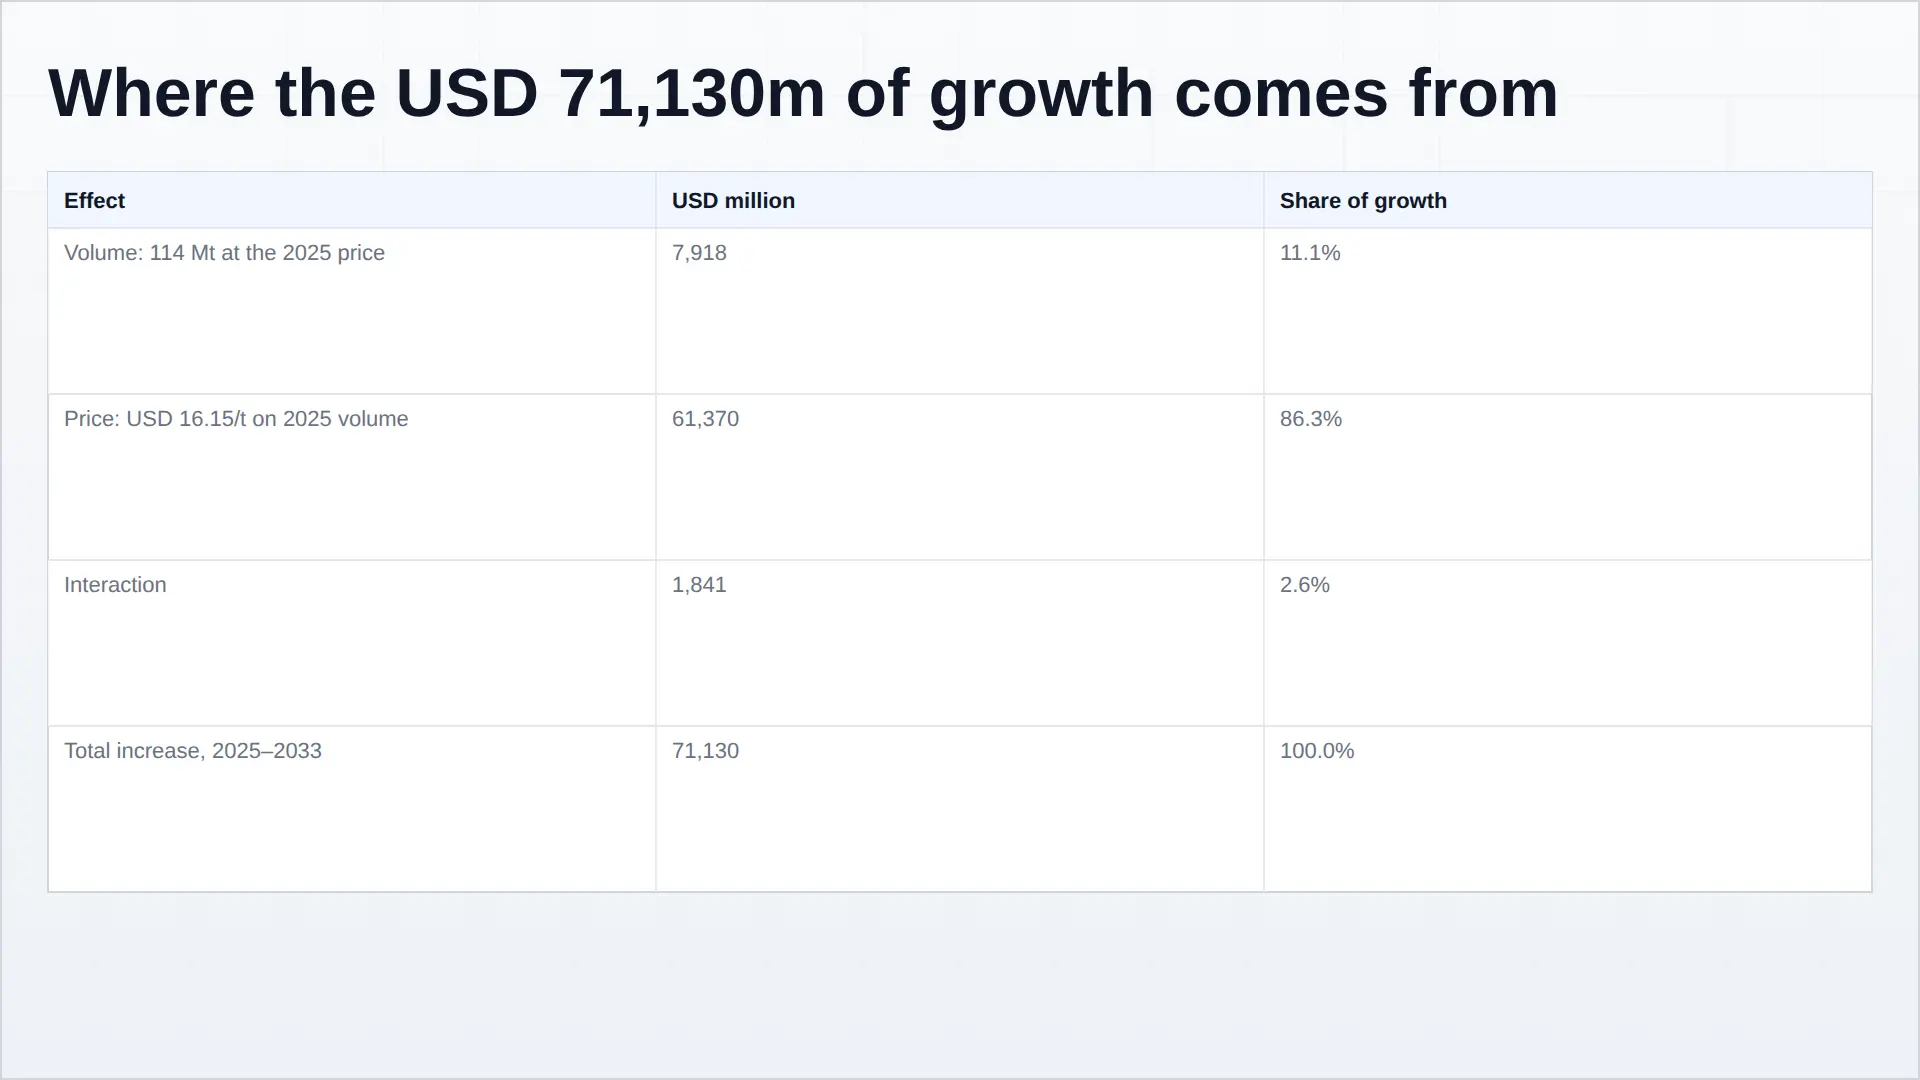
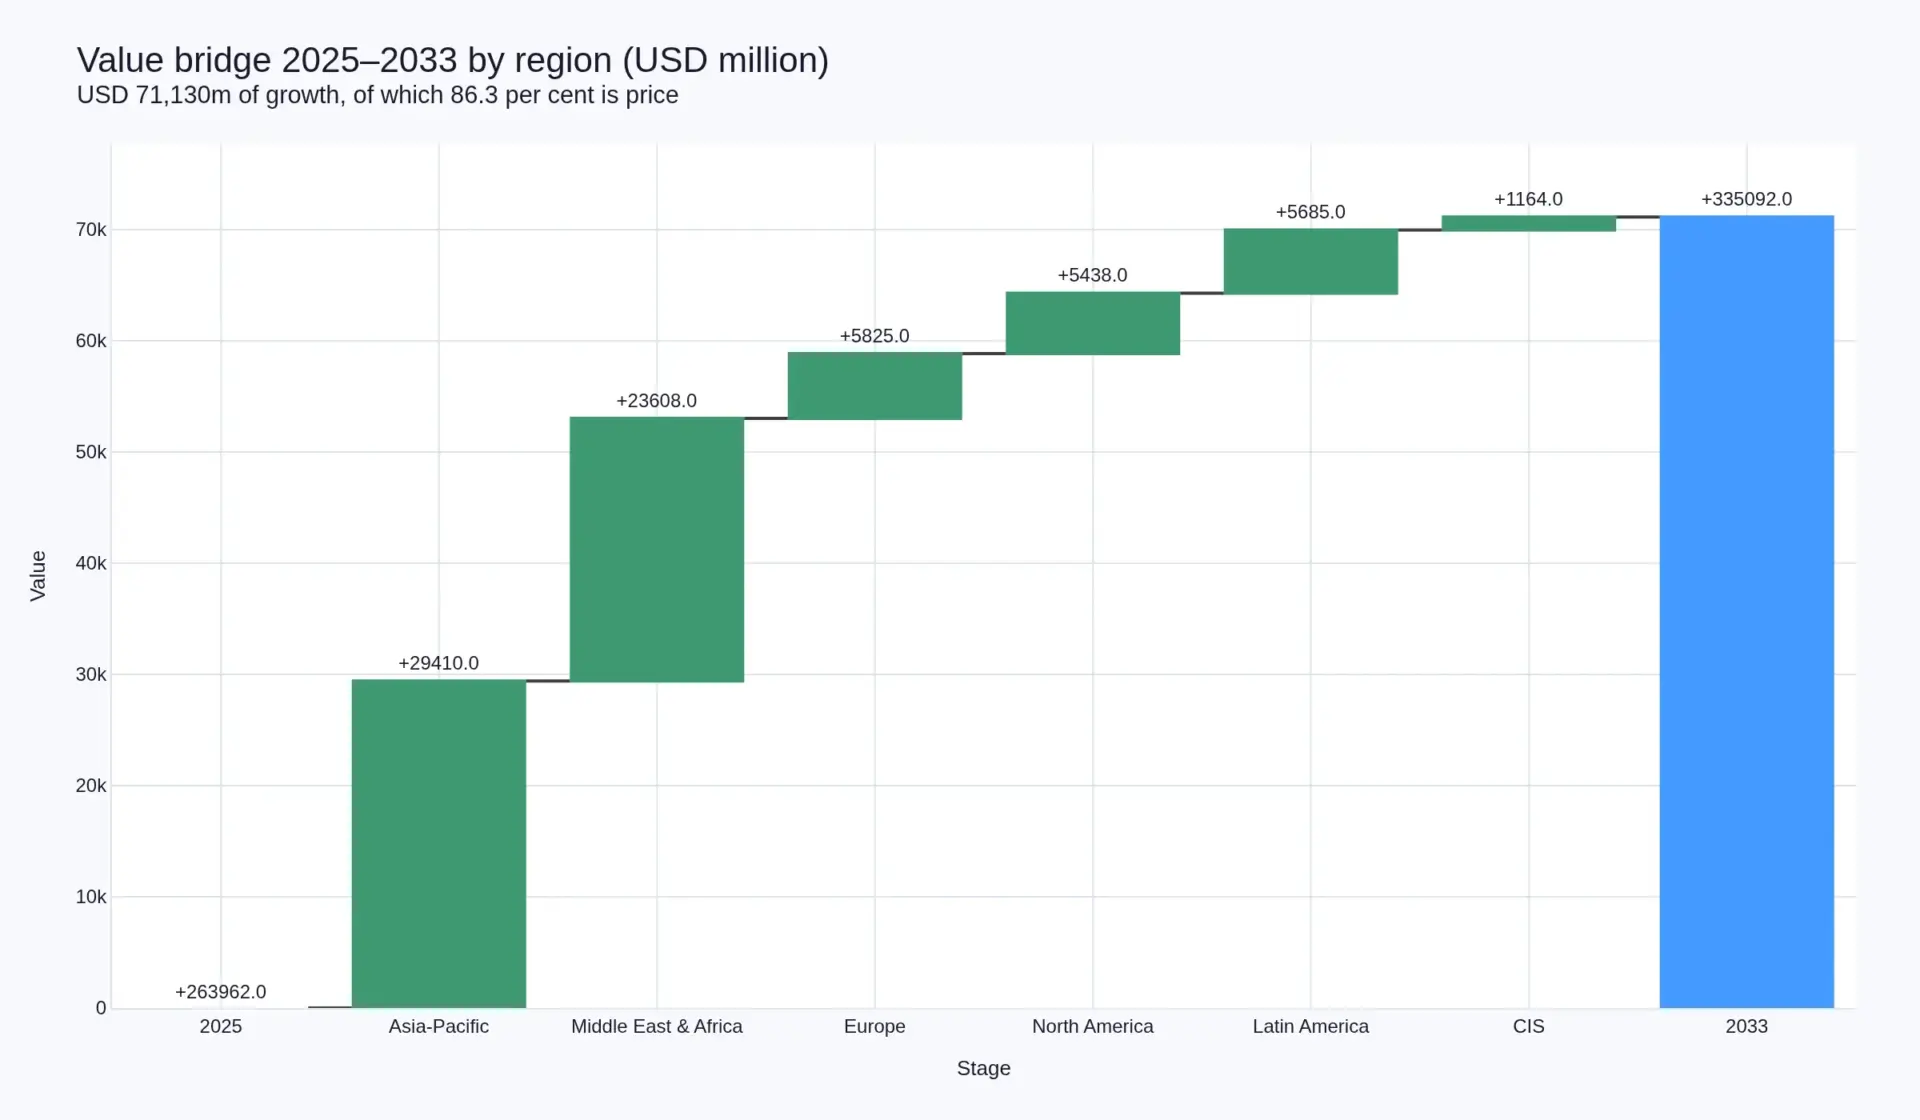
This is the single most important number in the report and it contradicts how the industry talks about itself. Cement companies describe themselves as volume businesses with a price lever. On this arithmetic the volume lever is worth a ninth of the growth and the price lever is worth six times that. A producer that wins share in a market growing 0.37 per cent in tonnes is fighting over 14 Mt a year while the value pool around it grows by USD 8.9 billion.
Four Structural Shifts Defining 2026–2033
4.1 Peak tonnage has already happened
The 2025 figure of 3,800 Mt is below the 2024 figure of 3,900 Mt and below the 4,000 Mt that the same source reported for 2024 a year earlier. China accounts for the whole of the fall. Behind that number sits a policy decision rather than a demand accident: in September 2025 six Chinese ministries issued the building-materials industry growth plan for 2025–2026, which bans new clinker capacity outright, requires capacity-replacement schemes for any new or modified project, and obliges every producer to file a replacement plan by the end of 2025 for tonnage that exceeds its project registration (Ministry of Industry and Information Technology et al., Building Materials Industry Growth Work Plan 2025–2026). The Ministry then convened the major producers in October 2025 and told them to implement capacity replacement strictly and to organise staggered production (China News Service, 20 October 2025).
The consequence is arithmetic. Against registered clinker capacity of 1,800 Mt and cement output of 1,700 Mt, a 0.71 clinker factor gives 1,207 Mt of clinker and 67.1 per cent utilisation of registered capacity. That figure is an upper bound, and the government's own document is why: if producers must file replacement schemes for capacity that exceeds their registration, then a material share of Chinese capacity is not on the register at all, and true utilisation is lower than 67.1 per cent. In a market where 48 per cent of the world's cement is made by one country running somewhere below two-thirds of its registered capacity, no amount of demand growth fixes the price. Only output discipline does — and output discipline is now a policy instrument, not a market outcome.
4.2 Carbon became a price, not a cost
At 0.60 tonnes of CO2 per tonne of cement — a 0.71 clinker factor against roughly 0.85 tonnes of CO2 per tonne of clinker — 3,800 Mt of cement carries 2,280 Mt of CO2, or 6.2 per cent of the roughly 37 Gt of global energy-related emissions. At a carbon price of EUR 80 per tonne that is EUR 48 per tonne of cement. German ex-works cement averaged EUR 113.98 per tonne in August 2025. The carbon component is therefore 42.1 per cent of the product price in the highest-priced large market in the world.
Until 2026 that number was largely notional, because European producers received most of their allowances free. It stops being notional on two tracks that arrive together. The Carbon Border Adjustment Mechanism entered its definitive regime on 1 January 2026: importers above a single 50-tonne mass threshold must hold authorised declarant status, buy certificates priced off EU ETS auction values — a quarterly average in 2026 and a weekly average from 2027 — and surrender them against declared embedded emissions, with a deduction only where a carbon price was already paid in production (European Commission, CBAM definitive regime; EUR-Lex). Cement is one of six sectors in scope. And CBAM is designed to replace free allocation exactly as free allocation is phased out, so the two move in opposite directions by construction.
Which reframes the whole cost curve. A producer with 512 kg of CO2 per tonne of cementitious material — Heidelberg Materials' 2025 figure, down 3 per cent year on year (Heidelberg Materials, FY2025 results) — has a 15 per cent cost advantage on carbon alone against a producer at 600 kg, once carbon is priced rather than allocated. That is larger than most producers' EBITDA margin per tonne. The industry has spent thirty years treating emissions as a compliance overhead; from 2026 in Europe it is a determinant of who is the low-cost producer.
4.3 The greenest input is being retired by the other transition
Clinker substitution is the only decarbonisation lever in this industry with a negative cost: supplementary cementitious materials replace clinker at a fraction of its price and a fraction of its emissions. The GCCA's own dataset shows how much of the easy work is done — CO2 per tonne of cementitious down 25.31 per cent since 1990, the clinker-to-cementitious ratio improved 10.9 per cent, but only 0.24 percentage points of that improvement added in the most recent year (GCCA, Getting the Numbers Right).
The reason the last increment is hard is not technical. The two largest SCMs are fly ash, a by-product of coal-fired power generation, and ground granulated blast furnace slag, a by-product of ironmaking. Fly ash supply is a function of coal burn, and coal burn is the thing the energy transition exists to end. Every gigawatt of coal retirement removes a stream of the cheapest clinker substitute available, in a market that is simultaneously being required to use more of it. Slag is constrained by steelmaking geography and by the fact that the steel transition reduces blast furnace output in favour of electric arc routes that produce different slags. This is the report's central physical asymmetry: the cement industry's decarbonisation pathway depends on the waste streams of the two industries it is being asked to displace.
The market has already demonstrated the workaround, and it came from the least likely place. In the United States, blended cement was 63 per cent of shipments in the first nine months of 2025, and 95 per cent of those blended shipments were portland-limestone cement (USGS MCS 2026). Limestone is not a by-product of anything and cannot be retired by a power station. The fastest clinker substitution in the world happened in the market with the weakest carbon policy, because interground limestone is cheap, available everywhere and performs adequately. That is the template, and it is a cost template rather than a carbon one.
4.4 Consolidation in the growth market, retreat in the mature one
Two large strategic moves are running in opposite directions and both are rational. In India, UltraTech and Ambuja now hold 51.2 per cent of industry revenue in FY2026, up from 44.8 per cent in FY2023, against sixteen remaining independent producers; since FY2023 the two have added Rs 28,000 crore of consolidated net sales against industry-wide growth of Rs 27,800 crore, which is to say they took effectively all of it (Business Standard, 3 November 2026). UltraTech bought India Cements in July 2024 and Kesoram in March 2025; Ambuja bought Sanghi, Penna, Orient and Jaypee.
In the same window Holcim completed the spinoff of its North American business as an independent company in June 2025 (USGS MCS 2026), and reported full-year 2025 net sales of CHF 15,724 million with a recurring EBIT margin of 18.3 per cent (Holcim, FY2025 results). One company consolidated a single fast-growing national market to the point of pricing power; the other separated a mature regional business from a global portfolio to raise the multiple on what remained. Both are saying the same thing: cement value now comes from density in one market, not breadth across many.
Market Drivers
5.1 Urbanisation, and the one country that still has a decade of it
India is the demand story and the arithmetic is unglamorous. Volumes rose 6.3 per cent to 453 Mt in FY2025 and ICRA expects 480–485 Mt in FY2026, a further 6–7 per cent, on housing and infrastructure (ICRA, Indian cement sector). Reaching 660 Mt by 2033 requires 4.34 per cent a year — below the rate India has just delivered, which is what makes it the most reliable assumption in this forecast.
5.2 Infrastructure spending, and its displacement effect
Public construction is the least price-elastic demand in the market and the most politically determined. It is also, in China, the mechanism by which demand is being withdrawn rather than added. The forecast treats Chinese infrastructure as a stabiliser, not a growth engine.
5.3 The economics of clinker substitution
A tonne of clinker replaced by limestone, slag or calcined clay avoids roughly 0.85 tonnes of CO2 and a kiln's worth of fuel. Above about 20 per cent substitution the cement chemist will start arguing; below it, the substitution is nearly free. Since the average global clinker factor sits near 0.71, the remaining headroom is real but requires either performance-based standards or a customer willing to accept slower strength gain.
5.4 Price discipline replacing volume discipline
The 2025 evidence is that producers have stopped buying volume. Heidelberg Materials grew revenue 1 per cent on like-for-like while volumes declined in several group areas, and lifted result from current operations 6 per cent to EUR 3.4 billion on "strict cost discipline and active price management" (Heidelberg Materials, FY2025 results). Holcim's recurring EBIT rose 10.3 per cent in local currency on net sales up 3.0 per cent. Both are the financial signature of a market that has stopped chasing tonnes — and it is the behaviour that makes an 86-per-cent-price-driven forecast possible.
5.5 Carbon capture as a licence to operate
Brevik CCS was inaugurated on 18 June 2025 — the world's first industrial-scale carbon capture facility in cement, capturing around 400,000 tonnes of CO2 a year, half the plant's emissions, feeding Heidelberg Materials' evoZero product, with the first CO2 already captured and liquefied and subsea injection beginning in August (Heidelberg Materials, 18 June 2025). Padeswood is now under construction. The significance is not the 400,000 tonnes against a 2,280 Mt global footprint — it is 0.02 per cent of the problem. The significance is that a credible route to a near-zero cement now exists and can be sold at a premium, which turns decarbonisation from a cost centre into a product line for the first time.
Market Restraints
6.1 China's property correction
China's 100 Mt fall in a single year is 2.6 per cent of world output removed by one market. The forecast takes China from 1,700 Mt to 1,330 Mt by 2033, a 3.02 per cent annual decline, which is slower than the 2025 rate and therefore assumes the correction decelerates.
6.2 Structural overcapacity that demand cannot absorb
3,800 Mt of cement and 3,800 Mt of clinker capacity, with the world's largest producer near two-thirds of registered utilisation, is a market where the marginal tonne sets the price. The Chinese plan's ban on new capacity is the correct instrument and it works slowly: excess capacity exits through retirement, not through bankruptcy, in a system where provincial governments own the outcome.
6.3 Energy and clinker cost
Coal at USD 100 per tonne and coke prices that move with refinery economics set the floor under clinker cost. The 2025 Indian margin recovery to 16.3–17.0 per cent EBITDA was a cost story as much as a price one, with coal down 19 per cent year on year (ICRA). A cost input that can move 19 per cent in a year in either direction is not a stable base for a price-led forecast, which is why the price path is 2.65 per cent rather than the 4–5 per cent the current cycle would suggest.
6.4 Supplementary material scarcity
Section 4.3 sets out the mechanism. The restraint is not that SCMs are unavailable; it is that the cheapest ones are by-products of industries being deliberately shrunk, and that their substitution requires a change in what customers will accept.
6.5 Carbon borders and trade defence
CBAM is the first mechanism that makes the carbon content of an imported tonne a cost at the border rather than an advantage. For exporters in North Africa, Türkiye, India and Southeast Asia — who have built on lower energy and labour costs — it converts a cost advantage into a documentation obligation. Türkiye's 89 Mt and Egypt's rise from 53 to 64 Mt are precisely the volumes most exposed.
Segmentation
7.1 By product type
Five product classes, and the mix shift inside them is the second engine of value growth after price. Ordinary portland cement loses 220 Mt of volume and 0.16 per cent a year in value; blended and composite cements take all of that and more, growing 4.58 and 4.25 per cent a year in value respectively. The market is not growing; the product is changing.
7.2 By application
Residential construction takes the majority of volume in every emerging market and a minority in every mature one, where infrastructure and commercial work dominate. The application mix is what makes India's demand 6 per cent growth and Germany's demand flat: residential formation is a function of household creation, which is a function of demographics.
7.3 By clinker factor and strength class
The commercial segmentation that matters most to a producer is not application but clinker factor, because it determines both cost and carbon. CEM I at 95 per cent clinker, CEM II at 65–94 per cent, CEM III–V at 5–64 per cent — the standard classes are also a carbon ladder, and every step down it is worth EUR 5 to EUR 10 per tonne of avoided carbon cost at current European prices.
7.4 By route to market
Bagged versus bulk is the segmentation that decides which adjacent markets this one pulls. It is treated in full in Global Cement Packaging Market, which sizes 28.9 billion bags against 32.2 per cent of production, and it is the reason this report does not double-count packaging value.
7.5 By product value
Volume first, price second, value last — the same discipline as the regional table, applied to the product mix.
| Product | Volume 2025 (Mt) | Volume 2033 (Mt) | Price 2025 (USD/t) | Price 2033 (USD/t) | Value 2025 (USD m) | Value 2033 (USD m) | Value CAGR |
|---|---|---|---|---|---|---|---|
| Ordinary portland cement (CEM I) | 1,140 | 920 | 78.50 | 96.00 | 89,490 | 88,320 | −0.16% |
| Blended portland cement (CEM II) | 1,520 | 1,760 | 68.00 | 84.00 | 103,360 | 147,840 | 4.58% |
| Composite and pozzolanic (CEM III–V) | 760 | 860 | 60.00 | 74.00 | 45,600 | 63,640 | 4.25% |
| White and special cement | 60 | 74 | 210.00 | 262.00 | 12,600 | 19,388 | 5.53% |
| Merchant clinker | 320 | 300 | 40.35 | 53.01 | 12,912 | 15,904 | 2.64% |
| Total | 3,800 | 3,914 | 69.46 | 85.61 | 263,962 | 335,092 | 3.03% |
Values are computed from unrounded volume and price and displayed to the nearest USD million; a row's displayed value can differ from the product of its displayed inputs by up to one unit. The clinker price of USD 40.35 rises to USD 53.01 because clinker is the one grade whose price is set directly by a carbon border rather than by domestic cement pricing.
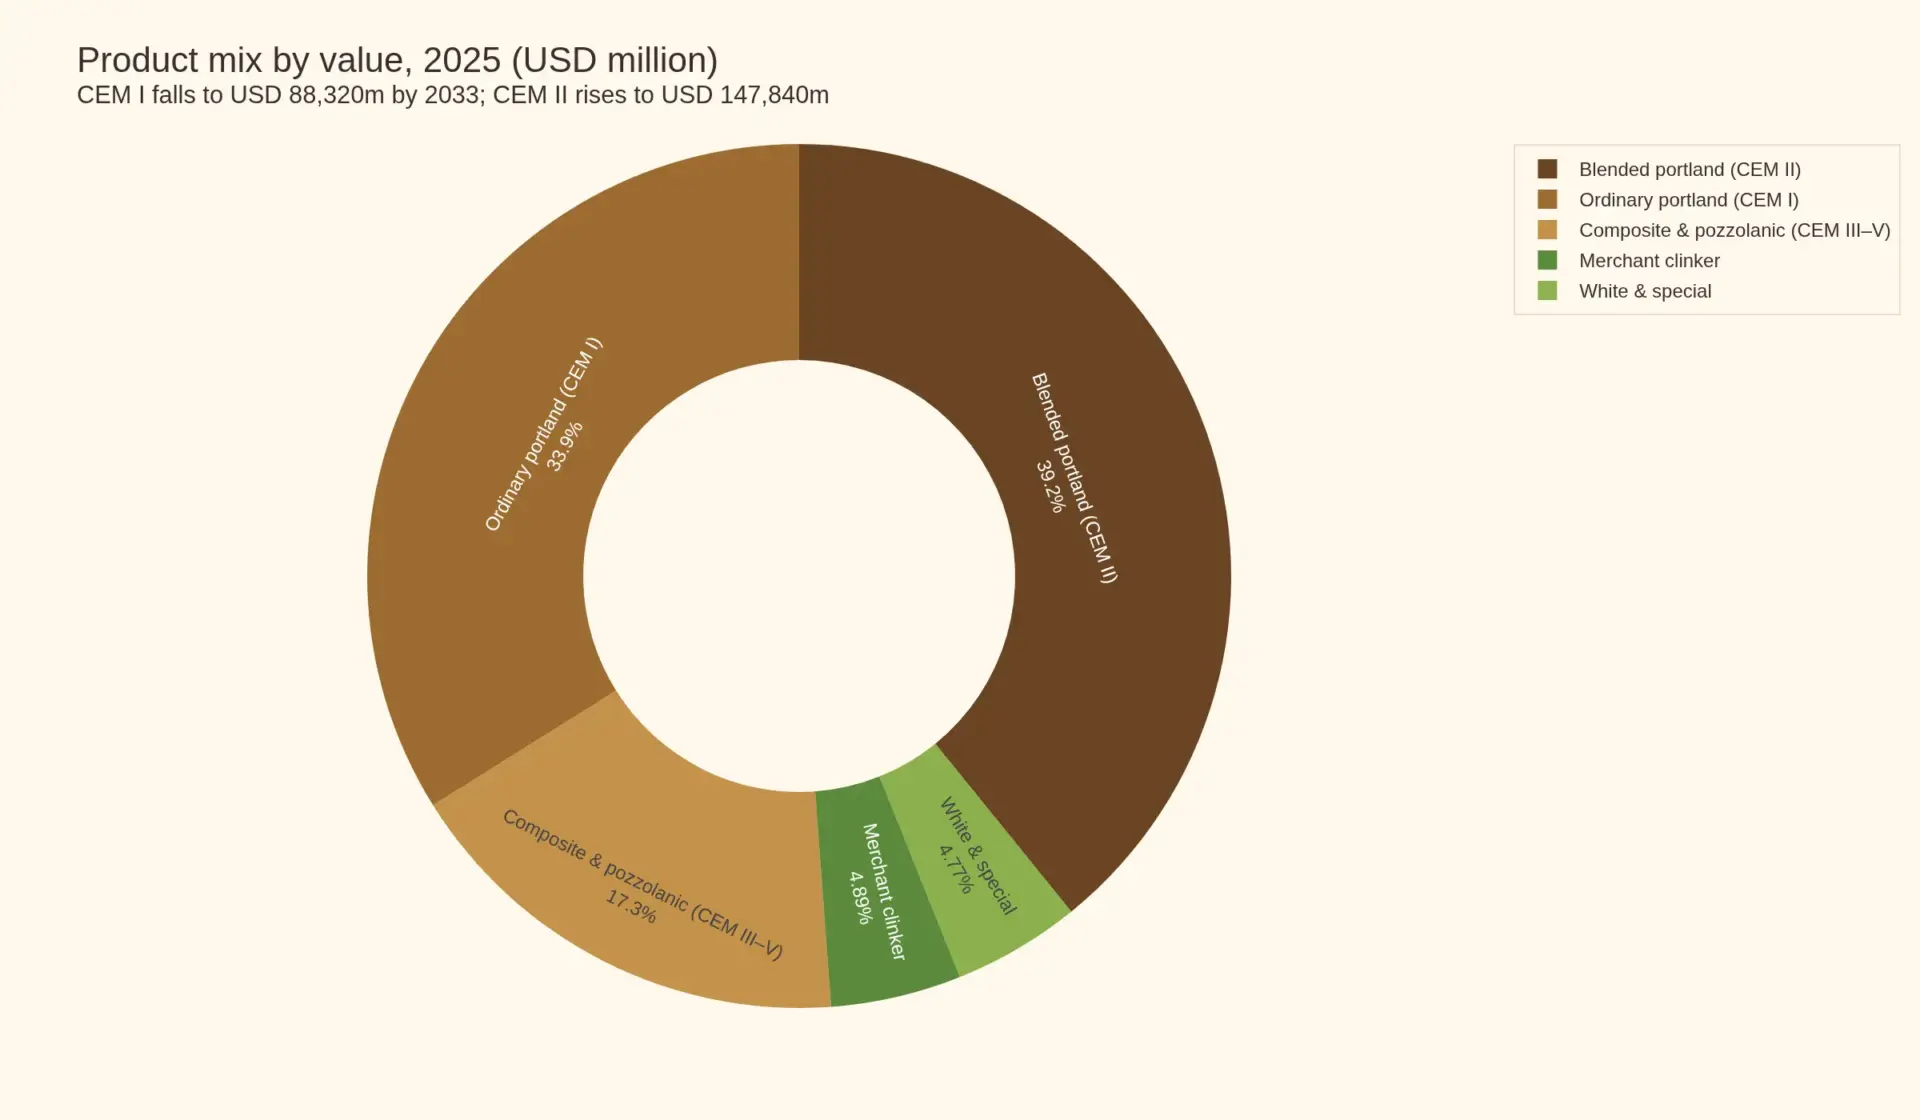
The CEM I row is the report's quietest finding. Ordinary portland cement — the product the industry was built to make, the grade specified by most legacy standards, the one every kiln can produce — goes from USD 89,490 million to USD 88,320 million over eight years. It shrinks in value while its price rises 2.6 per cent a year. Blended cement adds USD 44,480 million of value on 240 Mt of new volume, because it sits at the intersection of the three forces in this report: it is cheaper to make, it is lower in carbon, and it is what the standards now permit.
Regional Analysis
8.1 China: 44.7 per cent of the world, falling
China made 1,700 Mt in 2025, down from 1,800 Mt, and holds 44.7 per cent of world volume. The policy framework is now explicit: no new clinker capacity, replacement schemes mandatory, unregistered capacity to be regularised by end-2025, and — the provision with the longest shadow — cement entering the national emissions trading system with allowances allocated on a carbon-intensity basis and quota volume linked to output (MIIT et al., 2025–2026 plan). That last design choice is the single most consequential policy in the global cement market. An output-linked intensity benchmark rewards the efficient producer and penalises the marginal one, and it does so through a mechanism the state controls directly rather than through a price signal it must wait for. China's path to 1,330 Mt by 2033 is a policy path, not a demand forecast.
8.2 India: the only market that adds a China
India made 470 Mt in 2025 and 12.4 per cent of world volume, and reaches 660 Mt by 2033 at 4.34 per cent. Three things distinguish it. Demand growth is residential and infrastructural at once. Consolidation has already delivered pricing power — 51.2 per cent of revenue in two hands. And price has room: UltraTech's realisation of Rs 5,517 per tonne is USD 64.9, roughly half the German ex-works level, in a market where the average price rose 8 per cent to Rs 360 per bag in May 2025. India is where volume growth and price recovery are happening in the same market at the same time, which is true of nowhere else at scale.
8.3 Rest of Asia-Pacific: 495 Mt of export capacity
Vietnam's 100 Mt against a domestic market of perhaps 30 Mt makes it the largest net exporter in the world; Indonesia, Japan and South Korea are structurally long. This is the region most exposed to a CBAM border and least able to pass it through, because its cost advantage is energy and labour rather than carbon.
8.4 Europe: flat tonnes, rising prices, falling emissions
185 Mt falling to 176 Mt, with value up 2.66 per cent a year on a 45 per cent price rise from USD 135 to USD 175 per tonne. Europe is the world's first genuinely carbon-priced cement market and the arithmetic in section 4.2 is the reason the price path is the steepest of any region relative to volume. The risk is not that prices fail to rise; it is that demand falls faster than price, and the forecast's −0.62 per cent volume assumption is a judgement rather than a measurement.
8.5 North America: the premium market
139 Mt rising to 146 Mt at 0.62 per cent, with value up 3.18 per cent. The United States made 84 Mt in 2025, down from 85 Mt, and imports a material share of its consumption. The structural fact worth more than the growth rate: 63 per cent of US shipments are blended cement and 95 per cent of those are portland-limestone. The largest premium-priced market in the world has already solved its clinker factor, quietly, on cost.
8.6 Middle East and Africa: the last greenfield continent
545 Mt to 700 Mt at 3.18 per cent, and USD 46,392 million to USD 70,000 million at 5.28 per cent — the fastest-growing region in the report on both measures, and the only one where 20.9 per cent of 2033 world value sits against 17.6 per cent in 2025. Dangote Cement operates 55 Mta across eleven African countries — 35.3 Mta in Nigeria and 19.7 Mta elsewhere — and targets 80 Mta by 2030, having commissioned 3 Mta in Côte d'Ivoire in 2025 and with a 6 Mta integrated plant at Itori under way; its Nigerian cement and clinker exports rose 18.6 per cent to 1.4 million tonnes across 34 clinker shipments (Dangote Cement, 2025 Annual Report). The African market is being built by one company at a scale no European or American producer has attempted in a generation, and it is being built as an export platform as well as a domestic one — which is exactly the substitution of intercontinental imports that CBAM makes more valuable.
8.7 Latin America and the CIS
Latin America grows 1.54 per cent in volume and 3.51 per cent in value; Brazil's 67 Mt is the anchor and its price is the lowest in the Americas. The CIS is the report's smallest and weakest region: Russia falls from 67 to 59 Mt, and the 89 Mt regional base grows 0.42 per cent. Both are price stories rather than volume stories and neither is large enough to move the global total by a whole point.
8.8 What the geography says
Sort the regions by volume CAGR and the pattern is not a development curve — it is a policy curve. The two regions that lose volume are the two with the most explicit capacity governance: China by decree, Europe by carbon price. The three that gain are the three with the least: India, Africa, the Middle East. Where the state has decided how much cement should exist, tonnage falls and price rises; where it has not, tonnage rises and price follows cost. Both produce value growth, and they are different businesses.
Strategic Outlook
Three strategies are defensible in a market growing 0.37 per cent in tonnes, and only one of them is available to most participants.
Density. Own a region deeply enough to set price. This is the Indian model, and the evidence is that it works: two producers took all of an industry's incremental revenue growth in three years. It requires capital at the bottom of a cycle and it is unavailable to anyone who does not already have a position.
Carbon position. Be structurally below the benchmark on CO2 per tonne of cementitious material, so that a rising carbon price widens rather than narrows your margin. Heidelberg Materials at 512 kg against a European average near 600 kg has a cost advantage that grows every year the EUA price rises, and Brevik converts part of that position into a premium product.
Product mix. Sell the grade that is growing. Blended cement adds USD 44,480 million of value while CEM I shrinks, and the limestone route requires no by-product supply chain — which is why it won in the United States without anyone calling it a climate policy.
What is not defensible is the strategy most of the industry is still on: hold volume, hope for price, and treat carbon as a compliance line. In a market where 86.3 per cent of growth is price and price is increasingly a function of carbon, that is a strategy for being the marginal producer.
Watch List
- China's output-linked ETS benchmark. The allocation design — intensity benchmark with quota tied to output — determines whether the 1,700 Mt path steepens or flattens. Watch the first full compliance cycle, not the announcement.
- India's price realisation. Rs 360 per bag is the level at which consolidation starts converting into margin. A move above Rs 400 without volume loss would confirm the two-horse thesis.
- The 50-tonne CBAM threshold. It exempts small importers and concentrates the burden on the large ones, which is where the trade flows actually are. Watch the first certificate surrender in 2027 for whether the cost passes back to the exporter.
- Fly ash availability as coal retires. The first European or North American market where SCM supply constrains blended cement growth rather than clinker supply is the signal that the decarbonisation pathway has a physical ceiling.
- Dangote's 80 Mta target. If reached, it is a 25 Mta addition in a region adding 155 Mt in eight years — a fifth of the region's growth from one balance sheet.
- Merchant clinker trade. The one product line whose price is set directly by a carbon border. A widening clinker–cement spread is the clearest early read on CBAM's real incidence.
- Limestone availability and standards. Portland-limestone cement's US success depended on a standard change. Watch which other jurisdictions adopt an equivalent; that is a clinker-factor step change with no cost.
Table of Contents
- Market Snapshot
- Market Definition and the Five Boundary Calls
- Market Size and Forecast
- 3.1 How the 2025 Base Was Built
- 3.2 The Regional Allocation Is the Forecast
- 3.3 The Decomposition Is the Finding
- Four Structural Shifts Defining 2026–2033
- 4.1 Peak Tonnage Has Already Happened
- 4.2 Carbon Became a Price, Not a Cost
- 4.3 The Greenest Input Is Being Retired by the Other Transition
- 4.4 Consolidation in the Growth Market, Retreat in the Mature One
- Market Drivers
- 5.1 Urbanisation, and the One Country That Still Has a Decade of It
- 5.2 Infrastructure Spending, and Its Displacement Effect
- 5.3 The Economics of Clinker Substitution
- 5.4 Price Discipline Replacing Volume Discipline
- 5.5 Carbon Capture as a Licence to Operate
- Market Restraints
- 6.1 China’s Property Correction
- 6.2 Structural Overcapacity That Demand Cannot Absorb
- 6.3 Energy and Clinker Cost
- 6.4 Supplementary Material Scarcity
- 6.5 Carbon Borders and Trade Defence
- Segmentation
- 7.1 By Product Type
- 7.2 By Application
- 7.3 By Clinker Factor and Strength Class
- 7.4 By Route to Market
- 7.5 By Product Value
- Regional Analysis
- 8.1 China
- 8.2 India
- 8.3 Rest of Asia-Pacific
- 8.4 Europe
- 8.5 North America
- 8.6 Middle East and Africa
- 8.7 Latin America and the CIS
- 8.8 What the Geography Says
- Competitive Landscape
- Value Chain
- Investment Activity
- Technology and Innovation
- Market Risk
- Regulatory Landscape
- Strategic Outlook
- Watch List
- Methodology
- About This Report
Competitive Landscape
Competitive Landscape
This is a fragmented global market made of oligopolistic regional ones, and that distinction is the whole of the competitive analysis. No company holds a double-digit share of world cement. Six groups hold positions across multiple countries, and each of them is dominant in the places it chooses to be. The result is a market where a producer can be the price-setter in one country, a marginal supplier in the next, and structurally short of pricing power everywhere it is not one of the top two.
| Entity | Verified position | Why it matters here |
|---|---|---|
| Heidelberg Materials | FY2025 revenue EUR 21.46 billion, up 1 per cent like-for-like; result from current operations EUR 3.38 billion, up 6 per cent; RCOBD margin 21.8 per cent; ROIC 10.4 per cent; specific net CO2 512 kg per tonne of cementitious material, down 3 per cent; sustainable products 37.2 per cent of revenue | The clearest working example of the strategy this report argues for: price before volume, with a carbon position that is now measurably better than the European average and a product (evoZero) that monetises it |
| Holcim | FY2025 net sales CHF 15,724 million, up 3.0 per cent in local currency; recurring EBIT CHF 2,876 million, up 10.3 per cent; recurring EBIT margin 18.3 per cent; free cash flow CHF 2,154 million; North American business spun off as an independent company in June 2025 | The opposite strategic answer from the same evidence: earnings growth of three times the sales growth, funded by removing capital from a market where it could not set price |
| UltraTech Cement | FY2025 consolidated sales volumes 135.83 Mt; net sales Rs 74,936 crore, implying a realisation of Rs 5,517 per tonne (USD 64.9); India Cements acquired July 2024, Kesoram March 2025 | Together with Ambuja it holds 51.2 per cent of Indian industry revenue in FY2026, up from 44.8 per cent in FY2023, in the fastest-growing large market in the world |
| Cemex | Mexico-headquartered multinational with cement and ready-mix positions across the Americas, Europe and the Middle East | The most geographically balanced of the majors, and therefore the most exposed to the region-by-region divergence in this forecast |
| Anhui Conch Cement | China’s largest listed cement producer, operating inside the world’s largest and most capacity-constrained national market | Its economics are set by the output-linked intensity benchmark in the national emissions trading system, not by a demand curve |
| China National Building Material | The state-linked group through which a large share of Chinese cement capacity is held | Capacity policy in China is, in practice, negotiated with holders of this kind of balance sheet |
The buyer is not fragmented, and that sets the terms
Cement’s customer base is construction: developers, contractors, ready-mix plants and public procurers. None of them is concentrated in the way cement is, which is why the industry has been able to convert consolidation into price. The counter-example that proves the rule is bulk. Where a customer can take cement in a tanker, the product is fully commoditised and the producer’s density is worth nothing; where the customer needs a bag and a delivery schedule, density is worth a price premium. This is the mechanism behind the packaging market sitting at USD 5,442 million in its own right — bagged cement is the only place a brand is visible.
Three competitive structures, not one
Indian duopoly. Two producers took effectively all of an industry’s revenue growth in three years while sixteen independents remained. The structure now permits price leadership, and the 8 per cent price increase to Rs 360 a bag in May 2025 is what it looks like in practice.
Chinese administered competition. Capacity is licensed, replacement is mandatory, and emissions allowances are allocated against an output-linked intensity benchmark. Competition there is a function of who holds the cheapest compliant capacity, and the state decides the compliance bar.
African single-builder. Dangote Cement operates 55 Mta across eleven countries against an 80 Mta target for 2030, having commissioned 3 Mta in Côte d’Ivoire in 2025. A continent adding 155 Mt over eight years is being served by a company adding capacity at a scale that no European or North American producer has attempted in a generation.
What pricing power actually rests on
Not on scale, and not on technology. On three things: the share of the local market held by the top two, the cost of the marginal tonne, and whether the customer has an alternative in a silo. Every company that improved its margin in 2025 improved it by moving one of those three, and no company improved it by selling more cement.
Value Chain
Value Chain
Cement is a low-value, high-mass product made from a high-temperature process, and every economic feature of the chain follows from that sentence. A tonne of cement sells for USD 69.46 blended; the kiln that makes the clinker inside it costs more per annual tonne than almost any industrial process outside steel; and the finished product is worth so little per kilogram that it cannot travel far.
Stage one: quarry and raw meal
Limestone, clay and correctives are quarried, crushed and blended into a raw meal with a tightly controlled chemistry. The quarry is the least discussed and most strategically binding asset in the chain: a cement plant is economically tied to a limestone reserve for the life of the reserve, which is why cement assets change hands with the mineral rights attached and why greenfield entry is a permitting exercise before it is a capital one.
Stage two: clinker, where all the carbon is
Raw meal is fed to a rotary kiln at around 1,450 degrees Celsius. Two thirds of the CO2 released is not fuel — it is calcination, the chemical decomposition of calcium carbonate into calcium oxide and CO2, and it is unavoidable in any kiln that makes portland clinker. That is why the industry’s emissions are a chemistry problem rather than an energy problem, and why the only levers that scale are reducing the share of clinker in the product and capturing the CO2 that the chemistry releases.
Stage three: grinding and blending, where the product is decided
Clinker is ground with gypsum and, increasingly, with limestone, fly ash, slag or calcined clay. This stage is where the market’s product mix is decided, where the clinker factor is set, and where the cheapest decarbonisation in the industry happens. It is also where the economics are most attractive: substituting a tonne of clinker with a tonne of limestone removes roughly 0.85 tonnes of CO2 and replaces a high-temperature intermediate with a quarried one.
Stage four: distribution, and the radius that governs everything
Bulk cement moves by road tanker, rail or barge, and its economic radius is short — a few hundred kilometres at most for road delivery, further where rail or water exists. Clinker does not obey that constraint: it is a dry bulk commodity that moves between continents, which makes it the arbitrage instrument of the entire chain and, once a carbon border price exists, the point at which carbon cost first becomes trade.
| Stage | What sets the price | Who holds the margin |
|---|---|---|
| Limestone and raw materials | Reserve access, royalties, haul distance | The holder of the reserve, permanently |
| Clinker | Fuel and power cost plus the marginal kiln’s cost, and increasingly the carbon price | The lowest-carbon kiln, and no one else |
| Grinding and blending | SCM availability and the clinker factor permitted by the specification | The blender, when SCMs are cheap |
| Cement distribution | Freight radius and density of the plant network | The producer with the densest network |
| Sale to construction | Local structure: two producers set price, sixteen do not | The top two in each market |
Where the EUR 48 of carbon lands
At 0.60 tonnes of CO2 per tonne of cement and EUR 80 per tonne of carbon, EUR 48 of cost attaches to a product selling for EUR 113.98 in Germany — 42.1 per cent. That cost arises at stage two and can only be avoided at stage three, by blending, or by capturing at stage two. Which means the margin in this chain has moved: it used to sit with whoever owned the cheapest kiln, and it now sits with whoever owns the clinker factor. A grinder with no kiln and a supply of limestone is, for the first time in the industry’s history, structurally advantaged rather than structurally dependent.
What the chain cannot do
It cannot pass a demand contraction back to the quarry, because a kiln must run continuously to be economic and limestone is cheap. It cannot pass a carbon cost forward to a customer who can switch to an imported tonne, unless a border adjustment closes that route. And it cannot fix overcapacity, because the marginal tonne that sets the price is produced by an asset that has already been paid for. The value chain is efficient at converting rock into powder and structurally incapable of converting powder into pricing power without consolidation.
Investment Activity
Investment Activity
Capital is moving in two directions at once and both are defensive. One set of commitments buys density in markets where price can be set; another buys the right to keep operating in markets where carbon is priced. Almost nothing is being spent to add cement capacity in a market that needs 14 Mt a year.
Density: acquisitions, not greenfields
The largest capital deployments in the sector in 2024–2025 were purchases of existing Indian capacity. UltraTech acquired India Cements in July 2024 and Kesoram in March 2025; Ambuja acquired Sanghi Industries, Penna Cement, Orient Cement and Jaypee Cement across three years, following the Adani group’s 2023 purchase of Ambuja and ACC from Holcim. The result is a market where two producers hold 51.2 per cent of industry revenue in FY2026, against 44.8 per cent in FY2023, having added Rs 28,000 crore of sales against industry-wide growth of Rs 27,800 crore (Business Standard, 3 November 2026).
That is the defining investment fact of this cycle. In a market growing 0.37 per cent in tonnes, buying a competitor is the only way to grow volume, and it is simultaneously the only way to raise price. The buyer pays for capacity and receives pricing power; the arithmetic works only because both are in the same transaction.
Greenfield: it happens where the state is not allocating
The capacity being built is overwhelmingly African and Asian. Dangote Cement commissioned 3 Mta in Côte d’Ivoire in 2025, bringing its total to 55 Mta across eleven countries — 35.3 Mta in Nigeria and 19.7 Mta across the rest of the continent — with a 6 Mta integrated plant at Itori under way and a target of 80 Mta by 2030 (Dangote Cement, 2025 Annual Report). Its Ethiopian expansion is carried at USD 400 million. In a region adding 155 Mt over eight years, one balance sheet is financing a substantial share of it.
Carbon: the first capital commitments that buy a licence rather than a tonne
Brevik CCS was inaugurated in June 2025 at around 400,000 tonnes of CO2 capture a year — half the plant’s emissions — as the first industrial-scale carbon capture facility in the cement industry, with Padeswood now under construction behind it (Heidelberg Materials, 18 June 2025). This capital does not add a tonne of capacity. It buys a defensible position in the European market after free allocation ends, and it produces a product that can be sold at a premium as evoZero.
The economics are instructive precisely because they are unattractive on their own terms. 400,000 tonnes against 2,280 Mt of global cement emissions is 0.02 per cent of the problem. No producer would build it for the emissions; they build it because the alternative is to be the plant that cannot operate after 2030. That is what a licence-to-operate investment looks like, and it is the fastest-growing category of cement capex.
Retreat: the third direction
Holcim completed the spinoff of its North American business as an independent company in June 2025 (USGS MCS 2026), and closed 2025 with a recurring EBIT margin of 18.3 per cent on CHF 15,724 million of net sales (Holcim, FY2025 results). Separation is an investment decision of the same kind as an acquisition: it reallocates capital away from a business that could not set price and toward one that can earn a higher multiple on what remains.
What is not being funded
There is no wave of European or North American greenfield clinker capacity, and there will not be: a new kiln in a market with flat demand and a rising carbon price is a bet against the policy. There is very little investment in conventional capacity anywhere that already has enough of it. And there is almost no investment in supplementary cementitious material production at the scale the substitution pathway requires — which is the gap this report would watch most closely, because the cheapest decarbonisation route in the industry is supply-constrained by somebody else’s transition.
Technology & Innovation
Technology and Innovation
The kiln is a nineteenth-century idea executed at twenty-first-century precision, and the innovation that matters is not in the kiln. Rotary kiln technology is mature, preheater and precalciner designs are converged, and no producer expects a step change in thermal efficiency. What is changing is the product that leaves the mill and the chemistry that goes into it.
The clinker factor is the technology
Every point of clinker replaced is roughly 0.85 tonnes of CO2 avoided and a high-temperature intermediate substituted for a quarried or waste material. The GCCA’s dataset shows how far this has gone and how much momentum it has lost: CO2 per tonne of cementitious material down 25.31 per cent since 1990, the clinker-to-cementitious ratio improved 10.9 per cent, and only 0.24 percentage points of that improvement added in the most recent year (GCCA, Getting the Numbers Right).
| Substitute | Typical replacement rate | Availability constraint |
|---|---|---|
| Ground limestone | Up to 15–35 per cent depending on standard | None — quarried, and already 95 per cent of US blended shipments |
| Fly ash | 15–35 per cent | Coal-fired generation, which is being retired |
| Ground granulated blast furnace slag | 30–70 per cent | Blast furnace ironmaking, whose geography and technology are both shifting |
| Calcined clay (LC3) | 30–50 per cent in combination | Clay deposits and a new calcination step, which is a capital project |
The limestone row is the one that has already won. 63 per cent of United States cement shipments were blended in the first nine months of 2025, and 95 per cent of those were portland-limestone cement (USGS MCS 2026). It required no new by-product supply chain, no performance compromise that customers would not accept, and no carbon price. It required a standard that permitted it.
Fuels and power
Alternative fuel substitution has risen to 12.8 times its 1990 level and energy efficiency has improved 17 per cent over the same period (GCCA GNR). Both are real and both are near their practical limit in the markets that have already done the work: a kiln can only absorb so much waste-derived fuel before chlorine and sulphur balances become the constraint. Green electricity is the growth area — UltraTech commissioned over 1 GW of renewable capacity for captive use in FY2025 — but electricity is a small share of a cement plant’s energy input, which caps how much decarbonisation it delivers.
Carbon capture: three routes, one at scale
Post-combustion amine scrubbing is the route that exists. Brevik’s 400,000 tonnes a year runs on it, integrated into a working plant without disrupting production, with the CO2 liquefied, shipped and injected under the North Sea through the Northern Lights chain (Heidelberg Materials, 18 June 2025). Oxyfuel and calcium looping remain at pilot scale. The binding constraint on all three is not chemistry but the cost of the transport and storage network and whether a carbon price high enough to pay for it exists where the plant is.
The digital layer
Kiln optimisation, predictive maintenance and automated quality control are now standard capital items in large groups and deliver single-digit percentage improvements in fuel consumption and availability. They matter to the cost curve; they do not change the product. The genuinely novel digital work is at the interface with the customer — automated dispatch, silo-level inventory telemetry and batch traceability — because those defend the density that this report has argued is the only durable source of pricing power.
Why patent activity is low
The chemistry is a century old, the equipment is supplied by a small group of specialist builders, and the improvements that matter are process know-how held inside operating companies rather than claims held in a registry. The one area where intellectual property is thickening is capture solvents and mineralisation, which is where the next decade of genuine novelty sits.
Market Risk
Market Risk
The largest risk to this forecast is not a demand risk; it is that the price recovery stops. A market whose value growth is 86.3 per cent price cannot be underwritten by its volume forecast, and the sensitivity is easy to state: one percentage point of volume is USD 2,639.5 million, and one percentage point of price is the same USD 2,639.5 million — 1.0 per cent of the market each. The two are equally important to the value line, but only one of them is a strategic choice.
Risk 1: price discipline breaks
Every producer’s 2025 results were built on price before volume: Heidelberg Materials grew result from current operations 6 per cent on 1 per cent revenue growth, and Holcim grew recurring EBIT 10.3 per cent on 3.0 per cent sales growth. That behaviour is a choice, not a law. In a market with 48 per cent of world output in one country running below two-thirds of registered utilisation, one producer deciding to fill a kiln can move a regional price for a year. The forecast assumes discipline holds in India and Europe and that China’s output is administratively constrained. If any of those three fails, the value line falls materially faster than the volume line does.
Risk 2: Chinese policy is a policy, and policies change
The 2033 China volume of 1,330 Mt assumes a managed decline at 3.02 per cent a year. Two deviations are possible and both are material: a stimulus-driven construction restart would arrest the decline and could add 100 Mt to the global total, while a faster property contraction could remove twice what is modelled. The Chinese emissions trading system’s output-linked intensity benchmark is the mechanism that will decide which — and its first full compliance cycle is the thing to watch, not the announcement of it.
Risk 3: carbon cost arrives before the pass-through does
The CBAM definitive regime began on 1 January 2026 and free allocation is being withdrawn on a parallel timetable. A producer that must buy allowances before its customers accept a higher price carries the cost in working capital and margin. At EUR 48 per tonne of cement on a EUR 113.98 product, even a six-month lag in pass-through is a serious balance-sheet event, and it lands first on the producers with the least pricing power — which is to say the ones with the least density.
Risk 4: the supplementary material ceiling
Section 4.3 sets out the asymmetry: the cheapest clinker substitutes are by-products of coal-fired power and blast furnace ironmaking, and both are being deliberately reduced. A European or North American market where blended cement growth is capped by fly ash availability rather than by standard or by customer acceptance would break the substitution pathway that this forecast’s price and mix assumptions rely on.
Risk 5: energy and freight shock
Coal fell 19 per cent year on year to USD 100 per tonne in the Indian market in mid-2025, and that fall is a large part of why Indian margins recovered to 16.3–17.0 per cent. It can move the other way. A simultaneous energy and freight shock would raise cost and suppress construction demand at the same time, which is the one combination that has historically broken cement pricing.
Risk 6: trade diversion and retaliation
A carbon border does not remove trade; it relocates it. Cement and clinker that would have gone to Europe can move to markets without a border mechanism, depressing price in Africa, South Asia or Latin America. The forecast’s Middle East and Africa volume and price path is the most exposed to that diversion, and it is the region carrying the largest share of this report’s growth.
What is not in the risk case
A wholesale substitution of cement by another binder is not modelled. Calcined clay, geopolymers and alkali-activated materials are real and are scaling from a small base; none is close to displacing portland cement at 3,800 Mt. Nor is a construction demand collapse modelled: the volume path already embeds a Chinese contraction and near-zero growth in Europe, so a global recession would damage the price line far more than the volume line — which is the same conclusion as Risk 1, arrived at from the other direction.
Regulatory Landscape
Regulatory Landscape
Four regulatory regimes now determine the economics of cement, and only one of them is about demand. Two set the cost of carbon, one decides how much capacity is allowed to exist, and one decides what may be sold as cement.
Carbon Border Adjustment Mechanism
CBAM entered its definitive regime on 1 January 2026. Importers of more than a single mass-based threshold of 50 tonnes of covered goods must hold authorised declarant status, buy certificates from the competent authority in their member state, and surrender them against declared embedded emissions; certificates are priced off EU ETS auction values as a quarterly average in 2026 and a weekly average from 2027, and a deduction is available only where a carbon price was already paid in production (European Commission, CBAM definitive regime). Cement is one of six sectors in scope. The mechanism was established by Regulation (EU) 2023/956 and simplified and strengthened by Regulation (EU) 2025/2083 ahead of the definitive period (EUR-Lex).
The structural point is that CBAM is designed to replace free allocation exactly as free allocation is withdrawn. The two instruments move in opposite directions by construction, so the effective carbon cost of a European tonne and an imported tonne converges upward together. That is why the price path in this forecast is steeper in Europe than the volume path justifies, and why merchant clinker — the one product that crosses borders as a commodity — is the row whose price is set by a border mechanism rather than a domestic market.
China: capacity by decree and an output-linked carbon benchmark
The building-materials industry growth plan for 2025–2026, issued by the Ministry of Industry and Information Technology with five other ministries, bans new clinker capacity outright, requires a capacity-replacement scheme for any new or modified project, and obliges producers to file replacement plans by the end of 2025 for tonnage that exceeds their project registration (MIIT et al., Building Materials Industry Growth Work Plan 2025–2026). The same document starts the cement industry’s entry into the national emissions trading system, allocating allowances on a carbon-intensity basis with quota volume linked to output, and requires half of clinker capacity in the key air-pollution regions to complete ultra-low emission retrofits by the end of 2025.
The output-linked design is the most consequential regulatory choice in the global cement market. An intensity benchmark tied to output rewards the efficient producer and penalises the marginal one through a mechanism the state sets directly, rather than through a price signal it must wait for. It is also why the utilisation figure in this report is presented as a ceiling: a regime that requires unregistered capacity to be regularised is a regime conceding that the register is incomplete.
Europe: standards as an instrument
European cement specification EN 197-1 and its later parts determine what may be called cement and how much clinker each class may contain. That makes the standard a decarbonisation instrument with no fiscal cost — the portland-limestone precedent in the United States shows what happens when a standard permits a lower clinker factor: 63 per cent blended shipments and 95 per cent of those limestone-based, achieved on cost. Every jurisdiction that amends its standard equivalently gets a step change in clinker factor for free, and every jurisdiction that does not is relying on a carbon price instead.
National standards and the qualification barrier
In India, and across South Asia and much of Africa, cement is specified against national standards for composition and strength, and a producer’s product must be approved against those specifications plant by plant. This is a compliance pathway rather than a compliance cost, and it is one of the genuine barriers to entry in a market where the assets themselves are not hard to build.
What regulation does not fix
No instrument in this landscape addresses the thing that decides the industry’s returns. Carbon rules raise the cost of the marginal tonne and reward the efficient producer; capacity rules decide how much capacity exists, but only in the one jurisdiction willing to administer output directly. Nothing in Europe, North America or India addresses structural overcapacity, and in a market with 3,800 Mt of capacity against 3,800 Mt of output, that remains the price-setting fact.