
Global Agricultural Biologicals (Biopesticides & Biostimulants) Market Report, Size, Share and Forecast 2026–2033
1. Market Snapshot
| Market value, 2025 | USD 13.45 billion |
|---|---|
| Market value, 2033 | USD 27.50 billion |
| CAGR, 2026–2033 | 9.35% |
| Volume, 2025 | 1,085 thousand tonnes of formulated product |
| Volume, 2033 | 1,760 thousand tonnes |
| Volume CAGR | 6.23% |
| Value per tonne | USD 12,396 → 15,625 (2.93% a year) |
| Growth decomposition | 68% volume, 32% price and mix |
| Largest category | Biopesticides, 63.9% of value |
| Fastest category | Biopesticides, 10.2% CAGR |
| Largest region | North America, 29.5% |
| Fastest region | Latin America, 11.3% |
| Defining characteristic | The only input category in agriculture where adoption growth persistently outruns revenue growth |
Agricultural biologicals is the fastest-growing input category in agriculture and the least well measured. Published estimates for 2025 cluster between roughly USD 12 billion and USD 15 billion with growth rates of 12–15% a year. This report lands inside that size band and well below that growth rate, and the distance between the two positions is the entire argument: those estimates extrapolate hectares treated, and hectares treated is not what this market is paid for.
2. Market Definition and the Three Boundary Calls
Three definitional decisions create almost all of the spread in published figures, so they are stated here rather than buried in a footnote.
First: what the category contains. This report measures three product families together — biopesticides (microbial, biochemical and semiochemical crop protection), biostimulants (substances and microorganisms that improve nutrient use, stress tolerance or quality independently of nutrient content), and biofertilisers and inoculants (living inputs whose primary function is nutrient supply, principally nitrogen fixation and phosphate solubilisation). They are measured together because they are sold through the same distributors, to the same buyer, increasingly in the same tank, and often by the same company. Splitting them produces three numbers no purchasing manager recognises.
Second: what it excludes. Beneficial macro-organisms — predatory mites, parasitoid wasps, entomopathogenic nematodes sold as live organisms — are excluded. They are a genuine and growing category, but they are a cold-chain logistics business with no fermentation economics and a revenue-per-hectare profile that cannot be compared with a formulated spray. Including them would add revenue and destroy the comparability of the volume series.
Third: where it is measured. Ex-factory, consistent with the USD 72.40 billion crop protection market established in this segment's global report. At the farm gate this market is larger by the distributor margin, which in Brazil and India is substantial.
One boundary that matters more than the other three combined: this report overlaps two others and must not be added to them. Biopesticides at USD 8.60 billion sit inside the USD 72.40 billion crop protection total, not beside it — Corteva's own reporting makes the point, with biologicals of USD 519 million disclosed within crop protection sales of USD 7,503 million. The remaining USD 4.85 billion of biostimulants and inoculants sits adjacent to the fertiliser market, whose USD 172.38 billion is measured in nutrient tonnes and excludes them, and to seed treatment, which is sized separately. Anyone summing this report, the crop protection report and the fertiliser report will triple-count. The three are a partition of an input bill, not three independent markets.
3. Market Size and Forecast
3.1 How the base year was built
No licensed study underpins the 2025 figure. It is triangulated from three directions and the convergence band is disclosed.
Route one, category build. Each of the three families was sized bottom-up from disclosed company revenue, registered product counts and treated-area data, yielding USD 8.60 billion of biopesticides, USD 4.10 billion of biostimulants and USD 0.75 billion of biofertilisers and inoculants.
Route two, the Brazilian anchor. Brazil is the only market where the biological sector is measured as a market rather than estimated as a category. CropLife Brasil's CropData series puts bioinsumo sales at R$ 6.2 billion in 2025, up 15%, across 194 million hectares of treated area, up 28%. At 5.60 to the dollar that is USD 1.11 billion of biocontrol and inoculants in one country — about 11.9% of the USD 9.35 billion global pool for those two families, a share modestly above Brazil's weight in the global crop protection market and consistent with its higher biological adoption intensity.
Route three, the disclosure cross-check. Corteva is the only one of the four largest input companies that discloses a biologicals line: USD 519 million, 6.9% of its crop protection sales. Syngenta reports biologicals growth but not the base. Bayer does not break it out. That asymmetry is itself evidence — a category growing at double digits and disclosed by one of four majors is a category whose reported size is a floor.
The three routes converge on USD 12.6–14.2 billion. The midpoint, USD 13.45 billion, is taken.
3.2 The annual path
| Year | Value (USD m) | Volume (kt) | Value per tonne (USD) |
|---|---|---|---|
| 2025 | 13,450 | 1,085 | 12,396 |
| 2026 | 14,708 | 1,153 | 12,757 |
| 2027 | 16,083 | 1,224 | 13,139 |
| 2028 | 17,586 | 1,301 | 13,517 |
| 2029 | 19,231 | 1,382 | 13,915 |
| 2030 | 21,029 | 1,468 | 14,325 |
| 2031 | 22,995 | 1,559 | 14,750 |
| 2032 | 25,145 | 1,657 | 15,177 |
| 2033 | 27,500 | 1,760 | 15,625 |
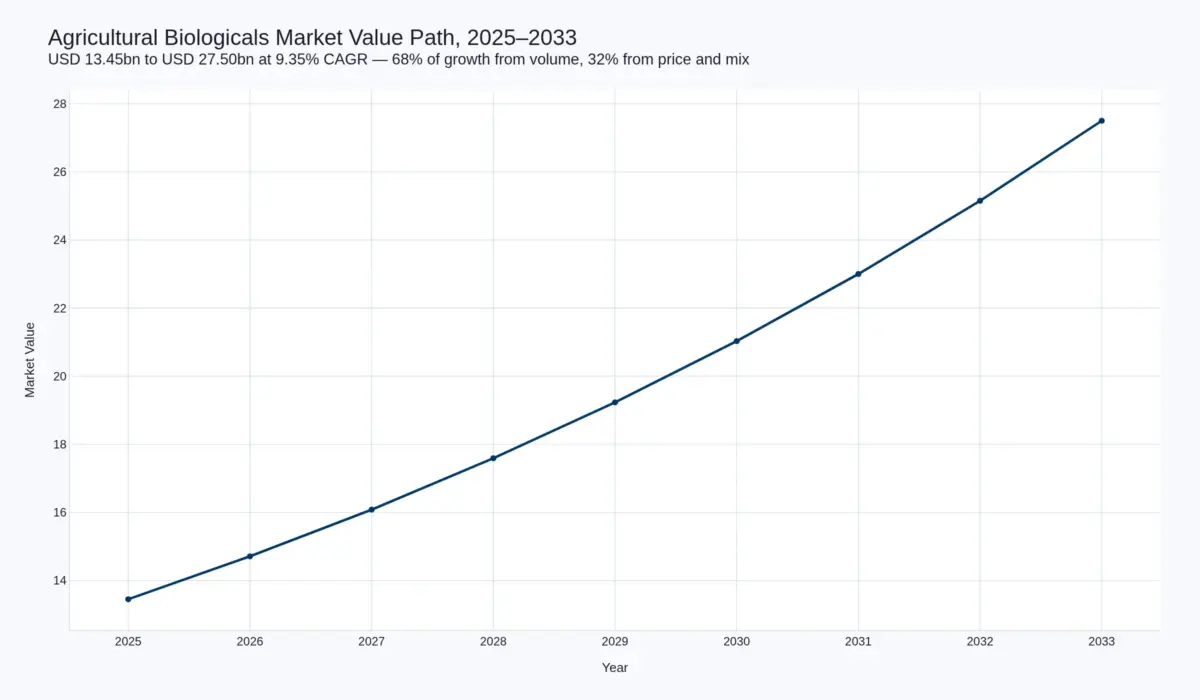
The path is smooth by construction and should be read as a trajectory, not a year-by-year call. The one place it is deliberately not smooth is 2026–2027, where Brazilian on-farm rules under Lei 15.070/2024 take effect and the substitution effect described in §4.2 begins to bite on the lowest-value part of the inoculant pool.
3.3 The decomposition is the finding
Value grows 9.35%. Volume grows 6.23%. Value per tonne grows 2.93%. So of the eight-year growth, roughly 68% is tonnage and 32% is price and mix.
Set that against the rest of this cluster and the inversion is stark. Corn seed is 24% volume and 76% price and technology. Crop protection is 46% volume and 54% price. Biologicals is the first input category examined here where volume does most of the work — because the products are cheap per unit, because the cheapest of them is getting cheaper, and because the constraint on this market is not whether a grower will buy a biological but whether the biological will perform consistently enough to be bought again at a price that supports a formulation business.
Anyone modelling this market at 13–15% is implicitly assuming that price and mix contribute two to three times what they contribute in the model above. There is a specific reason to doubt that, and it is measurable.
4. Three Structural Shifts Defining 2026–2033
4.1 The value did not follow the acre
Brazil publishes the only dataset in the world detailed enough to test the adoption narrative against the revenue it generates, and the two have separated.
In 2025, treated area with biological products reached 194 million hectares, up 28% on 2024 — the largest single-year expansion on record. Market value grew 15%. Adoption ran at nearly twice the rate of revenue. Over the 2022–2024 triennium growth had been a steadier 15% a year in both dimensions; 2025 broke the relationship.
Unpack it by segment and the mechanism is obvious:
| Segment | Value 2025 (R$ m) | Treated area (Mha) | Revenue per treated ha (R$) | Share of value | Share of area |
|---|---|---|---|---|---|
| Bioinsecticides | 2,170 | 46.6 | 46.6 | 35% | 24% |
| Bionematicides | 1,860 | 44.6 | 41.7 | 30% | 23% |
| Biofungicides | 1,364 | 25.2 | 54.1 | 22% | 13% |
| Inoculants | 806 | 77.6 | 10.4 | 13% | 40% |
| Total | 6,200 | 194.0 | 32.0 | 100% | 100% |
Inoculants are the most widely adopted biological product in the world's most advanced biological market: on 40% of treated area, present on 90% of Mato Grosso's soybean area, and earning R$ 10.4 per treated hectare. Biofungicides earn five times that, on a sixth of the area. The category that made biologicals normal is the category that generates almost no revenue.
That is not a failure. It is the arithmetic of nitrogen fixation — a soybean inoculant is applied at a couple of dollars a hectare and substitutes for a fraction of a nitrogen bill in a crop that does not need much nitrogen anyway. But it means the market's growth cannot come from doing more of what already worked. It has to come from the high-value segments, and those are the segments where performance has to be proven every season. This single table is why 9.35% is a defensible forecast and 14% is a story about hectares.
4.2 On-farm production acquired a legal identity
On 23 December 2024, Brazil sanctioned Lei nº 15.070, without a single veto. It regulates the classification, treatment and production of bioinsumos through on-farm biological management, and ratifies the National Bioinsumos Programme. What had been a grey zone of farm-built multiplication units — some of them very large, some of them technically illegal, all of them competing with a purchased inoculant — is now a regulated category with rules attached.
This is the most consequential regulatory event in this market in a decade, and it cuts both ways with unusual clarity.
For the market: legal certainty accelerates adoption. A grower who was unwilling to invest in on-farm multiplication without knowing whether the practice would survive an inspection now knows. Regulatory recognition also drags biologicals into the same conversation as conventional inputs, which is where volume comes from.
Against the market: the cheapest competitor to a purchased inoculant is now a statute. Every hectare of on-farm multiplication that replaces a purchased dose is a hectare that appears in the treated-area statistics and not in the revenue line. The effect should be concentrated exactly where margins are thinnest — commodity inoculants in Mato Grosso — which is why this report models inoculants at 4.2%, the slowest of the three families and less than half the market rate.
The signpost to watch is the implementing regulation: the scope of permitted on-farm production, the quality-control and traceability requirements, and whether state-level agricultural defence agencies treat farm units as producers or as unregistered manufacturers. A permissive regulation suppresses inoculant revenue faster than a restrictive one suppresses adoption.
4.3 The efficacy gap is now measured, and it is the commercial ceiling
For twenty years the industry's answer to "do biologicals work?" has been an anecdote trade. It no longer has to be.
A 2026 systematic review and multilevel meta-analysis of entomopathogenic fungi against Spodoptera species — 63 studies screened, 44 studies and 52 experimental arms pooled — reported a pooled benchmark of LC₅₀ 5.95 × 10⁶ conidia/mL, and, far more importantly, heterogeneity of I² = 96.8%, of which 73.9% sat between studies. The authors' own conclusion is the sentence this market should be built around: the prediction interval is wide enough that isolate-level performance cannot be inferred from the pooled mean.
And the sharpest number in the paper is not about efficacy at all. 97.4% of the underlying records derive from controlled bioassays. Almost everything known about these products comes from conditions no farmer operates in. The gap between isolate discovery and field deployment is not closing; it is simply now quantified.
Three commercial consequences follow, and they set the shape of the competitive landscape:
- Consistency, not discovery, is the constraint. There is no shortage of candidate strains. There is a shortage of products that deliver the same result across soil types, temperatures, water regimes and spray programmes.
- Value accrues to formulation, shelf-life and delivery — encapsulation, UV protection, tank-mix compatibility, viable-count stability at ambient temperature. These are manufacturing problems, which means capital expenditure, not R&D serendipity.
- Fermentation capacity becomes a strategic asset. Syngenta opened a 22,000 m² biologicals facility at Orangeburg, South Carolina in 2025, purpose-built for 16,000 tonnes of biostimulants a year, alongside existing sites in Brazil, Italy, India and Norway. That is what a company does when it believes the constraint is production, not the pipeline.
The corollary is uncomfortable for the specialist tier: a market where the bottleneck is manufacturing scale and field-level reproducibility is a market that consolidates toward companies that already own fermentation and distribution — which is precisely what §10 records.
5. Market Drivers
5.1 Resistance is now a purchasing reason, not an ethical one
The commercial case for biologicals has migrated from residue and sustainability to resistance management. Fall armyworm (Spodoptera frugiperda) resistance to synthetic insecticides is the single most cited agronomic problem in Brazilian and Indian row-crop systems, and it is the explicit rationale in industry adoption data: CropLife Brasil attributes the 2025 surge in treated area in part to the need to combat resistant pests through integrated programmes mixing chemical and biological inputs. Resistance is the best thing that ever happened to this category, because it converts a discretionary purchase into a protocol requirement.
5.2 Residue limits and export specifications
For any grower selling into the EU, Japan or a private-label programme, the relevant number is not the pest mortality curve but the maximum residue limit and the number of days between final application and harvest. Biologicals carry pre-harvest intervals measured in hours. On high-value export crops — horticulture, vines, coffee, citrus — that is worth more than efficacy. This is why Europe holds 24.5% of global biologicals value on a far smaller share of the world's farmland, and why the biostimulant category developed there first.
5.3 Integration, not replacement
The most important shift in how these products are sold is that they are no longer positioned as substitutes. They are components in a programme — a biological applied at planting for nematodes, a chemistry at flowering, a biofungicide in rotation to keep a mode of action viable. Programmes expand total input spend where replacements cannibalise it. They also raise the technical bar, because a product that cannot survive a tank-mix with the programme's chemistry cannot participate at all, which is a formulation constraint and a quiet barrier to entry.
5.4 Regulatory identity is now a product attribute
Regulation (EU) 2019/1009 gave biostimulants a legal category in Europe, with functional product categories PFC 6(A) and 6(B) for microbial and non-microbial biostimulants and a harmonised efficacy standard (CEN 17700). A CE-marked biostimulant is a defined article of commerce in a way it was not in 2021, and registration is a route to label claims rather than a negotiation with 27 separate authorities. Suppliers now advertise their approval counts — one French manufacturer lists 24 CE-marked products split across categories — which is what happens when a regulatory pathway becomes a selling point.
5.5 The cost and time of registering chemistry
The relative economics of bringing a new active ingredient to market continue to move in biologicals' favour: a microbial or plant-extract active is generally cheaper and faster to register than a novel synthetic, and it faces a materially lower probability of litigation-driven withdrawal. The US route is illustrative rather than merely theoretical — the EPA's biopesticide active ingredient register added, among others, Beauveria bassiana strain BW149, Pseudomonas oryzihabitans strain SYM23945 and two Pepino mosaic virus strains in 2025, and Priestia megaterium strain SYM36613 in 2026. A pipeline with names in it is a pipeline.
5.6 Nematodes, and the one segment with no chemical answer
Plant-parasitic nematodes are the clearest example of a problem where the chemical toolkit has thinned faster than any other. Bionematicides in Brazil grew 16 million hectares, roughly 60%, in a single season, to 44.6 million treated hectares. That is not a sustainability story. It is the fastest-growing pest-control segment in the market because the alternatives have been withdrawn or restricted, and it is the single strongest driver in the forecast for the 2027–2030 period.
6. Market Restraints
6.1 Variance is the product
A biological that performs at 80% in one field and 40% in the next is worse than a chemical that performs at 65% in both, because the grower cannot plan around it. The measured heterogeneity described in §4.3 is not an academic curiosity — it is the reason adoption in any given market plateaus at a level well below what agronomic need would suggest. The adoption ceiling in most crops is set by the share of acres where the grower has seen the product work reliably, not by the size of the addressable market.
6.2 Shelf-life and the cold chain
Living products have viable-count decay curves, temperature sensitivities and compatibility limits that chemistry does not. That constrains distribution to outlets that can move inventory fast enough, penalises long supply chains, and explains why the specialist biological companies built their positions region-by-region rather than globally. It is also why the majors' advantage is distribution depth rather than molecule ownership.
6.3 Price deflation at the bottom of the market
The most-adopted products are the cheapest and getting cheaper. Where on-farm production is legal and where fermentation technology has diffused, a commodity inoculant converges toward the cost of the inputs and the labour. That is the mechanism behind the R$ 10.4 per treated hectare in §4.1 and behind the 32% price-and-mix share of this report's growth. Restraint and driver are the same phenomenon viewed from opposite ends: the segment that proves biologicals work is the segment that cannot be monetised.
7. Segmentation
7.1 By product family
| Family | 2025 (USD m) | 2033 (USD m) | CAGR | 2025 share |
|---|---|---|---|---|
| Biopesticides | 8,600 | 18,700 | 10.2% | 63.9% |
| Biostimulants | 4,100 | 7,760 | 8.3% | 30.5% |
| Biofertilisers & inoculants | 750 | 1,040 | 4.2% | 5.6% |
| Total | 13,450 | 27,500 | 9.35% | 100% |
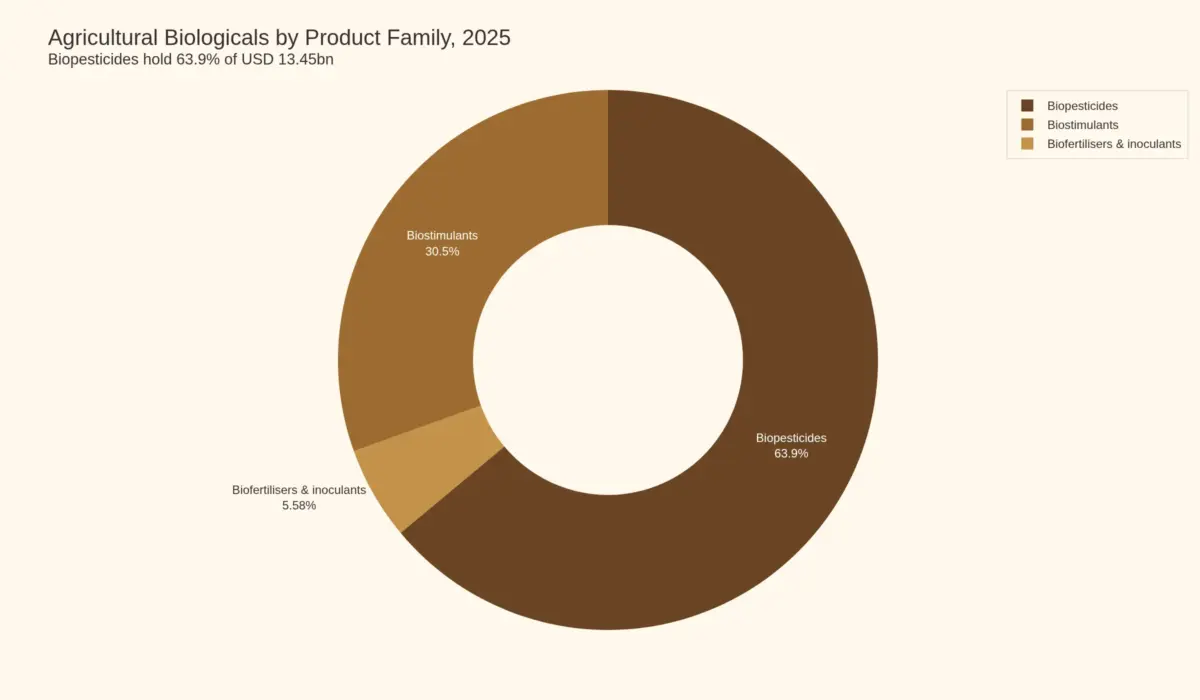
One reconciliation with an adjacent Pheonix page. The global crop protection report for this segment models biologicals as its fastest-growing product class at 10.68%. This report models the biopesticide pool at 10.2%. The half-point gap is deliberate rather than an error, and it comes from the constraint each model applies. There, biologicals are a share shift inside a class total that the chemistry forecast fixes; here they are a standalone pool with their own volume series, their own price-deflation assumption and a forecast that has to survive the Brazilian revenue-per-hectare data in §4.1. Where the two differ, this is the more conservative number and the reason is documentary rather than methodological preference.
Biopesticides do nearly two-thirds of the value and take the highest growth, because they are sold to solve a problem the grower already has. Biostimulants grow more slowly on a larger installed base in Europe and North America and a far weaker willingness to pay in row crops. Inoculants grow slowest for the reasons set out in §4.1–4.2.
7.2 By organism and active type
Bacterial products dominate volume, led by Bacillus species — B. thuringiensis for lepidopteran control, B. subtilis and B. amyloliquefaciens for disease suppression and plant-growth promotion. Fungal products are the fastest-growing group and the most technically difficult: Beauveria bassiana and Metarhizium species for insect control, Trichoderma for soilborne disease. Biochemicals — plant extracts, humic and fulvic substances, seaweed extracts, amino acids — carry the biostimulant category and are the least defensible technically, since many are commodity extracts with weak mode-of-action claims. Semiochemicals remain small, specialised and concentrated in mating disruption in high-value horticulture.
7.3 By crop
Soybeans are the largest single crop by treated area globally, a direct consequence of inoculant penetration in Brazil and Argentina. Corn, cotton and sugarcane follow. Horticulture, vines and permanent crops generate the highest revenue per hectare and are the beachhead for biocontrol in Europe and North America. Cereals and rice remain structurally difficult: low value per hectare, price-sensitive growers, and a chemistry toolkit that is still cheap and effective.
7.4 By formulation
Liquid formulations dominate and are gaining share, for reasons that are commercial rather than agronomic: liquids are easier to tank-mix, easier to co-pack with micronutrients, and easier to sell as part of a programme. Dry formulations — wettable powders, granules, seed coatings — hold the longer shelf-life positions and the seed-treatment channel, where stability requirements are strictest.
7.5 By channel
Distribution is where the economic structure of this market is visible. Agricultural distributors and cooperatives carry the majority of volume, particularly in Brazil where the cooperative system reaches growers that no direct salesforce could. Direct-to-grower models dominate high-value horticulture and the turf and ornamental segment. On-farm production, now regulated in Brazil, is not a channel so much as a substitute for one, and it is the only part of this market that grows without generating revenue for anyone in the supply chain.
8. Regional Analysis
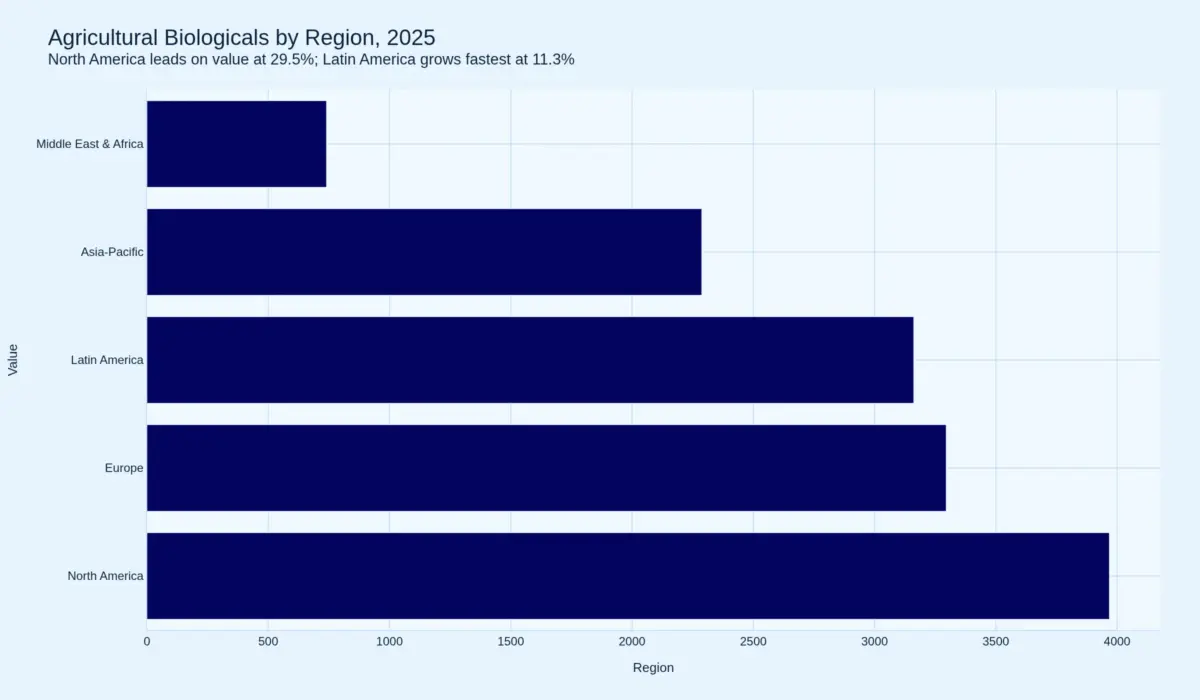
| Region | 2025 (USD m) | Share | CAGR |
|---|---|---|---|
| North America | 3,968 | 29.5% | 8.6% |
| Europe | 3,295 | 24.5% | 8.7% |
| Latin America | 3,161 | 23.5% | 11.3% |
| Asia-Pacific | 2,287 | 17.0% | 9.4% |
| Middle East & Africa | 740 | 5.5% | 7.6% |
The regional distribution is revenue-weighted, not area-weighted, and the distinction is the point. North America leads on value without leading on adoption intensity; Latin America leads on adoption without leading on value per acre. Europe's position is a regulatory artefact as much as an agronomic one.
8.1 North America — the highest-value, most concentrated market
North America leads on revenue because it leads on price per acre, not on adoption intensity. Biological use is concentrated in high-value horticulture, potatoes, grapes and turf, with row-crop penetration materially below Brazil's. The region's structural feature is channel power: a small number of distributors and retailers control access to the grower, which favours companies that can support a portfolio rather than a product. Regulatory clarity at federal level, through the EPA's biopesticide route, is the region's other advantage.
8.2 Europe — the regulatory template, and a stalled acreage base
Europe invented the category's legal identity. Regulation (EU) 2019/1009 created the biostimulant as a defined product, and the continent holds the highest share of global biostimulant value. It is also the region where the organic story is weakest as a growth driver: global organic farmland was 98.9 million hectares in 2024, 2.1% of world farmland, and fell 0.2%, while organic retail sales reached EUR 145 billion. Europe's biologicals market grows on residue limits and retailer specifications in conventional horticulture, not on organic conversion.
8.3 Latin America — the proof case, and the price problem
Latin America is where biologicals became a mainstream input rather than a niche one, and Brazil is the reason. The numbers are in §4.1: 194 million hectares of treated area, a 15% value increase, and a five-fold revenue-per-hectare spread between segments. Brazil's soybean area of 48.6 million hectares — established in this cluster's soybean seed report — means the 194 million treated hectares represent roughly two applications across a sown area near 90 million hectares. Note the units: treated hectares count applications, not physical land, and the two are not comparable with organic farmland statistics in §8.2.
The region's growth rate is the highest in the forecast at 11.3%, and it is also the region with the most revenue risk, because its largest volume segment is its least monetised and its cheapest competitor is now written into law.
8.4 Asia-Pacific — volume without value, for now
Asia-Pacific holds 17.0% of value on the largest share of the world's farmland. India is the pivotal market and the most difficult to forecast: enormous area, price-sensitive growers, a government-subsidised input structure that has historically favoured chemistry, and a domestic manufacturing base capable of driving biological prices down faster than demand rises. China is the mirror image — a large and rapidly professionalising biologicals industry with strong export capacity. Both point the same way: this region will add volume faster than revenue.
8.5 Middle East & Africa — smallest, and slowest for a structural reason
At 5.5% of value and 7.6% growth, the region is constrained less by demand than by cold-chain infrastructure, which matters disproportionately for living products, and by the absence of the distributor depth that biologicals require to reach smallholders. Where high-value export horticulture exists — Kenya, Morocco, South Africa — adoption looks European. Elsewhere it does not.
9. Competitive Landscape
| Company | FY2025 disclosure | Biologicals position |
|---|---|---|
| Syngenta Group | Crop protection USD 13.7bn, +4% | Biologicals double-digit growth; Orangeburg 16,000 t/yr biostimulant capacity; Intrinsyx Bio acquired December 2024; ISABION +23% in China; manufacturing in Brazil, Italy, India, Norway |
| Bayer Crop Science | Sales EUR 21,622m, −2.9% reported, +1.1% fx & portfolio adjusted; EBITDA before special items EUR 4,188m at 19.4% margin | No biologicals line disclosed; biologicals sit inside Crop Protection and Seed Growth portfolios |
| Corteva Agriscience | Crop protection USD 7,503m, +2%; volume +5% on new products and biologicals | Biologicals USD 519m, 6.9% of crop protection sales — the only disclosed line among the four majors |
| Novonesis | Not disclosed at biologicals-segment level | The largest biological ingredient supplier by fermentation capacity; no entity mapping in this report (see methodology) |
| Specialist tier | Largely private | Koppert, Biobest, Lallemand, Andermatt and the Brazilian inoculant producers; consolidation targets rather than consolidators |
The structure of this market is unlike any other in the agriculture cluster, and the difference is that the incumbents are not the incumbents. In seeds and crop protection, a handful of companies hold the traits, the patents and the registrations, and the competitive question is share. Here, the four largest input companies are all sub-scale relative to their own crop protection businesses: Corteva's biologicals are 6.9% of its crop protection sales, Syngenta's are growing double digits from an undisclosed base, and Bayer does not disclose a line at all.
Meanwhile the category's actual technical capability sits with companies most readers have never heard of — fermentation houses, strain collections and regional specialists — which is why the acquisition record in §10 reads the way it does.
The competitive advantage that is emerging is not a molecule. It is the combination of fermentation capacity, formulation capability, registration breadth and distribution depth, in that order of scarcity. Syngenta's build-out is the clearest statement of that thesis: it acquired a nutrient-use-efficiency platform (Intrinsyx), secured a strain library (the Novartis natural products collection), and then built 16,000 tonnes of annual biostimulant capacity. Only one of those three moves is science.
10. Regulatory Landscape
Three regimes set the pace, and they are summarised here with the detail in the regulatory chapter.
Europe defines the product through Regulation (EU) 2019/1009, with functional product categories PFC 6(A) and 6(B) for microbial and non-microbial biostimulants and harmonised efficacy standards under CEN 17700. Registration is via notified bodies and CE marking. This is the clearest pathway in the world and the reason Europe holds a quarter of global value.
The United States routes biopesticides through a dedicated, faster and cheaper FIFRA pathway. The EPA's register of biopesticide active ingredients shows steady throughput: five additions in 2025 and further additions in 2026, spanning microbials, plant-incorporated protectants and semiochemicals.
Brazil has moved further than either. Lei nº 15.070 of 23 December 2024 regulates bioinsumo classification, treatment and on-farm production, ratifying the National Bioinsumos Programme. It is the only major jurisdiction to have legislated directly for the farm-level producer, and the implementing rules will determine whether that legislation expands the market or shrinks its revenue.
11. Strategic Outlook
Three things have to be true for this market to compound at 9.35% rather than stall in the mid-single digits.
One: the high-value segments have to carry the growth. Biocontrol must do the work that inoculants cannot. The 2025 Brazilian data show it starting — biofungicides grew 41% in value, bionematicides 60% in area — and the forecast depends on that continuing for eight years.
Two: consistency has to improve at field scale. The meta-analytic evidence says the constraint is between-study and between-field variance, not the absence of effective isolates. Formulation, encapsulation, shelf-life and application technology are where the next increment of value sits, and they are capital problems that favour scale.
Three: on-farm production has to expand total usage rather than substitute for purchases. Lei 15.070 creates the legal basis for either outcome. A regime that treats farm units as producers expands adoption and compresses revenue; a regime that treats them as manufacturers with quality obligations pushes growers back toward registered product. Nobody knows which Brazil will implement, and the difference across eight years is worth several percentage points on this forecast.
The strategic consequence for anyone allocating capital: this is not a category where a small company with a good strain wins. It is a category where the winners will own fermentation, formulation and the last mile, and where the technology is increasingly licensed into those assets rather than built alongside them.
12. Watch List
- Brazil's Lei 15.070 implementing regulation — scope of permitted on-farm production and the quality obligations attached. The largest single variable in the inoculant forecast.
- The 2026 Brazilian bioinsumo data — whether treated-area growth decelerates toward value growth (healthy) or the two separate further (the substitution effect).
- Biofungicide value growth — 41% in 2025 off a small base; the first segment to test whether high-value biocontrol can scale in row crops.
- EU microbial approval throughput — the pace at which new microbial active substances clear the 2019/1009 and plant protection routes together.
- Fermentation capacity announcements — new plants are the leading indicator of expected volume, arriving 18–24 months before the revenue.
- Consolidation in the specialist tier — HGS BioScience's acquisition of NutriAg (October 2025) and Synsus's acquisition of Emerald Bioagriculture (March 2026) are the template; the private specialists are the remaining targets.
- Spodoptera resistance trajectory — the demand driver for the largest biopesticide segment in the Americas.
- Strain-provenance standards — any move toward mandatory strain-level characterisation would raise barriers, advantage incumbents and improve the reproducibility that currently caps adoption.
13. Methodology
Volume is formulated product tonnage, not active ingredient. Biological actives are not additive across microbial, biochemical and plant-extract categories, so an active-ingredient series would be a technical artefact rather than a transacted quantity. Value is ex-factory, consistent with the crop protection report for this segment. The base year is a disclosed triangulation of a category build, the Brazilian primary market anchor and a company-disclosure cross-check, converging on USD 12.6–14.2 billion with the midpoint taken. Published third-party estimates were used only as an internal sanity check and are neither cited nor referenced anywhere in this report. The forecast is a stated position rather than a consensus: it sits below the published band because treated hectares and revenue have measurably separated, and the separation is documented in §4.1.
14. About This Report
This is the twelfth report in the Agriculture & Agritech programme and the third in Crop Protection & Pest Control. It is designed to be read alongside the global crop protection market report, whose USD 72.40 billion total contains this report's biopesticide value, and the global fertiliser (NPK) report, which sizes the nutrient market these products partly substitute for. It should not be added to either.
Further reading: the evidence behind this forecast's most contested number — 194 million hectares of treated area, and why inoculants return R$ 10.4 per treated hectare while biofungicides return R$ 54.1 — is set out in Inoculants Reach 40 Per Cent of Brazil's Treated Area and Return R$10.4 a Hectare.
More in this series: On-Farm Multiplication Now Has a Statute, and It Competes With the Product It Copies — the Lei nº 15.070 mechanics, and the three questions in secondary legislation, behind this report's 4.2 per cent inoculant rate.
Competitive Landscape
This market has no leader. That is not a statement about competition being weak; it is a statement about the category’s age. Biologicals are the only input category in agriculture where no company holds a double-digit share, and where the four largest agrochemical companies in the world are all sub-scale relative to their own core businesses.
The majors: present, committed, and largely undisclosed
Corteva is the only one of the four that discloses a biologicals line: USD 519 million inside crop protection sales of USD 7,503 million, or 6.9%. The company’s FY2025 release is explicit that volume growth of 5% in crop protection was driven by demand for new products, herbicides and biologicals — which tells you the direction of travel without giving you the size. Corteva has assembled its position through acquisition rather than discovery, and its biologicals now sit inside a crop protection business that grew 2% with a 2% price decline driven by Latin American competition.
Syngenta is the most explicit about intent. Its FY2025 results describe biologicals achieving double-digit sales growth across the full year, on rising demand for biocontrols, biostimulants and nutrient-efficiency products. The build-out is unusually complete: the Intrinsyx Bio acquisition in December 2024 for nutrient-use efficiency, the integration of the Novartis strains and natural products collection in early 2025, and the Orangeburg plant at 16,000 tonnes of annual biostimulant capacity, sitting alongside manufacturing in Brazil, Italy, India and Norway. ISABION grew 23% in China in 2025. Syngenta also states that multiple pipeline candidates carry projected annual sales above USD 100 million each — a number that, for context, would be a fifth of Corteva’s entire disclosed biologicals business per product.
Bayer Crop Science discloses nothing at biologicals level. Its FY2025 Crop Science sales were EUR 21,622 million, down 2.9% reported but up 1.1% currency- and portfolio-adjusted, with volume up 1.2% and price down 0.1%, and EBITDA before special items of EUR 4,188 million at a 19.4% margin held flat year on year. Biologicals sit inside the division’s portfolio without their own line. In a category where disclosure is itself a strategic choice, Bayer’s silence is a positioning statement: biologicals are a component, not a business.
Novonesis occupies a different position entirely. It is not a crop protection company; it is a fermentation company, and fermentation is the capacity constraint identified in the value chain chapter. Its agricultural biologicals business supplies both competing brands and its own products, which makes it simultaneously a supplier to the majors and a potential competitor. This report profiles Novonesis without an entity mapping for a specific reason set out in the methodology: Wikidata carries two competing items for the company.
The specialist tier: capability without a channel
The technical capability in this market is disproportionately held by companies outside the top four. Koppert and Biobest built modern biocontrol in Europe from beneficial insects and mites outward; Lallemand and Andermatt hold strain and formulation positions; a tier of Italian and Spanish biostimulant formulators built the European market before the majors arrived; and in Brazil, Vittia, Biotrop, Simbiose and Microquimica built the inoculant and bionematicide market that the majors are now buying into.
These companies share a structural problem. Their technical position is real, but they lack the three assets that matter at scale — fermentation capacity, registration breadth across jurisdictions, and channel depth in row crops. That combination is precisely what makes them acquisition targets rather than consolidators, and it is why the ownership of this market is changing faster than its technology is.
Consolidation, and the private-label layer underneath it
The acquisition record of the past eighteen months is unusually legible. In October 2025, Paine Schwartz-backed HGS BioScience acquired NutriAg, combining humic and fulvic manufacturing with a bionutritional portfolio and Canadian market access. In March 2026, private-label specialist Synsus acquired Emerald Bioagriculture, explicitly to add biostimulant technology to a custom-formulation and manufacturing platform. Both deals follow the same logic: buy the technology, keep the plant, use the channel.
Underneath the branded market there is a fast-growing private-label and white-label layer, and it is the most under-appreciated competitive force in the category. Private-label platforms sell formulated biologicals to distributors and retail brands who put their own name on the bottle. That compresses brand premium at the bottom of the market, accelerates price convergence in commodity biostimulants and inoculants, and is a second mechanism — alongside on-farm production — by which adoption can rise while branded revenue does not.
What competition is actually about
Share in this market is not won by having the best organism. It is won by being able to deliver the same result across a million hectares, which requires fermentation scale for consistency, formulation for stability, registration for legality and channel for reach — in that order of scarcity. Companies with one of those four compete on price. Companies with all four compete on programme position, which is where margin lives.
The competitive question for 2026–2033 is therefore not who will lead the biologicals market. It is whether the majors can convert capacity and distribution into the field-level reliability that the specialist tier has never been able to deliver at scale, before the specialist tier is bought by someone who can. On current evidence the majors are buying rather than building the technology, and building rather than buying the capacity — which is a rational division of labour and a clear signal about where each side believes the barrier sits.
One disclosure to watch: the first major to report a biologicals line with margin will settle the argument about whether this category is a growth business or a low-return adjunct. On the crop protection evidence in this cluster — where all three of the largest players held or improved margin through the worst pricing environment in a decade — the operating capability is there. What is not yet demonstrated is that biologicals earn their cost of capital at scale.
Value Chain
The value chain in agricultural biologicals is five stages long, and the stage that creates the product is not the stage that captures the value. Understanding which stage is scarce at any moment explains almost every commercial decision made in this market, including the acquisition record covered in the investment chapter.
Stage one: discovery and screening
The cheapest stage, and the one most often mistaken for the barrier. Candidate organisms are abundant: culture collections, academic libraries, bioprospecting programmes and, increasingly, acquired corporate collections such as the Novartis strains and natural products repository that Syngenta integrated in early 2025. Screening has also become cheaper—automated phenotyping and genomic selection have compressed the cost of identifying a promising isolate to a fraction of what it was a decade ago. The consequence is that discovery is no longer defensible. Anyone with a laboratory can find an organism that kills a pest in a Petri dish, and the meta-analytic evidence discussed in the technology chapter suggests that is precisely the problem: the field is well supplied with isolates that work in controlled conditions.
Stage two: fermentation and upstream manufacturing
This is where the capital sits, and it is the stage most analysts underweight. A biological is a manufactured living product, which means batch consistency, viable-count stability and contamination control are the whole business. Fermentation is a fixed-cost operation: cost per unit falls sharply with utilisation, which means the owners of large-scale capacity can price below specialists and still earn a margin. It also means capacity additions are lumpy, visible and slow — eighteen to twenty-four months from announcement to output.
Syngenta’s Orangeburg facility, opened in 2025 at 22,000 square metres and purpose-built for 16,000 tonnes of biostimulants a year, is the clearest recent statement of where the company believes scarcity lies. It sits alongside existing biologicals plants in Brazil, Italy, India and Norway, a network that exists because shipping a living product across an ocean is a shelf-life problem before it is a freight problem. Regional fermentation is not redundancy; it is a technical requirement.
Stage three: formulation and packaging
The stage where value is actually created for the grower, and where this market’s technical ceiling is being attacked. Formulation determines shelf life, UV tolerance, tank-mix compatibility, rainfastness and the viable-count profile at the point of use. An unformulated spore suspension and a formulated, encapsulated, stabilised product may contain the identical organism and behave completely differently in a spray tank at 38 degrees Celsius. The margin difference between them is the reward for solving the consistency problem documented in the technology chapter.
Formulation intensity also explains why the three product families have such different revenue per hectare. A soybean inoculant is a low-formulation, high-volume, low-price article: fermentation and logistics, with little chemistry added. A biofungicide is a high-formulation, low-volume, high-price article: stabilisers, adjuvants, co-pack compatibility and a label that has to survive a regulatory review. Brazil’s 2025 data make the spread explicit at R$ 10.4 per treated hectare for inoculants against R$ 54.1 for biofungicides.
Stage four: registration and label
Expensive per product, cheap per unit of revenue at scale, and therefore a moat that widens with portfolio breadth rather than depth. Every jurisdiction requires its own dossier, and the requirements are not mutually recognised: a European biostimulant registration, a US biopesticide registration and a Brazilian bioinsumo registration are three separate efforts. A company with forty registered products across ten countries has a cost advantage no single-product specialist can match, because the fixed cost of a regulatory affairs department is spread across the portfolio.
Registration breadth is also the quiet reason the majors win in biologicals despite having weaker pipelines. They already own the regulatory machinery.
Stage five: channel
Agricultural distributors and cooperatives carry the majority of volume, and in Brazil the cooperative system reaches growers no direct salesforce could serve economically. Direct-to-grower models dominate high-value horticulture and turf. The channel matters more in biologicals than in chemistry because the product requires agronomic support: application timing, tank-mix advice and expectation management when a biological performs differently from a chemical. A distributor that cannot explain variance will not repeat-sell a biological, whatever its label says.
Where the value accrues, and the one stage that can disappear
The pattern across the chain is that value accrues to whichever stage is scarcest, and scarcity moves. Today it sits in fermentation capacity and registration breadth, which is why specialists with good strains sell to companies with plants and dossiers, and why the majors are building capacity before they need it.
The structural threat to the whole chain is that one stage can be performed by the customer. Under Brazil’s Lei nº 15.070 of 23 December 2024, on-farm biological production through on-farm biological management is a regulated activity rather than an informal one. A grower who multiplies inoculant on site internalises stages two, three and four and buys only at stage one, sometimes at stage zero — a starter culture and a tank. Every hectare that moves this way is a hectare in the treated-area statistics and not in the revenue line, which is the mechanism behind this report’s 4.2% inoculant forecast and behind the 15% value growth recorded against 28% area growth in 2025.
The chain is therefore bifurcating. Low-formulation, high-volume products are migrating toward on-farm production and commodity fermentation. High-formulation, high-registration products are consolidating into companies that can afford plants and dossiers. The middle of the chain — regional formulators with neither fermentation nor multi-country registration — is the least defensible position in this market, and the acquisition record suggests the market has already noticed.
Investment Activity
Capital is flowing into this market faster than revenue is, and the gap between the two is the most useful thing an investor can know about it. The investment record of the past two years divides into four distinct activities, each with a different logic.
One: the majors building capacity rather than buying growth
The largest single capital commitment in the category is manufacturing. Syngenta’s Orangeburg facility — 22,000 square metres, purpose-built for 16,000 tonnes of biostimulants a year, opened in 2025 — is a statement that the constraint is production, not pipeline. It joins existing biologicals plants in Brazil, Italy, India and Norway, a network that exists because living products cannot travel far without losing viability.
This is the most consequential form of investment in the market and the least discussed, because it does not appear in deal databases. A fermentation plant is a bet on volume eighteen to twenty-four months before that volume exists, and it is the clearest available signal of what the majors expect demand to do.
Two: capability acquisitions by the majors
The pattern here is consistent and instructive. Syngenta acquired Intrinsyx Bio in December 2024 for nutrient-use efficiency — buying a technology position in the segment with the largest addressable spend rather than in biocontrol, where it was already building. In early 2025 it completed integration of the Novartis strains and natural products collection, acquiring a library rather than a product.
Both moves buy things that take years to build and cannot be bought as a single asset later: characterised strain diversity and a nutrient-efficiency platform. Neither is a revenue acquisition. That is a rational strategy in a category where the technology is abundant and the barriers are elsewhere.
Three: private capital consolidating the specialist tier
This is where most of the transaction count sits, and where the strategic logic is clearest.
In October 2025, Paine Schwartz-backed HGS BioScience acquired NutriAg, a Toronto-based bionutritional business, combining humic and fulvic manufacturing with a Canadian channel and an R&D platform. The stated rationale was scale: ‘one of the most complete biostimulant and bionutritional platforms in North America’. In March 2026, private-label manufacturer Synsus acquired Emerald Bioagriculture, adding biostimulant technology to a custom-formulation and manufacturing platform serving agricultural, turf and consumer brands.
Both deals are the same trade executed from opposite ends: one buys technology and keeps the channel, the other buys technology and keeps the plant. Neither is buying a brand at a premium. In a market where the technical capability sits with small companies and the barriers sit with large ones, the rational move is to acquire the small company and supply the barrier yourself.
The implication for the remaining specialist tier — Koppert, Biobest, Lallemand, Andermatt, the Brazilian inoculant producers — is that they are the inventory of this process, not its participants. The scarce assets being acquired are characterised strain libraries, registration dossiers in multiple jurisdictions, and regional channel relationships. None of those is easy to build and all of them are easy to buy.
Four: growth capital into private label and contract manufacturing
The least visible but most structurally important flow. Private-label platforms and contract formulators are attracting capital because they serve the part of the market that is growing fastest in volume: distributors and retail brands who want a biological in their catalogue without owning a fermentation plant or a registration dossier. Synsus describes itself explicitly as an end-to-end custom-formulation business for brands and retailers.
This is the mechanism by which adoption rises without branded revenue rising. It compresses price at the bottom of the market, and it is a second force — alongside Brazilian on-farm production — pushing the market’s value mix toward the high-formulation, high-registration end.
What the capital is not doing, and why that matters
Almost none of the visible investment is going into the thing the technology chapter identifies as the binding constraint: field-scale validation and the reproducibility work that would raise the share of acres on which growers commit to a biological as a planned input. That work is expensive, slow, unglamorous and hard to protect. It is also the only investment that would justify a 13–15% growth rate rather than the 9.35% modelled here.
Capital is funding capacity, capability and consolidation. It is not systematically funding proof. Until that changes, the market’s adoption curve will keep running ahead of its revenue curve, which is precisely what the 2025 Brazilian data show.
Technology & Innovation
The technology story in agricultural biologicals is not a story about discovering better organisms. It is a story about making known organisms behave reliably, and the difference between those two framings explains almost every commercial outcome in this market.
The efficacy gap is now a measured quantity
For two decades the industry answered the question ‘do biologicals work?’ with testimonials. It no longer has to. A 2026 systematic review and multilevel meta-analysis of entomopathogenic fungi against Spodoptera species pooled 44 studies across 52 experimental arms from a screened set of 63, using median lethal concentration as the outcome. The pooled benchmark was LC₅₀ 5.95 × 10⁶ conidia per millilitre.
The pooled mean is not the finding. The finding is the heterogeneity: I² = 96.8%, of which 73.9% sat between studies and only 22.9% within them. The authors’ conclusion is unusually direct for a meta-analysis — the prediction interval is wide enough that isolate-level performance cannot be inferred from the pooled mean. Meta-regression explained 34.0% of the variance, with host species and application route as the primary moderators, and found Beauveria and Metarhizium statistically comparable.
And the number that should reframe the whole category: 97.4% of the underlying records derive from controlled bioassays. Nearly everything the industry knows about its own products comes from conditions no farmer operates in. This is not a gap in the literature that more research will close quickly; it is a structural feature of a field that has invested in discovery and under-invested in field validation.
Three consequences follow directly. Consistency rather than potency is the binding constraint. Between-field variance rather than mean efficacy determines repeat purchase. And the technical value of a product sits in formulation and delivery, not in the identity of the organism.
Formulation is the actual innovation frontier
If the organism is a commodity and consistency is scarce, then the science that matters is the science of keeping an organism alive, effective and compatible. That means encapsulation and microencapsulation for UV protection and controlled release; osmoprotectants and stabilisers for viable-count retention at ambient temperature; dry formulation for shelf-life in tropical distribution; and co-pack compatibility with the chemistry the grower is already applying.
Tank-mix compatibility deserves separate emphasis because it is a hard commercial gate rather than a technical nicety. A biological that cannot survive contact with the programme’s fungicide cannot be sold into that programme, whatever its laboratory performance. As biologicals shift from replacement positioning to integration positioning, compatibility has moved from a formulation detail to a market access requirement.
Shelf life similarly sets geography. A product with a six-month ambient stability is a product that can be distributed nationally; a product with a two-week refrigerated window is a product sold within a day’s drive of its plant. This is why the biologicals industry globalised through manufacturing footprints rather than through exports, and why Syngenta’s network now spans Brazil, Italy, India, Norway and the United States rather than concentrating production.
Fermentation: the capital-intensive half of the technology
Upstream manufacturing is where biology meets chemical engineering, and it is under-discussed relative to its importance. Batch consistency, contamination control, scale-up from bench to thousand-litre vessels and viable-count stability through downstream processing are all engineering problems with capital solutions. Cost per unit falls steeply with utilisation, which means the technology curve in this market runs through plant economics rather than through laboratory discovery.
That is why capacity announcements are the most reliable leading indicator of expected volume: a new plant arrives eighteen to twenty-four months before the revenue it implies. Syngenta’s Orangeburg facility, at 22,000 square metres and 16,000 tonnes of annual biostimulant capacity, is the clearest current example, and the fact that it was built purpose-specific rather than acquired signals a company building for volume rather than for portfolio.
What is genuinely new in the pipeline
Three technology streams sit adjacent to the current product set and matter to the forecast, in descending order of near-term relevance.
Nutrient-use efficiency as a trait, not an input. The Intrinsyx acquisition and the broader interest in biological nitrogen fixation and phosphorus solubilisation point at a different value proposition: reducing the fertiliser bill rather than replacing a pesticide. This is the highest-value opportunity in the category because the addressable spend is an order of magnitude larger, and it is also the hardest to prove, because the evidence has to be agronomic and season-long rather than pest-mortality based.
RNA interference and peptide-based control. Both offer specificity and a regulatory pathway that is closer to biologicals than to chemistry. Neither is yet a material share of revenue, and both carry a cost-of-goods problem at current scale. They matter to the forecast mainly as a competitive threat to biologicals rather than as a component of them.
Strain characterisation and screening throughput. Genomic and phenotypic screening has collapsed the cost of finding candidates, which is why discovery is no longer the barrier. The interesting second-order effect is that characterisation enables provenance claims: a company able to state strain-level identity with genomic verification can defend a premium in a market where two products labelled with the same species may contain materially different strains.
How the technology curve actually moves
The plausible path to a higher growth rate is not a breakthrough organism. It is the accumulation of formulation and field-validation work that narrows between-field variance, which raises the share of acres on which a grower will commit to a biological as a planned input rather than a trial. That is an engineering and agronomy programme, it is expensive, and it favours companies with scale.
The plausible path to a lower growth rate is the opposite: continued under-investment in field-scale validation, a category reputation damaged by products that do not perform, and price convergence at the bottom as on-farm production and private label expand. Both paths are consistent with the same science. Which one obtains is a commercial and regulatory question, not a biological one.
Market Risk
Eight risks with dates or signposts attached, ordered by the size of the forecast they can move rather than by the probability of them occurring.
1. Brazil’s implementing regulation under Lei 15.070 (2026)
The law was sanctioned on 23 December 2024 without a veto and establishes on-farm biological production as a regulated activity. The implementing rules decide whether that expands usage or substitutes for purchases. A permissive regime — low obligations, treatment of farm units as producers — accelerates substitution in commodity inoculants and could take one to two percentage points off the market CAGR. A regime imposing traceability and quality obligations pushes growers back toward registered product and supports price. Signpost: the text of the implementing regulation and the first state-level enforcement actions.
2. The value-adoption gap widening rather than closing
2025 recorded 28% growth in treated area against 15% growth in value. If that relationship persists rather than normalising, the market compounds at volume rates rather than value rates and the eight-year number falls toward 6–7%. Signpost: the 2026 CropData release; specifically whether treated-area growth decelerates toward value growth or the two separate further.
3. A category-damaging efficacy failure
This market has no equivalent of the chemistry withdrawal that resets a category’s reputation, and it has one scenario that would do it: a widely used product failing at scale in a major market, in a season, in a crop, with visible economic loss. Given that 97.4% of the efficacy evidence base derives from controlled conditions, the exposure is structural rather than hypothetical. Signpost: any regulator-initiated product withdrawal or label restriction in a major biologicals category.
4. Price deflation at the bottom outrunning mix improvement at the top
Two forces push price down — on-farm production where legal, and private-label supply everywhere — and one force pushes it up: high-formulation products in high-value crops. The forecast assumes the second roughly offsets the first, delivering 2.93% value-per-tonne growth. If private label expands faster than high-value biocontrol, price and mix could turn negative, and the value CAGR would fall toward the volume CAGR. Signpost: private-label share of distributor biologicals catalogues.
5. Chemistry’s recovery removing the demand driver
The most under-appreciated risk in this report. A material share of biologicals demand exists because specific chemical tools failed — resistance in Spodoptera, nematode control losing active ingredients, herbicide and fungicide withdrawals. A new mode of action that restores cheap, reliable chemical control in a major segment would not destroy the biologicals market, but it would remove the urgency that converts a discretionary purchase into a protocol requirement. Signpost: registration of a novel insecticide or nematicide class with no cross-resistance to current actives.
6. Fermentation overcapacity
Announced capacity — Orangeburg alone is 16,000 tonnes of biostimulants a year — plus expansions by fermentation incumbents and Chinese producers, could outrun demand in commodity categories. Fermentation is a fixed-cost business, and the response to under-utilisation is volume pricing. The 2021–22 pesticide capacity overhang, which this cluster’s crop protection report documents as the cause of a decade of unit-value deflation, is the direct precedent. Signpost: capacity utilisation commentary from fermentation suppliers; commodity biostimulant price indices.
7. Regulatory divergence slowing international expansion
Europe’s 2019/1009 and 1107/2009 dual route, the absence of mutual recognition, and country-by-country dossiers all raise the fixed cost of market entry. Divergence favours incumbents with existing dossiers but slows category growth by making small markets uneconomic to enter. The specific risk is a European reform that either harmonises the dual route — accelerating growth — or extends data requirements to microbials in a way that reduces the number of approved products. Signpost: the European Commission’s review of the fertilising products framework.
8. Quality failure in under-enforced markets
In markets where viable-count and contamination standards are weakly enforced, mislabelled or contaminated product reaches growers at lower prices and discredits the category. This is a slow-burn risk with fast consequences: it suppresses willingness to pay in exactly the geographies — India, parts of Africa and Southeast Asia — where volume growth is supposed to come from. Signpost: national testing programmes and product recalls in emerging markets.
What would raise the forecast
For symmetry, three developments would move this forecast up rather than down: mandatory strain-level characterisation, which would improve reproducibility and support premium pricing; a proven nutrient-efficiency product at row-crop scale, which would open an addressable spend several times larger than biocontrol; and a restrictive Brazilian implementing regulation that keeps on-farm production narrow. None is in the base case, and the first and third are genuinely plausible within the forecast window.
Regulatory Landscape
Three regimes set the pace for this market, and they are not converging. Europe defines the product, the United States defines the speed, and Brazil has just defined the producer. The interaction between the three determines where a product can be sold, at what price, and by whom.
Europe: the product becomes a legal category
Regulation (EU) 2019/1009, applicable from 16 July 2022, did something no other jurisdiction has done: it created the biostimulant as a defined article of commerce. Functional product category PFC 6 is split into 6(A), microbial plant biostimulants, and 6(B), non-microbial plant biostimulants, with component material categories governing what may be used to make them. Conformity is demonstrated through a notified body, efficacy through the CEN 17700 series of standards, and the result is CE marking and free circulation within the single market.
The practical effect is that a European supplier can now advertise an approval portfolio. One French manufacturer reports twenty-four CE-marked products split across PFC 6 and PFC 1 categories, covering market gardening, arboriculture, viticulture and field crops — a catalogue that did not exist as a regulatory concept five years ago. That is what a functioning pathway looks like: it converts regulatory affairs from a cost centre into a marketing asset.
The unresolved problem in Europe is the dual route. A microbial product that suppresses disease is a plant protection product under Regulation (EC) 1107/2009; the same organism sold to improve nutrient use is a biostimulant under 2019/1009. The two regimes have different data requirements, different timelines and different approvers, and a product that legitimately does both must satisfy both. This is the single largest regulatory inefficiency in the market, and it is why the strongest biocontrol claims in Europe are often made in jurisdictions outside it.
United States: the fast lane, and the contrast that matters
Biopesticides are routed through a dedicated FIFRA pathway that is materially faster and cheaper than the conventional chemical route, with a lower data package and a dedicated review unit. The EPA’s register of biopesticide active ingredients shows continuous throughput rather than episodic approvals: among the 2025 additions were Beauveria bassiana strain BW149, Pseudomonas oryzihabitans strain SYM23945, two Pepino mosaic virus strains and a Wolbachia strain deployed in mosquito vectors; 2026 added Priestia megaterium strain SYM36613. Plant-incorporated protectants are tracked on a separate register.
The contrast that matters for this market is not the speed of approval but the asymmetry of withdrawal. In the same period in which the biological register added products, the US chemistry register lost a major herbicide label to vacatur, with existing-stocks orders and knock-on effects into seed demand in soybean and cotton. A grower watching a chemistry protocol disappear mid-season learns something about concentration risk that no marketing programme can teach. Regulatory stability is a driver of biological adoption, and it is measured in withdrawals avoided rather than approvals granted.
Brazil: the producer gets a legal identity
Lei nº 15.070, sanctioned on 23 December 2024 and published the following day, is the most consequential piece of biologicals legislation in the world, and it was passed without a single veto. It regulates the classification, treatment and production of bioinsumos through on-farm biological management, and it ratifies the National Bioinsumos Programme.
What it changes is not the product but the producer. On-farm multiplication — a practice that had grown large, partially informal and entirely unaddressed by a regime designed for industrial manufacturers — now has a legal category, a definition and, once the implementing regulation lands, obligations. For a grower who was unwilling to invest in a multiplication unit without knowing whether the practice would survive an inspection, that is a direct stimulus to adoption. For a supplier of commodity inoculants, it is a direct stimulus to substitution.
The implementing regulation is the open question and the largest single variable in this report’s forecast. Three details will decide the outcome: the scope of what may be produced on farm, the quality-control and traceability obligations attached, and whether state-level agricultural defence agencies treat farm units as producers or as unregistered manufacturers. A permissive regulation expands usage and compresses revenue. A regime that imposes registration-grade obligations pushes growers back toward purchased product and supports price.
The rest of the world, briefly
India registers biologicals through the central insecticides legislation, with a lighter data package than chemistry, but its subsidised input structure has historically favoured conventional products and continues to distort adoption. China has built a large and increasingly professional biologicals manufacturing base with strong export capacity, and its registration regime is a genuine gate for imported product. Across most smaller markets the constraint is not regulation but enforcement capacity, which means product quality — viable count, contamination, label accuracy — varies enough to damage the category’s reputation in exactly the markets where adoption is most needed.
Two cross-cutting issues
Residues and export access. Biologicals are largely outside the maximum residue limit framework that governs chemistry, because most are exempt or have no defined MRL. For a grower selling into the European Union, Japan or a private-label programme, that is a direct commercial advantage measured in pre-harvest intervals of hours rather than weeks. It is the strongest single reason biologicals took hold in European horticulture first.
Strain provenance. Almost no jurisdiction requires strain-level characterisation at the point of sale. Two products labelled with the same species may contain different strains with materially different efficacy, and the grower has no way to tell. The meta-analytic finding that isolate-level performance cannot be inferred from a pooled mean is a scientific statement with a regulatory consequence: mandatory strain characterisation would raise barriers to entry, advantage companies with characterised libraries, and materially improve the reproducibility that currently caps adoption. It is the most likely regulatory change to shift competitive position in this market, and it is not on any current legislative agenda.