
Peru Crop Protection Market Report, Size, Share and Forecast 2026–2033
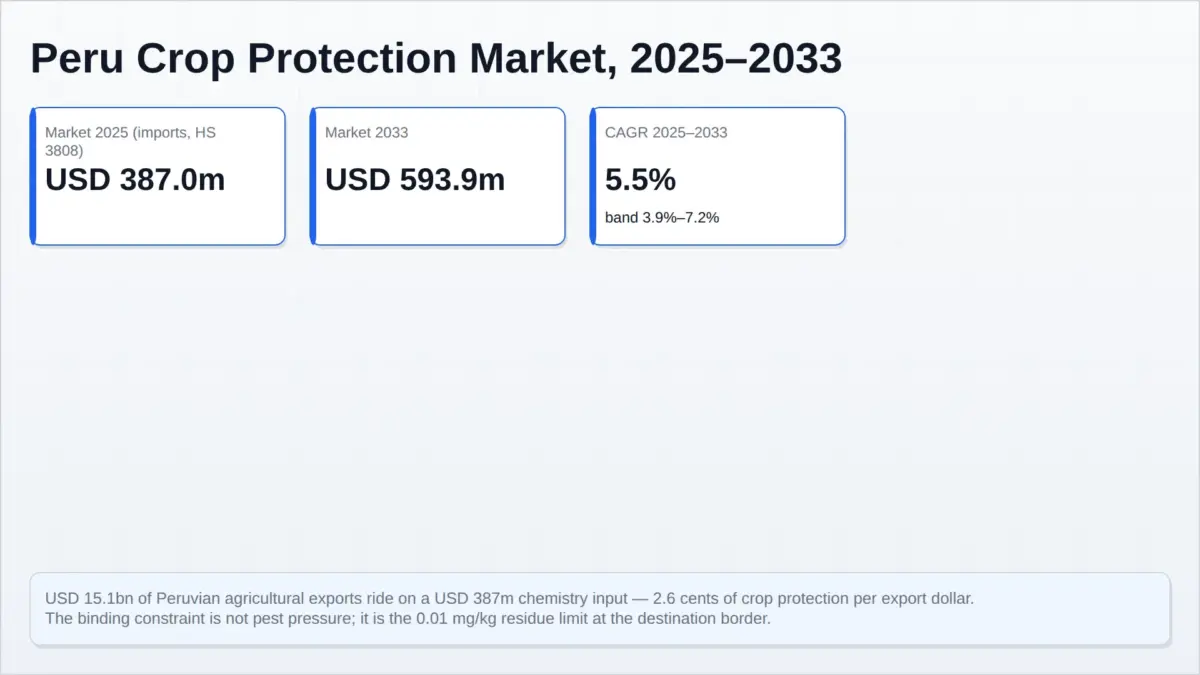
Peru exported an estimated USD 15,103.4 million of agricultural produce in 2025. The chemistry that made those exports sellable is a USD 387.0 million import market. Everything in this report sits in the gap between those two numbers.
The minister of agrarian development told Expoalimentaria in September 2026 that Peruvian agricultural exports would "border USD 15,000 million" by the close of the year, carried by fruit and vegetables shipped to more than 130 markets. That figure is the reason this report exists. Every dollar of it is defended at a border, and the instrument of defence is a spray programme.
The chemistry itself is small. Peru imported USD 387.0 million of pesticides in 2025 under HS 3808. Set that against the export base and the ratio is stark: 2.56 cents of crop protection per dollar of agricultural export. A market of under four hundred million dollars is the condition of access for fifteen billion. No other Peruvian input category carries that leverage — not seed, not irrigation, not packaging.
That asymmetry is the thesis of this report. The Peruvian crop-protection market is not sized by Peruvian pest pressure. It is sized by what the destination market will accept, and the number that decides acceptance is a residue limit — most often 0.01 mg/kg, the default applied where no substance-specific level exists. The RASFF-derived record for Peru shows 141 EU food notifications in 2020–2025, of which 65.2 per cent concerned fruits and vegetables, with pesticide residues the most-cited hazard class. In 2025 alone there were 38 fruit-and-vegetable border rejections, against 17 in 2024 — a rise of 123.5 per cent.
What this report measures, and what it does not
Peru manufactures almost no active ingredient. It imports technical material and formulated product, packs or formulates part of it locally, and distributes it through a technical channel to growers who sell into export campaigns. The customs record is therefore the most complete and most verifiable measure of supply available, and it is what we use: HS 3808, cost-insurance-freight value, calendar year.
Three boundaries follow from that choice, and a reader should hold all three.
First, HS 3808 is wider than agriculture. The heading includes disinfectants, rodenticides and public-health insecticides. The agricultural share is the large majority but not the whole, so USD 387.0 million overstates field chemistry by an amount the customs record cannot isolate. The top-product ranking we use later is restricted to SENASA-registered products with pre-harvest application, which is the cleanest available proxy for the agricultural core.
Second, import value is not grower spend. Between the CIF value and the price a grower pays sit formulation, freight, distributor margin and the cost of credit. We do not have a verified channel-margin figure for Peru, so this report stays on an import-parity basis throughout. Anyone comparing these numbers with a grower-level survey should expect this figure to be the lower of the two.
Third, volume is derived, not observed. Peru does not publish a pesticide import weight series in the sources we could verify. We derive tonnage at an assumed USD 9.7 per kilogram landed average — an assumption, disclosed here so it can be replaced. It is the softest number in the report and it moves the volume series, not the value series.
Market size and forecast
| Indicator | 2025 | 2033 | CAGR |
|---|---|---|---|
| Market value (USD million, import parity) | 387.0 | 593.9 | 5.5% |
| Volume (kilo tons, derived) | 39.9 | 56.7 | 4.5% |
| Implied landed unit value (USD per kg) | 9.70 | 10.47 | — |
The 2033 figure is USD 593.9 million. It is a point estimate and it should never be quoted alone, because the level of this market is unusually volatile against its trend. The published band runs from USD 525.6 million at 3.9 per cent to USD 675.1 million at 7.2 per cent. One percentage point of CAGR is worth USD 46.6 million of 2033 revenue — which is more than the ten largest imported products in the country are worth today, combined.
Why the level of this market is not its trend
The 2024-to-2025 move looks explosive: imports rose from USD 319 million to USD 387.0 million, up 21.3 per cent. It is not growth. Over January to August 2025 the industry association Cultivida recorded agrochemical imports at USD 195.8 million against USD 217.33 million a year earlier, down 9.9 per cent — with volume flat to higher, and the decline attributed by the association's own chair to unit price rather than quantity. Two readings of the same year, one showing a fifth added and one showing a tenth removed, differ only in the window and the currency translation.
The consequence for forecasting is direct. A market whose year-on-year change can be plus 21 per cent or minus 10 per cent depending on the measurement window cannot carry a single-path forecast. We therefore build from the drivers — export-crop area and volume, product mix, and price per kilo — and publish the band. The base case of 5.5 per cent assumes export volume growth above the historical average, partly offset by continued price deflation in patent-expired chemistry and by mix substitution toward lower-application-rate products. The downside case assumes the deflation wins. The upside case assumes residue compliance forces a faster switch to newer, higher-value actives.
How the report is organised
Competitive landscape shows why a market this small has no blockbuster: the ten largest imported products are worth USD 36.2 million between them, 9.35 per cent of the total, and Syngenta holds five of the ten and 49.72 per cent of their combined value. Value chain follows the material from a Chinese technical plant to a grower's knapsack and sets out why the chemical calendar is a mirror of the export calendar. Technology and innovation separates the conventional track from the parallel biological registry. Regulatory landscape is the longest chapter and the most important one, because it holds both the national approval system and the destination residue limits that override it. Investment activity explains why the transferable asset here is an administrative file rather than a plant. Market risk sets out the six exposures, including the one this market does not pay for: a rejected consignment costs the exporter, not the supplier.
Sibling and related coverage: Peru Thermoformed Packaging Market, Global AI in Agriculture Market, Global Remote Sensing Technology for Agriculture Market, Global Black Soldier Fly Market, Global Surfactant Market and Global Mango Market.
Table of Contents
- Executive summary
- Market definition, method, and the three boundaries of the measurement
- Market size and forecast, 2025–2033
- Why the level of this market is not its trend
- Competitive landscape
- Value chain
- Technology and innovation
- Regulatory landscape
- Investment activity
- Market risk
- Frequently asked questions
Competitive Landscape
The ten products that are the market
In 2025 the ten largest crop-protection products imported into Peru were worth USD 36.2 million between them. That is 9.35 per cent of a USD 387.0 million market. There is no blockbuster here — no single molecule that carries the category, none whose patent expiry re-prices the industry. The market is a portfolio, and the portfolio is the unit of competition.
| Product | Class | Supplier | 2025 imports (USD m) |
|---|---|---|---|
| Incipio 200 SC | Insecticide | Syngenta | 5.4 |
| Loyant Neo EC | Herbicide | Corteva | 5.2 |
| Pantera | Fungicide | Aris | 3.9 |
| Selecron 500 EG | Insecticide | Syngenta | 3.6 |
| Absolute 60 SC | Insecticide | Corteva | 3.5 |
| Amistar Top | Fungicide | Syngenta | 3.5 |
| Movento | Insecticide | Bayer | 3.1 |
| Mertect 500 SC | Fungicide | Syngenta | 3.0 |
| Switch | Fungicide | Syngenta | 2.5 |
| Bazuka | Herbicide | TQC | 2.5 |
Syngenta holds five of the ten and USD 18.0 million of the USD 36.2 million — 49.72 per cent of the top-ten value. Corteva holds two. Bayer one. The remaining two belong to Aris and to TQC, a Peruvian formulator, and that last entry is the detail worth keeping: the only local name on the list competes in herbicides, the most price-deflated class in the world.
The ranking also records a change in the chemistry. The compiler notes that glyphosate’s presence has collapsed — three years ago several of the ten were glyphosate-based, and in 2025 there is one. Glyphosate is not banned in Peru, so this is not a regulatory story. It is the signature of a commodity molecule losing pricing power as Chinese technical supply expands and formulation capacity spreads: the same product, imported at a lower unit value, disappears from a value ranking even while it stays in the knapsack.
Why there is no blockbuster: the registration is the product
A crop-protection product does not become a Peruvian product by arriving at Callao. It becomes one when a registro is granted for a defined formulation, a defined active ingredient, a defined use and a defined label. Under the Reglamento del Sistema Nacional de Plaguicidas de Uso Agrícola (Decreto Supremo 001-2015-MINAGRI), each registro requires three separate dictámenes — agronomic, toxicological and ecotoxicological-environmental — from three different authorities, and the environmental assessment alone is quoted by the ministry at 60 to 80 business days. A portfolio of thirty products is therefore not thirty SKUs. It is thirty administrative files, each funded years before the first litre is invoiced.
That structure produces exactly the concentration pattern above and explains a puzzle in the numbers. Imports are highly concentrated by origin and only moderately concentrated among sellers, because the two concentrations are produced by different things. Origin concentration is a purchasing decision — buy the technical from the cheapest competent plant. Seller concentration is an administrative achievement — hold the registrations the buyer is allowed to sell.
The tail is real and should not be dismissed. Below the ten products above sit hundreds of registrations held by one- and two-product importers, regional formulators and grower-linked distributors. They do not set price. They do set the service level in the valleys the multinationals reach through third parties, and they are the channel through which a newly banned active ingredient can reappear under a different label. The enforcement chapter of this report takes that seriously.
Where the chemistry comes from
| Origin | 2025 imports (USD m) | Share |
|---|---|---|
| China | 160.0 | 41.3% |
| Colombia | 56.6 | 14.6% |
| United States | 38.8 | 10.0% |
| Mexico | 17.5 | 4.5% |
| Chile | 15.5 | 4.0% |
| Top five | 288.4 | 74.5% |
China at 41.3 per cent is the origin of technical material, and it is the reason price deflation in this market is structural rather than cyclical. A single origin supplying two-fifths of the volume is also the market’s largest physical exposure: any freight, tariff or logistics interruption on that lane reaches the grower in the same campaign it happens.
Colombia at 14.6 per cent is the more informative entry. Colombia has no upstream active-ingredient industry of scale, yet it is Peru’s second-largest origin and posted the largest absolute gain of any origin between 2024 and 2025 at USD 16.4 million. The trade pattern is consistent with a formulation-and-repack channel serving the Andean market rather than with Colombian chemistry. We state that as an inference from the pattern, not as a verified commercial fact, because no shipment-level data we can cite resolves it.
The United States at 10.0 per cent, Mexico at 4.5 per cent and Chile at 4.0 per cent complete a top five that covers 74.5 per cent of supply. The remaining quarter is spread across at least a dozen origins. Read together with the origin-2024 comparison — USD 319 million in 2024 rising to USD 387.0 million in 2025 — the concentration did not loosen as the market grew; the growth went to the incumbents.
What the structure means for competition
Six multinationals hold the technical registrations and the field-support infrastructure that make a product usable in an export programme: label rate, pre-harvest interval, residue behaviour, resistance management. We count them at six. Below them sit perhaps a hundred registered holders whose entire commercial proposition is a product the multinationals do not carry, or a price the multinationals will not match.
The competitive intensity is therefore high and the structure moderately consolidated — high because a fragmented tail competes hard for the same grower relationship, moderate because the top of the market is held by portfolios that cannot easily be replicated. Anyone entering this market should understand which of the two they are actually entering. Buying an import licence buys access to the tail. Buying a registration portfolio buys access to the market.
Value Chain
The chain, in six steps
Active ingredient is synthesised almost entirely outside Peru, principally in China. Technical material and finished formulated product arrive at Callao or Paita. The registro holder — normally a local subsidiary of the originator, occasionally a Peruvian formulator — takes title. Formulation and packing happen partly in Peru and partly, on the trade pattern, in Colombia. The technical distributor and the agro-vet shop carry the product into the valley. The grower applies it, the packing house cools and grades the fruit, and the container leaves for a market that will test it.
Two features of that chain determine the economics of everything above it.
First: the entity that owns the file is not the entity that makes the molecule
The public list of agricultural pesticides with a current registration is organised around the titular del registro, and the names on it are local: the Peruvian subsidiary of a multinational, a Peruvian formulator, a regional distributor. The registry entry that opens the published annex is a chlorpyrifos product registered in 1996 under a local subsidiary of a foreign originator — a file, not a factory.
This is the single most important structural fact about Peru’s crop-protection value chain. Value accrues where the administrative file sits, and the file sits with a commercial entity that may own no plant, employ no chemists and import everything it sells. The corollary is that the natural unit of consolidation is the portfolio of registrations, and the natural unit of entry is nothing at all — anyone can import technical material, and almost no one can sell it legally without a file.
The same file carries obligations that are invisible in a product brochure and heavy in a profit-and-loss account. Holders of agricultural pesticide registrations are required to run training and technical-assistance programmes, and to operate programmes for the final disposal of used containers and of expired product — approved annually by resolution. These are per-portfolio fixed costs. They make a thirty-registration portfolio cheaper per unit than a three-registration portfolio, which is one more reason the small end of the market stays small.
Second: this market runs on the export calendar, not the planting calendar
Demand for crop protection in Peru is not a function of how much land is planted. It is a function of which campaign is approaching harvest, because the last application before harvest is the one that decides whether the consignment clears the border. Peru’s export seasons are sequential rather than simultaneous — blueberries, then grapes, then avocados, with mangoes and asparagus overlapping — and the spray programme for each crop front-loads into the weeks before its window opens, bounded by the pre-harvest interval on the label.
The practical consequence is that a product’s annual volume in Peru is not a smooth line. It is a series of campaign pulses that follow the calendars of the destination markets, and a product whose pre-harvest interval is longer than the gap between a pest event and the harvest date is commercially dead in that crop regardless of how well it works. This is the point at which the value chain and the regulatory chapter meet: the pre-harvest interval is a supply-chain parameter before it is a legal one.
It also explains the shape of the ranking in the previous chapter. Insecticides take four of the top ten and fungicides four, while herbicides take two. A market organised around the appearance of an export commodity is a market organised around insects and post-infection disease, not around weed competition — and weed control, where it appears at all, is where the commodity pricing pressure is greatest.
How the channel is financed
Agrochemicals move to growers on credit, repaid at export settlement. The supplier is therefore lending against a dollar-denominated receivable whose value depends on a harvest that has not happened, a price that has not been fixed, and a border test that has not been run. In a market where the top product is a USD 5.4 million line, a single poor campaign in a single valley is a material event for that product’s distributor.
We could not verify a published channel-margin figure for Peru, and we do not invent one. What can be said is directional: the spread between the USD 387.0 million CIF value and grower-level spend funds freight, formulation, storage, technical advice, field days, credit and bad debt. In a market with a fragmented tail and high competitive intensity, that spread is contested from below and defended from above, and it is the reason the multinationals maintain direct technical teams rather than selling through whoever will take the volume.
The attached sales
Two categories ride on the same channel and matter to the economics without appearing in the HS 3808 headline.
Adjuvants and surfactants are sold with almost every application to manage drift, retention and rain-fastness. Peru’s surfactant supply is imported, and the adjuvant decision is often made by the distributor rather than the grower — a quiet lever on both efficacy and residue behaviour.
Packaging and container management sits at the end of the chain and is now a compliance obligation rather than an afterthought, with a documented disposal programme required of every registro holder. The Peru thermoformed packaging market is a sibling exposure: the same exporters who must prove a residue result must also prove a container result, and both are audited by the buyer.
Where the chain is weakest
The weakest link is the one between the grower and the shop. It is the point at which a legal product and an illegal one are physically indistinguishable, where the invoice can be informal, and where the technical recommendation is made by whoever is selling. Peru’s own enforcement numbers — more than 15,000 inspection operations since 2019 and hundreds of litres of prohibited product seized — are a measure of the size of that gap, and the residue notifications at the destination border are its downstream evidence.
Investment Activity
The only asset that matters here is a file
In most input markets the investable asset is a plant. In Peru’s crop-protection market it is a registration, and the difference explains almost every feature of the investment landscape.
A registration is cheap to hold and expensive to obtain. It does not depreciate with use, it does not need a maintenance capex programme, and it can serve the whole national market from a single administrative address. But it is personal to the holder named on it, its scope is fixed by a label rather than by a market, and its commercial value can be destroyed overnight by a re-evaluation that removes the molecule or by a destination market that tightens a limit. It is an asset with an unusually long useful life and an unusually abrupt failure mode.
That profile produces a market where the natural buyer is not a manufacturer but a portfolio holder, and where the natural seller is an ageing distributor with three files and no successor.
What capital is actually being spent on
Four categories, in descending order of what we can evidence:
Registrations and the technical work behind them. Three dictámenes, field trials, dossier preparation and the environmental assessment are the real fixed cost of this industry, and they are incurred years before revenue. A portfolio of thirty registrations is a multi-year capital programme disguised as a product list.
Biorational portfolios. The separate biological registry lowers the entry cost, and it is where new capital is most likely to appear, because a small formulator can hold a legal position without technical-synthesis capability. The risk is efficacy: a biorational that clears the residue gate and fails the agronomic gate costs the grower a crop, and the reputational damage lands on the category rather than the product.
Formulation, packing and logistics capability. Modest in absolute terms — this is not a capital-intensive industry in the way a refinery is — but it is where a distributor converts a trading margin into a manufacturing one, and where import-parity pricing can be beaten.
Working capital. The largest and least glamorous requirement. Product is bought in dollars, held in inventory, sold on credit against a harvest, and collected after the export settlement. In a market with campaign-seasonal demand, the working-capital cycle is the binding constraint on growth for every mid-sized distributor, and it is the reason consolidation happens in the balance sheet before it happens in the share register.
Why there is very little M&A
We set recent M&A activity at no, and the reasoning is structural rather than a claim that no deal has ever occurred. We found no disclosed transaction in the Peruvian crop-protection channel in the period covered by this report; what we can describe with confidence is why the transaction count should be low.
Consolidation in this market requires transferring registrations, and a registration is bound to a named holder with a documented technical file. A buyer is therefore not acquiring a factory it can run on Monday morning; it is acquiring a set of administrative positions whose value depends on continuity of the file, the label and the technical personnel who maintain them. That is slow, document-heavy work, and it is priced accordingly. Where the asset is a plant, capital moves quickly. Where the asset is a signature, it does not.
The absence of deal flow is not the absence of an investment case. It means the case has to be made on organic portfolio building, which is slower and more defensible — and which is why the incumbents’ positions have proved so durable against a decade of Chinese technical price deflation.
The growth case, and its ceiling
The bull argument for this market is not that Peruvian agriculture will expand. It is that 2.56 cents of input per export dollar is unusually low, and the mix can shift toward higher-value chemistry without a single additional hectare. Moving from a commodity organophosphate to a newer active can raise value per treated hectare several-fold while reducing total kilograms applied, because application rates are lower. Value grows; volume does not. That is precisely the shape of the forecast: 5.5 per cent in value against 4.5 per cent in volume, with the implied landed unit value rising from USD 9.70 to USD 10.47 per kilogram.
The ceiling on that case is the destination gate. A mix shift to newer chemistry only pays if the newer chemistry clears the residue limits of the markets Peru sells into — and where a substance has no established tolerance abroad, the default 0.01 mg/kg can make an otherwise excellent product unsellable on the export crops that matter. The investment thesis therefore reduces to a single sentence: buy portfolios whose products are already proven at the destination limit on blueberries, grapes, avocados and cocoa, and avoid portfolios that are only proven in Peru.
Any investor who inverts that sentence is buying regulatory risk with an eight-year fuse, because the file looks identical from the inside either way.
Technology & Innovation
Two gates, and only one of them is in Peru
Technological change in this market is not gated by discovery. It is gated twice, and the second gate is abroad.
Gate one is the Peruvian registration: three dictámenes, a defined label, a defined use. Gate two is the residue tolerance of the destination market, on the specific crop, at a level the product’s residue profile can actually meet. A molecule can clear gate one completely and still be commercially unsellable, because the destination has no substance-specific limit for it on that crop and the 0.01 mg/kg default applies. The notifications reviewed for this report are full of results measured against exactly that figure.
The consequence is counter-intuitive and it governs everything in this chapter. The chemistry that reaches Peru is not the newest chemistry; it is the chemistry with the widest existing tolerance coverage on the crops Peru exports. Innovation is selected by other people’s regulatory files before a Peruvian agronomist ever sees it.
The parallel track: biologicals have their own registry
The single most consequential piece of market architecture for innovation is administrative. SENASA maintains a separate listing of formulated biological products — a registry of biological products with PBUA registration numbers, distinct from the conventional pesticide annex — with its own product names, origins and holders. A Bacillus thuringiensis product sits in that list, not in the chemical one.
That matters more than any subsidy. A separate track means the cost and time of bringing a biorational to market is not the cost and time of bringing a conventional active, and it means a small formulator with no technical-synthesis capability can hold a legal position. It is the one place in this market where the barrier to entry is low, and the growth of the biorational share should be read as an artefact of that design as much as of grower demand.
It also creates the report’s most under-priced risk. A biological product with a clean residue profile solves the destination gate completely and the efficacy gate partially. Recommending it in place of a conventional active is agronomically defensible in some crops and reckless in others, and nothing in the registration system distinguishes between those cases — that judgement is left to the field adviser, who is often the seller.
Why precision agriculture in Peru is public-sector-led
The country does not lack the technology. It lacks the customer density for it. The monitoring layer that most Peruvian fruit growers actually rely on is a state network: SENASA has run a fruit-fly control programme since 1998 with 41,454 official traps deployed nationally, and a programme with the Inter-American Development Bank recorded low pest prevalence across 134,066 horticultural hectares and 803,601 small producers as direct or indirect beneficiaries.
That network is a substitute for private sensing, and a very effective one. Where a public agency tells you whether the fly is present in your valley, the marginal value of a private sensor array falls sharply. The commercial market for remote sensing and AI-assisted agronomy in Peru therefore concentrates on the export estate — the several hundred operations with the scale, the buyer audits and the capital to justify it — rather than diffusing across the smallholder base the ministry counts in the hundreds of thousands.
Where adoption happens, it is pulled by the buyer rather than pushed by the vendor. A packing house that must evidence a spray record to a European retailer will pay for traceability software. The same house will not pay for variable-rate application, because the chemical saving is small against the audit risk it removes. Traceability is the killer application in Peruvian crop protection; yield optimisation is not.
Where the real technical effort is going
Three areas, in order of commercial weight:
Formulation and adjuvancy. The cheapest way to change a residue or a rain-fastness profile without changing a registration is to change how the product is delivered. Co-formulants, stickers and drift-control agents are where a distributor can differentiate without a new file, and it is the part of the chain where Peruvian technical capability is genuinely present.
Resistance management. Rotation is the standard answer to resistance, and rotation requires more distinct modes of action in a portfolio — which means more registrations, more files and more fixed cost. Resistance management is, structurally, a force for consolidation.
Application timing against the pre-harvest interval. The most valuable innovation in this market is not a molecule; it is a decision-support system that tells a grower which product can legally be applied on which day of the campaign. Every residue notification reviewed for this report is, at bottom, a timing failure.
Maturity and intensity
We classify technology maturity as mature, innovation intensity as moderate and patent activity as high — the last of these being almost entirely offshore. Peru is a technology taker with a strong administrative filter. Its innovation system is the registry, its R&D is somebody else’s, and its competitive advantage in this category is phytosanitary credibility rather than chemistry. That is not a weakness to be lamented; it is the asset that turns USD 387.0 million of imported chemistry into USD 15.1 billion of accepted exports.
Market Risk
Six exposures, only one of which the market prices
| Risk | Level | Why it sits where it sits |
|---|---|---|
| Origin concentration | Moderate | China 41.3% of imports; top five origins 74.5% |
| Price deflation without volume loss | High | 2025 up 21.3% on 2024, yet Jan–Aug 2025 down 9.9% on the same months a year earlier |
| Withdrawal without substitution | High | 41 active ingredients removed since 2019; 964.27 L and 452.49 kg seized in enforcement |
| Border rejection | High | 38 fruit-and-vegetable rejections in 2025 against 17 in 2024, up 123.5% |
| Private buyer specification | High | Two 2026 organic cacao notifications came from the buyer’s own check, not a regulator |
| Heavy metals and climate | Moderate | Cadmium at 0.09 mg/kg against a 0.05 limit in avocado — not a chemistry problem |
1. China, at two-fifths of supply
Forty-one per cent of this market arrives on one trade lane. That is not a prediction of disruption; it is a statement of what a disruption would cost. A freight-rate shock, a tariff action, a port closure or a supplier-side export restriction would reach the grower within one campaign, because inventory cover in a market this thin is measured in weeks rather than seasons. The mitigating factor is that technical material is fungible across many Chinese producers, so the exposure is to logistics and policy rather than to a single supplier’s failure.
2. The price is the variable, not the volume
This market’s measurement problem is its underlying economics. Between 2024 and 2025 the import bill rose 21.3 per cent. Over January to August 2025, the industry association recorded a 9.9 per cent decline on the same months a year earlier, with volume flat to higher and the fall attributed to unit price. Both readings are correct; they describe price and restocking, not demand. That is why we publish a band from USD 525.6 million to USD 675.1 million rather than a single path to USD 593.9 million — and why one percentage point of CAGR is worth USD 46.6 million, more than the ten largest products in the country combined.
Deflation is structural rather than cyclical. With 41.3 per cent of supply originating in China and the largest single class of products being patent-expired chemistry, the default direction of landed price is down. Any forecast that assumes Peru’s crop-protection market grows in value at the rate its export agriculture grows in volume is assuming away the mechanism that has held prices down for a decade.
3. Withdrawal without a replacement is not a clean substitution
Peru has removed 41 active ingredients from legal commerce since 2019. The intended mechanism is that demand migrates to a registered alternative. The observed mechanism is more complicated. Enforcement operations have seized 964.27 litres and 452.49 kilograms of prohibited product, and selling it carries up to eight years’ imprisonment — a penalty level that tells you the state believes the market is large enough to require deterrence, not that it is marginal.
The commercial risk this creates is not that a competitor gains share. It is that a compliant portfolio pays for the compliance while an uncompliant one undercuts it on price, and the resulting residue shows up on the country’s border record rather than on the offending seller’s invoice. Reputation in this market is a shared asset, and it is being depreciated by operators who are not paying for it.
4. The asymmetry no one has closed
This is the report’s central risk finding. When a consignment is rejected, the exporter bears the loss: destroyed or diverted fruit, a lost buyer relationship, a notified entry against the country. The supplier of the product that caused it has already been paid, and nothing in the transaction structure returns that cost to the party who chose the chemistry.
The result is a market that internalises none of its own compliance risk. A distributor’s rational move is to sell the product that is cheapest to sell, not the one that clears a 0.01 mg/kg limit on a crop whose harvest is two weeks away — unless the buyer imposes that specification. The gap between 17 rejections in 2024 and 38 in 2025 is what that arrangement looks like when volume rises.
5. The buyer is now the regulator
Two of the 2026 notifications reviewed in this report — chlorpyrifos-methyl at 5.2 times the limit and chlorpyrifos at 3.1 times — originated in the customer’s own check on organic cacao powder, not in an official inspection. That is the most consequential regulatory development in this market and it has no statute behind it. A private specification, a shorter pre-harvest interval than the label requires, and a pre-shipment test now determine product eligibility more tightly than SENASA’s register does.
For suppliers this cuts both ways. A portfolio that can evidence destination-limit compliance on the export crops commands a premium that did not exist a decade ago. A portfolio that cannot is exposed to a decision taken in a European procurement office, with no appeal and no comment period.
6. What chemistry cannot fix
Cadmium in avocado at 1.8 times the limit is the honest boundary of this market. It is a soil, irrigation-water and rootstock issue, it shares the same border as a residue result, and no product in this report addresses it. The same is true of climatic variability: an El Niño year moves harvest dates, and a moved harvest date changes the interval between the last legal application and the packing line.
Both belong in the risk register because both are counted against the same national record that the crop-protection market depends on. The industry’s compliance capital is shared with problems it did not create, which is a further reason to treat the country-level rejection trend as a leading indicator of this market rather than as someone else’s problem.
What would falsify the forecast
The 5.5 per cent path fails in either direction, and the triggers are specific. Downside: a second consecutive year of unit-price deflation at the 2025 rate, or a destination market withdrawing acceptance for a major crop. Upside: a mandatory private specification on a high-volume crop — blueberries or grapes — that effectively forces substitution into higher-value actives. Either is observable from the trade record within one campaign, which is why the band is published rather than a single number.
Regulatory Landscape
The national frame: three opinions before a litre is sold
Agricultural pesticides in Peru are governed by the Reglamento del Sistema Nacional de Plaguicidas de Uso Agrícola, approved in 2015. Registration turns on three technical opinions that must be obtained by the applicant before SENASA will pronounce: an agronomic opinion from the agricultural health authority, a toxicological opinion from the health authority, and an ecotoxicological-environmental opinion from the environmental authority of the agrarian sector. The ministry publishes the environmental risk assessment as a standalone step expected to take 60 to 80 business days.
The register itself is then issued on a statutory clock: the regulation requires SENASA to issue its pronouncement on an application within thirty (30) business days. That is a review clock, not a development clock. The three opinions run in parallel, each on its own timeline, each paid for by the applicant, and each capable of killing the file. Any planning assumption that treats Peruvian registration as a thirty-day administrative step is wrong by an order of magnitude.
Withdrawal: 41 molecules removed, and the logic of removal
Since 2019 SENASA has prohibited the commercialisation of 41 active ingredients, acting on technical reports from the health and environment authorities that re-evaluated toxicological and ecotoxicological risk. The named molecules in the sequence are metamidofos, paraquat, forato, dicofol, carbofuran and chlorpyrifos — a list that reads as a history of the organophosphate and carbamate generation rather than as a set of isolated decisions.
The removal logic matters to the market. These are not products withdrawn for inefficacy. They are products withdrawn because a re-evaluation found a risk to human health, which means the pest problem they solved is still present, and the demand they served did not disappear with the registration. It either migrated to a registered alternative — the intended outcome — or it migrated to an unregistered one, which is the outcome the enforcement numbers describe.
There is a detail in the public register that captures the whole transition. The published annex of agricultural pesticides with a current registration opens with a chlorpyrifos product under registration number 009-96-AG-SENASA, held by the Peruvian subsidiary of a foreign originator. The oldest stratum of the registry is exactly the chemistry being withdrawn from it. Peru’s regulatory task for the next decade is not to add registrations. It is to retire the ones it already has without losing the crop.
Enforcement: what the state actually does
Post-registration control is real, and it is measurable. Between 2019 and the last published count, SENASA ran 15,327 inspection operations against pesticide commerce; it conducted 2,639 inspections in 2024 and more than 200 unannounced inspections in 2025, jointly with the tax authority, the public prosecutor and the national police. Those operations seized 964.27 litres and 452.49 kilograms of prohibited pesticides, concentrated in Cajamarca, Cusco, Huancavelica, Ica, Junín, La Libertad, Madre de Dios, Puno, Tumbes and Ucayali. Selling without a sanitary authorisation is a public-health offence carrying up to eight years’ imprisonment.
Read the seizure figures against the market and they are small: a tonne and a half of product against a 39.9 kilo-ton import base. That is not a criticism of the enforcement — it is a statement about what enforcement can measure. Inspections find what is on a shelf. They do not find what was already sprayed, and the border record is the only place where the sprayed product becomes visible.
The destination frame: a limit Peru does not set
Every consignment of Peruvian fruit or cocoa enters a jurisdiction with its own residue limits. Where a substance-specific limit does not exist, the default applies — and in the notifications reviewed for this report that default is consistently 0.01 mg/kg. This is the number that governs the commercial life of a Peruvian crop-protection product, and no Peruvian authority sets it.
The aggregate record is unflattering and worsening. Peru was the origin of 141 EU food notifications in 2020–2025, 0.55 per cent of 25,645 notifications and 34th of 160 origins. Fruits and vegetables account for 65.2 per cent of them, and pesticide residues are the single most-cited hazard class. Fruit-and-vegetable border rejections ran at 92 over the six years — and at 38 in 2025 alone, against 17 in 2024, an increase of 123.5 per cent. The trend in the compliance record is running opposite to the trend in export value.
| Notification | Date (2026) | Product | Substance | Result | Limit (mg/kg) | Multiple |
|---|---|---|---|---|---|---|
| 2026.7537 | 26 Aug | Asparagus | Chlorpyrifos, methomyl | 0.15 | 0.01 | 15.0× |
| 2026.8749 | 2 Oct | Fresh chili peppers | Acetamiprid, chlorfenapyr, clothianidin, dimethoate +9 | 0.42 ± 0.21 | 0.09 | 4.7× |
| 2026.6988 | 6 Aug | Organic cacao powder | Chlorpyrifos-methyl | 0.052 | 0.01 | 5.2× |
| 2026.7461 | 24 Aug | Organic cacao powder | Chlorpyrifos | 0.031 | 0.01 | 3.1× |
| 2026.7042 | 7 Aug | Avocado | Cypermethrin, imidacloprid | 0.15 | 0.05 | 3.0× |
| 2026.6848 | 31 Jul | Avocado | Acetamiprid | 0.028 | 0.01 | 2.8× |
| 2026.7400 | 20 Aug | Avocado | Cadmium | 0.09 | 0.05 | 1.8× |
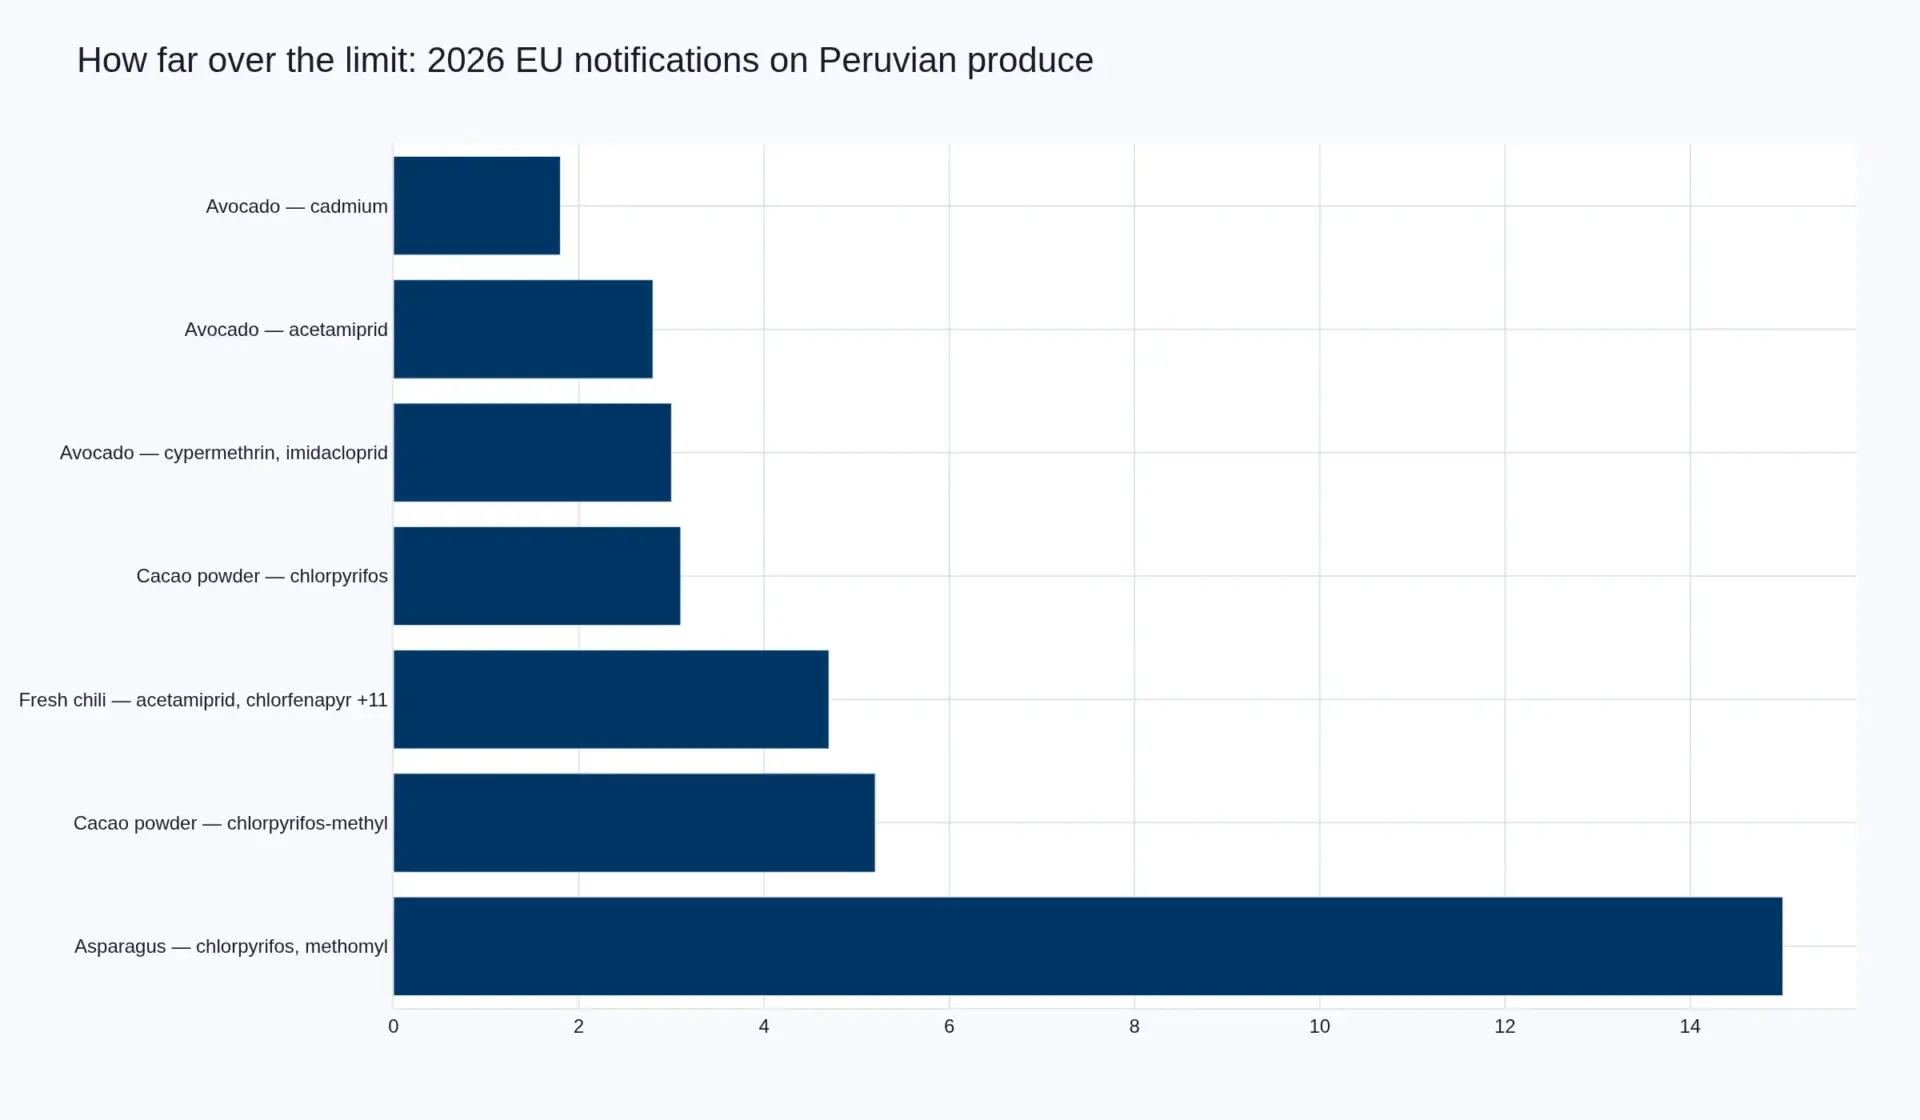
The chlorpyrifos entries deserve to be read twice. Chlorpyrifos is banned in Peru. It is not banned in the destination market, which merely sets a limit eighteen times tighter than a legal Peruvian pre-harvest use would produce. So the same consignment can be evidence of two different failures: a domestic one, if the product was applied in breach of the ban, or a foreign one, if a legal application at a legal interval simply cannot meet 0.01 mg/kg. Only the second is a market-design problem, and only the second is fixable by the industry rather than the police.
Two of the seven entries are organic cacao powder, notified by the Netherlands on the company’s own check. That is the channel to watch. A buyer who tests voluntarily and finds a prohibited molecule does not need a regulator to end a relationship, and the reputational cost of an organic consignment carrying chlorpyrifos is out of all proportion to its value.
One entry is not a pesticide at all. Cadmium at 0.09 mg/kg against a 0.05 limit in avocado is a soil-and-water problem that no registration, no label and no spray interval can solve. It matters to this market in two ways: it shares the same border, so a rejection driven by heavy metals gets counted against the same country record, and it caps what crop protection can deliver. The best spray programme in the world does not remove cadmium from an orchard.
The mismatch, stated plainly
Peru approves a product on efficacy, toxicology and ecotoxicology. The destination rejects a consignment on residue at harvest. These are different questions asked at different times by different authorities with different data. The gap between them is where this market’s regulatory risk lives, and it produces a specific and lawful trap: a grower can follow the Peruvian label exactly and still produce an unlawful consignment, because the label’s pre-harvest interval was written to a domestic standard and the destination applies a limit the label never had to satisfy.
Nothing in the current architecture closes that gap automatically. What closes it, in practice, is a private specification imposed by the buyer: a shorter interval than the label requires, a list of actives the buyer will not accept, and a pre-shipment test. Those private specifications are now a bigger determinant of which products this market sells than the public register is, and they are written in Rotterdam, not in La Molina.
Note on evidence: the residue figures above are drawn from a RASFF-derived dataset covering 2020–2025 and from notification-level detail for 2026, including notification numbers, products, substances, results and limits. It is a compilation of official notifications rather than the official portal itself, and we cite the notification numbers so that any individual line can be checked at source.