
Editorial Article
The United States Is the Only Large Quick Commerce Market Where the Order Gets Bigger
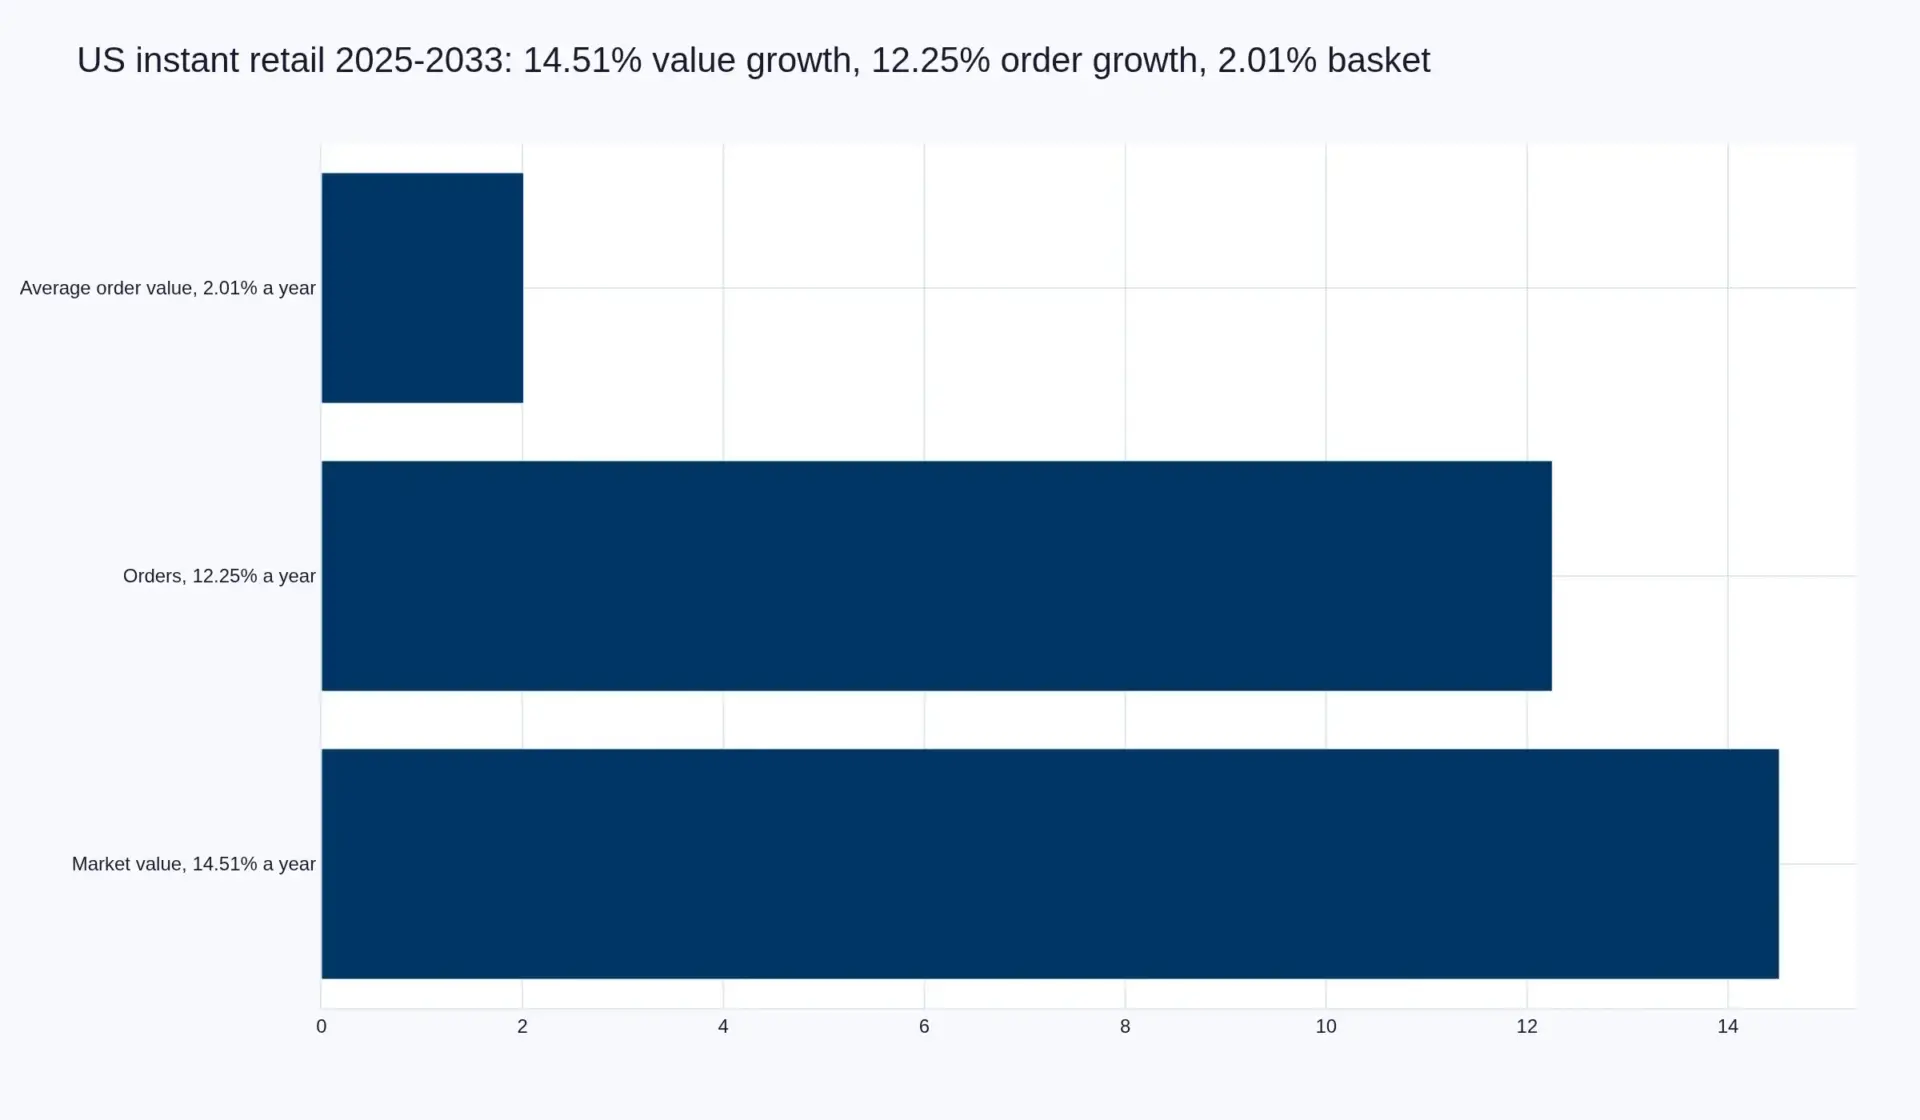
United States instant retail transacted USD 37.2 billion in 2025 and USD 44.0 billion in 2026. Pheonix Research forecasts USD 110.0 billion by 2033, 14.51% a year. Orders go from 496 million to 1,250 million over the same eight years, or 12.25% a year. The two rates are not the same, and in this market the gap between them is the story.
Divide one by the other and you get the basket. 1.1451 ÷ 1.1225 = 1.0201: an average order that rises from USD 75.00 in 2025 to USD 78.00 in 2026 and USD 88.00 in 2033, or 2.01% a year. That leaves 2.26 percentage points of American value growth coming from the order getting larger rather than from more orders being placed.
In the global build the equivalent gap is 0.16 percentage points. Value growth there is almost entirely volume growth and the basket is flat to the cent. The United States is the only large market in this cluster where value runs ahead of volume — which means close to one dollar in seven of American value growth arrives without a single additional order behind it.
What actually widens an American basket
Two things, and only one of them is structural. The first is grocery price inflation, and it passes through completely, because the platform is not selling its own goods at its own price — it is charging a percentage of a supermarket’s shelf. A rise in the underlying basket shows up in the reported market value immediately, at full magnitude, without anyone ordering differently.
The second is assortment. As the platforms added pharmacy, beauty, alcohol and general merchandise, the average order widened. Alcohol is the highest-value category a rapid delivery platform can carry and the most heavily licensed: licences are issued at state and often municipal level, frequently non-transferable, and third-party delivery requires a chain of authorisation through the retailer that holds the licence. The single biggest lever on American order value is therefore pulled by licensing boards in fifty jurisdictions rather than by merchants.
Both mechanisms are real, and together they explain something that matters more than either: a market whose growth comes partly from a bigger basket does not have to buy its growth with discount. That is the structural difference between the United States and the Asian markets in this cluster, where growth has been subsidy-supported and where the average order has been shrinking rather than widening. The American number needs no promotional line behind it.
The architecture is what allows the basket to widen
Of the USD 44.0 billion 2026 market, USD 39.5 billion — 89.8% — is picked off a shelf that was already trading. Only USD 4.5 billion, 10.2%, moves through a dedicated dark store. Globally the dark-store share is one dollar in seven; in India it is one dollar in one. The United States is the most thoroughly store-picked large market in the world, and that is not a detail about fulfilment — it is the reason the basket behaves the way it does.
A store-picked platform does not own the assortment. So a category can enter the average order without the platform leasing a node, buying inventory, carrying waste or re-planning a range: the retailer adds the shelf and the platform adds the button. A dark-store operator doing the same thing has to find the capital, the space and the working inventory first, and until it does, its basket cannot widen at all. In the United States, widening came free with somebody else’s merchandising.
| Per USD 100 of gross transaction value, Instacart Q3 2026 | USD |
|---|---|
| Goods value to the retailer | 89.60 |
| Platform transaction fee | 7.30 |
| Platform advertising revenue | 3.10 |
| Platform adjusted EBITDA | 3.20 |
That decomposition is the whole American business in four numbers, and it is why the basket matters commercially as well as statistically. Instacart ran USD 10,528 million of gross transaction value across 91.4 million orders at USD 115.19 an order in the quarter to 30 September 2026 — a basket roughly a third larger than the American market average, on a book that includes pickup and scheduled volume. A 10.4% revenue take on somebody else’s groceries, a third of it advertising, converts into a 3.2% adjusted EBITDA margin on GTV. Every extra dollar of basket carries the same take rate as the first one and almost none of the incremental cost, because the cost of the order is the trip, not the goods.
What the basket is worth, and what it would cost to lose
Here is the number that makes the gap worth arguing about. If the basket contribution closed and the American market grew from its 2026 base at its 12.25% order rate, 2033 would be USD 98.8 billion rather than USD 110.0 billion. That is USD 11.2 billion of 2033 value — roughly a tenth of the market — that would disappear without a single order being lost. Demand would be identical; value would not.
Which is precisely why a basket that widens because grocery prices are rising should not be read as a structural gain. Inflation that passes through on the way up will pass through on the way down, and a forecast built on 14.51% is partly built on an assumption about the price of food. The volume rate of 12.25% is the part of the American number that requires Americans to change their behaviour; the other 2.26 points require only that prices behave as they have.
The two risks the headline number hides
The first is pickup. A pickup order is picked from the same shelf, appears in the same gross transaction value and requires no courier and no delivery fee — the customer performs the last mile. Every order that converts from delivery to pickup removes cost from the system and leaves the market total untouched, which means the shift is invisible in the headline and visible only in the platform’s cost to serve. It is also the fastest-growing thing inside the same apps that sell delivery.
The second is the retailer’s own arithmetic. The platform charges roughly a 7.3% transaction fee to route an order to a grocer’s shelf, and the grocer accepts because the order is incremental. The moment a grocer concludes that a material share of those orders would have arrived through its own app anyway, the fee stops being a customer-acquisition cost and becomes a tax on demand it already had. In a business earning 3.2% of gross transaction value, a two-point cut in the transaction take would erase most of the profit — and it would not remove a single order from the market total.
Neither risk shows up as a fall in demand. Both show up as a fall in what the intermediary keeps, which in a market whose growth already depends more on price than on frequency is the exposure that matters.
The perimeter question that decides whether any of this is comparable
One warning belongs with every figure above. Instacart’s annualised gross transaction value, taken from its Q3 2026 disclosure of USD 10,528 million, is USD 42,112 million — 95.7% of the entire USD 44.0 billion perimeter this report sizes. That cannot be right if DoorDash, Uber Eats, Gopuff, Amazon and Walmart are also trading in the same market, and the resolution is a perimeter problem rather than a data problem: GTV includes pickup and scheduled windows of a day or more, both of which sit outside a sub-two-hour promise. On Pheonix Research’s reading roughly USD 26 billion of that GTV is genuinely instant, with about USD 18 billion attributable to the other operators.
The basket is defined by the same boundary. An order that is excluded as scheduled or pickup also carries a different average value, so the 2.01% figure is a statement about sub-two-hour retail goods and nothing else. Published US market sizes differ by a factor of two depending on which perimeter the author counted, and the basket claim is only meaningful once that choice is on the table. The full reconciliation, and the exclusions that produce it, are in the United States Quick Commerce & Instant Delivery Market report; the global two-perimeter build is in the global report, and the dark-store side of the same architecture question is in the Dark Store Networks & Micro-Fulfilment report.
The number to watch
If American value growth converges toward its order growth over the next two years, the basket story is inflation and the forecast is softer than it looks. If the gap holds at 2.26 points while grocery inflation normalises, then the widening is assortment — pharmacy, beauty, alcohol, general merchandise — and it is the most durable growth in the cluster, because it costs the platform nothing to acquire.
Those two readings are indistinguishable in any single year’s market total. They separate in one place: whether the average order keeps rising in a year when food prices do not.
Sources
Figures in this article are drawn from the documents below, and the market totals are Pheonix Research’s own build on them.
- Instacart (Maplebear Inc.), Form 10-Q for the quarter ended 30 September 2026 — gross transaction value of USD 10,528 million on 91.4 million orders at USD 115.19 an order, revenue of USD 1,095 million, advertising and other revenue of USD 331 million, adjusted EBITDA of USD 342 million and free cash flow of USD 307 million. This filing is the source of the annualised USD 42,112 million reconciled above, and of the per-USD-100 decomposition.
- DoorDash Inc., announcement of the agreed acquisition of Instacart, 29 October 2026 — approximately USD 17 billion of equity value in cash and stock. Stated here as announced; no stable public filing URL for the transaction was verified for this piece, so it is named rather than linked.
The sub-two-hour perimeter, the split between instant and scheduled volume inside Instacart’s GTV, and the residual attributed to DoorDash, Uber Eats, Gopuff, Amazon and Walmart on-demand are Pheonix Research estimates built on the disclosures above and carry no external source. The average-order figures are derived arithmetic: annual value divided by annual orders, and the growth-rate decomposition of 14.51% against 12.25%.
Frequently Asked Questions
Why does US quick commerce grow faster in value than in orders?
Because the average order gets bigger. US instant retail value rises from USD 37.2 billion in 2025 to USD 110.0 billion in 2033 at 14.51% a year, while orders rise from 496 million to 1,250 million at 12.25%. Dividing the two rates gives a basket that grows 2.01% a year, from USD 75.00 to USD 88.00. In the global market the equivalent gap is 0.16 percentage points, with the basket flat.
What widens a US quick commerce basket?
Two things. Grocery price inflation passes through completely because the platform is charging a percentage of a supermarket's shelf price rather than its own. And assortment widened as platforms added pharmacy, beauty, alcohol and general merchandise. Alcohol is the largest single lever on order value and is licensed state by state and often municipally, so that part of the basket is decided by licensing boards rather than by merchants.
Why does the store-picked model make a widening basket easier?
Because the platform does not own the assortment. Roughly 89.8% of the USD 44.0 billion 2026 market, USD 39.5 billion, is picked from shelves that were already trading; only USD 4.5 billion moves through a dedicated dark store. A store-picked platform can add a category to the average order without leasing a node, buying inventory or re-planning a range — the retailer adds the shelf and the platform adds the button.
What would close the gap between value and volume growth?
Normalising grocery inflation. If the 2.26-point gap closed and the market grew at its 12.25% order rate from the 2026 base of USD 44.0 billion, 2033 would be USD 98.8 billion rather than USD 110.0 billion — USD 11.2 billion of value that would disappear without a single order being lost. That is why the basket contribution is the market's strength and its most under-priced vulnerability.