
Global Biometric Technologies Market Report, Size, Share and Forecast 2026–2033: The Sensor Deflates and the Decision Inflates
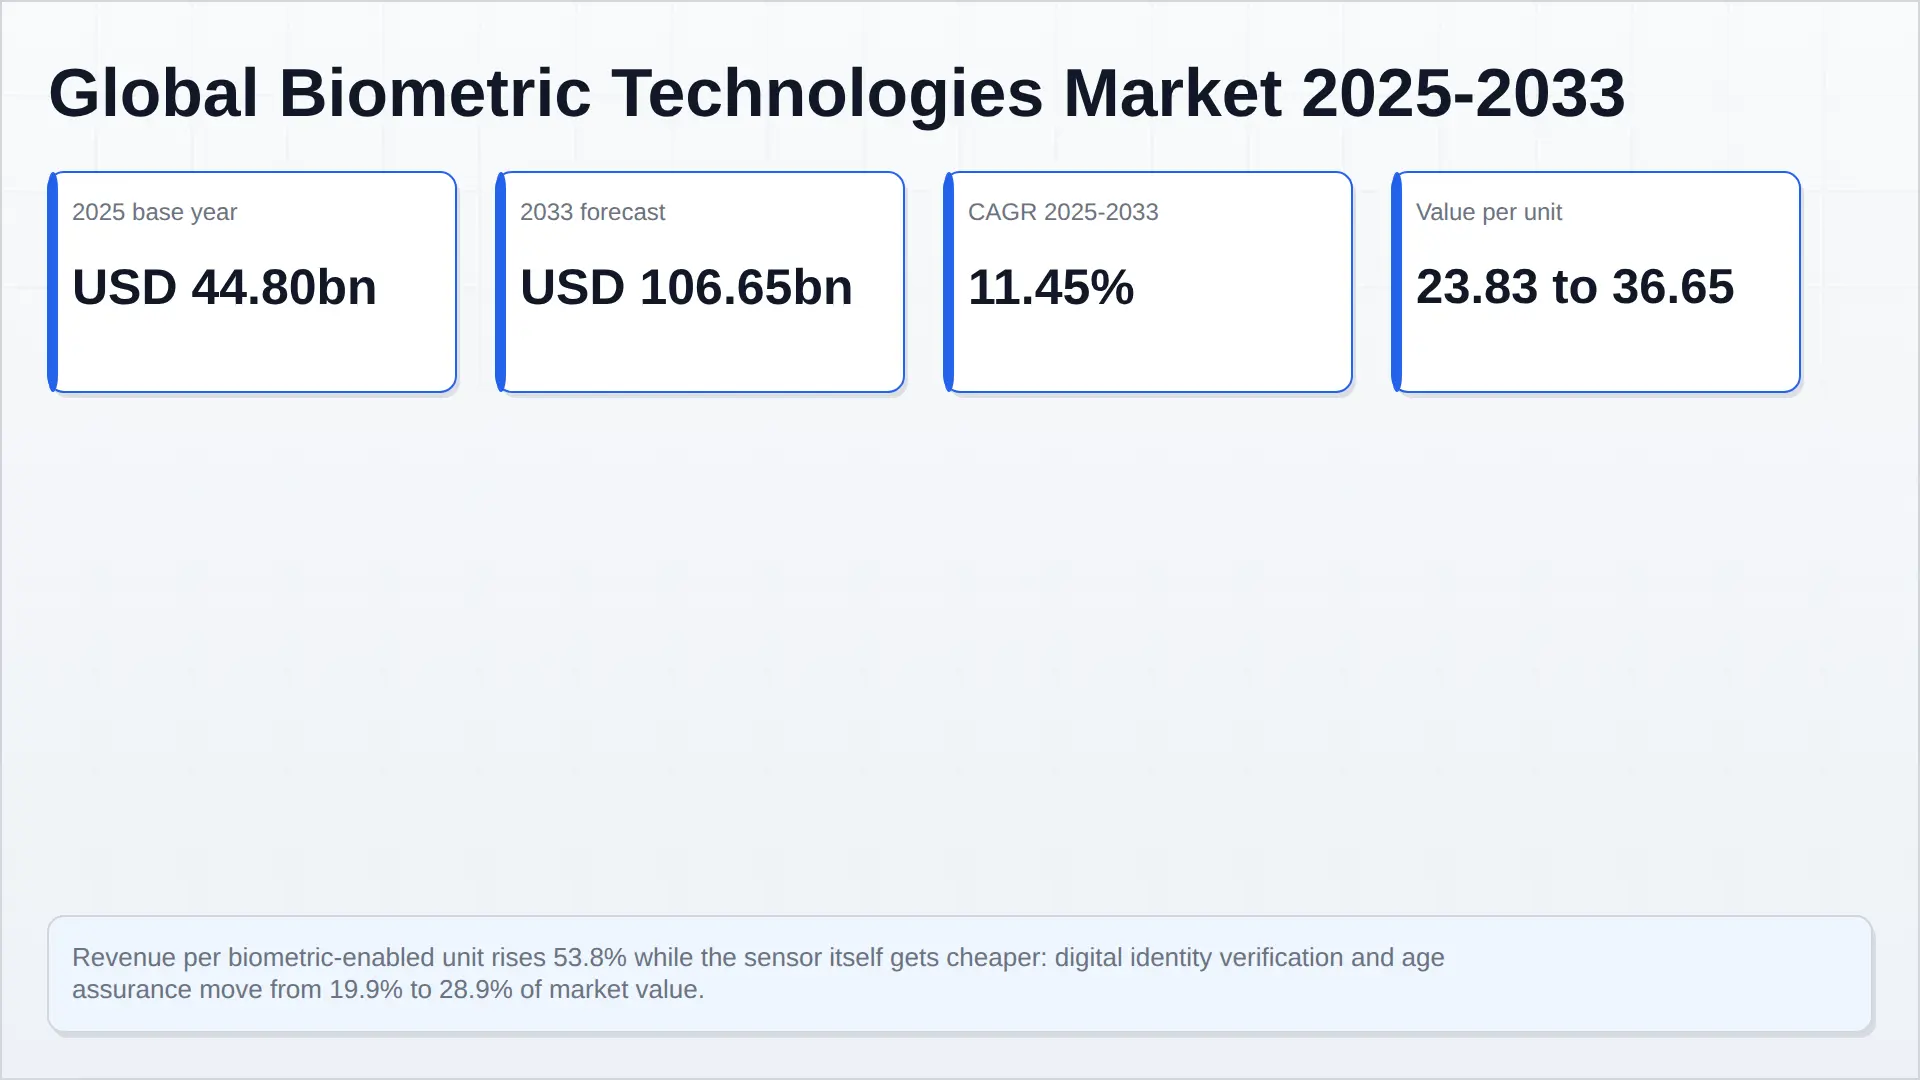
The global market for biometric technologies is USD 44.80 billion in 2025, the base year for this edition, and USD 106.65 billion in 2033 — 2.38 times in eight years at 11.45 per cent. The forecast window is 2026–2033, and its first year is USD 49.93 billion. Biometric-enabled device and terminal shipments move from an estimated 1,880 million units in 2025 to 2,910 million in 2033, 5.61 per cent a year.
Those two growth rates are the report. Volume grows at half the rate of value, which means the money is not coming from more sensors. It is coming from what happens after the sensor reads something. Value per biometric-enabled unit rises from USD 23.83 in 2025 to USD 36.65 in 2033, up 53.8 per cent, while the sensor itself gets cheaper every year of the window.
The component layer has already said so in its own disclosures. Goodix shipped 1.25 billion units in 2024, up 5.5 per cent, and its revenue fell 0.8 per cent to RMB 4,375 million on average selling price pressure. Fingerprint Cards completed the wind-down of its mobile and PC product groups in 2025 to protect its viability, and cut operating loss from SEK −421.1 million to SEK −59.2 million on a materially smaller business. The box that reads the finger is a commodity with a good margin on a shrinking price.
What is inflating is the decision: is this a live human, is this the right human, is this human entitled to act, and can you prove it afterwards. Digital identity verification and age assurance grow from USD 8.90 billion to USD 30.80 billion, 16.79 per cent a year — from 19.9 per cent to 28.9 per cent of market value, and 35.4 per cent of all incremental value added to 2033. The demand is statutory rather than aspirational: the EU Entry/Exit System began on 12 October 2025 and registered over 45 million border crossings before it became fully operational on 10 April 2026; US Customs and Border Protection runs biometric facial comparison at 238 airports under a final rule effective 26 December 2025 that removed the diplomat and most-Canadian exemptions; the UK's Online Safety Act put highly effective age assurance in force from July 2025; India's Aadhaar face authentication passed 130.5 crore cumulative transactions, of which close to 102 crore fell in FY2024-25 alone.
The incumbents did not capture that growth in 2025. Thales' Cyber & Digital segment, which holds its identity and biometrics business, was down 3.7 per cent in the first half to EUR 1,862 million. NEC grew operating profit 40.3 per cent in the year to March 2026, but on IT services rather than identity. And the most hyped adjacent product failed outright: biometric payment cards never reached volume, Zwipe filed for bankruptcy in March 2025, and IDEX Biometrics cut operating expenses by more than half and rebuilt itself as an access-control card company, with FIDO2 certification only arriving in February 2026.
Method. 70 per cent secondary, 30 per cent primary. The 2025 base is built bottom-up from biometric-enabled device and terminal shipments by end-market multiplied by realised price bands, plus credential and transaction populations multiplied by annual licence and per-check values. The end-market split, modality split and regional split are Pheonix model build-ups, not disclosed series, and every derived figure reconciles to the USD 44.80 billion 2025 base. No competitor or third-party market-research citation appears anywhere in this report.
Market Snapshot
The global market for biometric technologies is USD 44.80 billion in 2025 — the base year for this edition, and our estimate rather than a disclosed series — and reaches USD 106.65 billion in 2033. That is 2.38 times in eight years, an 11.45 per cent compound annual growth rate across the 2026–2033 forecast window, the first year of which is USD 49.93 billion.
Biometric-enabled device and terminal shipments move from an estimated 1,880 million units in 2025 to 2,910 million in 2033, 5.61 per cent a year. Set against the value base, that puts USD 23.83 of market value on every biometric-enabled unit shipped in 2025 and USD 36.65 on every one shipped in 2033 — up 53.8 per cent. Volume is growing at half the rate of value. The arithmetic of those two rates is the argument of this report.
Executive Summary
The industry has spent two decades arguing about which body part is best. The market has already answered that the body part does not matter much. What matters is the sequence that follows a reading: is this a live human, is this the right human, is this human entitled to act, and can the decision be evidenced afterwards. The sensor is the cheapest part of that sequence, and it is getting cheaper. The decision is the expensive part, and it is growing.
The component layer has said so in its own disclosures rather than in commentary. Goodix shipped 1.25 billion units in 2024, up 5.5 per cent, and booked RMB 4,375 million of revenue, down 0.8 per cent — its own explanation being average selling price pressure offsetting volume. Fingerprint Cards completed the wind-down of its mobile and PC product groups in 2025 to protect the company's viability, and reduced its operating loss from SEK −421.1 million to SEK −59.2 million by making the business smaller. A component that ships more every year for less money every year is not the centre of the value chain. It is the entry ticket to it.
Meanwhile the statutory demand is arriving on fixed dates rather than on adoption curves. The EU Entry/Exit System began on 12 October 2025 and had registered over 45 million border crossings by the time it became fully operational on 10 April 2026, recording facial images and fingerprints for every non-EU short-stay traveller. US Customs and Border Protection runs biometric facial comparison at 238 airports, and its final rule effective 26 December 2025 removed the diplomat and most-Canadian exemptions and extended collection to sea exit, private aircraft and pedestrian exit. The UK's Online Safety Act required highly effective age assurance from July 2025. India notified its Digital Personal Data Protection Rules on 14 November 2025 with an eighteen-month compliance runway to 13 May 2027.
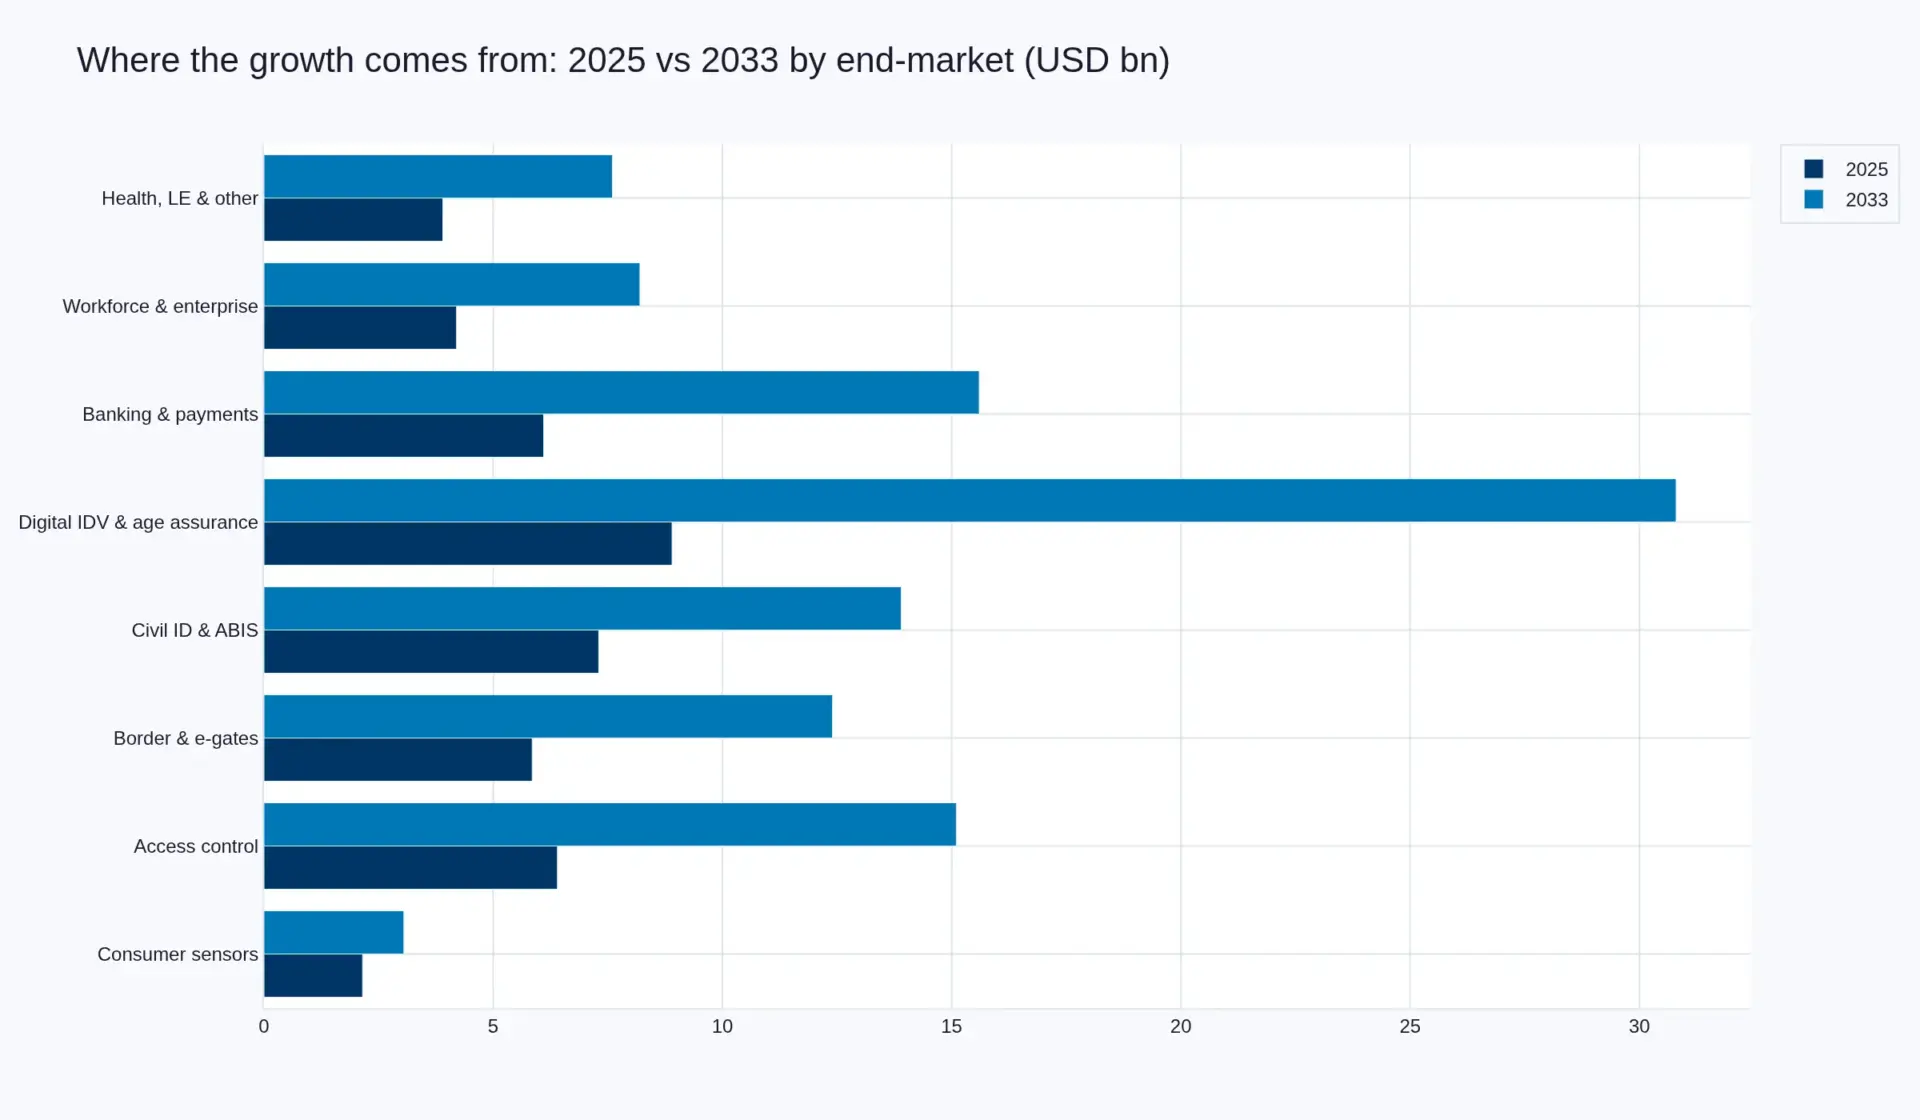
That is why digital identity verification and age assurance, taken as one end-market, grows from USD 8.90 billion in 2025 to USD 30.80 billion in 2033 at 16.79 per cent — from 19.9 per cent to 28.9 per cent of market value, and 35.4 per cent of all the value this market adds to 2033. It is also why the incumbents did not feel like growth companies in 2025: Thales' Cyber & Digital segment, where its identity and biometrics business sits, fell 3.7 per cent in the first half to EUR 1,862 million, and NEC grew operating profit 40.3 per cent in the year to March 2026 on IT services rather than on identity.
The headline rate is 11.45 per cent. The rate that explains the market is 5.61
A market that grows 11.45 per cent a year while its units grow 5.61 per cent is not a market selling more devices. It is a market attaching more revenue to each device already sold. Three things do that, and only one of them is a price increase.
The first is mix. A biometric-enabled unit in 2025 is mostly a phone with a fingerprint sensor worth well under a dollar inside it. A biometric-enabled unit in 2033 is more often a border gate, a point-of-sale terminal, a vehicle, an enterprise badge or a check performed entirely in software against a document. As the composition shifts towards systems and transactions, revenue per unit rises without any underlying price inflation.
The second is the check. Liveness and presentation-attack detection, identity verification against a document and a watchlist, and age estimation are all priced per attempt. They scale with verification volume, not with hardware. Every one of the regulatory instruments named above creates attempts.
The third is evidence. Audit trails, biometric template protection, consent records and deletion obligations are services that a device cannot provide for itself. They are sold as platform, per credential and per year, and they carry renewal revenue.
Only the fourth channel — the sensor itself — is deflating. Consumer device biometrics is USD 2.15 billion of a USD 44.80 billion market in 2025, 4.8 per cent of value, and USD 3.05 billion of USD 106.65 billion in 2033, 2.9 per cent. It grows 4.47 per cent a year and it is the one segment in this report whose unit economics we would describe as hostile.
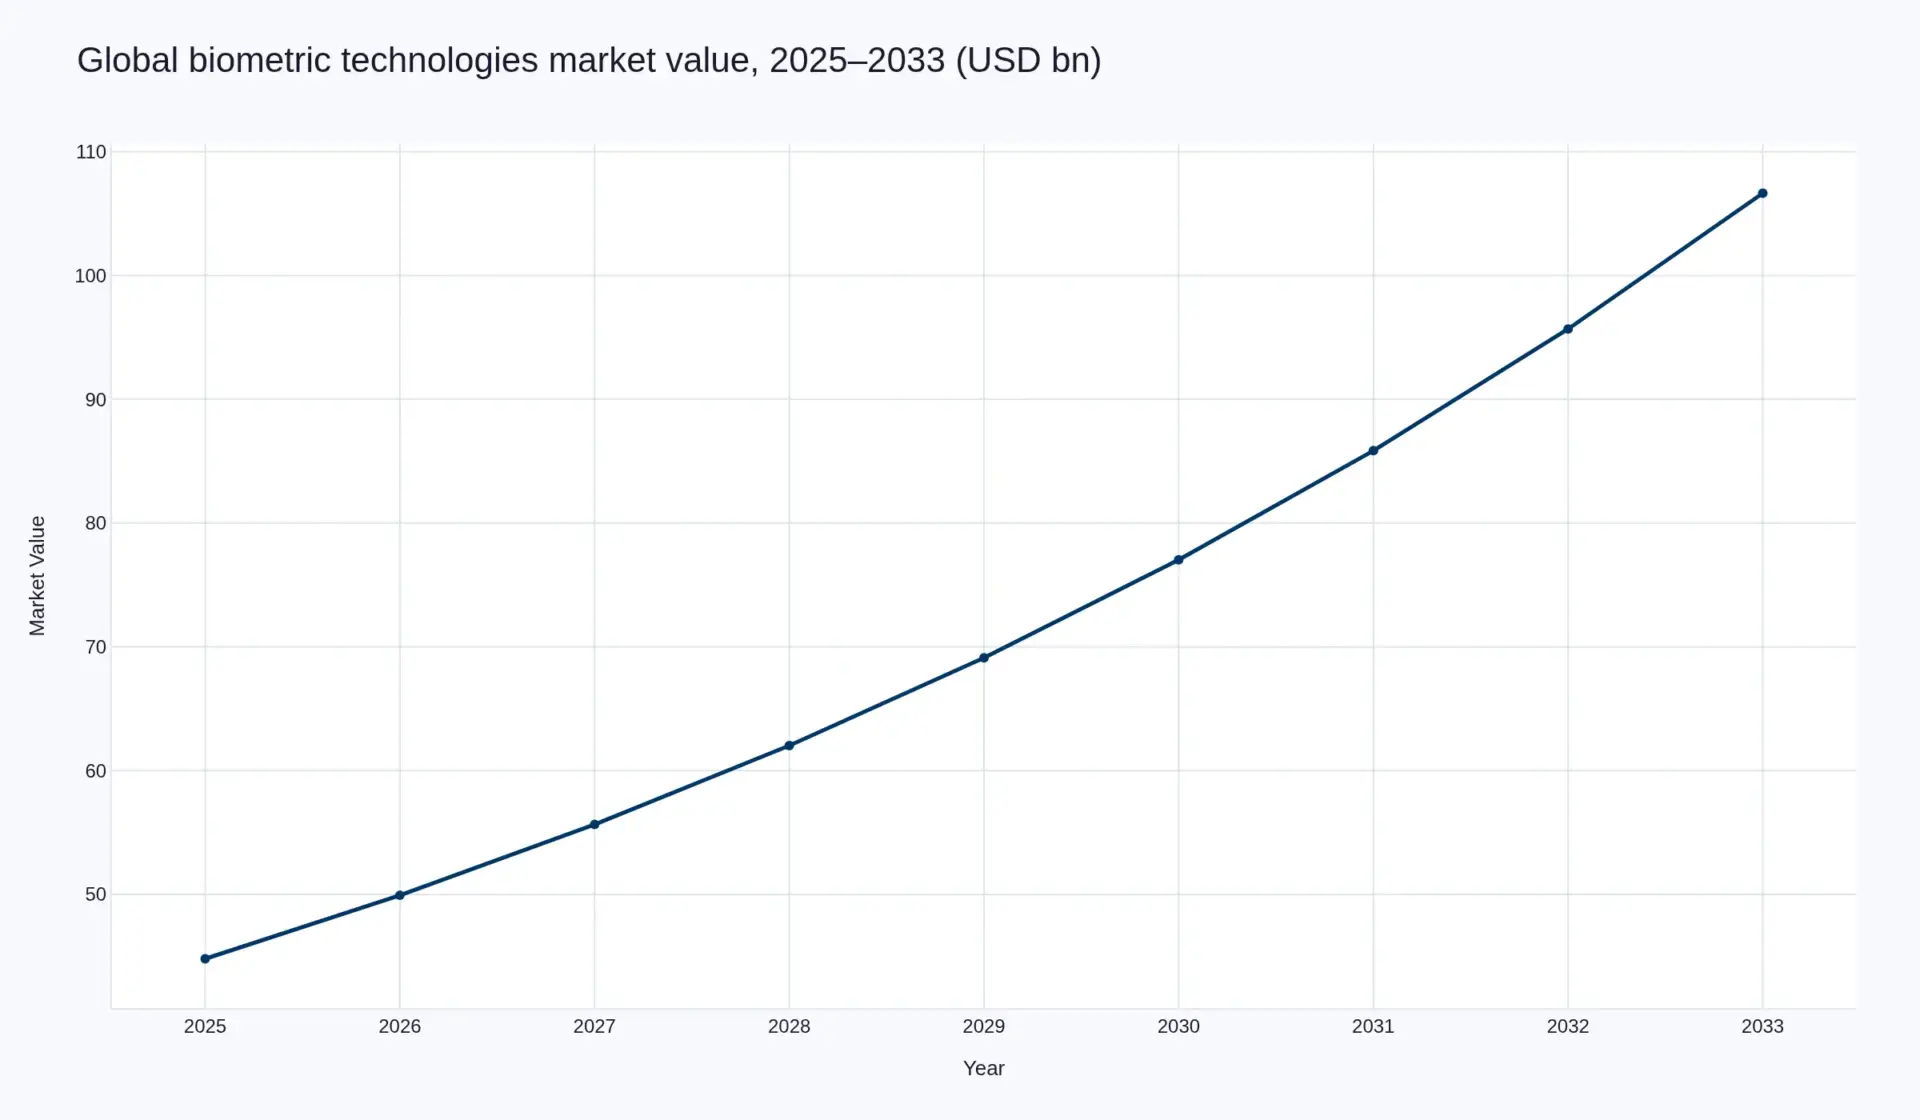
Table 1: the end-market build, 2025 and 2033
| End-market | 2025 (USD bn) | 2033 (USD bn) | CAGR 2025–2033 |
|---|---|---|---|
| Digital identity verification & age assurance | 8.90 | 30.80 | 16.79% |
| Banking, payments & fraud | 6.10 | 15.60 | 12.45% |
| Physical access control terminals & cards | 6.40 | 15.10 | 11.33% |
| Civil ID, enrolment & ABIS | 7.30 | 13.90 | 8.38% |
| Border, immigration & e-gates | 5.85 | 12.40 | 9.85% |
| Workforce, time & enterprise authentication | 4.20 | 8.20 | 8.72% |
| Health, law enforcement & other | 3.90 | 7.60 | 8.70% |
| Consumer device sensors & modules | 2.15 | 3.05 | 4.47% |
| Total | 44.80 | 106.65 | 11.45% |
Two shares are worth carrying in the head. Digital identity verification and age assurance is 19.9 per cent of 2025 value and 28.9 per cent of 2033 value, and supplies USD 21.90 billion of the USD 61.85 billion the market adds across the window. Consumer sensors fall from 4.8 per cent to 2.9 per cent. The end-market split is a Pheonix model build-up, not a disclosed series; it is reproduced in full in Table 1 so that anyone can disagree with a line rather than with the total.
Regional structure
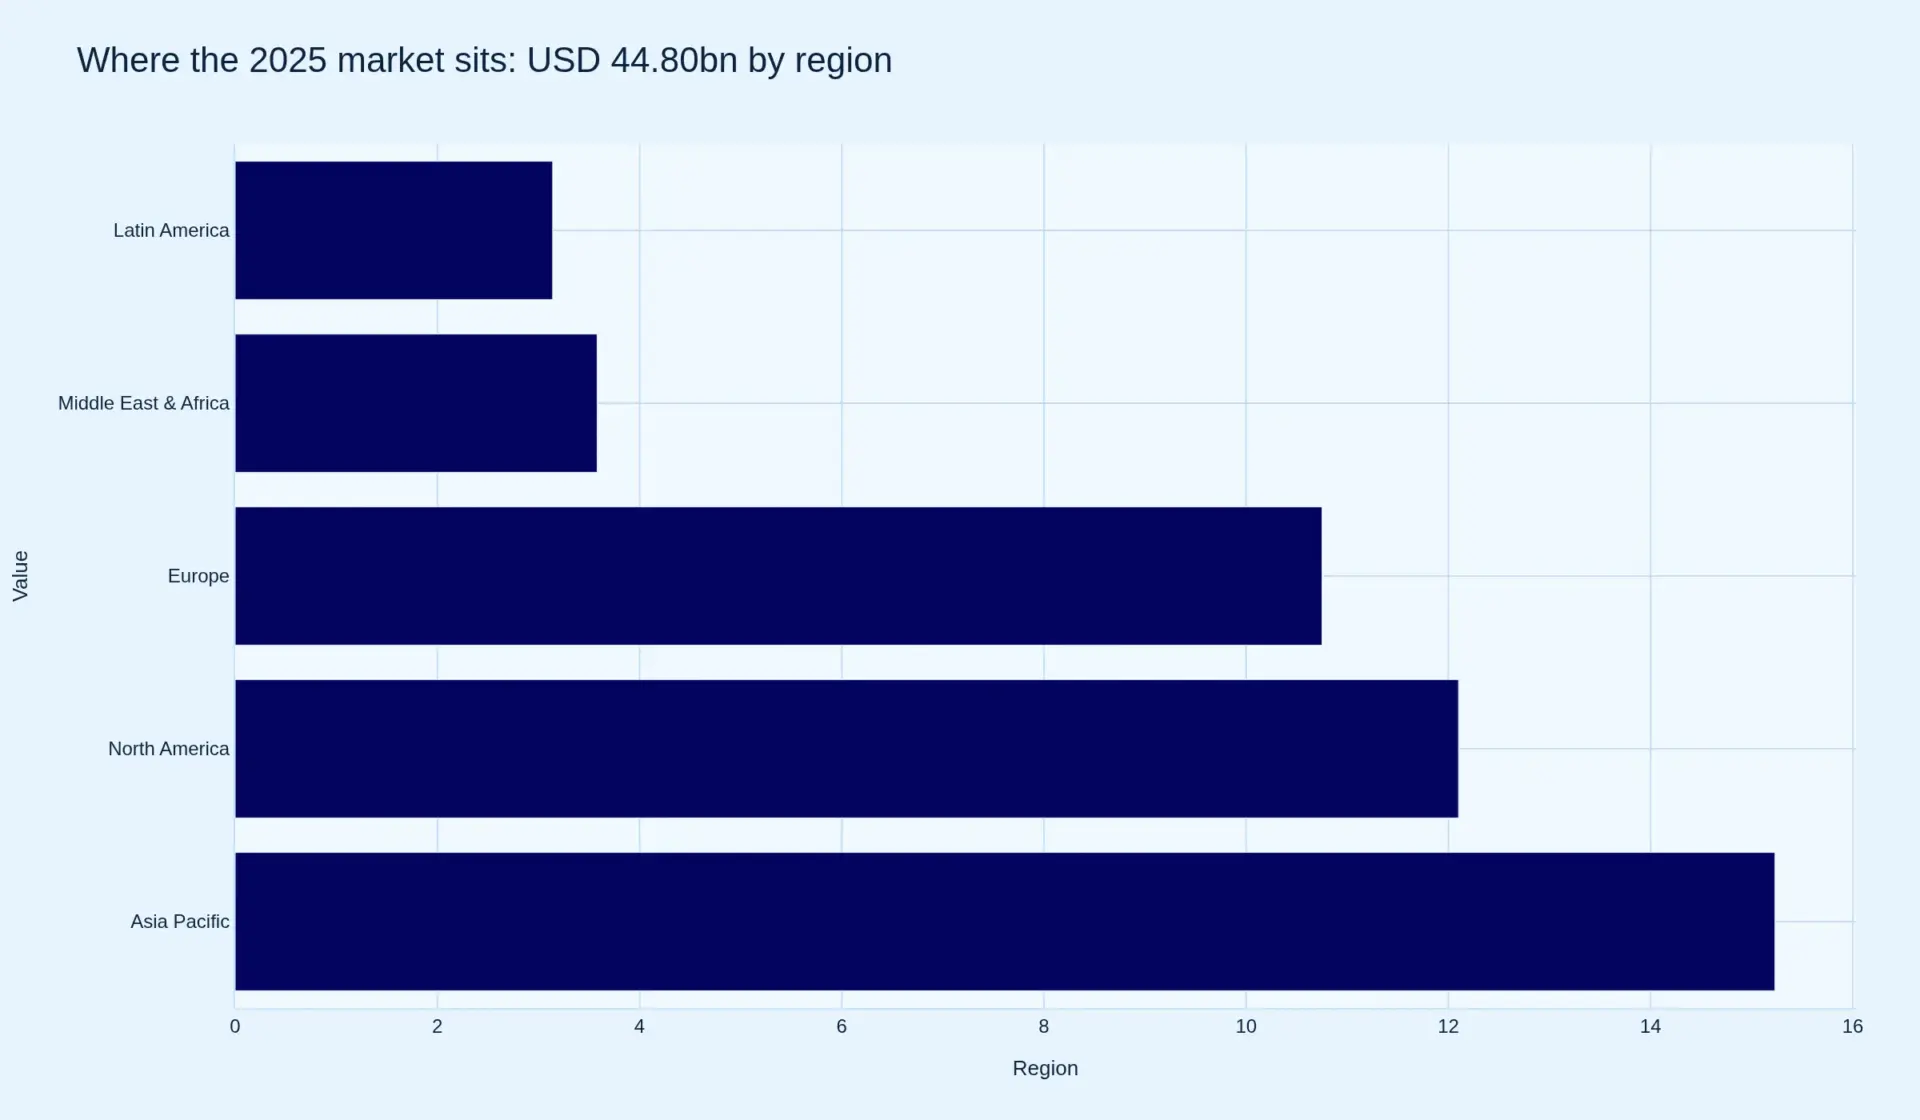
Asia Pacific is the largest region at USD 15.23 billion, 34 per cent of 2025 value, because it is where the devices are built and where the largest single authentication population operates: Aadhaar's face authentication alone passed 130.5 crore cumulative transactions, close to 102 crore of them in FY2024-25, and 15.25 crore in March 2025 at 21.6 per cent month-on-month growth. North America is USD 12.10 billion, 27 per cent, carried by border and aviation deployment and by the most mature commercial identity-verification market. Europe is USD 10.75 billion, 24 per cent, and is the region where regulation, rather than consumer adoption, sets the purchase order — the Entry/Exit System, the AI Act and the digital identity wallet mandate all land in the same three years. The Middle East and Africa is USD 3.58 billion, 8 per cent and Latin America USD 3.14 billion, 7 per cent; both are national-programme markets where the World Bank's estimate that 800 million people still lack official proof of identity, and that 2.8 billion lack access to a digital ID for online transactions, describes the pipeline rather than the problem.
Modality structure
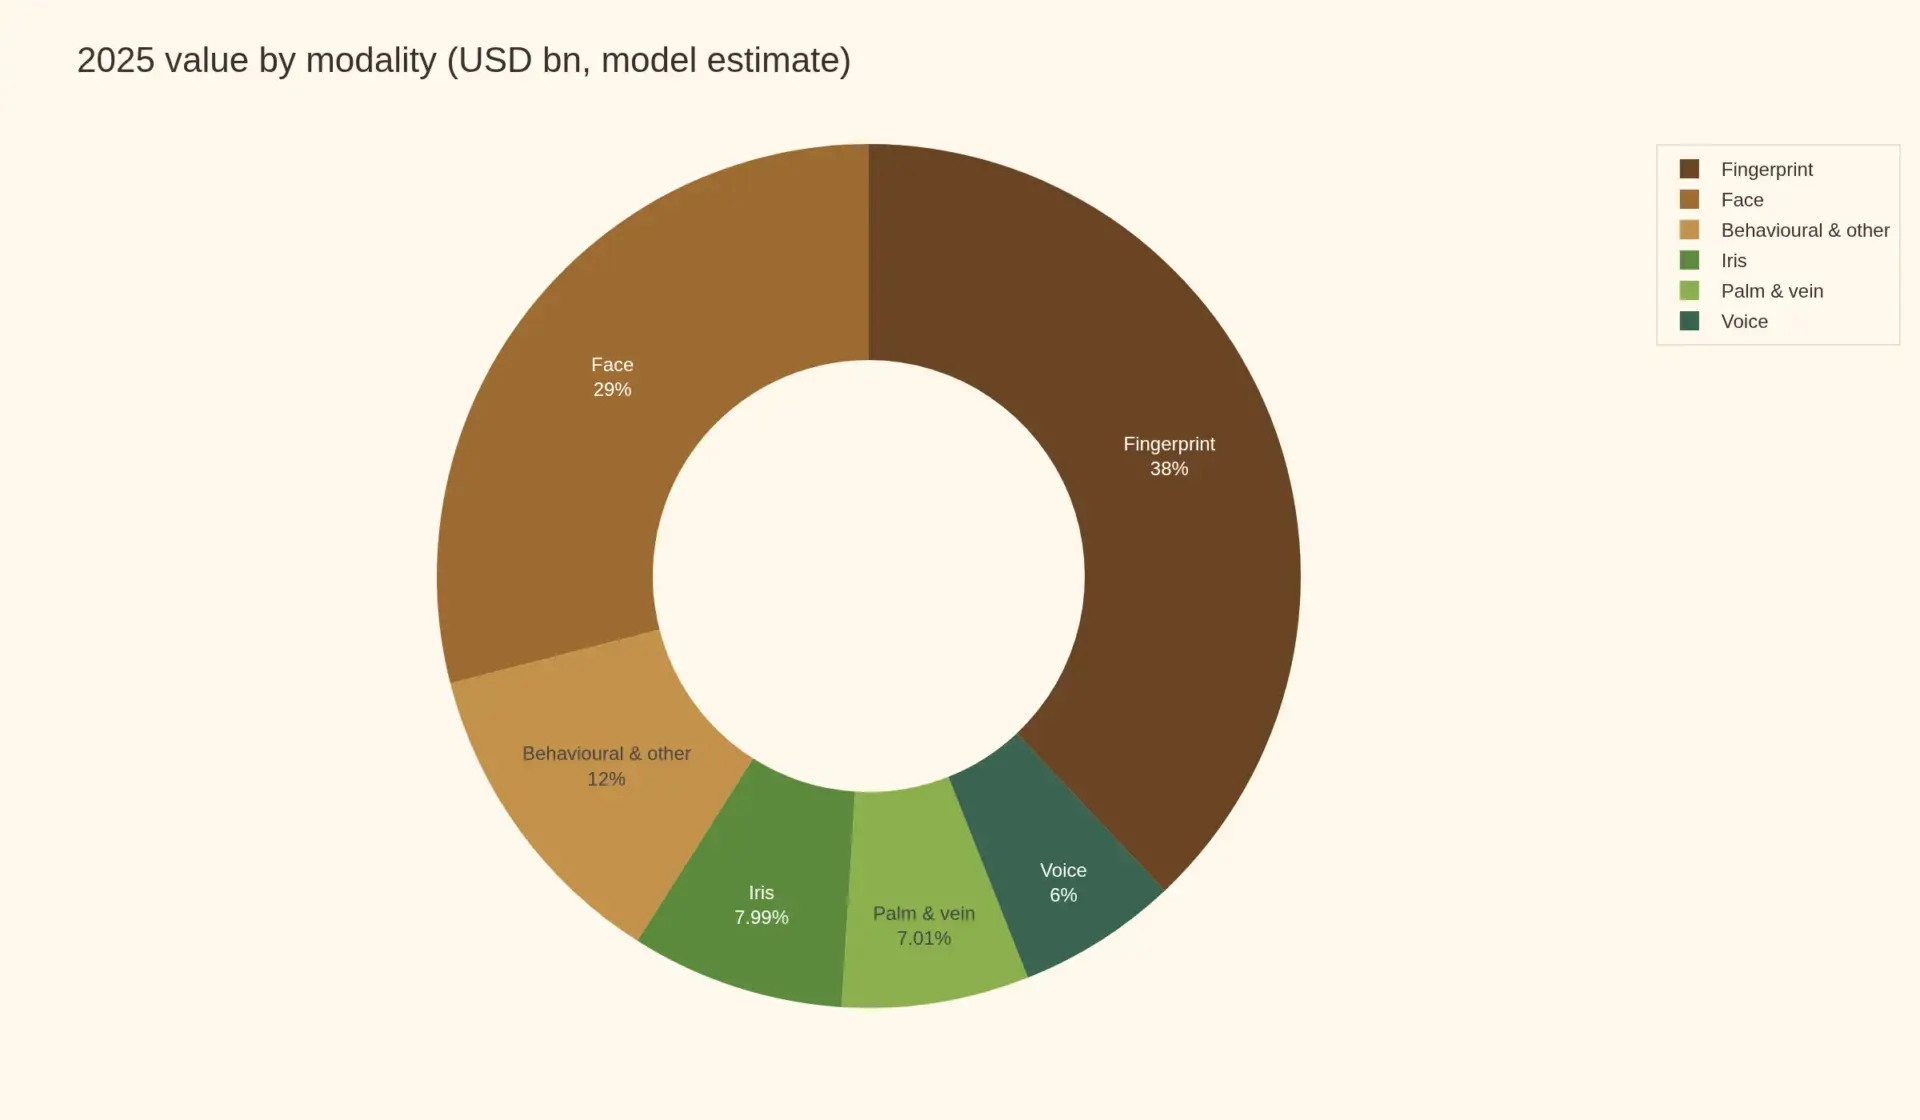
Fingerprint is USD 17.02 billion, 38 per cent of 2025 value, on the strength of being the default unlock on more than a billion devices a year. Face is USD 12.99 billion, 29 per cent and takes most of the growth, because it is the only modality that works at distance, without cooperation and without dedicated hardware beyond a camera — which is precisely what a border, an airport and an age check require. Iris is USD 3.58 billion, 8 per cent; palm and vein USD 3.14 billion, 7 per cent; voice USD 2.69 billion, 6 per cent; behavioural and other modalities, including gait and keystroke, USD 5.38 billion, 12 per cent. Multimodal deployment is the direction of travel in every one of those lines: the practical question at a gate is not which modality, but how many independent signals can be fused before the false-accept rate falls to the level the regulator demands.
What this edition changes, and why the number moved down
This report replaces a 2024–2031 edition which stated a market of approximately USD 38 billion in 2023 rising to approximately USD 120 billion by 2031 at around 12 per cent, without a stated scope, a stated base year or a reconciliation between the two figures. Under this edition's model, 2031 is USD 85.85 billion — materially below the earlier page, on a similar growth rate.
The difference is scope, not sentiment. The earlier figure appears to have carried general video surveillance and broader electronic security systems inside the biometric total. This edition counts only biometric-specific hardware, software and verification services, and it de-duplicates sensor revenue from device revenue so that a fingerprint module is counted once. A larger number is not a better number; a number that can be taken apart is the only one worth buying.
Scope and how the model is built
Research basis: 70 per cent secondary, 30 per cent primary. Primary work comprised open-ended interviews with systems integrators, border and immigration technology leads, commercial identity-verification vendors, access-control OEMs and channel distributors through 2025 and 2026; a specification and procurement survey covering modality choice, false-accept tolerances and migration timing; and conference-floor discussion with sensor suppliers, algorithm vendors and platform engineers. Secondary work comprised exchange filings and annual reports from listed participants, statutory and regulatory text, standards and evaluation material, and official statistics.
Construction. The 2025 base is built bottom-up from biometric-enabled device and terminal shipments by end-market multiplied by realised price bands, plus credential and transaction populations multiplied by annual licence and per-check values. Volume is a Pheonix estimate cross-checked against the shipment and revenue disclosures of listed suppliers rather than taken from a single series. All values are in US dollars, undeflated; company figures are quoted in reporting currency as disclosed.
Three figures are ours alone. The end-market split, the modality split and the regional split are model build-ups. They are internally consistent and they reconcile to the USD 44.80 billion base, but they are not disclosed series and should not be quoted as though they were. Every chapter that follows states which figures are disclosed and which are ours. No competitor or third-party market-research citation is used anywhere in this report.
Sources and provenance
Every figure in this report traces to one of the sources below, or to the Pheonix model built from them. Where a claim rests on a company's own statement about its own product, it is attributed in the text.
Regulatory and official primary sources
- European Commission, The Entry/Exit System will become fully operational on 10 April 2026, 30 March 2026.
- European Commission, FAQs about EES — progressive rollout to 9 April 2026; legal base Regulation (EU) 2017/2226 and Regulation (EU) 2025/1534.
- European Commission, AI Act — regulatory framework and application timeline, including the AI Omnibus changes to Annex III and Annex I high-risk dates.
- EUR-Lex, Regulation (EU) 2024/1183 — European digital identity framework and wallets.
- Ofcom, Age checks to protect children online, 16 January 2025 — highly effective age assurance, methods capable of meeting the standard, and the decision not to set numeric thresholds at this stage.
- Illinois General Assembly, Public Act 103-0769 (SB 2979), amending 740 ILCS 14/10 and 14/20, effective 2 August 2024.
- Government of India, Press Information Bureau, DPDP Rules, 2025 Notified, 17 November 2025 — eighteen-month phased compliance.
- US Customs and Border Protection, DHS announces Final Rule to advance the Biometric Entry/Exit Program, 20 November 2025, effective 26 December 2025.
- US Customs and Border Protection, Biometrics Environments: Airports — 238 airports, 14 Preclearance locations, 66 international departure locations.
- Unique Identification Authority of India, Annual Report 2024-25 — average daily authentications, peak volumes, face authentication trajectory.
- UIDAI / PIB, Aadhaar Face Authentication transaction release, 1 April 2025 — 130.5 crore cumulative, close to 102 crore in FY2024-25, 15.25 crore in March 2025.
- World Bank, Global progress in identification: 3 findings from the latest data, 30 October 2025 — 800 million without official proof of identity; 2.8 billion without access to an online digital ID.
- National Institute of Standards and Technology, FRTE Part 2: Identification (NISTIR 8271 draft supplement), forty-seventh draft update, February 2026.
Company disclosures and technical documentation
- Goodix Technology, 2024 Annual Report Summary — revenue RMB 4,374.95m, shipments 1.25 billion units, gross margin 41.8%, net profit RMB 604m, SG&A and R&D reduction of RMB 161m.
- Fingerprint Cards, Interim report Q4 2025 — wind-down of mobile and PC product groups, gross profit SEK 47.5m, gross margin 60.7%, operating result improvement, February 2025 rights issue.
- IDEX Biometrics ASA, Annual Report 2025 — strategic repositioning, operating expense reduction, MIFARE DESFire EV3 biometric access card with NXP, Japan and Bangladesh launches, India biometric payments approval, FIDO2 certification February 2026.
- NEC Corporation, Consolidated Financial Results for the fiscal year ended 31 March 2026 — revenue JPY 3,582,733m, operating profit JPY 359,913m, segment revenues; and Annual Report 2025 business overview for the NIST benchmark claim.
- Thales, 2025 half-year results — group sales EUR 10,265m; Cyber & Digital EUR 1,862m; Cyber EUR 708m; Digital EUR 1,153m.
- Yoti, presentation attack detection trends 2025 — 3.2 million injection attacks detected, August 2025 peak of 527,013, over 8 million checks per week, iBeta Level 3 claim under ISO/IEC 30107-3.
- Apple Newsroom, Apple introduces Digital ID, 12 November 2025 — TSA acceptance at more than 250 airports; licences and state IDs live in 12 states and Puerto Rico; Japan My Number Card.
- Google Identity, Passkeys documentation — device biometric as the local unlock for a cryptographic credential.
Provenance
This edition replaces the 2024–2031 edition of this report and restates the market on a base year of 2025 with a forecast window of 2026–2033. It is bound to the Wikidata entity biometrics (Q177765). Company slots resolve to the Wikidata entities listed in the report metadata, and the ten named participants each carry their own official website. No competitor or third-party market-research publication is cited anywhere in this report; where a consensus figure is disputed, the dispute is argued from primary disclosure and regulatory text.
Last verified: November 2026. Readers should treat figures dated to a company's most recent filing as of that filing date rather than as of this edition.
Table of Contents
Table of Contents
- Market snapshot, executive summary and the sizing model
- The headline rate is 11.45 per cent; the rate that explains the market is 5.61
- Table 1: the end-market build, 2025 and 2033
- Regional structure and modality structure
- What this edition changes, and why the number moved down
- Scope, research basis and model construction
- Value chain: five layers, and the one that keeps the margin
- The sensing and capture layer
- The matching and liveness layer
- The device and terminal layer
- The platform and identity infrastructure layer
- The enrolment, integration and managed service layer
- Table 2: layer shares of 2025 value and typical gross margin bands
- Technology and innovation: why accuracy stopped being the moat
- Presentation attack detection and the injection attack
- What independent evaluation actually tests
- On-device matching, template protection and the shift to attestation
- Multimodal fusion and the economics of the second signal
- Competitive landscape: three tiers and a missing middle
- Tier one: the identity primes
- Tier two: the silicon and card layer
- Tier three: the verification and age-assurance specialists
- Table 3: participants, positioning and disclosed scale
- Structure, concentration and the substitution question
- Regulatory landscape: the calendar is the demand curve
- The EU AI Act and the high-risk class
- EU Entry/Exit System and the digital identity wallet mandate
- Age assurance after the UK Online Safety Act
- Data protection: GDPR, BIPA as amended, India’s DPDP Rules
- Standards and independent testing
- Investment activity: capital went to the check, not the sensor
- Where the capital went in 2025
- The two failures that reset expectations
- R&D intensity and the incumbent problem
- Table 4: selected transactions and capital events, 2024–2026
- Market risk: six things that decide whether the model holds
- Commoditisation risk
- Regulatory timing and compliance cost
- Litigation and the consent record
- Substitution by device-bound credentials
- Supply concentration and geopolitical exposure
- Procurement cycles and payment behaviour
- Sources and provenance
Tables
- Table 1 — end-market build, 2025 and 2033: base values, forecast values and compound growth
- Table 2 — value-chain layer shares of 2025 value and typical gross margin bands
- Table 3 — competitive tiers, positioning and disclosed scale, 2024–2026
- Table 4 — selected capital events, 2024–2026
Figures
- Figure 1 — market value and value per unit, 2025–2033
- Figure 2 — market value path, 2025–2033
- Figure 3 — end-market shift, 2025 versus 2033
- Figure 4 — 2025 value by region
- Figure 5 — 2025 value by modality
All figures in US dollars, undeflated. Base year 2025; forecast window 2026–2033. The end-market, modality and regional splits, and the value-chain layer shares, are Pheonix model build-ups rather than disclosed series, and are labelled as such wherever they appear.
Competitive Landscape
Competitive landscape: three tiers and a missing middle
This market is not consolidated and it is not fragmented. It is layered, and the layers barely compete with each other even though they sell into the same procurement. The practical way to read the field is to ask what a company actually sells: an identity programme, a component, or a check. Those three answers correspond to three tiers with different margins, different growth and different exposure to the next four years.
Tier one: the identity primes
The primes sell programmes: national registers, border systems, document issuance, large access-control estates. Thales is the clearest bellwether because it discloses enough to see the trend. Its Cyber & Digital segment, which contains the identity and biometrics business, recorded EUR 1,862 million in the first half of 2025, down 3.7 per cent and down 1.9 per cent organically, with the Digital sub-segment at EUR 1,153 million, down 2.9 per cent, against group sales of EUR 10,265 million, up 8.1 per cent. Read that against the group: the identity business was the part that did not grow while defence and avionics carried the company.
NEC is the counter-example, but not for the reason usually given. Its fiscal year to March 2026 produced revenue of JPY 3,582.7 billion, up 4.7 per cent, and operating profit of JPY 359.9 billion, up 40.3 per cent. The growth came from IT services, which rose to JPY 2,508.9 billion from JPY 2,459.8 billion, and from Social Infrastructure, which rose to JPY 935.3 billion from JPY 832.1 billion. NEC states that its biometric authentication ranks first in the world in NIST benchmark testing — the strongest technical claim in the field — and yet biometrics is a component of a segment rather than a disclosed line. That is the structural problem of the primes in one sentence: excellent technology, buried inside businesses large enough to hide it.
IDEMIA and HID Global occupy the same tier from different directions — IDEMIA from civil identity, border and payment cards, HID from physical access control and credentials — and neither discloses a biometric line that can be compared with the others. Fujitsu holds one of the few genuinely differentiated modality positions in the field with palm vein authentication, which is harder to spoof than a fingerprint and needs no contact, but it too reports at group level.
Tier two: the silicon and card layer
The second tier sells the physical reading and the credential. It has the volume, the clearest disclosures, and the worst pricing environment. Goodix is the largest sensor supplier visible in public filings: 1.25 billion units shipped in 2024, up 5.5 per cent, revenue of RMB 4,375 million, down 0.8 per cent, gross margin 41.8 per cent and net profit of RMB 604 million, up 265.8 per cent. The profitability recovery alongside flat revenue is the whole story of this tier — it is being run for cost, not for price.
Fingerprint Cards showed what happens at the other end of the same market. It completed the wind-down of its loss-making mobile and PC product groups during 2025, reported a gross margin of 60.7 per cent on gross profit of SEK 47.5 million, and cut its operating loss from SEK −421.1 million to SEK −59.2 million. It also raised SEK 115.1 million gross in a February 2025 rights issue priced at SEK 0.48 per unit, with roughly 72 per cent of the units offered taken up. A 60 per cent gross margin on a shrinking revenue base is not a franchise; it is a salvage operation conducted competently.
IDEX Biometrics is the tier’s most interesting strategic case, because it abandoned the position that was failing and moved to an adjacent one that is working. After cutting operating expenses by more than half and reducing headcount in 2025, it delivered the first biometric access card compatible with MIFARE DESFire EV3 alongside NXP, launched commercially in Japan and Bangladesh, obtained regulatory approval for biometric payments in India, and achieved FIDO2 certification in February 2026 — two months later than planned, which it identifies as the direct cause of missed order targets. Its own summary is that four of five objectives were met. The fifth was revenue.
Tier three: the verification and age-assurance specialists
The third tier sells checks, and it is where the growth in this report actually sits. Jumio and Yoti are the representative cases: neither owns a sensor design, neither manufactures a terminal, and both are priced per verification or per user per year. Yoti reports running over eight million checks a week and detecting 3.2 million injection attacks in 2025. Their competitive assets are certification, a liveness model that survives independent testing, and the operating data that comes from volume — none of which appears on a balance sheet as a fixed asset.
This tier is also where the boundary of the market is being contested. Some of these businesses are genuinely biometric in the sense this report counts, because a face comparison or an age estimate is a biometric operation. Others are document-centric with a face check attached. We count the biometric-attributable share of the fee and exclude pure document authentication, which is why the verification layer is 22 per cent of value rather than the much larger share a revenue-line view would suggest.
Table 3: participants, position and disclosed scale
| Participant | Tier | Position in the chain | Latest disclosed scale | Direction |
|---|---|---|---|---|
| Thales Group | 1 | Documents, border systems, biometrics | Cyber & Digital EUR 1,862m, H1 2025, −3.7% | Flat to down |
| IDEMIA | 1 | Civil ID, border, payment cards | Private; no biometric line disclosed | Not observable |
| NEC | 1 | Face and iris matching, ABIS | Group revenue JPY 3,582.7bn, FY to March 2026 | Up, not on identity |
| HID Global | 1 | Access control, credentials, readers | Part of ASSA ABLOY; not separately disclosed | Not observable |
| Fujitsu | 1 | Palm vein, public sector systems | Group only; biometrics not a reported line | Not observable |
| Goodix Technology | 2 | Fingerprint and ultrasonic sensors | RMB 4,375m revenue, 2024, −0.8% | Volume up, price down |
| Fingerprint Cards | 2 | Sensors and biometric cards | Gross profit SEK 47.5m, 2025 | Restructured |
| IDEX Biometrics | 2 | Biometric access and payment cards | OpEx cut by more than half, 2025 | Repositioned |
| Jumio | 3 | Identity verification, per check | Private; volume not disclosed | Growing |
| Yoti | 3 | Age assurance and digital ID | Over 8 million checks a week, 2025 | Growing |
No participant we can identify holds more than a low-double-digit share of the USD 44.80 billion base, and the five largest together account for well under half of it. On the standard taxonomy that makes this market moderately consolidated, which is the classification applied to this report. The concentration that matters is not at the market level but at the layer level: sensor supply is concentrated in a handful of Asian foundries and design houses, and the identity primes face almost no competition for very large national programmes.
The substitution question nobody in tier one wants to answer
The most serious competitive threat to this market does not come from a competitor in it. It comes from the device platforms deciding to perform the check themselves. Apple launched Digital ID on 12 November 2025, allowing a US passport to be used to create an identity in Apple Wallet, with acceptance rolling out first at TSA checkpoints at more than 250 airports. Driver’s licences and state IDs in Wallet were already live in 12 states and Puerto Rico, and the capability had launched internationally in Japan with My Number Card. In parallel, Regulation (EU) 2024/1183 obliges member states to offer EU Digital Identity Wallets by the end of 2026.
This is not the end of the market; it relocates it. A wallet removes the need for a relying party to enrol and store a biometric, and it removes the per-check fee for the simplest kind of verification. What it does not remove is the need to decide whether the wallet holder is the person entitled to the entitlement — the age, the visa, the licence, the seat, the bay — and to evidence that decision. The tier that grows through 2033 is the one that sells the decision rather than the reading, and the tier that shrinks is the one that assumed the reading would always be billed separately.
The missing middle
Between the primes and the specialists sits a large population of companies with neither a national programme nor a genuine platform: regional terminal makers, small algorithm houses, card integrators, and systems integrators reselling someone else’s engine. They are the most exposed participants in the market, because they carry hardware economics without hardware volume and software claims without certification. In our interviews, this is also the group most likely to describe the market as difficult — and they are right, for their position in it.
Value Chain
Value chain: five layers, and the one that keeps the margin
Biometrics is usually drawn as a pipeline: capture, extract, compare, decide. That is the engineering view. The commercial view has five layers with very different economics, and the striking thing about the 2025 base is that the layer everyone can name — the sensor — is the smallest and the weakest of them.
The shares below are of the USD 44.80 billion 2025 base, and they are a Pheonix model build-up on a different axis from the end-market split in Table 1: a border gate appears in the border end-market and again in the device layer, because these are two cuts through the same revenue, not two additions to it. Read them as the answer to “where in the chain does the money get booked”, not as a second market.
Layer 1: sensing and capture — 15 per cent
The sensor die, optics, infrared emitters, camera modules and the thin-film layers that make an optical fingerprint sensor work under glass. This is where the volume is and where the pricing power is weakest. Goodix‘s own 2024 summary is the clearest disclosure in the sector: shipments up 5.5 per cent to 1.25 billion units, revenue down 0.8 per cent to RMB 4,375 million, with gross margin improving from 40.5 to 41.8 per cent only because chip procurement costs fell and product mix improved. A supplier that grows units, loses revenue and gains margin by buying its input more cheaply is not pricing its product; it is managing a deflating one. The adjacent, less commoditised half of this layer — short-wave infrared, 3D structured light, ultrasonic — carries better pricing but is a small fraction of unit volume. Our global sensors report covers the wider component economics this layer sits inside.
Layer 2: matching and liveness — 22 per cent
Feature extraction, template generation, matching, and the presentation-attack detection that decides whether an image came from a person or from a screen, a print or a synthetic stream. Historically the moat, because accuracy was hard. It is no longer a moat, because accuracy became a public measurement. The National Institute of Standards and Technology’s 1:N face recognition evaluation has stayed open and kept adding developers — its 2025 updates added entrants every few weeks, from large vendors to university groups — and the practical result is that demonstrable accuracy now arrives with the SDK rather than with the vendor. The differentiator moved sideways, to liveness and to the audit record, which is why the layer holds 22 per cent of value while its unit price falls.
Layer 3: devices, terminals, gates and cards — 27 per cent
The largest single layer, and the least glamorous: access readers, turnstiles, e-gates, self-service kiosks, point-of-sale terminals, rugged handhelds, biometric cards and the enclosures, power and interfaces around them. This is a hardware assembly business with certification overheads attached — IP ratings, vandal resistance, payment scheme approval, border-grade reliability — and it earns a respectable but unremarkable margin. It is also where the volume of the whole market is installed, which makes it the natural point of entry for the platform layer above it. The credential-side version of this argument is set out in our smartphone credential reader report, where the reader deflates and the credential platform takes the value added.
Layer 4: platforms and identity infrastructure — 21 per cent
Automated biometric identification systems for national registers, identity verification orchestration, credential and template lifecycle management, age-assurance services, consent and evidence records, and the workflow that joins a document check to a face check to a watchlist check. This layer is priced per credential, per check or per year, renews without a hardware cycle, and grows with every regulatory instrument that creates a verification event. It is the layer the whole report is about, and it is where IDEMIA, Thales and NEC earn the multiples their hardware peers do not, and where Jumio and Yoti compete without owning a single sensor design.
Layer 5: enrolment, integration and managed service — 15 per cent
Field enrolment, site survey, commissioning, training, help-desk and managed verification. Labour-heavy, low-margin, and structurally necessary: a national enrolment programme or a 200-gate airport deployment cannot be delivered from a licence key. This layer is also where public-sector procurement behaviour is transmitted to the rest of the chain, because the integrator carries the payment risk on a programme that is almost never billed on the schedule it was sold on.
Table 2: layer shares of 2025 value and gross margin bands
| Layer | Share of 2025 value | Typical gross margin band | Pricing model | Direction |
|---|---|---|---|---|
| Sensing and capture | 15% | 20–45% | Per unit | Deflating |
| Matching and liveness | 22% | 60–80% | Per device licence or per check | Deflating on accuracy, rising on liveness |
| Devices and terminals | 27% | 30–45% | Per unit plus certification | Stable |
| Platforms and identity infrastructure | 21% | 65–80% | Per credential, per check or per year | Rising |
| Enrolment, integration and managed service | 15% | 20–35% | Per programme or per seat | Stable |
Margin bands are our reading of disclosed company economics and project-level pricing, not audited figures. They are wide because the layer boundaries are porous: a vendor that sells a terminal with an embedded SDK at 40 per cent gross margin is really earning two margins, and the second one is the one the investor should care about.
Gross margin is not the moat; scale is
The most instructive contrast in the sector is between two component suppliers with completely different gross margins and completely different outcomes. Fingerprint Cards reported a gross margin of 60.7 per cent in 2025 — on gross profit of SEK 47.5 million. High margin, almost no revenue, because it had just wound down the mobile and PC product groups that used to provide the volume. Goodix reported 41.8 per cent on RMB 4,375 million. Lower margin, thirty times the revenue, and a net profit of RMB 604 million that rose 265.8 per cent.
The lesson generalises across the chain. In a deflating component market, gross margin percentage is a vanity metric and absolute gross profit is the only one that funds the next product. The layer that escapes the deflation is not the one with the best margin; it is the one whose revenue is priced per event and therefore grows with the number of events the regulator creates.
What the layer structure means in practice
For a buyer, the implication is that the sensor and the algorithm are the parts you should buy on price, and the platform and evidence layer is the part you should buy on lock-in and exit terms. For a supplier, it is that owning the sensor is a liability unless it is attached to a platform, which is exactly why the card and terminal vendors have spent three years trying to become software companies. And for an investor, it is that the volume data everyone quotes — units, shipments, installed bases — describes the layer of the chain that is shrinking as a share of value. The events are the thing to count.
One further structural note belongs here. Capture hardware increasingly arrives inside estates that were bought for another purpose: the camera that watches a car park, the phone that already has a fingerprint sensor, the door controller that already has a badge reader. Our India video surveillance report makes the same point from the camera side — the camera is a fifth of the bill, and the value sits in what is done with the feed. Face recognition is the clearest case in this market: it is a software upgrade to an installed camera estate, which is why it grows faster than the hardware it runs on and why its addressable base is not limited by sensor shipments.
Investment Activity
Investment activity: capital went to the check, not the sensor
Capital allocation in this market is unusually legible, because three different kinds of money are being spent for three different reasons in the same four years. States are buying verification capacity on a statutory timetable. Component companies are spending to survive a deflating price. And private capital is funding the layer that gets paid per verification. None of those three is investing in the thing the sector is named after.
State capital is the largest investor in this market
The biggest deployments in the 2025–2026 window were public procurement, not private orders. The Entry/Exit System required enrolment and verification equipment, matching infrastructure and integration across 29 European countries, delivered progressively from 12 October 2025 and completed on 10 April 2026. The US federal rule that took effect on 26 December 2025 extended biometric collection to sea exit, private aircraft, and vehicle and pedestrian exit — each of those is a new deployment surface at land and sea ports that previously had partial or no coverage. India’s Aadhaar programme continues to generate volume at a scale no commercial operator can match, with 9.6 crore authentications a day on average in FY2024-25 and face authentication alone reaching 130.5 crore cumulative transactions.
Public capital also sets the shape of private investment, because a programme creates a saleable capability. A vendor that has delivered an e-gate integration in one member state can bid for the next one. A vendor that has never passed a conformity assessment cannot. This is why the compliance documentation discussed in the regulatory chapter is properly understood as an asset rather than a cost — it is the thing public money pays for first.
Component capital is defensive, and it is working
The second channel is recapitalisation and cost reduction at the sensor and card layer, and 2025 produced a clean set of cases. Fingerprint Cards raised SEK 115.1 million gross in a February 2025 rights issue at SEK 0.48 per unit, with about 72 per cent of the units offered taken up, and incurred SEK 23.8 million of transaction costs; it also repaid a SEK 40 million bridge loan during the first quarter. In parallel it wound down its loss-making mobile and PC product groups, taking inventory write-downs of SEK 6.6 million in mobile and SEK 10.2 million in PC, and reduced its operating loss from SEK −421.1 million to SEK −59.2 million. That is not a growth story. It is a company successfully choosing to be smaller.
IDEX Biometrics ran the same play with a strategic pivot attached: operating expenses down by more than half, headcount right-sized, and a deliberate move from component supplier to product company selling biometric access and payment cards. Its 2025 report records four of five objectives delivered or exceeded, with the fifth — received orders exceeding normalised monthly operating expenses — at approximately a quarter of target, attributed to FIDO2 certification slipping into February 2026. The commercial proof points it cites are specific: the first biometric access card compatible with NXP MIFARE DESFire EV3, launches in Japan and Bangladesh, regulatory approval for biometric payments in India, and Microsoft Entra passkey integration.
Goodix took the third route available to a component supplier: keep the volume and manage the cost base. It cut combined selling, general and administrative and research and development expenses by RMB 161 million, a decline of 10.9 per cent, and improved gross margin from 40.5 to 41.8 per cent on lower chip procurement costs. Net profit rose 265.8 per cent to RMB 604 million on revenue that fell 0.8 per cent. This is what disciplined operation of a deflating business looks like, and it is worth being clear that it is not the same thing as a good business.
The failure that reset expectations
Biometric payment cards were the sector’s most confidently funded thesis for a decade, and 2025 was the year the thesis was marked to market. Zwipe, a supplier of biometric card components, filed for bankruptcy in March 2025 — reported at the time by the trade press — after raising tens of millions of dollars of equity; IDEX, which had built sensors specifically for payment cards, cancelled its order relationship with Zwipe in the same month and refocused on access control. Pilot cards were priced in the region of USD 20–25 against a conventional card cost of well under a dollar, and the enrolment, certification and scheme-approval overheads never came down far enough to close that gap at scale.
The correct read is not that biometrics failed in payments. It is that a biometric card is a hardware product competing against a software substitute — the phone in the customer’s pocket, which already has a secure element and a fingerprint sensor that cost nothing incremental. When the substitute is free, a USD 20 card has to be twenty dollars better, and it was not. The companies that survived that lesson did so by moving to access control, where the card has to be a card because it opens a door that has no phone reader on it.
Where private capital is going now
The third channel is the verification and age-assurance layer, and the investment case there is straightforward in a way the hardware case is not. These businesses are priced per check, they carry gross margins in the high sixties or above, they require no fab and no certification cycle beyond their own testing, and their addressable volume is written into statute. The assets they build are less visible on a balance sheet — an attack-detection model trained on hundreds of millions of attempts, an accreditation at the highest level of an independent test standard, a library of document templates, a track record with a regulator — but they are harder to replicate than a sensor design, because they require volume to exist at all.
The constraint on this layer is not capital; it is trust and distribution. A verification vendor’s customers are banks, marketplaces, gambling operators and platforms, and those buyers do not switch providers casually, because a false accept is a regulatory event. That produces long sales cycles and sticky revenue — attractive economics, slow compounding, and a structural advantage to whoever got there first in each vertical.
Table 4: selected capital events, 2024–2026
| Date | Participant or programme | Event | What it tells you |
|---|---|---|---|
| Feb 2025 | Fingerprint Cards | Rights issue, SEK 115.1m gross at SEK 0.48 per unit | Recapitalisation after exiting mobile and PC |
| Mar 2025 | Zwipe | Bankruptcy filing | The payment-card thesis failed at the price point |
| 2025 | IDEX Biometrics | Operating expenses cut by more than half | Pivot from component supplier to card product company |
| 2025 | Goodix Technology | SG&A and R&D down RMB 161m, 10.9% | Cost discipline substitutes for pricing power |
| 12 Oct 2025 – 10 Apr 2026 | EU Entry/Exit System | Progressive deployment across 29 countries | State capital is the largest buyer in this market |
| 26 Dec 2025 | US DHS / CBP | Final rule in force, exemptions removed | New deployment surfaces at land and sea ports |
| Feb 2026 | IDEX Biometrics | FIDO2 certification achieved | Certification, not capability, was the commercial gate |
| 12 Nov 2025 | Apple Digital ID | Passport-based identity in Wallet, TSA acceptance | Platform capital entering from outside the sector |
What the capital pattern implies for the forecast
Three conclusions follow, and they are built into the numbers rather than appended to them. First, the component layer will keep consolidating, because scale is the only defence available in a deflating market and several participants no longer have it. Second, the platform and verification layer will keep attracting capital, because per-check revenue on statutory volume is the best business model in the sector. Third, the most important competitive investment in the window is documentation: conformity assessment capability, accreditation and audit evidence. That is cheap relative to a fab and it is the one thing a well-funded newcomer cannot buy quickly.
There is one omission worth stating. We have not observed a wave of consolidation across national identity primes, and we do not forecast one. Those businesses are politically protected, contractually embedded and frequently treated as strategic national assets. The consolidation that matters commercially is happening one layer down, among terminal makers and algorithm houses, and it is largely invisible in transaction databases because the companies are small.
Technology & Innovation
Technology and innovation: why accuracy stopped being the moat
For about fifteen years the competitive claim in biometrics was accuracy: false-accept rates in the parts per million, ranking tables, and a sales conversation conducted in error rates. That conversation is over, and the reason is not that accuracy stopped improving. It is that accuracy improved in public, at no cost to the buyer, until it stopped being a differentiator.
The evaluation is open, and that is the point
The clearest evidence is the National Institute of Standards and Technology’s Face Recognition Technology Evaluation. Its 1:N identification track has remained open through 2025 and 2026, publishing repeated draft updates — the forty-seventh update to the underlying report was issued in February 2026 — and adding developers at almost every revision. The 2025 cycle alone brought in newcomers ranging from large industrial groups to single-product start-ups and university teams, alongside returning participants such as IDEMIA and NEC. The significance for a buyer is simple: state-of-the-art matching is now a table entry anyone can look up, not a vendor relationship. When the frontier is published every few weeks, the frontier cannot be the moat.
What the ranking does not measure is the thing that actually decides deployments. NIST’s evaluation measures the comparison of images supplied to it. It does not measure what happens when the image is not a face but an injection: synthetic pixels pushed directly into the pipeline by software that never went near a camera.
The attack moved, and the defence had to follow
The cleanest operator data on this comes from Yoti, which says it detected 3.2 million injection attacks across its verification and age-assurance services in 2025, with a single-month peak of 527,013 in August 2025 — the month UK age checks under the Online Safety Act took effect. It reports running over eight million checks a week. The company’s explanation is the one that should worry every buyer reading this chapter: the cost of generating a convincing synthetic face fell, the tools became ordinary, and forums now circulate guidance on which vendors are easy to spoof.
That is why presentation-attack detection, not matching accuracy, became the specification item that decides procurement. The relevant standard is ISO/IEC 30107-3, which defines how attack detection is tested; independent laboratories accredit vendors at successive levels, and the third is the demanding one. Yoti states that its liveness model is the only one to pass iBeta Level 3 evaluation under that standard. We do not repeat that claim as an independent finding — it is a vendor assertion — but it is the right kind of assertion to make in this market, and it is auditable in a way that a marketing accuracy figure is not.
What our primary work found changing in specifications
Across interviews with integrators and identity-verification vendors through 2025 and 2026, the shift in the specification document is consistent and worth stating plainly. Five years ago a requirement set named a false-accept rate and a false-reject rate. Today it names a liveness certification level, a documented attack-detection test regime, a template-protection method, a data-retention period and an audit-log format. Price is compared at the level of cost per successful verification rather than cost per device, which is a different market with different winners.
The consequence is economically important. A sensor is bought once per device. A liveness check is bought once per attempt, and the number of attempts is set by the regulator, not by the buyer’s capital budget. The same specification change that made accuracy a commodity made the check a recurring revenue line.
On-device matching and the attestation turn
The second structural change is where the comparison happens. Matching increasingly runs on the device rather than in a central database: the template stays in a secure element, the operating system returns a yes or no, and the biometric never travels. The consumer version of this is the passkey, where a fingerprint or a face unlocks a cryptographic credential and the biometric itself is not sent anywhere. The enterprise version is a biometric card that performs the match locally — IDEX Biometrics reported in 2025 that it had delivered, with NXP, the first biometric access card compatible with MIFARE DESFire EV3, and that it achieved FIDO2 certification in February 2026 after a delay that pushed deployments into the following year.
This turn matters for the market model in this report because it moves value between layers. On-device matching reduces the amount of central infrastructure a deployment needs, which compresses the platform layer for a given population. But it increases the value of certification, of secure provisioning, and of the evidence that a specific device performed a specific check. The platform layer loses volume and gains price per unit; the device layer gains a reason to exist that a commodity sensor does not have.
Multimodal fusion and the economics of the second signal
Every modality has a failure population. Fingerprints fail on worn or wet skin and on a meaningful share of manual workers. Face fails on identical twins, on occlusion and on ageing templates. Iris needs cooperation and near-infrared illumination. Voice is the easiest to replay. The engineering answer is fusion: combine two independent signals and the false-accept rate falls multiplicatively rather than additively.
Our interviews suggest fusion has moved from a premium feature to a default in two places in particular. Border and immigration systems pair face with fingerprint because the two fail on different populations and the combination survives a traveller who has neither a good fingerprint nor a straight look at a camera. Age assurance pairs facial age estimation with a document or a payment instrument, because no single method is accurate enough at the boundary ages where the law actually bites.
The commercial effect is not that fusion raises the price of a sensor. It is that fusion requires an orchestrator — something has to decide which signals to request, in what order, and what to do when one fails. That orchestrator is software, it is priced per check, and it is the layer this report argues is where the growth sits.
Where innovation is not happening
Honesty requires the negative case. The physics of capture is improving incrementally, not disruptively. Under-display optical fingerprint sensing improved in uniformity and brightness through 2024 and 2025; ultrasonic sensing improved in area coverage. Short-wave infrared and 3D structured light are technically superior and commercially marginal because a camera that works in visible light is nearly free by comparison. There is no imminent sensor breakthrough that changes the market’s cost structure — which is precisely why the value moved off the sensor.
Nor is there a serious answer yet to the template problem itself: a biometric is not a password and cannot be reissued. Template protection schemes, cancelable biometrics and secure enclaves all reduce the damage of a breach rather than eliminate it. That is a technology gap with a regulatory consequence, and it belongs in the risk chapter rather than the innovation chapter.
What to watch in the 2026–2033 window
Four things will tell you whether this chapter’s argument is holding. Whether liveness certification becomes a procurement prerequisite outside the UK and the EU. Whether mobile driving licences and digital identity wallets convert from presentation to genuine verification at scale. Whether on-device matching takes enough share to compress central platform revenue in access control. And whether the cost of a synthetic identity attack keeps falling faster than the cost of detecting one — because if it does, the check gets more expensive, and the check is the market.
Market Risk
Market risk: six things that decide whether the model holds
This report forecasts 11.45 per cent growth on a thesis that is narrow and therefore testable: value migrates from capture to decision. If that migration stalls, the market does not collapse — it reverts to being a hardware business with hardware economics, which is a materially worse market at a materially lower multiple. The risks below are ordered by how much damage each would do to the forecast, not by how likely each is to make a headline.
1. The commoditisation runs faster than the verification layer grows
This is the main risk and it is already visible in the disclosures. Goodix grew units 5.5 per cent in 2024 for a 0.8 per cent revenue decline; Fingerprint Cards wound down its two largest product groups entirely to stay viable. If sensor price deflation runs ahead of the volume growth that offsets it, the capture layer shrinks in absolute terms, not just in share.
The forecast is most exposed through one line. Digital identity verification and age assurance carries USD 21.90 billion of the USD 61.85 billion the market adds by 2033, at 16.79 per cent a year. If that line grew at half the rate — 8.4 per cent, roughly the pace of the civil-ID and workforce segments — it would reach USD 16.97 billion rather than USD 30.80 billion, the 2033 total would be USD 92.82 billion rather than USD 106.65 billion, and the headline CAGR would be 9.53 per cent rather than 11.45 per cent. That is the honest sensitivity: a plausible disappointment on one line removes about two percentage points of growth and roughly fourteen billion dollars of 2033 value. It does not invalidate the thesis, but it is the number to watch.
2. Regulatory timing slips, and procurement slips with it
Every number in this report that is not a disclosed company figure is ultimately downstream of a date. Those dates move. The AI Act’s high-risk obligations for Annex III systems, including most remote biometric identification, were extended to 2 December 2027 through the AI Omnibus — a change that pushed compliance spending out by roughly sixteen months but left the underlying demand intact. The Entry/Exit System itself ran a six-month progressive rollout before becoming fully operational on 10 April 2026, which tells you how these programmes actually land: in phases, with the schedule absorbing slippage and the supplier absorbing the cost of it.
The asymmetry matters. A delayed obligation delays revenue but does not cancel it, and the vendor usually carries the working capital in the meantime. This is why we treat regulatory delay as a timing risk rather than a demand risk, and why the forecast is built on the obligation existing rather than on it arriving on the advertised date.
3. Litigation and the consent record
In the United States, the Illinois Biometric Information Privacy Act remains the operative constraint on private deployment, and the 2024 amendment does less than it is often said to do. Public Act 103-0769, effective 2 August 2024, makes an electronic signature sufficient for written release and limits a person who is collected from or disclosed more than once to a single violation and at most one recovery. What it does not do is remove the consent obligation, the retention policy obligation, or the private right of action — and the statutory damages of USD 1,000 for a negligent violation and USD 5,000 for an intentional or reckless one still attach per person.
The practical risk is not the size of a single award; it is that a consent-record defect is systematic, and a systematic defect across a workforce or a user base is a class. Our primary interviews suggest the market has responded rationally: consent capture, retention scheduling and deletion evidence have become product features that buyers now ask for by name. That is a risk that has been converted into revenue for the platform layer, which is part of why that layer carries the growth in this forecast.
4. Substitution by the device the customer already owns
The most under-priced risk in the sector is that the check moves into hardware the relying party does not buy. Apple’s Digital ID, launched on 12 November 2025, lets a US passport create an identity in Wallet and present it, with acceptance first at TSA checkpoints at more than 250 airports; driver’s licences and state IDs in Wallet were already live in 12 states and Puerto Rico, and the capability had launched in Japan with My Number Card. Regulation (EU) 2024/1183 requires member states to offer digital identity wallets by the end of 2026.
Where a wallet performs the biometric comparison on the holder’s own device and discloses only an attribute, the relying party stops paying for a verification event and starts accepting an assertion. That is a genuine substitution, and it is why we model the credential-issuance layer as flat to declining in real terms even as verification volume grows. The defence is that a wallet answers “is this person who they say they are” and not “is this person entitled to this bay, this seat, this visa, this age-restricted service” — and the entitlement decision, plus the evidence of it, remains payable. If that distinction erodes, the forecast is wrong in its most important line.
5. Supply concentration and geopolitical exposure
This report rates geopolitical exposure high, and the reason is structural rather than political. Capture hardware — sensor die, optical stacks, infrared emitters — is concentrated in a small number of East Asian design houses and foundries, and the largest supplier visible in public filings is Chinese. A market whose component layer depends on one region and whose demand layer depends on North American and European procurement is exposed to any divergence between the two. The exposure is asymmetric: a supply restriction raises cost in a layer that is already deflating, while a procurement restriction removes revenue in a layer that carries the growth.
Localisation requirements compound it. National identity programmes increasingly carry data-residency and in-country-processing conditions, which fragment the platform layer into national instances and raise the cost of serving each one. That supports local integrators and it penalises scale — the opposite of the economics that make the platform layer attractive.
6. Procurement cycles and payment behaviour
The demand in this market is institutional, and institutions pay late. A programme sold in one budget year is delivered in the next and paid in the one after that, and the integrator funds the gap. In our interviews this showed up as the single most common commercial complaint, more common than price pressure: not that the order was lost, but that it was won and then financed by the supplier for eighteen months.
This matters for the forecast because it is the mechanism by which a growing market produces failing companies. A vendor can be correct about demand, win the contract, and still run out of cash. It is also why the component layer’s consolidation is happening faster than the demand data would suggest it should.
7. Our own model risk
Three figures in this report are ours alone: the end-market split, the modality split and the regional split. They reconcile to the USD 44.80 billion base and they are built from disclosed shipment and revenue data where disclosure exists, but they are estimates. The volume series is our own cross-checked estimate rather than a single published shipment count. Anyone using the value-per-unit figures should understand that they mix sensor average selling prices with software and service revenue, so the 53.8 per cent increase is a composition effect, not evidence of price inflation anywhere in the chain.
What would falsify the thesis fastest is a year in which verification revenue grows but is not attributable to biometrics — that is, a year in which age assurance and identity verification grow on document checks, database checks and device attestation while the face and the finger become optional. We would see that first in the disclosed revenue of the verification specialists and in the mix disclosures of the primes. It is the series to watch, and it is the reason this report puts the layer split in Table 2 rather than leaving it as commentary.
Regulatory Landscape
Regulatory landscape: the calendar is the demand curve
In most technology markets, regulation is a constraint on growth. In this one it is the growth. Every large verification population in the world was created by an instrument with a date on it — a border regulation, an age-assurance duty, an identity framework, a data protection statute with a consent requirement. The 2026–2033 window contains an unusually dense sequence of those dates, and the forecast in this report is built on them rather than on consumer enthusiasm.
The EU AI Act: prohibition now, conformity later
The AI Act entered into force on 1 August 2024 and applies from 2 August 2026, with staged exceptions that matter enormously for biometrics. The prohibited practices took effect on 2 February 2025, and the list includes real-time remote biometric identification in publicly accessible spaces for law enforcement purposes, biometric categorisation inferring sensitive attributes, and emotion recognition in the workplace and in education. Obligations for general-purpose AI models applied from 2 August 2025. Remote biometric identification, biometric categorisation and emotion recognition outside the prohibitions sit in the high-risk class under Annex III, alongside systems used in migration, asylum and border control.
The timetable for that high-risk class has moved, and anyone still working from the original dates will be wrong. Following the simplification package known as the AI Omnibus — proposed on 19 November 2025, politically agreed on 7 May 2026 and in force from 27 July 2026 — the obligations for Annex III high-risk systems, including biometrics, now apply from 2 December 2027, while high-risk AI embedded in products already covered by Annex I legislation has until 2 August 2028. The European Commission’s own regulatory framework page sets out the current position.
The commercial consequence is not a delay in demand; it is a delay in compliance cost, and a widening gap between vendors who can produce conformity documentation and those who cannot. High-risk status brings risk management, data governance and dataset quality obligations, activity logging, technical documentation, human oversight, and demonstrated robustness and cybersecurity. For a national programme, that documentation is a qualification to bid. For a small algorithm vendor, it is a fixed cost that arrives before any revenue does.
The Entry/Exit System: the largest biometric programme ever run in Europe
The EU Entry/Exit System replaced passport stamping with a digital record of entries, exits and refusals for non-EU nationals on short stays, capturing facial images, fingerprints and travel document data. It began operating on 12 October 2025 with a progressive roll-out across 29 countries over six months, and became fully operational on 10 April 2026. The Commission reported over 45 million border crossings registered before full operation, and cited cases of identity fraud detected precisely because biometric data now follows the traveller across documents. The legal base is Regulation (EU) 2017/2226 as amended by Regulation (EU) 2025/1534; the Commission announcement and the official EES FAQ are the primary sources.
This is the single most important fact in the 2025 base year. It is a programme, not a product cycle: gates, kiosks, enrolment devices, matching infrastructure and integration across hundreds of border crossing points, with a six-month progressive phase that itself had to be managed. It also created a permanent operating obligation, because every crossing is a verification event for as long as the system exists.
Wallets: Regulation (EU) 2024/1183 and the end-2026 deadline
The European digital identity framework requires member states to provide citizens, residents and businesses with an EU Digital Identity Wallet built to common specifications by the end of 2026. The wallet supports online and offline authentication, selective disclosure of attributes, qualified electronic signatures at no charge to the individual, pseudonyms and a transaction log, and its use is voluntary with explicit protections against discrimination. The EUR-Lex summary of Regulation (EU) 2024/1183 is the accessible primary reference.
For this market the wallet is double-edged, and we model it as such. It creates a very large verification population and a standards-based route for private relying parties to accept government-issued attributes, which supports the platform layer. It also moves the biometric comparison onto the citizen’s own device in many flows, which removes a per-check fee from the relying party’s bill. Our forecast puts the net effect positive for the identity-verification layer and negative for the credential-issuance revenue that wallets replace.
Age assurance after the UK Online Safety Act
Ofcom required services that allow pornography to have highly effective age assurance in place by July 2025, and published a non-exhaustive list of methods capable of meeting that standard which includes facial age estimation, photo ID matching, open banking, mobile network operator checks and digital identity services. Self-declaration and payment methods that do not require the user to be 18 are explicitly not sufficient. Notably, Ofcom declined at that stage to set a numerical accuracy threshold, saying thresholds may complement its four criteria later. The Ofcom guidance is the source.
This is the regulation that created a consumer-scale biometric population outside government. It is also the regulation that created an attack market: as noted in the technology chapter, injection attacks against age and identity checks peaked in the month the duty took effect. A regulatory duty that must be satisfied by every service a child can reach is a larger recurring verification population than any border programme, and it is the main reason we put 16.79 per cent annual growth on the verification layer.
United States: the federal rule, and BIPA as amended
US Customs and Border Protection uses biometric facial comparison at 238 airports, including all 14 Preclearance locations and 66 international departure locations. The Department of Homeland Security’s final rule on collection of biometric data at entry and departure was published on 20 November 2025 and took effect on 26 December 2025; it authorises collection from all non-citizens at airports, land ports and seaports, removes the exemptions for diplomats and most Canadian visitors, removes limits on pilot programmes, and extends collection to sea exit, private aircraft, and vehicle and pedestrian exit. See the DHS announcement and the CBP airports page.
On the private side, the Illinois Biometric Information Privacy Act remains the most consequential statute in the world for any company deploying biometrics in the United States, and it changed in a way that is widely misreported. Public Act 103-0769, effective 2 August 2024, provides that an electronic signature satisfies the written-release requirement, and that a private entity which collects or discloses a person’s biometric identifier more than once has committed a single violation for which the aggrieved person is entitled to at most one recovery. Damages remain USD 1,000 for a negligent violation and USD 5,000 for an intentional or reckless one. The enrolled Act is short and worth reading directly. The amendment limits per-scan aggregation of damages; it does not remove the consent obligation, and it does not remove the class action.
India: the DPDP Rules, and the state-as-platform counter-example
India notified the Digital Personal Data Protection Rules on 14 November 2025, operationalising the 2023 Act and introducing an eighteen-month phased compliance period. Provisions on the Data Protection Board took effect on publication; obligations relating to consent managers begin twelve months later; and the operational requirements — consent notices, security safeguards, breach reporting, retention, children’s data, significant data fiduciary duties and international transfers — apply from 13 May 2027. Consent managers must be companies based in India. The Government of India release sets out the framework.
India is also the counter-example to the assumption that biometric scale requires a private market. UIDAI’s Aadhaar authentication averaged 9.6 crore transactions a day in FY2024-25 against 8 crore the previous year, with a peak of 13.2 crore, and its in-house face authentication passed 130.5 crore cumulative transactions, close to 102 crore of them in FY2024-25 alone, reaching 15.25 crore in March 2025 and a peak of 1.5 crore in September 2025. Those volumes are produced by a public authority, on public infrastructure, at a marginal cost no commercial vendor can match — which is exactly why the commercial opportunity in India sits in the layers above it.
Standards, and why they are now commercial documents
Three standards do commercial work in this market. ISO/IEC 30107-3 defines how presentation-attack detection is tested, and independent laboratory certification against it has become a procurement prerequisite rather than a technical nicety. ISO/IEC 24745 governs biometric template protection, which is where the liability sits if a template is breached. And the FIDO specifications are what make on-device biometrics into a credential, which is why a card vendor treats FIDO2 certification as a commercial gate rather than an engineering milestone.
What the calendar means for the forecast
Count the dates: February 2025 prohibitions; July 2025 age assurance; October 2025 EES; November 2025 the US federal rule and India’s DPDP Rules; December 2025 US rule in force; April 2026 EES fully operational; August 2026 the AI Act applicable; end-2026 EU wallets; May 2027 India operational compliance; December 2027 Annex III high-risk obligations; August 2028 Annex I products. That is eleven instruments in four years, each of which either creates a verification population or raises the cost of serving one badly. A market with that calendar does not need a consumer behaviour story to grow at 11.45 per cent.