
Dark Store Networks & Micro-Fulfilment Market Report, Size, Share and Forecast 2026–2033: 8,400 Stores Earning USD 9,312 a Day Each
There were roughly 8,400 controlled-fulfilment nodes operating worldwide in 2025 — dark stores, micro-fulfilment centres and shop-warehouses outside China's franchise layer — and they processed US$28.55 billion of order value. That is US$9,312 a node a day, or 2,325 million orders at an average of US$12.28. By 2033 the estate reaches 14,500 nodes and US$63.51 billion at US$12,000 a node a day, a 10.51% compound annual rate.
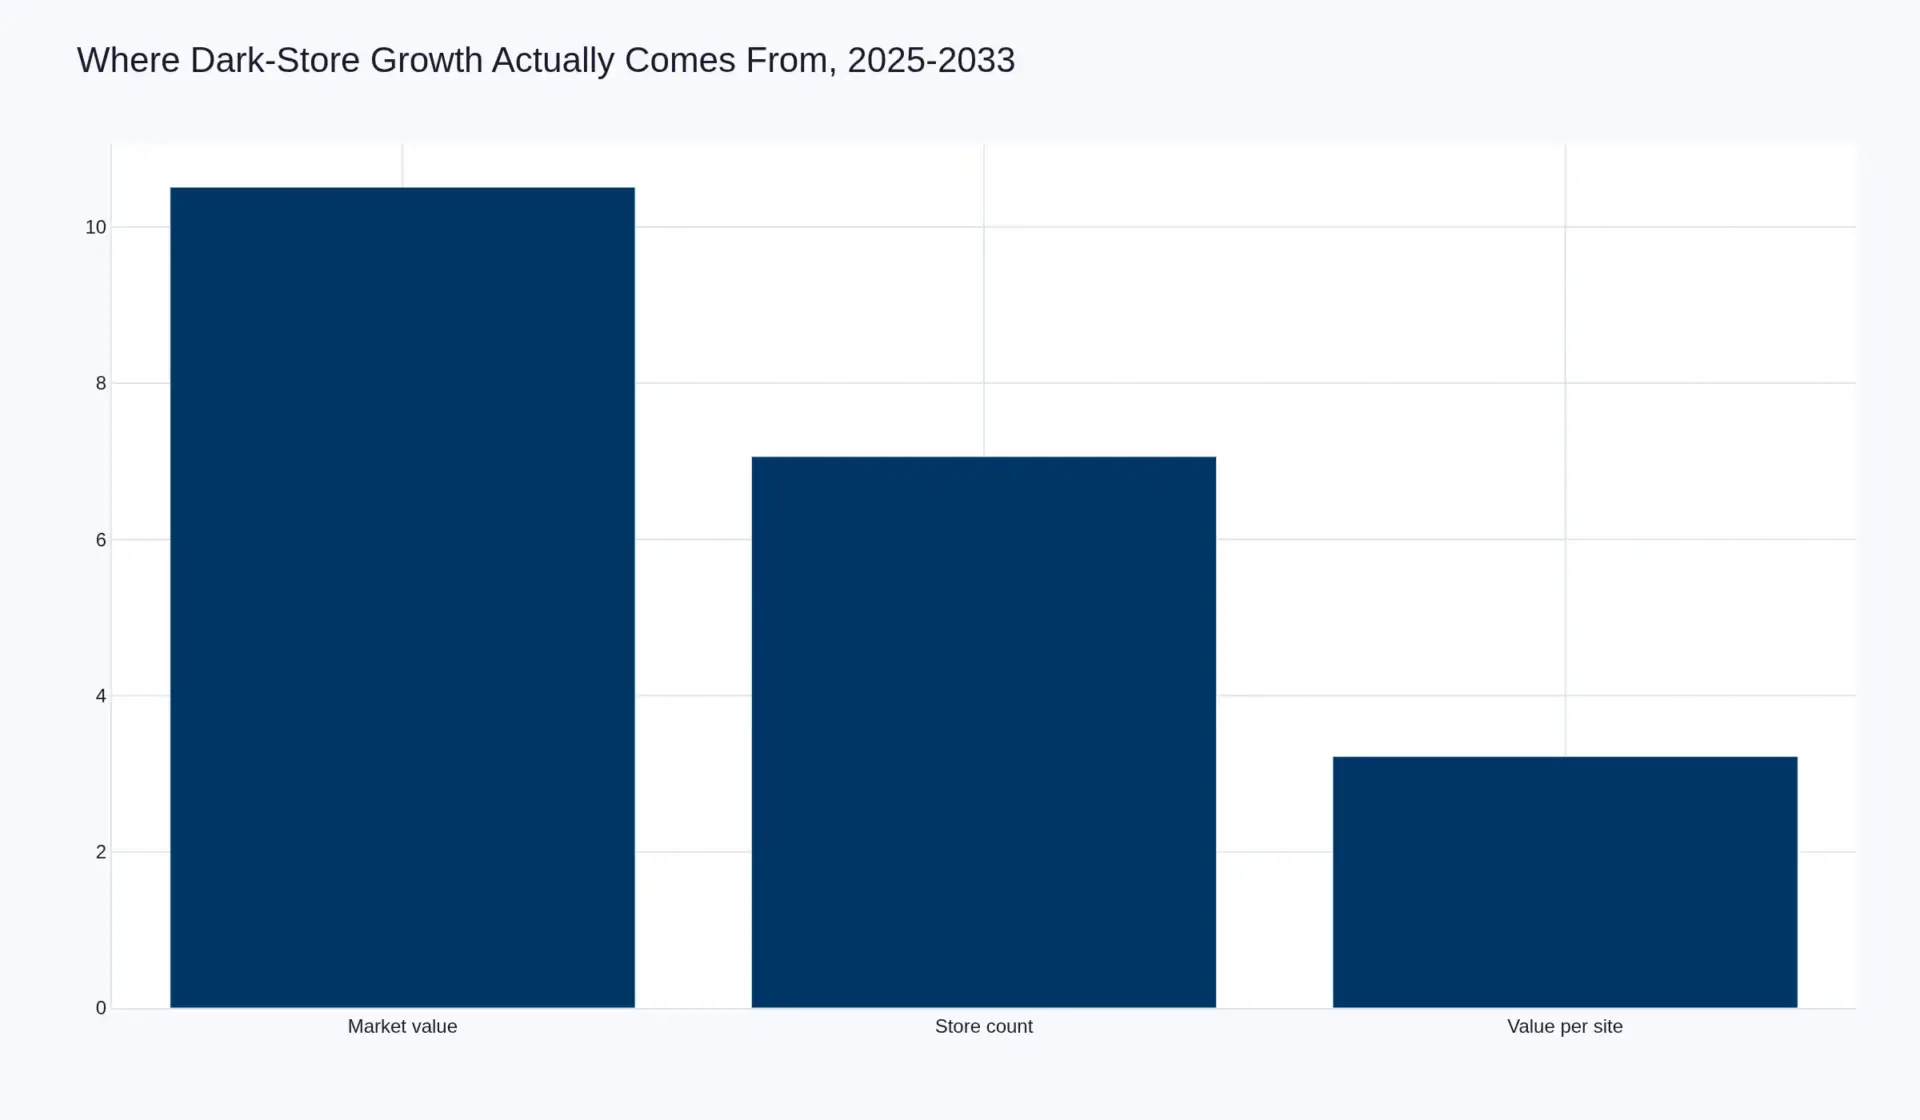
The finding is not the growth rate. It is where the growth comes from. The store count compounds at 7.06% and value at 10.51%, which leaves only 3.22% a year of improvement in value per site — and almost all of that is a larger basket rather than more work per store. Orders per node per day actually fall, from 758 to 727, because the average order rises 3.76% a year while site throughput stays flat.
Put plainly: a dark store in 2033 will process fewer orders a day than a dark store in 2025. The format's growth from here is a property business — more boxes, in more places, each one no busier than the last. Anything that makes a site more productive per day is not in this forecast, because it is not in the evidence.
Market size at a glance
| Nodes, 2025 → 2033 | 8,400 → 14,500 (7.06% CAGR) |
| Order value, 2025 | US$28.55 billion |
| Order value, 2033 | US$63.51 billion |
| CAGR, 2025–2033 | 10.51% |
| Value per node per day | US$9,312 → US$12,000 (3.22% CAGR) |
| Order volume | 2,325m → 3,849m orders (6.50% CAGR) |
| Orders per node per day | 758 → 727 (−0.52% CAGR) |
| Average order | US$12.28 → US$16.50 (3.76% CAGR) |
| Currency and scale | USD, billions |
The only benchmark that predicts anything, and the operator it does not explain
Per-store-per-day order value is the single number that determines whether a dark store makes money, because rent is fixed, labour is semi-fixed and the only variable that closes the gap is throughput. Below roughly a threshold set by local rent and wages, the site loses money at any basket. Above it, contribution turns positive and each additional order is close to pure margin.
India is the only market where three operators publish quarterly figures that allow the comparison, and the same quarter is essential because the estate is growing fast. For the quarter ended 31 March 2026, on disclosed net order value and disclosed store counts:
| Operator | Stores | Net order value | Per store per day | Adjusted EBITDA |
|---|---|---|---|---|
| Blinkit | 2,243 | ₹14,386 crore | ₹704,806 | +₹37 crore |
| Zepto | 1,139 | ₹8,134 crore | ₹784,764 | −₹1,247.5 crore |
| Swiggy Instamart | 1,143 | ₹5,675 crore | ₹545,605 | −₹1,009 crore |
Read the second and fifth columns together and the benchmark breaks. Zepto's stores are the busiest in India — 11% busier than Blinkit's — and Zepto lost ₹1,247.5 crore in the quarter while Blinkit made a profit. Instamart is clearly the weakest on throughput and clearly loss-making, which the benchmark does predict. But the top two invert it.
That inversion is a correction to how this benchmark is usually presented, including by us. Throughput per site is a necessary condition for a dark store to work, and it is not a sufficient one, because the same throughput can be bought. Zepto's order value is generated through a marketplace model with merchant partners selling at a pre-agreed commission and heavy promotional support; Blinkit's through an inventory model where it owns the goods and books the full value. Two different definitions of net order value, two different cost stacks, one throughput number that cannot distinguish between them.
The one-quarter caveat matters too. Blinkit added 200 net new stores in the following quarter, taking the estate to 2,443 and order value to ₹17,132 crore, which is ₹770,625 per store per day, with adjusted EBITDA up to ₹102 crore and margin at 0.6% of order value. A single quarter's throughput on a fast-growing estate is a noisy observation; the direction over five consecutive quarters of margin improvement is the better signal.
Three architectures, three completely different machines
The 8,400-node estate is not one format. It is three, and confusing them is the most common error in this market.
Store-picked. Instacart operated zero dark stores and did 338.8 million orders on US$37,224 million of gross transaction value in 2025 — an average order of US$109.87. It monetises somebody else's shelf, takes a transaction fee and an advertising fee, and converts US$100 of groceries into US$10.10 of revenue and US$2.90 of adjusted EBITDA. Nothing in that model needs a warehouse, and its unit economics are the healthiest in this report.
Small-format dark store. The Indian and Chinese model: 200 to 500 square metres, 3,000 to 25,000 lines, a catchment of two to three kilometres, and 700 to 1,500 orders a day at a basket under US$10. This is the machine the US$32.0 billion mostly measures.
Large-format fulfilment centre. The European model. Rohlik Group runs nine agglomerations across five countries, 22.7 million orders and a €68.0 average order, which is about 6,910 orders a centre a day and roughly €469,880 of order value a site a day. One site does what four hundred Indian dark stores could not, on a basket eleven times larger.
These three share almost nothing. The store-picked model has no property risk. The small-format model has the highest property count and the lowest capex per site. The large-format model has the highest capex per site and the lowest count. A market number that adds them together is describing a dollar of grocery, not a business.
What US$32.0 billion measures, and what it does not
This report measures order value processed through controlled-fulfilment nodes: sites operated by the retail platform or its franchisees, holding stock, from which the order is picked. China's shop-warehouse franchise layer is excluded, because those nodes are independently owned small businesses operating under platform coordination and because including them would make this report a different market — roughly four times larger and economically dissimilar. Store-picked volume is excluded too, which is why Instacart's US$37.2 billion of gross transaction value appears here as a comparison, not as a component.
So the 2025 figure of US$28.55 billion is the dark-store core, and the arithmetic of that core against the global hub report in this cluster needs stating plainly — including a correction to how the first version of this report read it.
The hub measures the dark-store core at approximately US$32 billion in 2026, or 14.0% of its US$228.2 billion broad market for that year. Its 14.02% ratio, however, is struck against the 2025 broad market, and that is the source of the error in the first version of this report: we treated US$32.0 billion as a 2025 figure, found that it did not produce 14.02% of US$203.6 billion, and inferred that the hub was carrying a stale number. It is not. Both hub statements are true once each is attached to its own year, and the 2025 core is therefore 14.02% of US$203.6 billion — US$28.55 billion. That is the base used throughout this report, and the correction is disclosed rather than quietly applied.
The consequence for the cluster is small and worth knowing. If the core is 14.02% of US$203.6 billion in 2025 and US$63.51 billion of US$598.0 billion — 10.62% — in 2033, then the dark-store share of instant retail falls by about 3.4 points across the forecast. That is the real story of this report: the format that defined quick commerce is losing share to the two architectures that do not need it.
Where the next 6,100 nodes go
The forecast adds 6,100 nodes over eight years, and the composition matters more than the total. India already holds 4,525 of the 8,400 nodes — 53.9% of the global estate on 5.7% of the global market's value — because a US$5.89 average order needs a great many sites to reach any absolute revenue. The marginal node in this forecast is therefore overwhelmingly an Indian or a lower-tier-city Chinese one, not a European fulfilment centre and not an American micro-fulfilment centre.
That has a direct consequence for anyone selling into this market. Equipment, refrigeration, racking, last-mile vehicles and shop-fitting demand is driven by node count, which grows 7.06% a year. Software, automation and robotics demand is driven by throughput per node, which grows 3.22% and is concentrated in the small number of large-format sites. The two opportunities are not the same size and they do not grow at the same rate.
What is excluded, and what would change the answer
Excluded: China's shop-warehouse layer; store-picked marketplace volume; restaurant delivery from the same fleets; and any node that does not hold its own stock. Currency is held flat at the rates used in the corresponding market reports so that the compound rates are comparable across the cluster.
One assumption would change the answer more than any other: throughput per node. This report assumes it stays roughly flat in volume terms and rises only with the basket. If Indian and Chinese operators succeed in pushing the average node from 758 to 1,000 orders a day, the market would reach the same 2033 value with roughly a quarter fewer nodes — a materially smaller property opportunity and a materially better unit economics story. The evidence for the last two years runs the other way: node counts are growing faster than volume, which is precisely why orders per node fall.
Section index: contents · value chain · technology · competitive landscape · regulation · investment activity · market risk
Articles on this market
- 8,400 dark stores and not one of them is getting busier — the throughput decomposition, and why equipment demand tracks 7.06% while automation tracks 3.22%.
- The per-store-per-day benchmark does not predict profit, and India proves it — Zepto's busiest stores and its largest loss, in the same quarter.
Sources
The per-store-per-day benchmarks in this report are computed from these operators' disclosed store counts, disclosed net order value and the actual number of days in each quarter.
- Eternal Limited, quarterly shareholders' letters — Blinkit net order value, store counts and order counts.
- Swiggy Limited, financial results and shareholders' letters — Instamart store count, order value and quarterly loss.
- Zepto Limited, UDRHP-I filed with SEBI, June 2026 — store count, net order value and per-order loss.
- Instacart (Maplebear Inc.), Form 10-Q for the quarter ended 30 September 2026 — the US node benchmark.
Table of Contents
- Overview and market size
- Value chain: capex, rent, pick, trip
- Technology and innovation: what earns a return per node
- Competitive landscape: three architectures in one number
- Regulatory landscape: planning, land use, labour
- Investment activity: who funds the estate
- Market risk: throughput, capex payback, node distress
- Methodology and exclusions
Competitive Landscape
A fragmented estate inside an oligopolistic channel
The market structure is fragmented and the demand that fills it is not. Thousands of small operators hold nodes; four or five platforms aggregate the orders. That combination is unusual and it is the source of most of this market’s risk: the platform controls the demand and the operator carries the capital, so the two parties have different break-even points and different time horizons.
Tier-one count is five on the operator side: Blinkit (Eternal Limited), Zepto, Swiggy Instamart, GoPuff and Rohlik Group. None of the five is the largest holder of nodes in the world, because the largest holder is China’s shop-warehouse franchise layer, which is disaggregated into tens of thousands of individually owned businesses and is excluded from this report’s perimeter.
What actually differentiates operators
Not technology, and not brand. Four things separate the operators that hold a viable estate from those that do not.
Order density per catchment. The number that sets the cost per trip. Blinkit’s 1,120 orders a store a day is a different business from Instamart’s 988 in the same market, and the difference compounds through every cost line.
Basket. A US$5.89 order in India needs four times the trips of a US$21 order to move the same value. This is why the Indian estate is 53.9% of the global node count and 5.7% of the global market’s value.
Ownership of the shelf. An inventory model books the goods, buys margin and controls assortment. A marketplace model takes commission and controls neither. The two are not comparable on gross margin and should not be.
Site acquisition. The binding constraint in every mature market is not capital or demand but the availability of a 200 to 500 square metre ground-floor unit with loading access inside a dense catchment at a rent the throughput can carry. Operators who can do a lease quickly and cheaply win the estate before anyone notices they are winning.
The consolidation that has not happened
Recent M&A activity is recorded as no, and that is a finding. A fragmented estate with thousands of small balance sheets is exactly the structure that consolidates in a downturn, and it has not. The reason is that the platform has no reason to own the box: a distressed node can be reseeded with a new franchisee or a new operator without the platform buying anything. The platform keeps the demand and the brand; the capital is someone else’s problem. That is efficient for the platform and it means the estate will consolidate on the operator side repeatedly while the market structure at the top never changes.
Value Chain
Capex, rent, pick, trip
A dark store’s cost structure is nearly fixed and its revenue is entirely variable, which is why the format has a cliff rather than a slope. The chain runs like this:
Fit-out and initial stock. A small-format node requires racking, refrigeration, lighting, a picking system and enough stock to be credible on day one. This is the capital a franchisee or operator commits before the first order, and it is what a failed node sells for when it is sold at 30% of build cost.
Rent. Fixed, contracted, and set by a catchment the operator cannot move. Rent per square metre is the single largest determinant of the throughput a node must reach to break even, and it is the reason the same format works in one district and fails in the next.
Pick labour. Semi-fixed. A node needs a minimum crew to be open, so labour per order falls sharply as orders rise and barely moves below the minimum staffing level.
The trip. Variable, paid per delivery, and the largest single line at a small basket. In India the rider is paid roughly ₹25 to ₹30 an order against a ₹525 average order value and a ₹704,806 to ₹784,764 daily node throughput — which is why order density, not basket, is the dominant variable in that market.
The arithmetic that decides a node
Take an Indian node at ₹704,806 of order value a day and a blended gross margin in the high teens: that is roughly ₹1.2 lakh to ₹1.3 lakh of gross profit a day against a rent and labour base that is largely fixed. At ₹545,605 — Instamart’s throughput — the same cost base produces roughly ₹95,000 to ₹1 lakh. The gap between those two numbers is the whole difference between a viable estate and a loss-making one, and it is a 23% difference in throughput, not a strategic difference.
Why the large-format model has a different chain
Rohlik’s nine fulfilment centres run about 6,910 orders and roughly €469,880 of order value a site a day. At that scale the fixed cost base is amortised over a €68 basket rather than a ₹525 one and the pick, not the trip, is the dominant labour cost. The chain is the same four steps in a different order of magnitude, and the conclusion inverts: in small format, throughput decides everything; in large format, gross margin does.
What the chain means for the market number
Because the estate is a set of fixed-cost boxes, the market’s US$28.55 billion is not a smooth aggregate of improving businesses. It is a distribution: a mass of nodes at or above benchmark, a tail below it, and a value that rises mainly because more boxes are added. Any reader sizing an opportunity off this market should ask which part of the distribution they are selling into.
Investment Activity
Who pays for the box
The estate is funded from three sources with completely different cost of capital, and the forecast’s realism depends on which one dominates.
Platform balance sheet. Company-operated nodes in India and in the large-format European and American model. The capital is on the operator’s books, the lease may be on the balance sheet under current lease accounting, and the return has to clear the company’s cost of capital. Blinkit’s shift to an inventory-owning model moved working capital, not just margin, onto the operator.
Franchise capital. China’s dominant route. Individual operators fund fit-out and initial stock, typically at the low hundreds of thousands of renminbi a node. This is the cheapest capital available to a platform and the most unstable, because a franchisee’s decision to keep funding a loss-making box is a personal one.
Third-party logistics and retail partners. Store-picked models use no capital at all on the fulfilment side; the shelf is the retailer’s. This is why Instacart can run US$37.2 billion of gross transaction value with zero nodes and the healthiest margin in this report.
What one node costs and what it returns
A small-format dark store in India typically requires a fit-out, racking, cold storage and initial stock in the region of a few tens of millions of rupees. At ₹5.5 lakh to ₹7.8 lakh of order value a day and a blended gross margin in the high teens, a node that reaches benchmark throughput recovers its fit-out in well under two years; a node that reaches two-thirds of it does not recover it at all. That cliff, not the average, is what governs whether capital is deployed.
The investment trend direction is rising and the capital intensity is high. But the composition has shifted decisively: the marginal node in this forecast is financed by an operator rather than by a platform, which means the market’s growth rate is now a function of thousands of small investment decisions rather than a few large ones. That is a more fragile funding base and a faster one.
The real assets underneath
There is a genuine property story here that is not yet priced as one. A 200 to 500 square metre ground-floor unit with loading access in a dense residential catchment is a specific and scarce asset class, and the tenants bidding for it are competing with convenience retail, pharmacies and food-service chains. Where the dark-store tenant wins, it typically does so on a lease term shorter than the landlord would prefer. That mismatch is the reason planning and land use are, in practice, the binding constraint on this market in every mature city.
Technology & Innovation
What earns a return inside a node, and what does not
Innovation intensity in this market is high and almost all of the return on it is captured in three places: refrigeration, pick-path and forecasting. Robotics is the fourth and the least important at small format.
Refrigeration is the largest single capital item in a node after the lease and the largest source of operating waste. A well-designed cold chain with zoned temperature and monitored doors is worth more per square metre than any automation at 700 to 1,500 orders a day.
Pick-path and putaway decide labour, which is the largest controllable operating cost inside the four walls. The relevant metric is units picked per hour; Rohlik’s Berlin site set a group record above 150 units per hour after robotic picking arms went live in August 2025, and the gain is real — but it was achieved in a large-format centre with a €68 basket, not in a 300 square metre urban box.
Forecasting decides waste and availability, and it is the one technology that improves with scale rather than with capex. A platform forecasting across 2,443 stores has a data advantage no single franchisee can replicate, which is the economic reason platforms coordinate estates they do not own.
Why robots do not pay in small format
A robotic pick cell costs more than the annual labour it replaces in most Indian and Chinese cities, and the payback requires a throughput and a wage rate that only exist in a handful of markets. The threshold is a simple comparison: cost of the cell divided by labour cost per pick saved, against the asset’s life. At 700 to 1,500 orders a day and Indian wage rates, the arithmetic does not close. At 6,910 orders a day and German wage rates, it does, which is exactly where the deployments are.
Technology maturity
Maturity stage is growth. The software problems are essentially solved, the hardware problems are solved at large format and unsolved at small, and the remaining innovation is in site selection and lease negotiation — which is not technology at all. Patent activity is moderate and concentrated in logistics hardware rather than in retail formats.
Market Risk
Four risks, and the first one is arithmetic
1. Throughput does not improve. The forecast requires 6,100 new nodes to earn their keep. Orders per node per day fall from 758 to 727 across the period, which means each new node is being asked to perform at or slightly below the existing average. If new nodes are sited in thinner catchments — and the marginal site always is — then either the node count or the value has to come down. This is the central risk and it is visible in the data rather than projected onto it.
2. Capex payback sits on a cliff edge. A node that reaches benchmark throughput recovers its fit-out in under two years. A node at two-thirds of benchmark does not recover it at all. Because the cost base is nearly fixed and the revenue is not, the distribution of node outcomes is bimodal: a large number of good nodes and a tail of failed ones, with very little in between. Averages hide this, and the average is what the market reports.
3. Node-level distress. Transfers of shop-warehouses at around 30% of build cost became routine in China by January 2026. That is what a failed node sells for: not a business, but a fit-out. Distress at node level is not contagious to the platform’s P&L in the short run, because the platform can reseed the catchment, but it is contagious to the growth rate two to four quarters later when the marginal operator stops signing leases.
4. Planning and lease risk. Regulatory complexity is moderate for exactly this reason: there is no national or EU-level rule, there are thousands of municipal ones. A refused consent removes a catchment rather than raising its cost, and a short lease on a good site can be lost to a higher bidder at renewal. Neither risk appears in a throughput table and both destroy node economics outright.
Risks assessed as low
Geopolitical exposure is low: the estate is domestic everywhere it operates and the equipment supply chain is not a chokepoint. Substitution risk is moderate: store-picked models substitute for dark stores at the market level, but they do not substitute at the level of a node, so the risk shows up as slower node growth rather than as stranded assets. Overall market risk is moderate and rising with the node count, because a market whose growth is a property business carries property risk.
Regulatory Landscape
No global rule, thousands of local ones
There is no national or supranational framework governing dark stores anywhere. There are municipal planning rules, national food-safety rules, national labour rules and, in some jurisdictions, sector-specific restrictions on retail formats. The approval pathway is multi-jurisdictional and the regulatory complexity is moderate in aggregate precisely because it is fragmented: no single rule is hard, and the sum of them determines where a node can exist.
Planning and land use. This is the rule that matters. A dark store is a logistics use in a residential district, and municipalities treat it as such. Several European cities have restricted new consents on traffic and nuisance grounds; Indian and Chinese cities have been more permissive, treating delivery catchments as civic infrastructure. The pattern is consistent: the constraint arrives as a refusal at the point of expansion, not as a cost increase, which makes it invisible in unit economics and decisive in geography.
Food safety and premises licensing. A node holding fresh and frozen food is a licensed food premises in most jurisdictions, subject to inspection, temperature-record keeping and, in some cases, a named responsible person on site. A franchise model multiplies licensed premises without multiplying the platform’s control over them, and enforcement at franchise nodes is a recurring theme in every market that uses the model.
Consumer and e-commerce rules. Cooling-off rights, substitution rules and labelling obligations apply to a grocery order delivered to a door. Substitution in particular — the practice of sending a different item at a different price — is a consumer-protection exposure that scales with node count.
Employment classification. The picker inside the node is generally an employee of the operator or the franchisee, and the rider is generally not. That split is the single largest legal difference between the inside of a dark store and the last mile from it, and it determines which cost line is exposed to which regulation.
One rule that would change the market
A numerical cap on node density in a catchment would convert a soft ceiling into a hard one and would immediately revalue every existing consent in that city. No jurisdiction has imposed one. It remains the regulation most likely to appear, precisely because it is the only one that would bite.