
India Quick Commerce Market Size, Share, Trends and Forecast 2026-2033
India's quick commerce channel is barely four years old as a material retail format and already carries annual order value on the scale of a large national FMCG distribution network. Blinkit, Zepto and Swiggy Instamart — the three platforms that disclose quarterly figures — together ran about ₹1.02 lakh crore of gross order value in FY26 (April 2025 to March 2026). At the ₹88.3 to the dollar average the rupee held through that financial year, that is roughly US$11.6 billion, and the channel exited the year on a run-rate north of ₹1.2 lakh crore.
The scale arrived faster than for any comparable retail channel in India. CareEdge measured FY25 gross merchandise value at ₹64,000 crore (about US$7.6 billion) after a 142% compound annual growth rate across FY22–FY25 from a near-zero base; one year later the three reporting platforms alone had added roughly ₹38,000 crore. Two facts frame everything that follows: quick commerce is still only about 1% of India's grocery market, and it now accounts for close to one-third of online FMCG purchases in surveyed urban households.
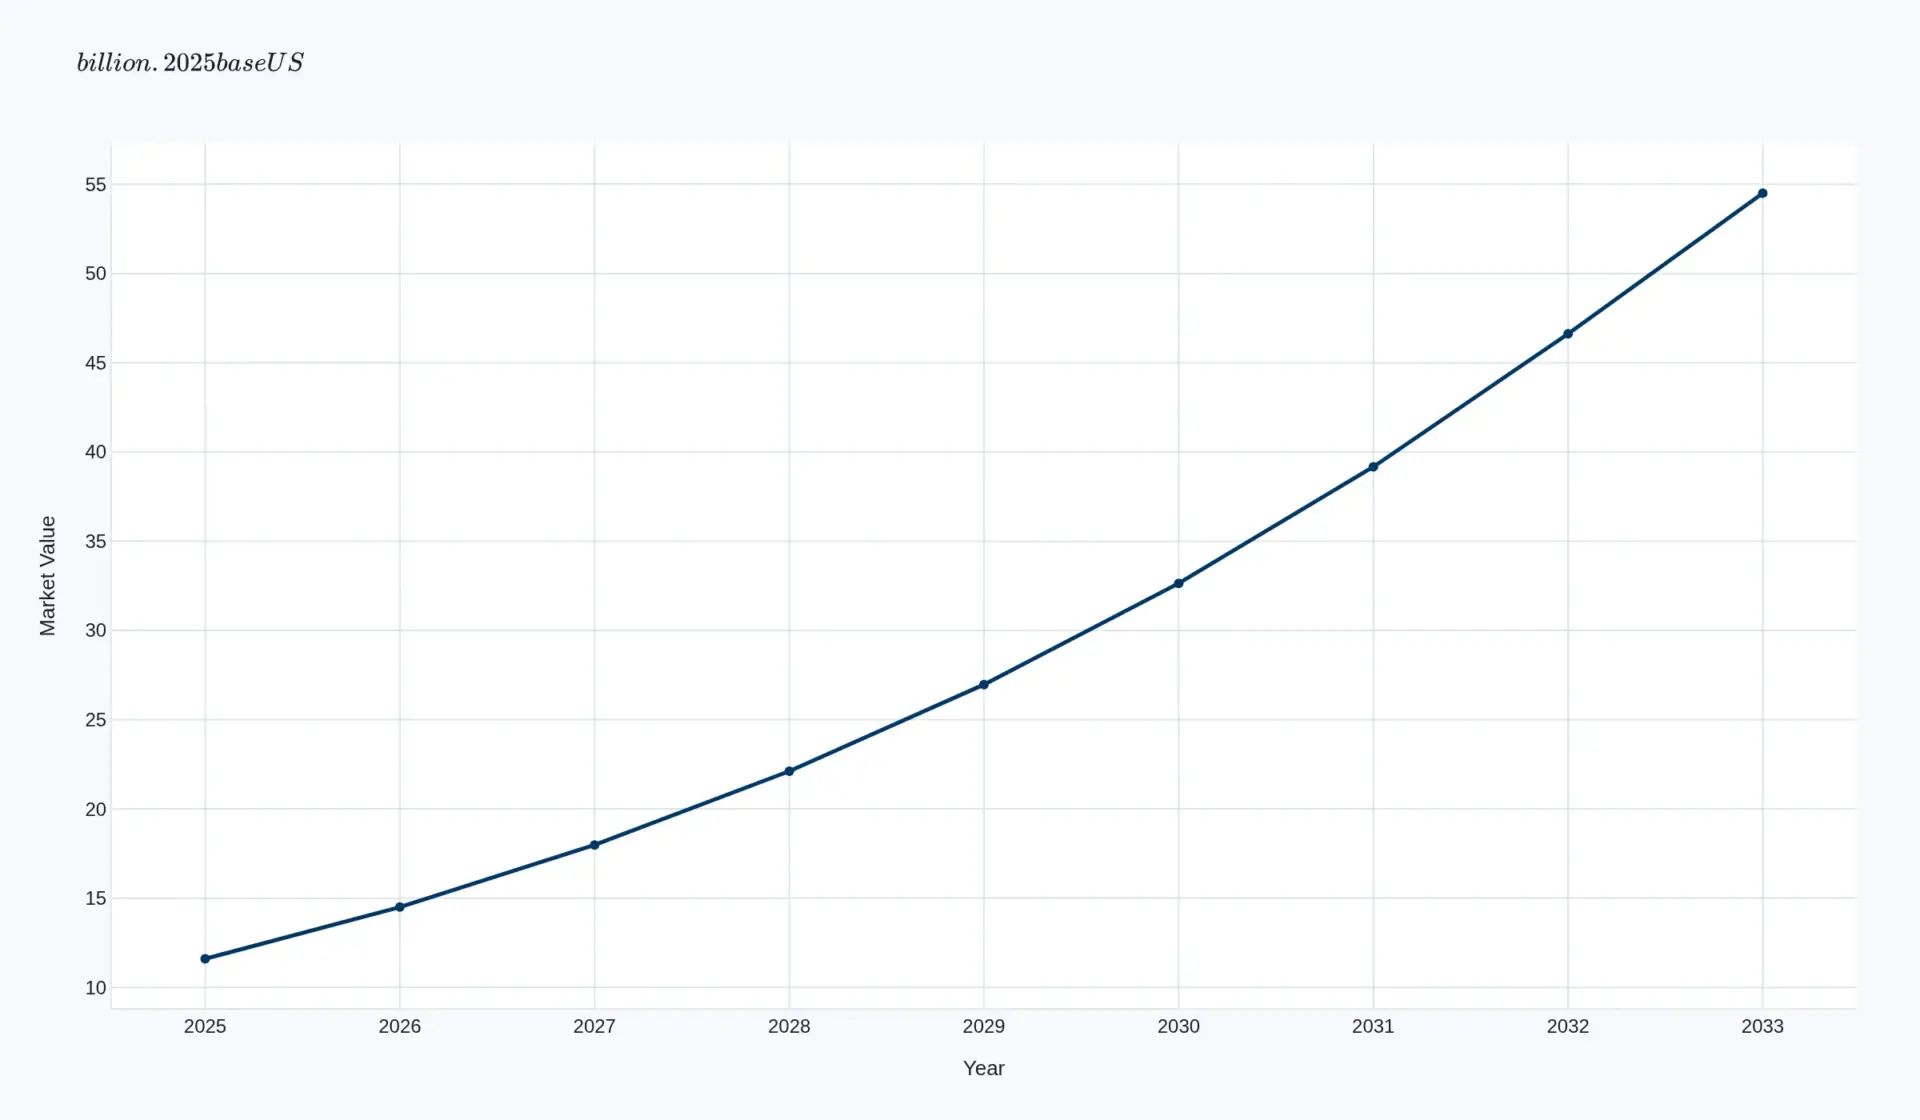
This report sizes the channel at US$11.6 billion in 2025 rising to US$54.5 billion in 2033, a 21.3% CAGR over eight periods. Order volume climbs from roughly 2,040 million orders to 6,480 million on the same path (15.5% CAGR), the 5.8-point gap between the two being average-order-value growth. The 2028 waypoint of US$22.1 billion is consistent with CareEdge's ₹2 lakh crore FY28 projection across the ₹88–95 band the rupee has traded in.
Market size at a glance
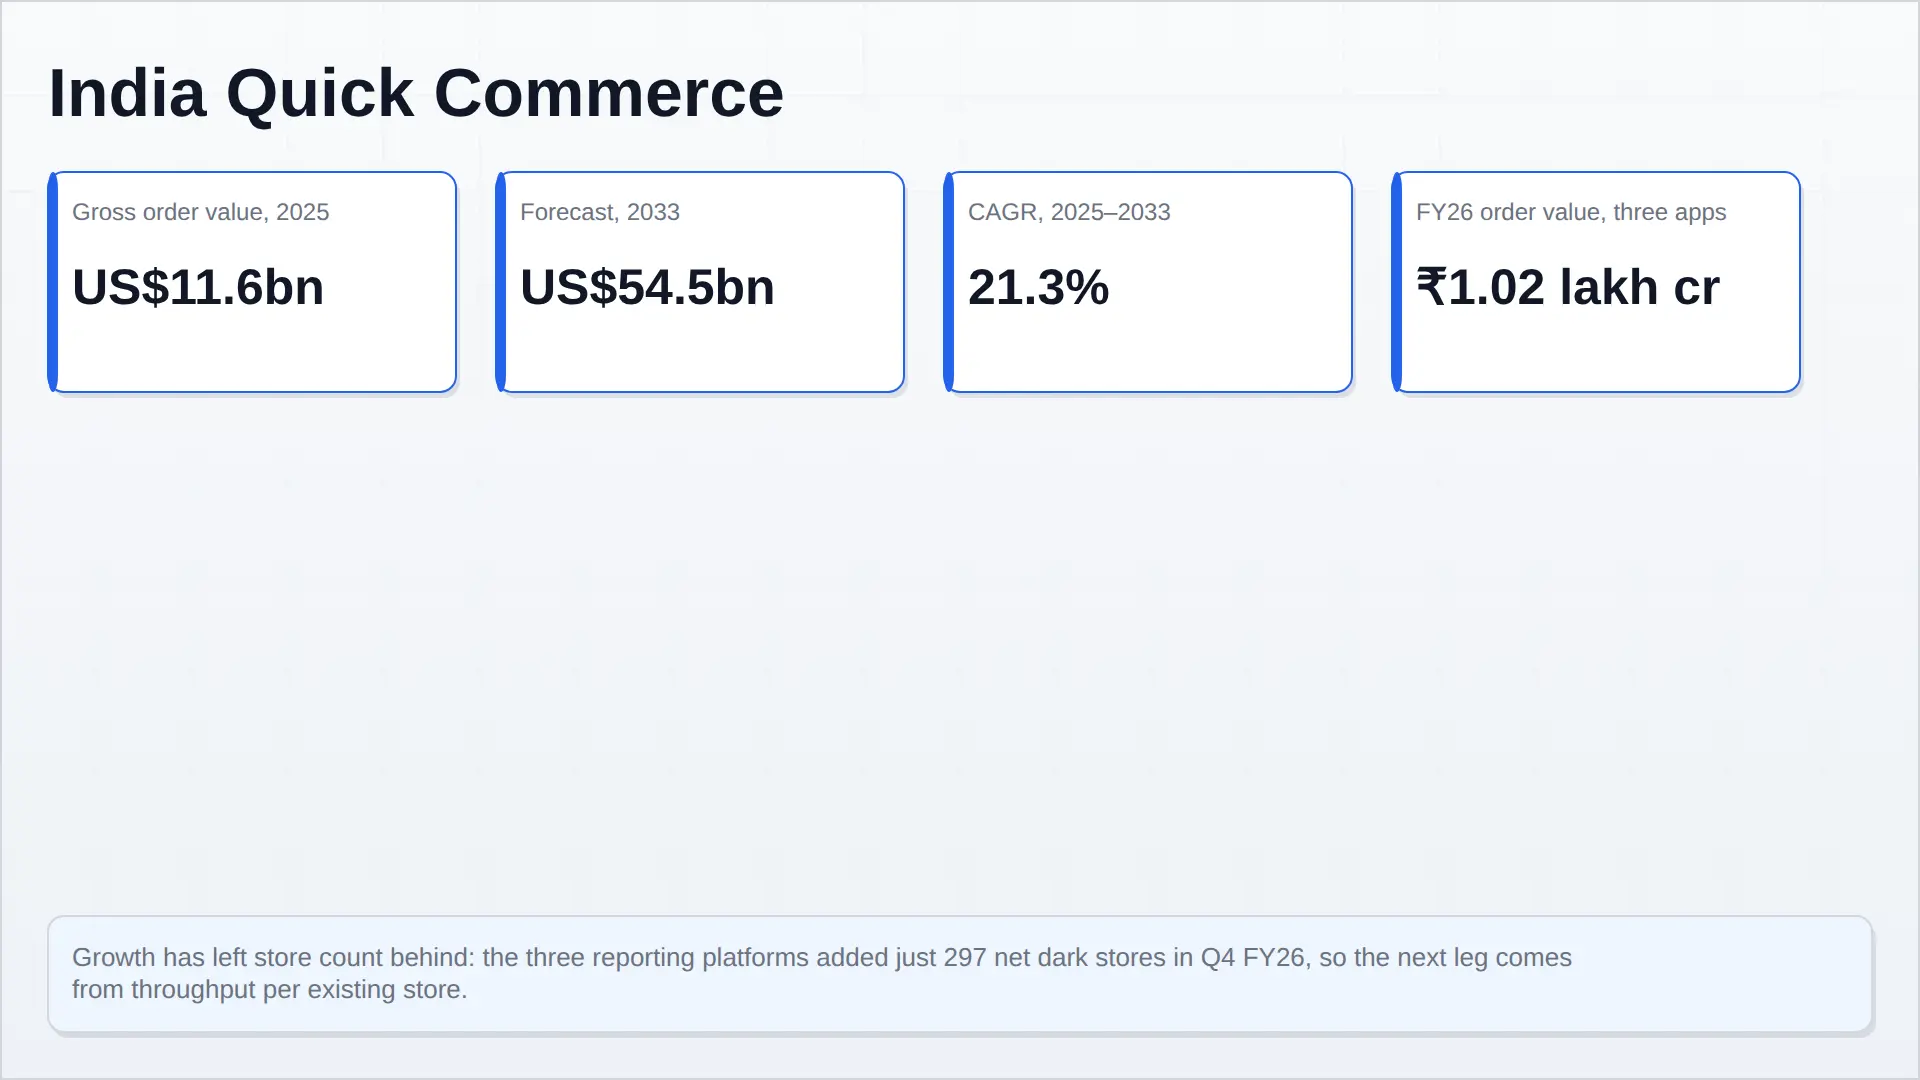
| 2025 market size | US$11.6 billion (gross order value) |
| 2028 waypoint | US$22.1 billion |
| 2033 forecast | US$54.5 billion |
| CAGR, 2025–2033 | 21.3% |
| Order volume, 2025 → 2033 | 2,040m → 6,480m orders (15.5% CAGR) |
| Base currency and scale | USD, billions |
| Reporting platforms, FY26 | ₹102,000 crore combined order value |
The year the channel changed how it measures itself
FY26 was less a growth year than a structural one. Blinkit moved from a pure marketplace to a hybrid marketplace-plus-inventory model from Q1 FY26, so that reported quick-commerce revenue now books the full value of goods where Blinkit owns the stock rather than only commission. The P&L makes the switch explicit: quarterly revenue of ₹1,709 crore in Q4 FY25, mostly commission, became ₹13,232 crore in Q4 FY26, mostly goods. Owning inventory buys gross margin directly, permits private labels and hands Blinkit control of assortment — and it is available to Blinkit specifically because India's foreign-direct-investment rules bar foreign-funded marketplaces from holding inventory, a constraint Eternal's Indian ownership escapes.
Zepto crossed the same bridge in the opposite direction. Until January 2025 it earned service revenue plus wholesale goods sales; from that month it operates as a marketplace with merchant partners selling for a pre-agreed commission, and the inventory leg moved upstream into procurement and distribution, which still booked ₹17,588 crore of traded goods — 78% of FY26 revenue. Instamart stayed a marketplace throughout, which keeps it capital-light and caps how much of each basket it can ever earn: ₹3,859 crore of FY26 segment revenue against roughly ₹28,500 crore of gross order value is an effective take of about 13.5%.
The consequence is that reported revenue is no longer comparable across the three. For anything cross-platform, order value net of discounts is the only honest yardstick, and this report uses it throughout.
What drives the next eight years
Throughput, not store count. The land-grab is over. The three platforms added just 297 net dark stores between them in Q4 FY26 — Blinkit +216, Zepto +74, Instamart +7 — against quarterly additions of 250–300 that were routine a year earlier. Growth now comes from working existing stores harder: Zepto serves 2,140 orders per store per day from 1,139 stores, Blinkit 1,357 from 2,243, Instamart 1,093 from 1,143. The binding constraint is rider productivity, not real estate.
Tier-2 and tier-3 demand. Smaller cities now supply more than half of India's new online shoppers, and the platforms are following with lighter store footprints and slightly longer delivery promises. This is where the incremental millions of monthly transacting users come from, and where the assortment has to be localised rather than templated.
Category expansion beyond grocery. Prepared food, beauty and personal care, small electronics and pharmacy all carry better gross margin than staples and lift basket value. BigBasket has committed to a nationwide ten-minute food service; Reliance has extended quick delivery into fashion. Every category added raises the revenue per square foot of a dark store without raising its rent.
Monetisation, not subsidy. Take rates rose from roughly 7–9% in FY22 to 14–18% by FY25, and platform fee revenue across the channel climbed from ₹450 crore in FY22 to about ₹10,500 crore in FY25, on a path to roughly ₹34,500 crore by FY28 at a 26–27% CAGR. Advertising, membership and brand-funded placement are becoming the profit pool rather than delivery fees.
Payment and connectivity rails. Early 2025 saw 806 million internet users, up 6.5% year on year, on more than 1.12 billion mobile connections, with 270 million online shoppers in 2024. UPI removed the friction from small-ticket, high-frequency purchasing, which is precisely the behaviour quick commerce depends on.
What constrains it
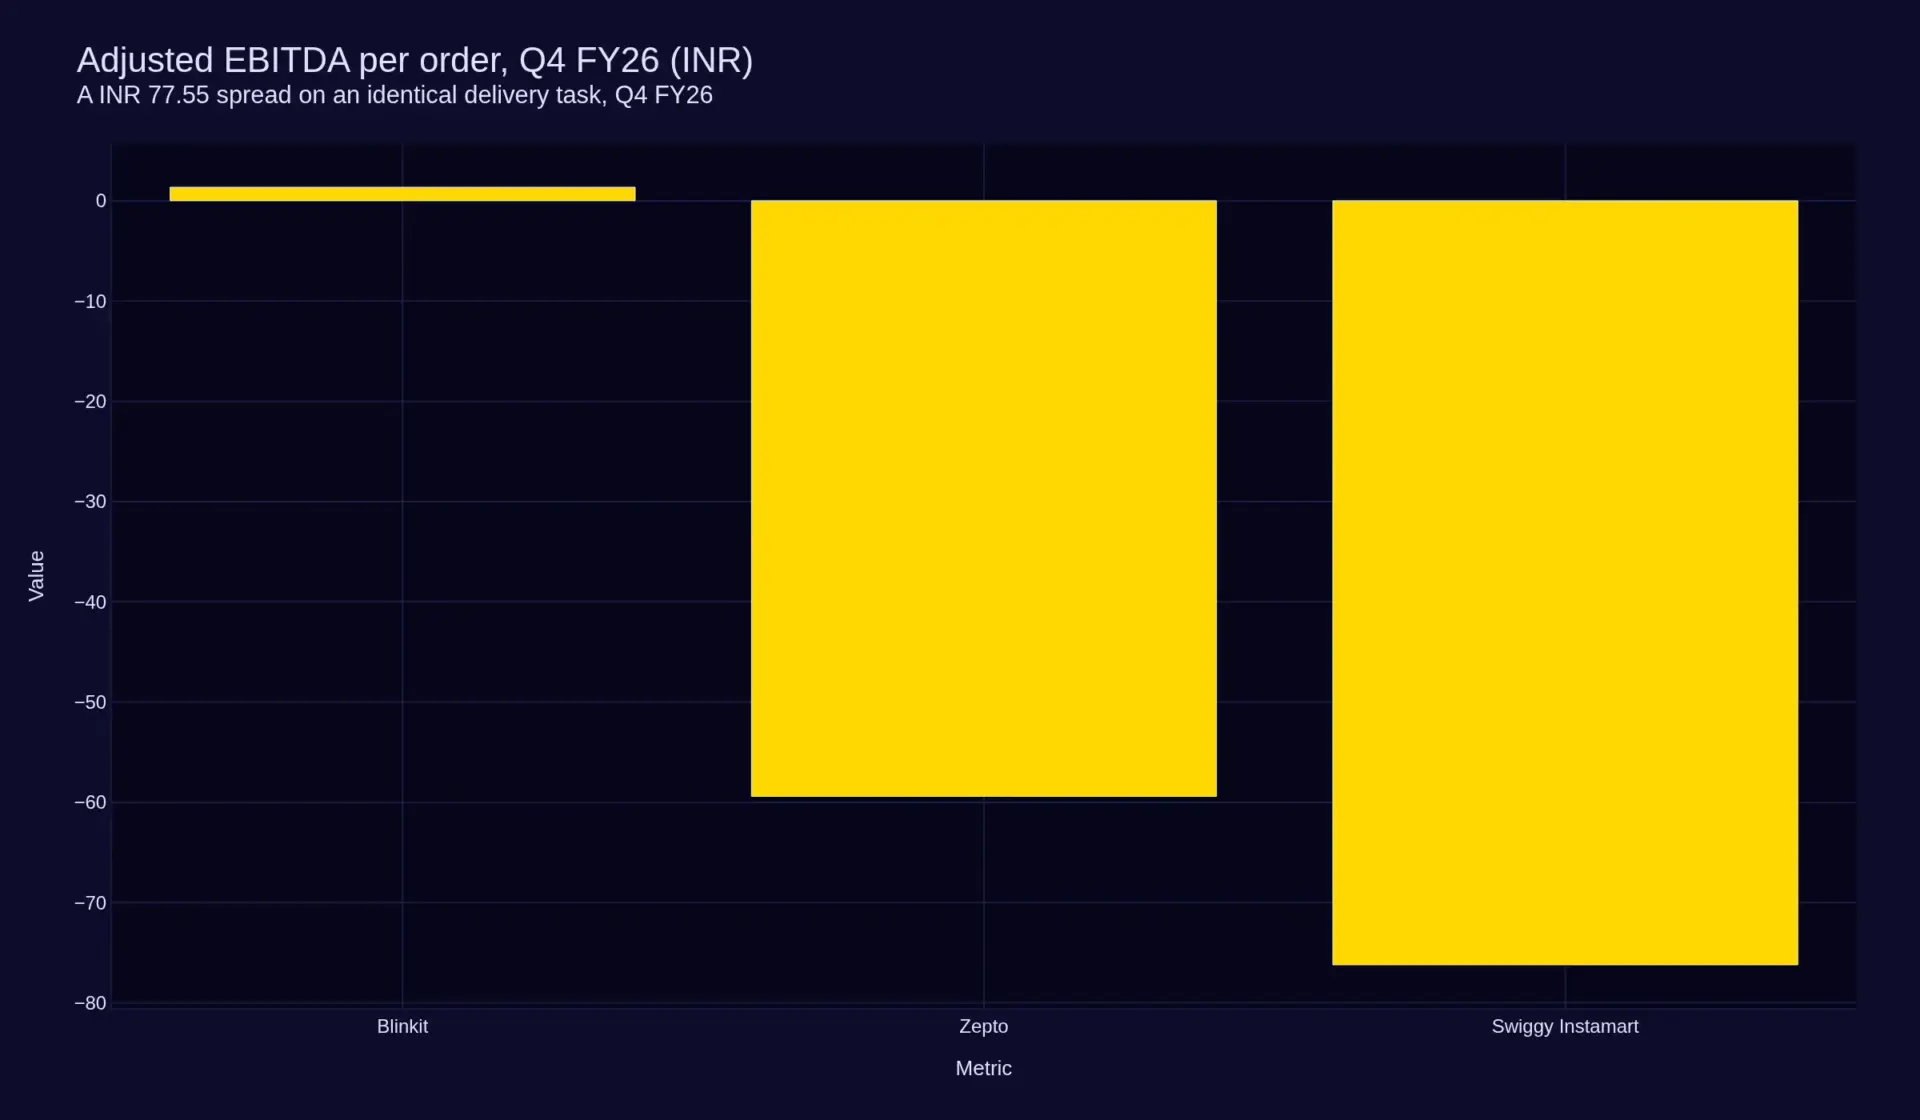
The profitability spread is still enormous. In Q4 FY26, per-order adjusted EBITDA ran +₹1.35 at Blinkit, −₹59.40 at Zepto and −₹76.20 at Instamart — a ₹77.55 gap between best and worst on an identical delivery task.
Capital is the second constraint. Eternal carried ₹17,972 crore of cash against Blinkit's build-out; Zepto's ₹5,681 crore pile, against negative free cash flow of ₹882 crore in the quarter, covers roughly six quarters before its ₹8,010 crore fresh issue lands; Instamart's losses sit inside Swiggy's consolidated result.
Delivery-partner supply is a live bottleneck — Swiggy flagged an industry-wide four-week rider shortage around harvest season and state elections, and every platform's unit economics are hostage to delivery-partner pay inflation.
Discount normalisation is the demand-side risk. Instamart's gross-to-net gap was ₹2,206 crore of platform discounts in a single quarter, 28% of the headline number. As the channel moves from venture-funded growth to listed-market discipline, basket sizes and order frequency have to survive a smaller subsidy.
How the market segments
By category: groceries and staples remain the volume core at roughly half of order value, with fresh produce, snacks and beverages, personal care and pharmacy layering frequency and margin on top.
By delivery promise: the ten-to-fifteen-minute band in dense metro catchments; fifteen-to-thirty minutes in the tier-2 cities now being opened; thirty-to-sixty minutes where store density does not yet support a tighter promise.
By operating model: inventory-led (Blinkit, and the upstream goods leg at Zepto), marketplace (Instamart, and the Zepto storefront since January 2025), franchise-operated stores (Zepto's Growth Partners), and multi-vendor hyperlocal platforms.
By geography: the top eight metros, where Blinkit reports 80–90% pin-code coverage, against tier-2 and tier-3 catchments that carry the next leg of growth and a lower average order value.
Competitive snapshot, Q4 FY26
| Platform | Quarterly order value | YoY | Dark stores | Orders / store / day | Net AOV | Adj. EBITDA |
|---|---|---|---|---|---|---|
| Blinkit (Eternal) | ₹14,386 Cr NOV | +95.4% | 2,243 | 1,357 | ₹525 | +₹37 Cr (+₹1.35/order) |
| Zepto | ₹8,134 Cr NRV | ~+73% | 1,139 | 2,140 | ₹387 | −₹1,248 Cr (−₹59.40/order) |
| Instamart (Swiggy) | ₹7,881 Cr GOV / ₹5,675 Cr NOV | +68.8% | 1,143 | 1,093 | ₹504 net, ₹700 gross | −₹858 Cr (−₹76.20/order) |
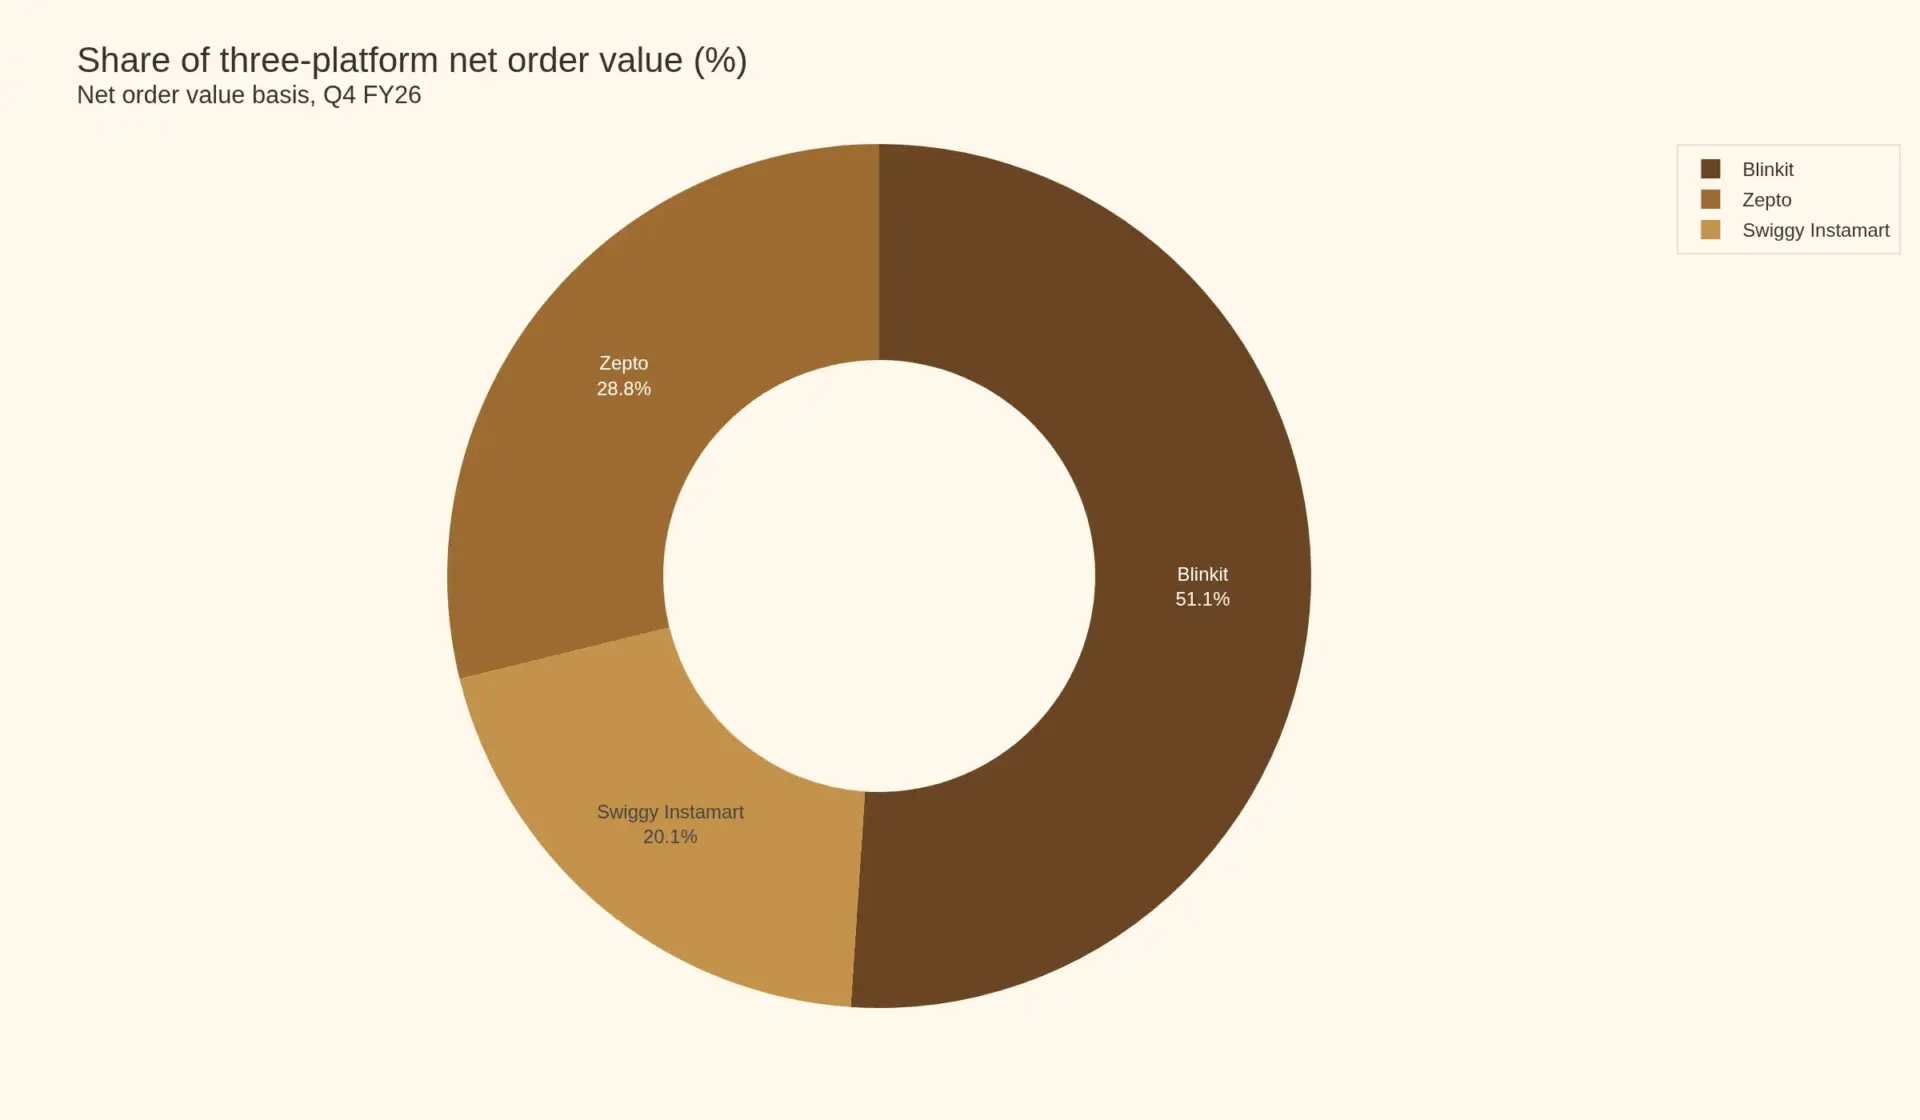
On one net-order-value basis Blinkit holds 51.0% of the three-platform market, Zepto 28.8% and Instamart 20.1%. Count orders instead of rupees and the race tightens to 45.9% / 35.2% / 18.9%, because Zepto's baskets are the smallest in the category.
Outlook
The base case is not a straight line. Growth decelerates from the mid-20s annually through 2028 to the high teens by 2033, as the channel's penetration of grocery moves from 1% toward 4–5% and the incremental store carries thinner density than the last. What holds the 21.3% CAGR together is that both engines are still running: order volume compounds at 15.5% on tier-2 adoption, while basket value grows as non-grocery mix and monetisation deepen.
Upside sits in a faster tier-2 roll-out and a durable move above 20% contribution margin across all three platforms, which would pull forward the profitability that justifies the capital already committed. Downside is a post-listing capital squeeze that forces the discount-led competitor to reprice before its density matures — the scenario in which order frequency, not store count, turns out to be the fragile number.
Articles on this market
- India's three platforms report three different things and call them all order value — net, gross, and where advertising income sits inside the number.
- Zepto pushes 2,140 orders through each store a day. Blinkit pushes 1,357 and makes money — density buys throughput, not basket.
- Every India estimate agrees on 2025 and splits on 2033 — the gap between those forecasts is three definitions.
- The per-store-per-day benchmark does not predict profit — the same quarter across all three operators, with the profit line beside the throughput line.
Sources
This report is built bottom-up from the platform disclosures below and triangulated against the Reserve Bank of India series for currency conversion.
- Eternal Limited, quarterly shareholders' letters — Blinkit net order value, store counts and orders.
- Swiggy Limited, financial results and shareholders' letters — Instamart order value, orders and store count.
- Zepto Limited, UDRHP-I filed with SEBI, June 2026 — net order value, order count and loss per order.
- Reserve Bank of India, reference rate archive — the USD/INR series the FY26 conversion is taken from.
The FY25 and FY28 market-size figures attributed to CareEdge in the text are drawn from its published estimates; no stable public URL for that document was confirmed, so it is not linked here.
Table of Contents
1. Executive Summary
1.1. Market size and forecast at a glance
1.2. What changed in FY26
1.3. Key findings
1.4. Strategic implications
2. Market Definition and Scope
2.1. Definition of quick commerce
2.2. What is measured: gross order value, net order value and revenue
2.3. Platform coverage and exclusions
2.4. Research methodology
3. Market Size and Forecast, 2025-2033
3.1. Base year 2025 and the 1.02 lakh crore FY26 run-rate
3.2. Historical growth, FY22-FY26
3.3. Forecast path to 2033 and the 2028 waypoint
3.4. Order volume, average order value and frequency
3.5. Segment shares by category, speed, model and city tier
4. Value Chain and Fulfilment Economics
4.1. Dark stores and catchment design
4.2. Picking, packing and rider dispatch
4.3. Upstream sourcing and the inventory-led versus marketplace split
4.4. Take rates, brand money and private label
4.5. Unit economics per order
5. Technology and Operational Innovation
5.1. Demand forecasting and assortment localisation
5.2. Throughput engineering and pick-path optimisation
5.3. Payments, search and merchandising
5.4. Fleet electrification and delivery-partner tooling
5.5. Technology maturity and adoption barriers
6. Competitive Landscape
6.1. Market structure and concentration
6.2. Blinkit (Eternal Limited)
6.3. Zepto
6.4. Swiggy Instamart
6.5. The chasing pack: Flipkart Minutes, BigBasket, Amazon Now
6.6. Competitive intensity and share trajectory
7. Regulatory and Policy Environment
7.1. Foreign direct investment and the inventory-model asymmetry
7.2. Dark-store licensing and food safety compliance
7.3. Gig-economy labour and social security obligations
7.4. Open network digital commerce
7.5. Data protection and consumer protection
8. Investment Activity and Capital Structure
8.1. Funding and capital deployed to date
8.2. Zepto’s initial public offering and use of proceeds
8.3. Corporate venture activity and the platform build-outs
8.4. Capital intensity and the path to profitability
9. Market Risk Assessment
9.1. Profitability and cash-burn risk
9.2. Competitive and discount-normalisation risk
9.3. Labour, regulatory and compliance risk
9.4. Currency exposure in a dollar-denominated market size
9.5. Substitution and demand-elasticity risk
10. Outlook and Strategic Implications
10.1. Base, upside and downside paths to 2033
10.2. What to watch: throughput per store and contribution margin
10.3. Implications for brands, distributors and investors
10.4. Conclusion
Competitive Landscape
Competitive Landscape
India’s quick commerce market is an oligopoly with a contested second tier, and the shape of it changed decisively in FY26. Three platforms disclose quarterly figures; those three carry effectively the whole measured market, and behind them a group of deep-pocketed challengers is trying to buy a fourth position with somebody else’s balance sheet.
Structure and concentration
On one common net-order-value base, Blinkit held 51.0% of the three-platform market in Q4 FY26, Zepto 28.8% and Instamart 20.1%. Blinkit’s share has been roughly stable at about half the reporting market for five quarters, drifting from 47.2% to 51.0%; Instamart’s has fallen in every single quarter, from 22.7% to 20.1%; Zepto dipped to 23.8% mid-year while it cut marketing spend and recovered to 28.8% in Q4, taking most of what it regained out of Instamart’s column. Count orders rather than rupees and the race reads tighter — 45.9% Blinkit, 35.2% Zepto, 18.9% Instamart — because Zepto’s baskets are the smallest in the category.
Blinkit is now larger than Zepto and Instamart combined on net order value. That is a genuinely unusual structure for an Indian consumer category four years into its life, and it is the result of a deliberate strategic split in FY26: one platform chose density and throughput discipline, one chose hypergrowth at any price, and one chose a slow margin glide inside a larger parent.
Blinkit (Eternal Limited)
Blinkit ran ₹48,568 crore of net order value across FY26, closing with ₹14,386 crore in Q4, up 95.4% year on year. It fulfilled 273.9 million orders in the quarter, up from 141.7 million, almost entirely on volume: net average order value moved only from ₹520 to ₹525. Monthly transacting customers reached 27.2 million against 13.7 million a year earlier — 99% user growth on 72% store growth, meaning users per store expanded rather than diluted. Its network reached 2,243 dark stores at year end, the largest in the category by a factor of two, having added 216 net in the quarter.
The platform turned a corner on profitability in Q4 FY26 with adjusted EBITDA of +₹37 crore, following +₹4 crore in Q3, a swing of ₹13.91 per order in twelve months. Three forces did the work: throughput per store, contribution margin moving from 3.9% to 5.4% of net order value, and a lower delivery cost per order as rider batches deepened. Management has guided toward US$3 billion of net order value and US$150 million of adjusted EBITDA by FY30 — a target that, on the current rupee trajectory, has already been overtaken by FY26 actuals of roughly US$5.5 billion, which says more about dollar-denominated guidance in a depreciating-currency market than about the underlying business.
Blinkit’s structural advantage is the inventory-led model described in the value-chain chapter and the ₹17,972 crore of parent cash behind it. Its structural vulnerability is that it now runs the largest fixed-cost estate in the category and must keep every one of 2,243 stores above its throughput threshold.
Zepto
Zepto grew net receivables value from ₹5,232 crore in FY24 to ₹12,704 crore in FY25 to ₹24,816 crore in FY26, a 117.79% two-year compound annual growth rate and the fastest scaled growth any Indian quick-commerce platform has reported. Q4 FY26 net receivables value was ₹8,134 crore, up roughly 73%. It operates 1,139 dark stores in 66 cities — about 17 per city — and serves 2.33 million orders a day, or 2,140 per store, the highest throughput in the category. Annual transacting users reached 47.97 million at March 2026.
The cost of that growth is visible in the same filings. FY26 adjusted EBITDA loss was ₹5,041 crore, running between ₹1,009 crore and ₹1,476 crore a quarter, and the per-order loss improved from −₹78.35 to −₹59.40 across the year. Its structure is the most complicated of the three — a marketplace storefront over a wholesale goods pipe, with franchise partners operating some stores — and the prospectus itself lists limited experience operating as a marketplace among its risk factors.
Zepto’s strategic bet is price-led value: everyday low pricing on a smaller basket, monetised through services, at the highest throughput per store in the market. That works only while capital lasts and only if the throughput advantage outruns the basket disadvantage. Its ₹8,010 crore initial public offering is the test of the first condition.
Swiggy Instamart
Instamart closed Q4 FY26 with ₹7,881 crore of gross order value, up 68.8%, and ₹5,675 crore of net order value — a ₹2,206 crore gap that represents platform discounts. It runs 1,143 stores across 129 cities, roughly nine per city, and covers more than 90% of addressable demand by its own account. Orders reached 112.6 million in the quarter, up 27%, while the gross basket swelled from ₹527 to ₹700: Instamart is the only one of the three growing primarily through basket size rather than frequency.
Its recovery is the quietest story in the category and in some ways the most instructive. Contribution margin improved 372 basis points to −1.8%, with March 2026 at −1.1%, and per-order adjusted EBITDA improved from about −₹95 to −₹76.20. Monthly transacting customers reached 13.3 million, up 36%. Instamart’s losses are absorbed inside Swiggy, where food-delivery adjusted EBITDA of roughly ₹297 crore a quarter acts as an internal subsidy — which buys time but also constrains pricing, because every Instamart store competes against roughly twice the Blinkit density in the cities where they overlap.
The chasing pack
Flipkart Minutes, BigBasket and Amazon Now each run an estimated 500 to 800 dark stores and together fulfil roughly 1.75–1.95 million orders a day, against the big three’s 6.6 million. None discloses order value. Their strategic logic differs: Flipkart Minutes is a defensive extension of a marketplace that cannot afford to lose frequency, BigBasket is an incumbent e-grocer converting a scheduled business into an instant one, and Amazon Now appears to be copying the density-over-basket-value playbook directly. Two of them have balance sheets that make a doubling of store count a financing decision rather than an existential one, which is the single largest source of uncertainty in the share table.
Competitive intensity
The intensity is very high and the axes have shifted. FY24 competition was fought on store count and discount depth; FY26 competition was fought on throughput per store, contribution margin and service reliability, with discounting migrating from broad-based coupons into subscription pricing, delivery fees and targeted category offers. That is a healthier form of competition and a harder one to displace: an operator that has already solved throughput does not lose share to a competitor that is still solving it, however much capital the latter has.
Platform scorecard, Q4 FY26
Order value, order counts and margins for the quarter ended 31 March 2026. Blinkit and Swiggy Instamart report net of platform discounts; Zepto’s net order value includes advertising and subscription income, making its figure the least directly comparable of the three.
| Metric | Blinkit | Zepto | Swiggy Instamart |
|---|---|---|---|
| Net order value (INR crore) | 14,386 | 7,591 | 5,674 |
| Year-on-year growth | +95.4% | about +73% | +68.8% |
| Orders (million) | 273.9 | 210.0 | 112.6 |
| Net average order value (INR) | 525 | 361 | 504 |
| Dark stores, 31 March 2026 | 2,243 | 1,139 | 1,143 |
| Orders per store per day | 1,357 | 2,140 | 1,093 |
| Adjusted EBITDA (INR crore) | +37 | -1,247 | -858 |
| Adjusted EBITDA per order (INR) | +1.35 | -59.40 | -76.20 |
| Share of three-platform net order value | 51.0% | 28.8% | 20.1% |
Net order value, Q4 FY26 (INR crore), bar scaled to Blinkit
Orders per dark store per day, bar scaled to Zepto
Source: Eternal Limited Q4 FY26 shareholders’ letter, Swiggy Limited Q4 FY26 shareholders’ letter, Zepto Limited updated draft red herring prospectus dated 8 June 2026. Zepto’s net order value is calculated from its published revenue-from-operations and discount disclosures; order counts and store counts are as filed.
Value Chain
Value Chain and Fulfilment Economics
Quick commerce is not a retail format that happens to be fast; it is a production system whose unit of production is the dark store, and almost every economic question in the category resolves to how hard that unit runs. India’s three reporting platforms closed Q4 FY26 with 4,525 active dark stores between them: Blinkit 2,243, Zepto 1,139 and Instamart 1,143. CareEdge measured the wider category’s estate rising from 1,800 to 3,072 stores in FY25 alone, a 70.7% jump, and average revenue per store up 25% in the same year.
The dark store as the unit of production
A dark store is a delivery-only micro-warehouse of roughly 2,000 to 3,000 square feet, carrying somewhere between 2,000 and 8,000 stock-keeping units depending on catchment affluence, and serving a radius of two to three kilometres. It holds no customers, no trolleys and no checkout: the front of shop is an app, and the back of shop is a pick-and-pack line feeding a rider pool. Because rent, air-conditioning and staff are fixed once a store opens, the entire operating leverage of the model sits in two numbers — orders per store per day and order value per order.
On the first, the spread is wide. Zepto extracts 2,140 orders per store per day from 1,139 stores; Blinkit 1,357 from 2,243; Instamart 1,093 from 1,143.
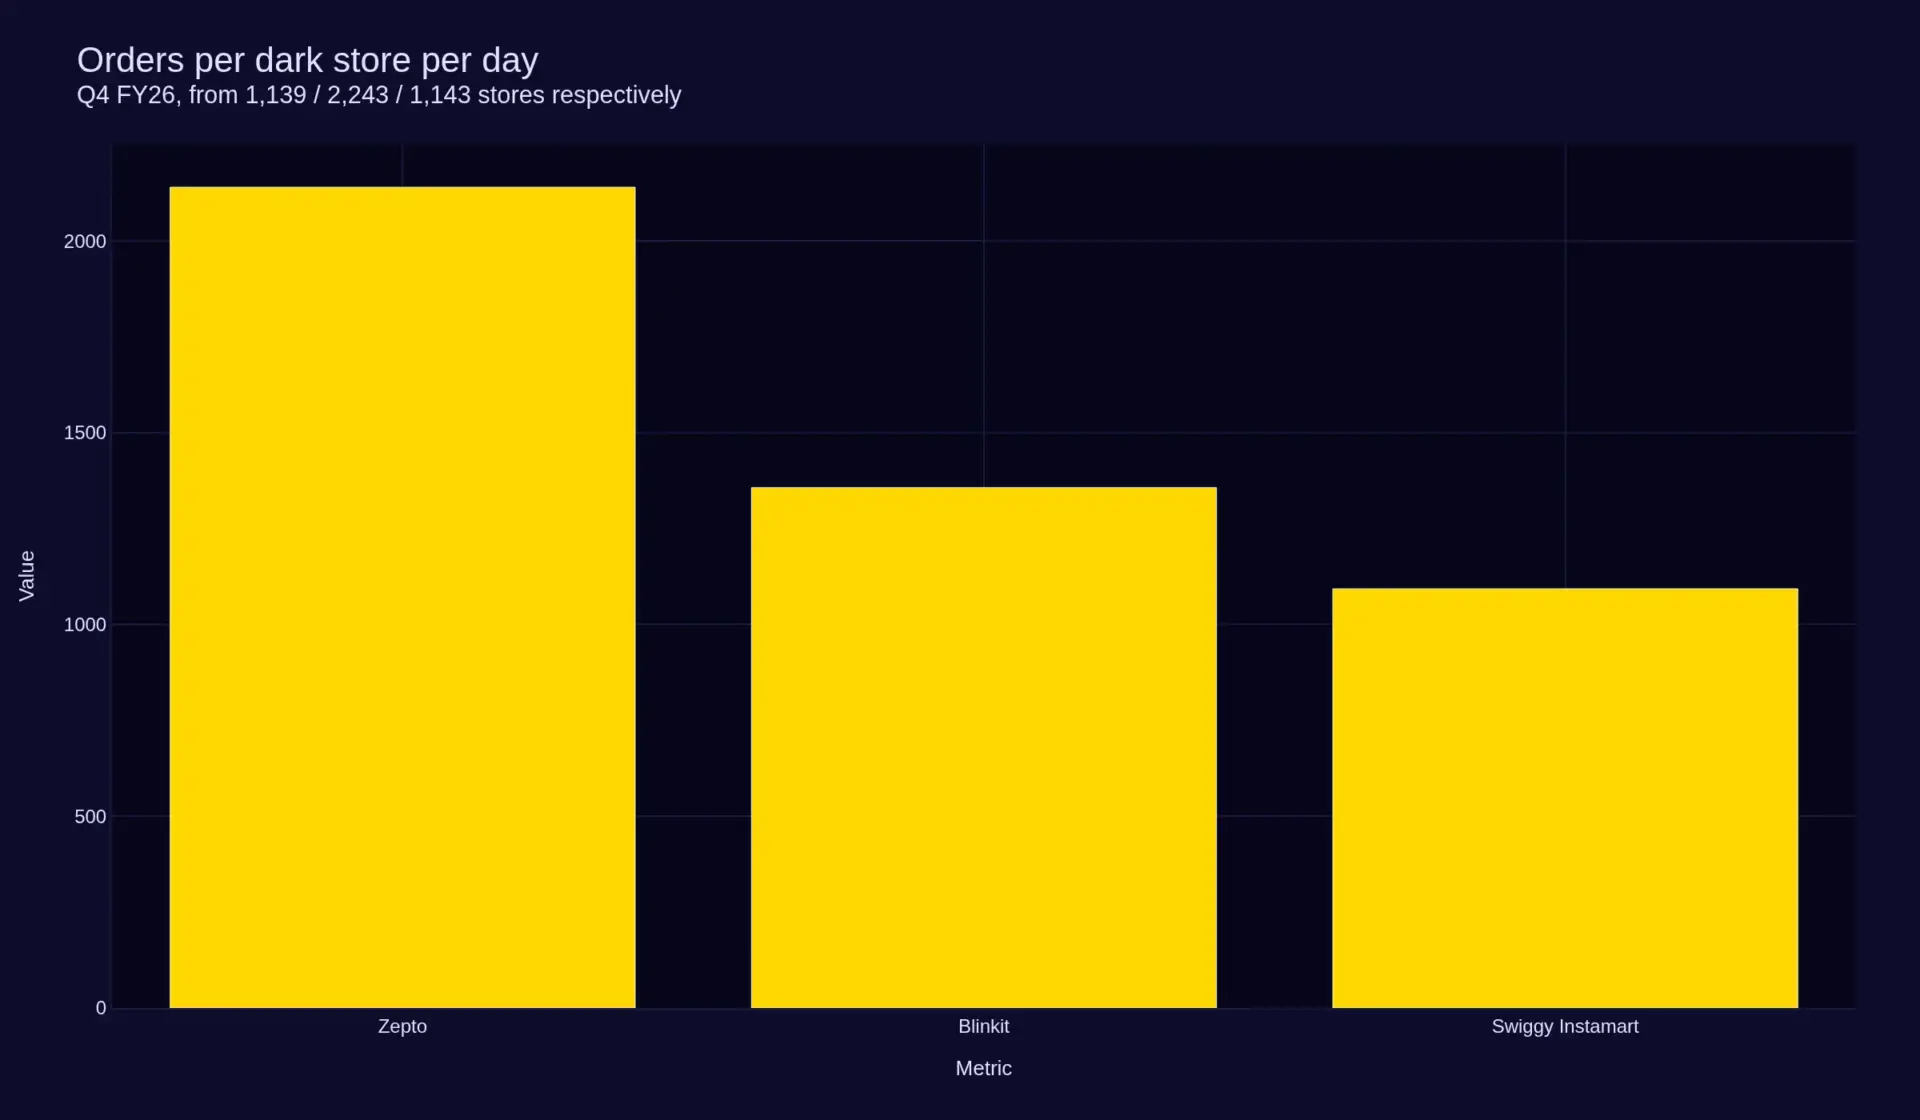
On the second, it runs the other way: Blinkit’s net average order value was ₹525 in Q4 FY26, Instamart’s ₹504 net against a ₹700 gross basket, and Zepto’s ₹387. Blinkit’s average net order value per store per day reached roughly ₹768,000 in Q4 FY26, up from about ₹736,000 a year earlier — a modest improvement in isolation, but earned across a store network that grew 72%, which is what fixed-cost absorption looks like when density is correctly sited.
Picking, packing and the rider hand-off
The internal sequence is uncompromising. An order lands, is batched where items sit close together in the pick path, is picked by a store associate working a layout ordered by velocity rather than category logic, is packed at a station, and is handed to a rider waiting within metres of the pack line. At 2,140 orders a day, a Zepto store is assembling an order roughly every 24 seconds across a working day, which puts the practical constraint on pick accuracy and shelf replenishment rather than on delivery speed. Inventory accuracy is the quiet determinant of everything: a phantom stock position turns a 12-minute promise into a cancelled order and a refund.
Rider economics are the second fixed cost. Delivery-partner pay, packaging and last-mile fuel sit at roughly ₹25–30 per order regardless of basket size, which is precisely why a ₹387 basket at Zepto earns structurally less than a ₹525 basket at Blinkit on an identical delivery task. Blinkit’s 409,000 average monthly active delivery partners imply about 7.4 orders per partner per day. Swiggy flagged an industry-wide four-week rider shortage around harvest season and state elections in FY26, a reminder that delivery-partner supply is a seasonal input rather than a constant.
Upstream: two incompatible procurement models
Behind the store, the category has split into two supply chains that look similar to a customer and nothing alike on a balance sheet.
Inventory-led. Blinkit moved to a hybrid marketplace-plus-inventory structure from Q1 FY26, buying and holding goods in its own right. That converts a negotiated commission into an owned gross margin, makes private label possible, and lets the platform control assortment and shelf allocation directly. It also loads the balance sheet with stock and working capital; Eternal noted a working-capital benefit as seller settlements unwound after the transition. India’s foreign-direct-investment rules bar foreign-funded marketplaces from holding inventory, so this route is available to Blinkit specifically because of Eternal’s Indian ownership — a structural asymmetry no competitor can copy by choice.
Marketplace, with the goods leg pushed upstream. Instamart has been a marketplace throughout, earning pre-agreed commissions, advertising income, user and delivery fees and business-enablement charges without ever owning stock. Its FY26 segment revenue of ₹3,859 crore against roughly ₹28,500 crore of gross order value is an effective take of about 13.5%. Zepto moved the opposite way from Blinkit: from January 2025 its storefront became a marketplace, with the inventory leg relocated into procurement and distribution that supplies its merchant partners — still ₹17,588 crore of traded goods in FY26, 78% of revenue, bought for ₹18,198 crore. Zepto sold merchandise about 3.5% below cost in FY26 and roughly ₹397 crore below cost in FY25, having sold ₹411 crore above cost in FY24. That flip is the EDLP pivot in one line: goods became a traffic instrument and the gross profit pool moved to services.
Where the money is actually made
Take rates across the channel climbed from roughly 7–9% in FY22 to 14–18% by FY25, and platform fee revenue rose from ₹450 crore to about ₹10,500 crore over the same window, on course for roughly ₹34,500 crore by FY28. The composition matters more than the total. Zepto’s FY26 revenue from operations of ₹22,624 crore splits into traded goods of ₹17,588 crore, warehousing, packaging and last-mile charges of ₹2,780 crore, advertisement revenue of ₹1,636 crore (7.78% of net receivables value), platform services of ₹564 crore, and a tail of subscription, franchisee and scrap income. Services revenue grew from ₹548 crore in FY24 to ₹5,023 crore in FY26 — faster than the goods line in every year.
Read across the three and the conclusion is unavoidable: the merchandising line is close to a loss-leader, and the profit pool is warehousing, last-mile throughput, brand advertising and membership. That has a direct implication for suppliers. The shelf that matters is a digital one with finite slots, and the price of appearing on it is increasingly a brand-funded placement rather than a distributor margin.
Unit economics, per order
Q4 FY26 produced the first clean comparison the category has offered. Blinkit’s adjusted EBITDA of +₹37 crore across 273.9 million orders is +₹1.35 per order. Zepto’s loss of ₹1,248 crore across roughly 210 million quarterly orders is −₹59.40 per order. Instamart’s loss of ₹858 crore across 112.6 million orders is −₹76.20. A ₹77.55 spread separates the best and worst operator on identical input costs and comparable delivery-partner pay scales — and it is explained almost entirely by throughput per store, order value per basket and the take rate attached to each.
Contribution margin tells the same story from underneath. Blinkit’s rose from 3.9% to 5.4% of net order value during FY26, freeing ₹493 crore of contribution in Q4 alone. Instamart’s improved 372 basis points to −1.8%, with March 2026 at −1.1%. Both are converging on the same threshold from different directions; neither has crossed it, and the value chain will not be considered mature until the median store, not the best store, covers its own fixed costs.
What a single order earns and loses
| Unit-economics line | Reading | Where it comes from |
|---|---|---|
| Basket mix | Net average order value is INR 525 at Blinkit and INR 504 at Instamart, against INR 361 at Zepto | Q4 FY26 filings, net of discounts |
| Discount load | Instamart’s gross order value of INR 7,881 crore converts to INR 5,674 crore net, an implied platform discount of roughly INR 2,200 crore in one quarter | Swiggy Q4 FY26 disclosure |
| Gross versus net basket | Instamart’s gross basket rose from INR 527 to INR 700 year on year while net value per order stayed near INR 504, so the deeper non-grocery mix arrives with deeper discounts | Swiggy Q4 FY26 disclosure |
| Fixed cost per order | Zepto cut fixed cost per order to INR 62.67 in FY26 from INR 80.19 in FY25, a fifth of the way to breakeven at its current basket | Zepto UDRHP-I, 8 June 2026 |
| Contribution margin | Instamart improved contribution margin by 372 basis points year on year to -1.8% in Q4 FY26, with March 2026 at -1.1% | Swiggy Q4 FY26 shareholder letter |
| Non-order income | Zepto booked INR 1,636 crore of advertising receipts in FY26, and its net order value is stated inclusive of that income | Zepto UDRHP-I |
The gap between gross and net order value is the single largest hidden variable when platforms are compared. Pheonix places all three on a net-of-discount base for share purposes and discloses the non-order income difference rather than adjusting it away.
Investment Activity
Investment Activity and Capital Structure
Quick commerce has consumed more growth capital per rupee of revenue than any Indian consumer format before it, and FY26 was the year that capital stopped being free. The category’s funding story has moved from venture rounds sized against store-count ambition to public-market scrutiny of per-order economics, and the shift is now visible in the capital structures of all three leading platforms.
How the category was financed
The build-out was funded three different ways, and the difference now determines what each platform can do next. Blinkit was acquired outright by Zomato — now Eternal Limited — turning a venture-funded challenger into a strategic division funded from a listed parent’s balance sheet. Zepto raised successive venture rounds as a standalone specialist, most recently on a growth narrative rather than a profitability one, and has now filed to raise from the public market. Instamart was built organically inside Swiggy and has always been funded from the parent’s consolidated cash flow, with food-delivery EBITDA effectively covering its losses.
The result is that the three compete with radically different costs of capital. Eternal closed FY26 with ₹17,972 crore of cash, which means Blinkit can add dark-store density without a financing event. Zepto closed with ₹5,681 crore and negative free cash flow of ₹882 crore in the quarter — roughly six quarters of runway before its fresh issue lands. Swiggy’s consolidated adjusted EBITDA loss was ₹652 crore, with Instamart’s ₹858 crore loss offset by food-delivery adjusted EBITDA of about ₹297 crore a quarter. Only one of the three can be indifferent to the capital markets for the next two years.
Zepto’s offering and what it funds
Zepto Limited filed its updated draft red herring prospectus on 8 June 2026 for a fresh issue of ₹8,010 crore. The identified objects describe a densification strategy rather than a diversification one: ₹1,629 crore to new dark stores, ₹1,735 crore to lease rentals on existing stores, ₹1,325 crore to technology and cloud infrastructure, and ₹520 crore into the marketplace subsidiary for marketing. The inorganic plank is explicitly forward-looking — funding acquisitions capped at 10% of gross fresh-issue proceeds, roughly ₹801 crore, with the filing conceding that no targets have been identified.
That allocation says two things. First, the business is capital-hungry in a physical sense: more than a fifth of the issue goes to rent on stores that already exist, which is the least glamorous and most revealing line in the document. Second, management’s own plan implies roughly 1,904 stores from 1,139 — a near-doubling that will be gated by the proceeds rather than by demand. Zepto’s expansion is therefore now a capital-markets question, and the pricing of that issue is the single most consequential external variable in the category’s next two years.
Corporate investment and build-outs
Outside the big three, capital is being deployed defensively. Swiggy committed roughly US$115 million to its supply-chain arm in early 2025 to accelerate Instamart’s growth. BigBasket, owned by Tata, has committed to a nationwide ten-minute food delivery service, using its existing dark-store estate. Reliance Retail has extended quick delivery into fashion through Ajio Rush, a category extension rather than a grocery play. Flipkart Minutes and Amazon Now are funded inside marketplace businesses for which instant delivery is a customer-retention investment rather than a standalone P&L.
What has not happened is consolidation. There has been no material acquisition of one quick-commerce platform by another, and Zepto’s filing discloses exactly two structural events since incorporation, both internal: the amalgamation of its Singapore parent into the Indian entity in February 2025, and the March 2025 transfer of the app and website into a marketplace subsidiary. The category’s competitive map has been drawn by organic build-out and will keep being drawn that way until at least one challenger runs out of funding.
Capital intensity and the shape of the next phase
Quick commerce is capital-intensive in a specific way: not research-intensive like pharmaceuticals, nor plant-intensive like chemicals, but working-capital and lease intensive. Every dark store carries a multi-year lease, fit-out cost and a stock position; every incremental order requires delivery capacity that is paid per drop. Capital intensity is therefore high and it is recurring, not one-off — a store that opens in FY27 consumes rent in FY32.
Against that, the marginal economics improve sharply with density, which is why the sector’s capital requirement falls as throughput per store rises. Blinkit’s conversion of ₹7,024 crore of additional quarterly net order value in a year into a positive adjusted EBITDA is the proof of concept: once fixed costs are covered, incremental throughput is disproportionately profitable. That is the case for the capital already committed, and it is the case investors will test against Zepto’s per-order loss path of −₹78.35 to −₹59.40 across FY26.
The likely structure for FY27–FY30 is a two-tier capital market: the listed platforms refinancing against demonstrated unit economics, and the chasing pack drawing on strategic parents. Pure venture funding for a fourth national platform is now difficult to justify, which raises the probability of consolidation among the 500–800 store tier rather than at the top.
Capital position at 31 March 2026
| Platform | Cash and equivalents (INR crore) | Basis |
|---|---|---|
| Blinkit, via Eternal Limited | about 18,000 | Parent balance sheet, group level |
| Swiggy Instamart, via Swiggy Limited | about 15,000 | Parent balance sheet, group level |
| Zepto, before listing | 5,680 | Company only, 31 March 2026 |
| Zepto, post fresh issue | about 13,680 | Pro forma for the INR 8,010 crore fresh issue |
Zepto’s stated use of proceeds (INR crore)
| Deployment | Amount | What it buys |
|---|---|---|
| New dark stores | 1,629 | Network density |
| Lease rentals | 1,735 | The largest single line, and a fixed commitment |
| Technology | 1,325 | Throughput and cost per order |
| Marketing | 520 | Customer acquisition |
| Acquisitions | up to 801 | Pocket reserved, no identified targets |
Source: Zepto Limited updated draft red herring prospectus dated 8 June 2026; Eternal Limited and Swiggy Limited Q4 FY26 disclosures. Lease commitments are the line to watch: they convert a variable expansion decision into a fixed cost ahead of the demand that is meant to service it.
Technology & Innovation
Technology and Operational Innovation
Quick commerce in India is a software business wrapped around a warehouse lease. Nothing the customer experiences — a ten-minute promise kept, a substitution declined, a fresh item arriving unbruised — is possible without forecasting, inventory and routing systems operating at a granularity no Indian retailer had attempted at scale before 2021. The innovation is almost entirely operational rather than scientific, which shapes both how defensible it is and how it should be assessed.
Demand forecasting at SKU-by-store-by-day granularity
A dark store carrying 3,000 stock-keeping units across a two-kilometre catchment produces an unstable demand signal: a single housing society’s festive order can move a category by double digits, and a competitor opening two pin codes away can remove a fifth of a store’s volume in a fortnight. Platforms therefore forecast at the level of the individual store and replenish several times a day rather than on a nightly cycle. The practical skill is not the model architecture but the data discipline behind it — capturing substitution behaviour, out-of-stock events and refused deliveries as training signal rather than discarding them as operational noise.
Assortment localisation works the same way. A store in a student catchment stocks instant noodles, cold coffee, stationery and contraceptives; a store in a family catchment stocks staples in bulk, baby care and fresh produce. Because the cost of a wrong SKU is a fixed slot in a 3,000-slot store, category depth is continually reallocated against measured sell-through rather than planogram precedent.
Throughput engineering is the real frontier
With store additions collapsing to 297 net across the category in Q4 FY26, incremental growth has to come from the same square footage, and the engineering focus has moved accordingly. Zepto’s 2,140 orders per store per day against Blinkit’s 1,357 and Instamart’s 1,093 is a technology outcome as much as a marketing one: it reflects pick-path design, station layout, batching logic, replenishment cadence and the extent to which the app steers a customer toward what the store can actually fulfil on time.
The binding technical constraint at this throughput is inventory accuracy. Sub-1% error compounds across thousands of picks a day into missed promises, and missed promises are the only failure a quick-commerce customer reliably punishes. This is why the platforms invest in cycle counting, shelf-level scan discipline and increasingly in computer-vision verification at the pack station rather than in customer-facing surfaces.
Money, search and merchandising
The monetisation layer has become the innovation budget. Brand-funded placement, sponsored search results, sampling and co-developed SKUs all require an advertising stack with its own auction, measurement and reporting — effectively a retail-media business bolted onto a grocery channel. Zepto’s advertisement receipts reached ₹1,636 crore in FY26, 7.78% of net receivables value, which is not a rounding error on a convenience app but the profitability engine of the whole format.
Payments are largely solved in India in a way they are not elsewhere. UPI removed the friction from high-frequency, small-ticket purchasing, and 806 million internet users on more than 1.12 billion mobile connections means discovery and checkout are no longer the constraint even in smaller cities. The open network for digital commerce adds a second distribution rail, letting local merchants and kirana networks join an interoperable catalogue; adoption has so far been incremental rather than transformative, but it is the mechanism by which neighbourhood retail could re-enter the channel as a supplier rather than be displaced by it.
Fleet, energy and delivery-partner tooling
Electric two-wheelers are the default economics of last-mile grocery in Indian metros: a 20–30 kilometre daily route on a fixed battery-swap plan is cheaper per kilometre than petrol, and the short catchment means range anxiety is a non-issue. Adoption is therefore driven by total cost of ownership rather than emissions policy, though both point the same way.
The rider application is the least visible and most consequential piece of software in the chain. Batching two or three orders into one route, sequencing drops against building access and lift availability, predicting hand-off time and enforcing food-safety separation all determine whether the ₹25–30 fixed cost per delivery is met at or below plan. Rider earnings transparency and dispute handling matter too: delivery-partner churn is the largest uncontrolled cost line in the model, and tooling that stabilises earnings variability is worth more than a marginal route optimisation.
Technology maturity and the innovation assessment
On the Pheonix framework, the technology profile of Indian quick commerce is a high innovation intensity paired with low patent activity. Almost nothing here is protected by intellectual property; the moat is accumulated operational data, store-level site selection, supplier relationships and organisational learning speed. That has two consequences for anyone assessing the sector.
First, technology does not create a durable barrier between equally capitalised competitors — which is why the three platforms converged on similar order value per store within a few quarters. Second, it does create a very durable barrier between scaled and unscaled operators, because the data that improves forecasting and slot allocation only accumulates in proportion to orders served. A new entrant with 500 stores generates a fraction of the learning per month that a 2,243-store network does, and no amount of capital compresses that.
The maturity stage is best characterised as scaling rather than mature: the core systems work, the economics are proven at the leading operator, and the open questions are about extension — into pharmacy, prepared food, fashion and electronics — rather than about whether the base infrastructure can function at all.
The three numbers that now define the technology race
The competitive question in this channel has moved from how many dark stores a platform can open to how much it can push through each one. With close to identical store counts at Zepto and Instamart, a 2,140-versus-1,093 orders-per-store gap is a systems gap, not a footprint gap: forecasting that holds stock in the right catchment, pick paths that keep a ten-minute promise inside a fixed labour cost, and dispatch that batches riders without breaching the promise. Every one of those is a software problem with a measurable per-order cost attached, which is why fixed cost per order is the metric to track rather than store count.
Market Risk
Market Risk Assessment
India’s quick commerce market has proven that demand is real and that the model can work. It has not yet proven that the model works at the median store, across a full economic cycle, under normalised pricing. The risks below are ordered by how much they would move the 2033 forecast rather than by how likely they are to make headlines.
Profitability and cash-burn risk — high
Only one of the three reporting platforms earned a positive adjusted EBITDA in Q4 FY26, and only ₹37 crore of it. Zepto’s quarterly loss was ₹1,248 crore and Instamart’s ₹858 crore. The gap between best and worst operator is ₹77.55 per order, which is large enough that reasonable people can disagree about whether it reflects a durable operating advantage or a temporary pricing posture.
The specific risk is a capital event at the weakest balance sheet forcing a strategic retreat — store closures, a market exit, or a distressed sale — which would redistribute share abruptly and strand supplier and landlord relationships. Zepto’s ₹5,681 crore of cash against ₹882 crore of quarterly free cash outflow is the number to watch. The mitigation is that its per-order loss is improving fast, from −₹109.80 at the worst quarter of FY26 to −₹59.40 at the best.
Competitive and discount-normalisation risk — high
Instamart’s gross-to-net gap was ₹2,206 crore of platform discounts in a single quarter — 28% of its headline order value. That gap is the demand the channel has bought rather than earned, and the question the whole forecast rests on is how much of it survives its removal. The evidence so far is encouraging but not conclusive: Instamart grew orders 27% while raising its gross basket from ₹527 to ₹700, and Blinkit grew orders 93% on a flat net basket, which suggests frequency is becoming habitual rather than promotional. But both platforms also raised take rates sharply, from 7–9% to 14–18%, and a consumer paying both a higher fee and a higher shelf price is a different consumer from the one acquired in FY23.
A second competitive risk sits with the chasing pack. Flipkart Minutes, BigBasket and Amazon Now can each double store count as a financing decision, and any one of them doing so in the top eight metros would compress the density advantage the incumbents have spent four years building.
Labour and regulatory risk — medium to high
Delivery partners are the largest variable cost and the least institutionally protected input in the model. The Code on Social Security 2020 provides for aggregator contributions to a social security fund of 1–2% of turnover, capped at 5% of gig-worker payables, with implementation rules still being notified; several states have proposed or introduced their own per-transaction welfare levies on platform aggregators. A 1–2% turnover contribution is not a rounding error in a business earning 5.4% contribution margin at the leading operator, and a state-level levy on top of it would move per-order economics directly.
The foreign-direct-investment asymmetry cuts the other way and is itself a risk. Blinkit’s inventory-led model is available to it because Eternal is Indian-owned; a policy clarification that narrowed that route, or a general tightening of e-commerce rules on deep discounting, preferred sellers or data use, would affect the three platforms unevenly. Consumer protection and packaged-commodity rules on pricing disclosure, country of origin and grievance redressal are well established but enforcement intensity is rising as the channel becomes a mainstream route to market.
Currency risk — medium, and consistently underestimated
Every revenue line in this market is denominated in rupees and this report sizes it in dollars. The rupee averaged 88.3 to the dollar through FY26 and traded above 95 by October 2026 — a depreciation of roughly 7% in a matter of months. At that rate, a rupee-denominated business can grow 15% in local currency and stand still in dollars.
The category already has a live example of this trap. Blinkit’s own guidance of US$3 billion of net order value by FY30 now sits below its FY26 actual of roughly US$5.5 billion, not because the guidance was wrong when given but because the exchange rate moved against the currency in which it was expressed. Any dollar-denominated forecast for an Indian consumer category should be read as a rupee forecast plus a currency assumption, and the assumption is doing more of the work than most models acknowledge.
Substitution and demand-elasticity risk — medium
Quick commerce still represents only about 1% of India’s grocery market. That is the growth case, and it is also the risk case: at 1% penetration, no behaviour is yet locked in. The channel’s defence is time — 27.2 million monthly transacting customers at Blinkit and 47.97 million annual transacting users at Zepto represent a habit forming — but habit at a 1% penetration rate has not been tested against a competing format that pairs kirana relationships with a faster promise at a lower fee.
Adjacent substitution cuts both ways. Quick commerce takes share from traditional trade and from scheduled e-grocery, and it is now visibly compressing the growth of next-day grocers. Where it takes share from is a distributional question that matters to brands more than to the channel: a case of goods sold through a dark store earns the platform a different margin, a different data trail and a different promotional cost than the same case sold through a distributor.
Execution and site-selection risk — medium
Finally, the operating risk that never appears in a share table. A dark store is a five-to-ten-year lease on a catchment that may be right for two years. Blinkit’s top eight cities are reported 80–90% pin-code covered, which is exactly the point at which incremental stores begin to cannibalise rather than add. The category added only 297 net stores in Q4 FY26, and the platforms’ own disclosures suggest that is a choice about throughput, not a shortage of suitable sites. If tier-2 expansion proves less dense than modelled, the fixed-cost base built in FY26–FY28 will take longer to absorb than the forecast assumes.
Risk register, quantified
| Risk | Quantified exposure | Evidence |
|---|---|---|
| Cash burn and funding dependence | Zepto reported negative free cash flow of INR 4,329 crore for FY26 against INR 5,680 crore of cash at year end | Zepto UDRHP-I |
| Margin concentration | Exactly one of the three platforms reported positive quarterly adjusted EBITDA, at INR 37 crore | Q4 FY26 filings |
| Discount normalisation | Instamart’s gross-to-net gap was roughly INR 2,200 crore in a single quarter; withdrawing it doubles the reported loss | Swiggy Q4 FY26 |
| Regulatory and investigative | Zepto’s founders were summoned by the Enforcement Directorate in April 2026 under the Foreign Exchange Management Act, during an active listing process | Zepto UDRHP-I disclosure |
| Entry by scaled incumbents | Flipkart Minutes added around 100 dark stores a month toward roughly 1,200; Amazon Now targets 1,000 stores across more than 100 cities | Company statements, trade press |
| Measured-base concentration | Three platforms account for the entire measured market, and the leader alone holds 51.0% of net order value | Pheonix three-platform build |
| Currency translation | The dollar-denominated forecast is translated at the FY26 average of INR 88.3; a weaker rupee raises the dollar market size without any change in rupee order value | Reserve Bank of India average rate series |
Risks are ordered by proximity to the forecast, not by size of headline. The first four move the 2033 number; currency translation moves only its dollar expression.
Regulatory Landscape
Regulatory and Policy Environment
India’s quick commerce sector operates inside a regulatory frame designed for a different kind of retail, and the mismatch is now doing real work on competitive outcomes. Four areas matter commercially: foreign investment rules, food and metrology licensing, gig-work obligations, and the emerging data and open-network layer.
Foreign investment and the model asymmetry
India’s consolidated foreign-direct-investment policy permits 100% foreign investment in the marketplace model of e-commerce, where the entity provides an IT platform connecting buyers and sellers, and prohibits it in the inventory-based model, where the entity owns the goods and sells them directly to consumers. That single distinction explains more about the FY26 competitive landscape than any management decision.
Blinkit’s move to a hybrid marketplace-plus-inventory structure was possible because Eternal Limited is Indian-owned, so the inventory prohibition does not bind it; the same structure is not available to a foreign-funded marketplace without restructuring ownership. Conversely, the policy is why Instamart has remained a pure marketplace and why Zepto separated its marketplace storefront from its wholesale procurement arm. Foreign-funded platforms have to earn their margin as a take rate; an Indian-owned one can earn it as owned gross margin. The policy question hanging over the sector is whether that asymmetry survives the next round of e-commerce rule-making, and how a level-playing-field clarification would be applied to a format that did not exist when the rules were drafted.
Food safety, metrology and consumer protection
Every dark store that handles food needs a food business operator registration or licence, and the licensing is state-administered in practice, which means 4,525 stores implies thousands of individual licences across dozens of jurisdictions and a compliance overhead that scales with the estate rather than with revenue. Packaged commodities rules require the declaration of maximum retail price, net quantity, country of origin, best-before date and manufacturer details on e-commerce listings as well as physical packs, and enforcement has become more consistent as quick commerce has moved into mainstream distribution.
Consumer protection rules for e-commerce add disclosure of seller identity, a grievance officer and a defined complaint-resolution timeline, and they apply to dark-store retail in ways that a pure marketplace finds simpler to satisfy: a platform that owns the goods owns the entire consumer relationship, including liability. The practical effect is that inventory-led operators carry a compliance burden their marketplace rivals do not, in exchange for the gross margin those rivals cannot reach.
Gig work and social security
The largest unquantified policy exposure sits with the delivery fleet. The Code on Social Security 2020 introduced a framework for gig and platform workers that includes aggregator contributions to a social security fund, set at 1–2% of turnover subject to a cap of 5% of the amounts paid to gig workers, alongside registration and benefit obligations. Implementation rules are being notified progressively, and several states have separately proposed or introduced welfare levies on platform aggregators.
For a business earning contribution margin in the low single digits as a percentage of order value, a turnover-linked contribution is a direct hit to the cost base: a 2% turnover contribution on a channel running roughly ₹1 lakh crore of order value is a ₹2,000 crore annual line, against a leading operator that earned ₹37 crore of quarterly adjusted EBITDA. The sector’s own defence is that delivery partners are independent contractors who choose their hours, and that per-order pay already exceeds prevailing alternatives; the policy counter is that the work is algorithmic and the dependency is structural. The direction of travel is unmistakably toward more obligation, and it is the single most plausible source of a step-change in per-order economics between now and 2033.
Open network digital commerce
India’s open network for digital commerce is an attempt to do to retail discovery what unified payments did to payments: create an interoperable protocol over which any buyer application can transact with any seller, with catalogue and fulfilment standards shared across participants. For quick commerce the implications are ambiguous. In principle it lowers the barrier to entry for local merchants and kirana networks and could turn a large share of neighbourhood retail into catalogue-visible supply. In practice the binding constraint in this format is not discovery but fulfilment — a two-kilometre dark store, a rider pool and a sub-20-minute promise — and those are not things an open protocol supplies. The realistic outcome is incremental participation by local merchants as suppliers to existing platforms rather than a network-native competitor to them.
Data protection and advertising disclosure
The data protection framework introduced in 2023 imposes consent, purpose-limitation and security obligations on data fiduciaries, with significant penalties. For quick commerce the operational exposure is less about marketing consent, which is well handled, than about worker data: rider location tracking, performance scoring and algorithmic allocation of orders are all processing activities that will attract scrutiny as the framework’s rules are notified. Separately, the growth of retail media — brand-funded placement inside search results and category pages — is moving toward the disclosure expectations that already apply to traditional advertising, and platforms that have built advertising revenue on an undisclosed ranking auction should expect to have to explain it.
Assessment
Regulatory complexity for this sector is high and rising, but it is not hostile. The state has been broadly supportive of digital retail, the licensing framework is administrative rather than discretionary, and no approval pathway stands between a platform and opening a store beyond standard municipal, food-safety and labour registration. The commercial risk is therefore not prohibition but cost: obligations that attach to turnover or to headcount rather than to profit, landing on a format whose margins are thin and whose profitability is recent.