
Marché de la sécurité intérieure en Inde, par type (sécurité des frontières, sécurité aérienne, sécurité maritime, sécurité des infrastructures critiques, cybersécurité, sécurité CBRN (chimique, biologique, radiologique et nucléaire), application de la loi et collecte de renseignements, et autres), par système (système de renseignement et de surveillance, système de détection et de surveillance, système d'armes, système de contrôle d'accès, modélisation et simulation, système de communication, plateforme, système de sauvetage et de récupération, système de commandement et de contrôle, système de contre-mesures et autres), par utilisation finale (secteur public et secteur privé), par région (Nord, Sud, Ouest et Est), par État (Delhi, Mumbai, Telangana, Chennai, Punjab et autres) - Analyse des tendances et prévisions jusqu'en 2027
India's homeland security market is USD 8.14 billion in 2025 and USD 20.05 billion in 2033 — 11.93 per cent a year, 2.463 times in eight years, on a rupee base of Rs 76,000 crore rising to Rs 1,87,216 crore at the RBI reference rate of Rs 93.36 to the dollar. Volume grows more slowly, 11.6 million to 22.9 million devices at 8.87 per cent, so value per device rises 24.78 per cent from Rs 65,517 to Rs 81,754. The gap between those two rates is the report's subject: the hardware is commoditising and the decision layer is not.
First, the guard was the incumbent technology, and it has been out-priced. India's private security industry is a Rs 1,00,000 crore business of 48,000 licensed agencies and roughly ten million people, with a statutory wage floor of Rs 15,500 a month. A guard-year therefore costs Rs 1,86,000. A camera now costs Rs 2,675. One guard-year buys 69.5 cameras. That arithmetic, not the threat level, is what re-prices a guarded kilometre.
Second, the budget has already moved. The Ministry of Home Affairs is allocated Rs 2.55 lakh crore in 2026-27, up 9.44 per cent. Capital outlay under the Police head rises 28.31 per cent, from Rs 16,579.19 crore to Rs 21,272.47 crore. Capital growing three times faster than the total is the mix shift, stated in the government's own numbers.
Third, border and cyber take the growth. Border and perimeter security grows 14.6 per cent and cyber and digital forensics 15.8 per cent, against 7.8 per cent for aviation. Together they absorb Rs 61,036 crore of the Rs 1,11,216 crore the market adds — 54.88 per cent.
Fourth, the risk is appropriation, not demand. A parliamentary standing committee reported in March 2026 that the 2026-27 allocation falls short of projected requirements under police infrastructure, border infrastructure and technology upgradation. At 9 per cent instead of 11.93, 2033 is USD 16.22 billion — USD 3.83 billion gone on a funding line, not a threat assessment. And if the statutory wage floor is not what the industry actually pays, the substitution case is weaker than the headline implies; that caveat is stated in Chapter 6 rather than buried.
Définition du marché indien de la sécurité intérieure : La sécurité nationale / les valeurs mobilières désignent les activités et organisations visant à protéger toute nation contre le terrorisme, les catastrophes, les risques juridictionnels et les méta-risques. La sécurité nationale offre diverses solutions pour la protection des actifs publics et privés d'un pays contre les menaces antisociales. Parmi ces solutions figurent la détection et la surveillance des systèmes d'armes, les systèmes de contrôle d'accès, la modélisation et la simulation, les systèmes de communication, entre autres. Le gouvernement indien prend des mesures dans ce sens, comme l'initiative « Make in India » lancée par le Premier ministre Shri Narendra Modi, dans le cadre de laquelle l'État consacre 30 % de ses dépenses totales à la sécurité. Par conséquent, les entreprises sont de plus en plus intéressées à vendre leurs produits connexes en Inde.
Perspectives du marché indien de la sécurité intérieure : Le marché de la sécurité intérieure en Inde devrait croître à un rythme rapide. L'Inde importe environ les trois quarts de ses besoins totaux en produits de sécurité intérieure. Mais désormais, ce secteur est devenu attractif du point de vue des investisseurs, grâce à un financement politique accru et à une amélioration de la conjoncture économique.

Selon Phoenix Market Research, le marché indien de la sécurité intérieure devrait enregistrer un taux de croissance annuel composé (TCAC) sain de 21,3 % au cours de la période 2020-2027. Le facteur le plus important propulsant le marché est la sécurité de la nation face aux calamités naturelles et d'origine humaine, qui constitue la plus grande force motrice du marché. Le cadre de sécurité intérieure renforce la protection du pays contre des défis tels que l'insurrection, le trafic illicite, la piraterie, les catastrophes naturelles, la cybercriminalité et bien d'autres menaces similaires. Le secteur est largement stimulé par les politiques dérivées du gouvernement national indien liées aux problèmes de sécurité intérieure et aux menaces terroristes, qui ont conduit les gouvernements étatiques et central à se concentrer sur la modernisation de l'infrastructure de sécurité et de défense.
Cela a contribué à une amélioration de l'allocation budgétaire consacrée à la sécurité intérieure et à d'autres programmes tels que le Service de sécurité nationale, la délivrance du numéro d'identité unique (UID) à tous les résidents du pays, ainsi que la création du Réseau et des systèmes de suivi des crimes et des criminels (CCTNS). Cependant, le prix élevé de ces biens et le manque de main-d'œuvre qualifiée pour l'exploitation de ces produits et services devraient entraver la croissance des ménages.
Dynamique du marché de la sécurité intérieure en Inde : Facteurs de croissance ??? Introduction de technologies innovantes ??? Cas croissants de contrebande et de trafic ??? Service d'urgence pour la gestion des catastrophes ??? Initiative gouvernementale et politiques de sécurité
Contraintes ✗✗ Manque d'infrastructures et coût élevé ✗✗ Certaines limitations freineront le marché
Segmentation du marché de la sécurité intérieure en Inde : Par type Sécurité des frontières o Douanes et protection des frontières o Sécurité de l’immigration o Quarantaine o Autres
Sécurité aérienne o Protection des aéroports o Contrôle des passagers et des bagages o Gestion des incidents o Autres
Sécurité maritime o Sécurité portuaire o Sécurité des navires o Surveillance côtière o Autres
Sécurité des infrastructures critiques o Secteur de l’énergie et de l’électricité o Secteur de la fabrication critique o Autres
Cybersécurité o Sécurité réseau o Sécurité des points de terminaison o Sécurité des applications o Sécurité sans fil o Sécurité cloud o Autres
Sécurité CBRN (chimique, biologique, radiologique et nucléaire) o Planification et préparation o Détection et surveillance o Protection et décontamination o Rétablissement et atténuation o Autres
Application de la loi et collecte de renseignements o Gestion publique o Sécurité VIP o Maintien de l'ordre o Renseignement, surveillance et reconnaissance o Autres ??? Autres (Premiers intervenants, Renseignement antiterroriste, C3I et sécurité des pipelines)
Par Systèmes ??? Système de renseignement et de surveillance o Caméras o Radars o Équipements optroniques o Caméras thermiques o Autres (systèmes de stockage, serveurs, moniteurs et accessoires supplémentaires)
??? Système de détection et de surveillance o Capteurs o Détecteurs de métaux o Détecteurs d’incendie o Détecteurs d’explosifs o Détecteurs de rayonnements o Détecteurs à rayons X o Autres (systèmes de contrôle des passagers, détecteurs nucléaires et détecteurs de menaces biologiques)
??? Système d'arme o Armes létales o Armes non létales
Contrôle d'accès ??? o Contrôleurs/serveurs de contrôle d'accès o Cartes et lecteurs o Lecteurs biométriques o Serrures électroniques o Lecteurs multi-technologies
Modélisation et simulation o Logiciels et applications o Simulateurs
Système de communication o Radios o Casques tactiques o Équipements assistés par satellite o Logiciels et applications o Autres (Systèmes de réseautage et de communication en champ proche)
??? Plateforme o Véhicules blindés o Navires de patrouille o Hélicoptères o Plateformes sans pilote (UaV) ??? Système de sauvetage et de récupération ??? Système de commandement et de contrôle ??? Système de contre-mesures ??? Autres (contre-mesures et systèmes d’entraînement et de simulation)
Par Utilisation Finale Secteur public Secteur privé
Par région ??? Nord ??? Sud ??? Ouest ??? Est
Par État Delhi Mumbai Telangana Uttarakhand Uttar Pardesh Bangalore Chennai Punjab Autres
Développements clés du marché : En OCTOBRE 2018, Harris Corporation a fusionné à parts égales avec L3 Technologies afin d'élargir son portefeuille de produits et d'échanger des technologies pour des produits innovants.
Analyse concurrentielle : Marché de la sécurité intérieure en Inde : Le marché indien de la sécurité intérieure est fortement fragmenté et les principaux acteurs ont recours à diverses stratégies telles que le lancement de nouveaux produits, les expansions, les accords, les coentreprises, les partenariats, les acquisitions, et autres, afin d'accroître leur présence sur ce marché. Le rapport comprend les parts de marché du secteur de la sécurité intérieure en Inde pour les régions du Nord, de l'Ouest, du Sud et de l'Est.
Principaux concurrents du marché : marché indien de la sécurité intérieure : Les acteurs opérant sur le marché indien de la sécurité intérieure comprennent : ??? Lockheed Martin Corporation ??? IBM ??? Thales Group ??? Unisys ??? Harris Technologies, Inc ??? L3Harris Technologies, Inc ??? Safran SA ??? Accenture ??? GE AVIATION ??? Booz Allen Hamilton Inc. ??? Autres
Avantages clés Ce rapport présente une recherche marketing quantitative complète sur la sécurité intérieure et les tendances actuelles du marché de la sécurité intérieure de 2019 à 2027, afin d'identifier les opportunités dominantes ainsi qu'une évaluation stratégique du marché mondial de la sécurité intérieure. La taille et les estimations du marché de la sécurité intérieure sont étayées par une analyse complète des principaux développements au sein de l'industrie du marché de la sécurité intérieure. Une analyse qualitative appuyée par des produits innovants facilite la planification stratégique des activités. Les stratégies de développement adoptées par les principaux acteurs du marché sont répertoriées afin de connaître le paysage concurrentiel du marché mondial de la sécurité intérieure.
Méthodologie de recherche : Marché de la sécurité intérieure en Inde Les modules de collecte de données avec des échantillons de grande taille sont utilisés pour la collecte des données et l'analyse de l'année de référence. L'analyse des parts de marché et l'analyse des tendances clés sont les principaux facteurs de succès pour tout rapport de marché. Des modèles statistiques et cohérents du marché sont utilisés pour analyser les données du marché. Veuillez demander un appel avec un analyste pour plus d'informations sur la méthodologie de recherche.
Les consultants de Pheonix Research utilisent leur méthodologie de recherche exclusive pour évaluer les données, ce qui implique l'exploration de données, l'analyse de l'impact des variables de données sur le marché et la validation primaire. En outre, d'autres modèles de données comprennent une vue d'ensemble et un guide du marché, une grille de positionnement des entreprises, une grille de positionnement des fournisseurs, une analyse chronologique du marché, une analyse des parts de marché des entreprises, des normes de mesure, une analyse descendante et ascendante, ainsi qu'une analyse des parts des fournisseurs.
Demande et offre - Répondant à la recherche primaire Côté demande: : Ministères/Départements gouvernementaux, Association des développeurs d'énergie solaire, Organisations d'achat groupé, Associations, Autorités, Universitaires et universités, Expertise technologique, chercheurs, Promoteurs et investisseurs, entre autres. Offre:Directeurs de produit, directeurs marketing, cadres supérieurs et intermédiaires, distributeurs, responsables de veille marché et responsables d’autorité, entre autres.
Aperçu du rapport : Pour obtenir des informations sur le milieu concurrentiel du marché Évaluation des utilisateurs finaux / Comportements des clients Évaluation détaillée de la demande et de l'offre Analyse des principaux moteurs et contraintes du marché Paysage concurrentiel des principaux acteurs impliqués Analyse approfondie de la segmentation du marché
Table des matières
1. Introduction 1.1. Objectifs de l'étude 1.2. Portée du marché 1.2.1. Marché couvert 1.2.2. Années prises en compte pour l'étude 1.3. Définition du marché 1.4. Devise 1.5. Limites 1.6. Parties prenantes 2. Méthodologie de recherche 2.1. Conception de la recherche 2.1.1. Aperçu de la méthodologie de recherche 2.1.2. Données secondaires 2.1.3. Données clés issues des sources secondaires 2.1.4. Données primaires 2.1.5. Données clés issues des sources primaires 2.2. Estimation de la taille du marché 2.3. Décomposition du marché et triangulation des données 2.4. Estimation des parts de marché 2.5. Hypothèses de l'étude 3. Résumé analytique 4. Aperçu Premium 4.1. Données relatives aux importations et aux exportations 5. Aperçus du secteur 5.1. Chaîne de valeur 5.2. Paysage réglementaire 5.3. Principaux produits en développement 5.4. Initiatives public-privé 5.5. Financement 6. Dynamique du marché 6.1. Introduction 6.2. Dynamique du marché 6.2.1. Facteurs moteurs 6.2.2. Contraintes 6.2.3. Opportunités 6.2.4. Défis 7. Marché indien de la sécurité intérieure, par type 7.1. Introduction 7.2. Sécurité des frontières 7.2.1. Protection des douanes et des frontières 7.2.2. Sécurité de l'immigration 7.2.3. Quarantaine 7.2.4. Autres 7.3. Sûreté aérienne 7.3.1. Protection des aéroports 7.3.2. Contrôle des passagers et des bagages 7.3.3. Gestion des incidents 7.3.4. Autres 7.4. Sécurité maritime 7.4.1. Sûreté portuaire 7.4.2. Sécurité des navires 7.4.3. Surveillance côtière 7.4.4. Autres 7.5. Sécurité des infrastructures critiques 7.5.1. Secteur de l'énergie et de l'électricité 7.5.2. Secteur de la fabrication critique 7.5.3. Autres 7.6. Cybersécurité 7.6.1. Sécurité des réseaux 7.6.2. Sécurité des points finaux 7.6.3. Sécurité des applications 7.6.4. Sécurité sans fil 7.6.5. Sécurité du cloud 7.6.6. Autres 7.7. Sécurité NRBC (nucléaire, radiologique, biologique et chimique) 7.7.1. Planification et préparation 7.7.2. Détection et surveillance 7.7.3. Protection et décontamination 7.7.4. Rétablissement et atténuation 7.7.5. Autres 7.8. Maintien de l'ordre et collecte de renseignements 7.8.1. Gestion publique 7.8.2. Sécurité des personnalités importantes 7.8.3. Maintien de l'ordre lors d'émeutes 7.8.4. Renseignement, surveillance et reconnaissance 7.8.5. Autres 7.9. Autres (premiers intervenants, contre-terrorisme et renseignement, C3I et sécurité des pipelines) 8. Marché indien de la sécurité intérieure, par systèmes 8.1. Introduction 8.2. Système de renseignement et de surveillance 8.2.1. Caméras 8.2.2. Radars 8.2.3. Équipements optroniques 8.2.4. Caméras thermiques 8.2.5. Autres (systèmes de stockage, serveurs, moniteurs et accessoires additionnels) 8.3. Système de détection et de surveillance 8.4. Capteurs 8.5. Détecteurs de métaux 8.5.1. Détecteurs d'incendie 8.5.2. Détecteurs d'explosifs 8.5.3. Détecteurs de radiations 8.5.4. Détecteurs à rayons X 8.5.5. Autres (systèmes de contrôle des passagers, détecteurs nucléaires et détecteurs de menaces biologiques) 8.6. Système d'armement 8.6.1. Armes létales 8.6.2. Armes non létales 8.7. Système de contrôle d'accès 8.7.1. Contrôleurs/serveurs de contrôle d'accès 8.7.2. Cartes et lecteurs 8.7.3. Lecteurs biométriques 8.7.4. Serrures électroniques 8.7.5. Lecteurs multi-technologies 8.8. Modélisation et simulation 8.8.1. Logiciels et applications 8.8.2. Simulateurs 8.9. Système de communication 8.9.1. Radios 8.9.2. Casques tactiques 8.9.3. Équipements assistés par satellite 8.9.4. Logiciels et applications 8.9.5. Autres (systèmes de réseau et de communication en champ proche) 8.10. Plateforme 8.10.1. Véhicules blindés 8.10.2. Navires de patrouille 8.10.3. Hélicoptères 8.10.4. Plateformes sans pilote 8.11. Système de sauvetage et de récupération 8.12. Système de commandement et de contrôle 8.13. Système de contre-mesures 8.14. Autres (contre-mesures et systèmes d'entraînement et de simulation) 9. Marché indien de la sécurité intérieure, par utilisation finale 9.1. Introduction 9.2. Secteur public 9.3. Secteur privé 10. Marché indien de la sécurité intérieure, par région 10.1. Introduction 10.2. Nord 10.3. Sud 10.4. Ouest 10.5. Est 11. Marché indien de la sécurité intérieure, par État 11.1. Delhi 11.2. Mumbai 11.3. Télangana 11.4. Uttarakhand 11.5. Uttarpardesh 11.6. Bangalore 11.7. Chennai 11.8. Pendjab 11.9. Autres 12. Paysage concurrentiel 12.1. Paysage concurrentiel et tendances. 12.2. Accords, partenariats et collaborations 12.3. Lancements de produits et approbations 12.4. Acquisitions 12.5. Expansions 13. Profil de l'entreprise 13.1. Lockheed Martin Corporation 13.1.1. Présentation générale 13.1.2. Analyse des revenus 13.1.3. Portefeuille de produits 13.1.4. Développement récent 13.2. Thales Group 13.2.1. Présentation générale 13.2.2. Analyse des revenus 13.2.3. Portefeuille de produits 13.2.4. Développement récent 13.3. IBM 13.3.1. Présentation générale 13.3.2. Analyse des revenus 13.3.3. Portefeuille de produits 13.3.4. Développement récent 13.4. Unisys 13.4.1. Présentation générale 13.4.2. Analyse des revenus 13.4.3. Portefeuille de produits 13.4.4. Développement récent 13.5. Harris Technologies, Inc 13.5.1. Présentation générale 13.5.2. Analyse des revenus 13.5.3. Portefeuille de produits 13.5.4. Développement récent 13.6. L3Harris Technologies, Inc 13.6.1. Présentation générale 13.6.2. Analyse des revenus 13.6.3. Portefeuille de produits 13.6.4. Développement récent 13.7. Safran SA 13.7.1. Présentation générale 13.7.2. Analyse des revenus 13.7.3. Portefeuille de produits 13.7.4. Développement récent 13.8. Accenture 13.8.1. Présentation générale 13.8.2. Analyse des revenus 13.8.3. Portefeuille de produits 13.8.4. Développement récent 13.9. GE Aviation 13.9.1. Présentation générale 13.9.2. Analyse des revenus 13.9.3. Portefeuille de produits 13.9.4. Développement récent 13.10. Booz Allen Hamilton Inc 13.10.1. Présentation générale 13.10.2. Analyse des revenus 13.10.3. Portefeuille de produits 13.10.4. Développement récent 14. SWOT et analyse 15. Conclusion 16. À propos de nous 17. Rapports connexesPaysage concurrentiel
This market is moderately consolidated at the prime layer and fragmented everywhere below it. That combination explains most of the competitive behaviour you see in a tender: a dozen firms can credibly bid as prime on a large security programme, several hundred can supply a camera, and a few dozen can build the analytics that decides whether the deployment works. Our estimate is twelve players at the top tier.
Tier one is the Indian defence-electronics primes and large infrastructure groups. Bharat Electronics Limited is the reference case and the closest thing this market has to an incumbent. In FY2025-26 it turned over Rs 26,679.58 crore, up 15.87 per cent on Rs 23,024.10 crore, with profit after tax of Rs 6,048.48 crore and a value of production of Rs 27,254.32 crore. Two disclosures in that report matter more than the revenue line: 93 per cent of turnover was defence supplies, and 84 per cent came from indigenously developed products. Its production account — materials 53 per cent, employee cost 11 per cent — describes a company that converts components and testing into systems, not one that sells labour.
Larsen & Toubro competes at the same tier from the other direction: an infrastructure and project-management capability that can deliver civil works, power, communications and command centres as one contract, which is exactly what a border-management programme requires and exactly what a pure electronics house cannot self-perform. Tata Advanced Systems occupies the platform and aerospace-adjacent space, including surveillance platforms, armoured mobility and C4ISR integration.
Tier two is specialist capability, usually reached through partnership. Zen Technologies built its position in simulation and has extended into counter-drone and anti-drone training, which is the fastest-moving requirement in the border segment. Above it sit the foreign original equipment manufacturers whose Indian route is a joint venture or a licensed-production arrangement rather than an import: Thales Group in defence electronics, air traffic and identity systems; Elbit Systems and Israel Aerospace Industries in surveillance payloads, unmanned systems and border sensor architecture; Safran in optronics and navigation; IDEMIA in identity and biometric systems that sit underneath access control and enrolment; and Airbus in the aviation-security and platform layer.
Tier three is where the volume is and the margin is not. Systems integrators serving district and state buyers, analytics and software firms, and the component trade. Below them sit 48,000 licensed private security agencies under the Private Security Agencies (Regulation) Act — not competitors in this market’s technology segments, but the incumbent supplier of the function the technology is replacing, and increasingly the channel through which private critical-infrastructure buyers procure monitoring and response.
| Tier | Who competes here | What they actually sell | What protects them |
|---|---|---|---|
| Prime | Around twelve firms: defence-electronics houses, large infrastructure groups, Indian subsidiaries of global primes | Programme ownership: design, civil works, integration, acceptance, multi-year service | Financial capacity to carry receivables; security clearance; reference sites; the ability to bid the whole scope |
| Specialist | Counter-drone, radar, optronics, identity and analytics firms, usually in joint venture | A capability the prime cannot build, licensed into an Indian entity | Certification, detection performance, and a partner already qualified with the buyer |
| Component and software | Camera and sensor vendors, storage, software, regional integrators | Boxes, licences and configuration | Price and catalogue compliance only; the weakest position in the chain |
Table 3. Competitive structure of the India homeland security market, 2025.
The indigenisation gate is the real competitive barrier
The single largest determinant of who can compete is not technology. It is the policy architecture built since 2020: the Defence Acquisition Procedure 2020, the Positive Indigenisation Lists that progressively prohibit the import of listed items, the Defence Procurement Manual 2025, the Innovations for Defence Excellence scheme, and SRIJAN DEEP. The results are in the government’s own arithmetic: indigenous defence production rose from Rs 46,429 crore in 2014-15 to Rs 1.78 lakh crore in 2025-26, and defence exports from Rs 686 crore in 2013-14 to a record Rs 38,424 crore in 2025-26 across more than eighty countries.
For a foreign manufacturer the consequence is structural: the addressable route into an Indian homeland security programme is an Indian legal entity, an Indian production line and an Indian partner, because the import route is being closed item by item. That is why the joint-venture layer exists and why it is the layer where the negotiation is about technology transfer rather than price. For an Indian prime the consequence is equally structural: the protected position is real, but it is a position in assembly and integration, and the components inside the box are still sourced globally — which is where the supply-chain risk in Chapter 6 sits.
How competition actually plays out in a tender
Three patterns recur across the primary interviews. First, the prime is usually chosen on financial capacity and past performance, not on the analytics; the analytics is subcontracted or licensed. Second, a specialist that has qualified with one force finds it very difficult to sell to another, because the acceptance evidence does not transfer — a demonstration on the Punjab plain does not qualify a system for Himalayan altitude, and the buyer knows it. Third, price competition is fiercest in the sensing layer and shallowest in the decision layer, which is the reverse of what a buyer’s specification implies.
The competitive intensity is consequently high at the bottom, moderate at the top, and rising in the middle. The firms gaining share in our interviews were not the largest; they were the ones with a productised platform that could be re-certified cheaply, because re-certification, not invention, is the recurring cost of staying in the catalogue. That same dynamic is visible in the adjacent markets we model: the buyer of a police equipment package is a different buyer from the buyer of a CBRN detection suite, and both are different from the airport operator, which is why breadth of certification rather than breadth of product line is the durable advantage. Pheonix models those adjacencies in its Global Police and Law Enforcement Equipment Market Report 2025-2033 and its Global CBRN Protection Equipment Market 2026-2033.
Chaîne de valeur
A homeland security deployment is not a product sale. It is five layers stacked on top of each other, each with a different owner, a different margin and a different reason for existing — and in India the layer that decides whether a project succeeds is not the one that carries the most rupees.
Layer one is sensing. Cameras, thermal imagers, radars, seismic and acoustic sensors, fence-mounted intrusion detection, X-ray and metal detection, chemical and radiation detectors, biometric readers. This is where the device count lives — 11.6 million units in 2025 rising to 22.9 million in 2033 — and it is the layer that deflates fastest. Sensors are semiconductors with optics attached: they follow a cost curve, they are sourced globally, and in India they are overwhelmingly imported even when the box is assembled domestically. Sensing falls from 34 per cent of project value to 26 per cent over the forecast.
Layer two is transport and compute. Radios, fibre, microwave links, satellite backhaul, edge servers, storage. This layer is invisible in a tender until it fails. It is also the binding constraint in the terrain that matters most: a high-altitude post on the China frontier has no fibre and intermittent power, so the design question is not what the camera can see but what the link can carry. Transport and compute holds roughly 13 per cent of value and falls slightly to 12 per cent, because bandwidth gets cheaper faster than storage gets dearer.
Layer three is decision. Video management, analytics, licence-plate and face matching, sensor fusion, rules engines, the command-and-control console that turns forty camera feeds into one operational picture. This is the smallest layer by volume and the largest by consequence, and it is the only layer whose share rises sharply: 18 per cent of project value in 2025 to 27 per cent in 2033. It rises because it is the only layer that is not a commodity. A camera from any of a dozen vendors will do; the analytics library that recognises a drone at 400 metres in Punjab fog, or a face in a crowd of ten thousand at a Kumbh Mela, does not.
Layer four is integration and commissioning. Civil works, mast erection, trenching, cable, power, configuration, acceptance testing, documentation. Twenty-two per cent of value, drifting to 21. This is where Indian primes actually compete, and it is where Bharat Electronics’ own accounts tell you what the business is: on a value of production of Rs 27,254.32 crore in FY2025-26, materials were 53 per cent, employee cost 11 per cent, and profit after tax 22 per cent. An Indian security prime is a materials-conversion and test business with an eleventh of its value in labour — the precise inverse of the guard model the market is displacing.
Layer five is operations and service. Annual maintenance, monitoring contracts, spares, refreshes, managed detection. Thirteen per cent of value, rising gently to 14, and carrying the highest margin in the stack because it is the only layer billed annually against an asset that has already been paid for and cannot be abandoned.
| Value chain layer | Share of project value 2025 | Share 2033 | What sets the price |
|---|---|---|---|
| Sensing (cameras, radar, detectors, readers) | 34% | 26% | Global component cost; import duty; registration compliance |
| Transport and compute | 13% | 12% | Bandwidth and storage pricing; terrain |
| Decision layer (VMS, analytics, fusion, C2) | 18% | 27% | Detection accuracy, library breadth, certification, language support |
| Integration and commissioning | 22% | 21% | L1 tendering; site conditions; acceptance-test regime |
| Operations and service | 13% | 14% | Contract term; uptime penalty clauses; spares lock-in |
Table 2. Value-chain composition of an Indian homeland security deployment, 2025 and 2033. Pheonix Research estimates from the primary programme, reconciled against project-level disclosure in the India video surveillance model.
Why the tender cuts the layer that matters
Indian public procurement is technically qualified and commercially lowest-bid. The technical envelope is set by the indenting unit, often with vendor input; the commercial envelope is then decided on L1. The practical effect, described to Pheonix consistently across integrators bidding to Central Armed Police Force and state police units, is that the sensing layer survives the technical round at a specified resolution and the analytics layer survives at a specified feature list — and then the price comparison strips the analytics to the minimum that clears the list. Two integrators bidding the same specification will differ by 30 per cent on the decision layer and almost nothing on the hardware, because the hardware is the same box from the same distributor.
That has three consequences a supplier needs to price for. First, the analytics margin is defended by certification and by reference sites, not by feature count, because a feature can be written into a specification by a competitor. Second, acceptance testing becomes the real product: the payment milestone sits on a test the buyer designs, and a system that demonstrably works in a showroom and demonstrably fails at a border outpost is an unbilled deployment. Third, the annual maintenance contract is where the money is recovered — which is why the service layer’s share rises even as the hardware share falls, and why integrators in our interviews were more interested in the five-year service term than in the capital value of the order.
The working-capital layer nobody prices
There is a sixth layer, and it is a balance-sheet layer rather than a technical one. Deployments into state police and district administration are billed against budgets released late, and the integrator finances the gap. A project that takes eighteen months to commission and a further twelve to be paid for is a project where the margin is earned by the treasury function. This is why the Indian security market has a persistent structural feature: the primes that win are the primes that can carry receivables, which favours the listed defence-electronics houses and the large infrastructure conglomerates and disadvantages exactly the specialist analytics firms the decision layer needs.
The capital-labour economics of the whole chain now point one way. A guard costs Rs 1,86,000 a year and rises with the wage floor. A camera costs Rs 2,675 and falls. Everything between them — the pole, the link, the analytics, the maintenance — is where the next rupee of value is created, and it is the part of the chain that the current tender format is least equipped to buy well. Readers who want the camera-level arithmetic in more depth should read Pheonix’s India Video Surveillance Market Report 2025-2033, which models the same project from the camera end; the sensing-layer price floor used in this chapter comes from that model. The identity layer that sits above access control is modelled separately in our Global Biometric Technologies Market Report 2026-2033.
Activité d'investissement
The investment story in Indian homeland security is not on the demand side. It is in capacity — and that is unusual enough to be worth stating plainly, because most security markets in the world are demand-led and supply-constrained. India has spent the last decade building the supply.
The numbers the government publishes
The defence budget reached Rs 7.85 lakh crore in 2026-27, against Rs 2.53 lakh crore in 2013-14. Indigenous defence production rose from Rs 46,429 crore in 2014-15 to Rs 1.78 lakh crore in 2025-26. Defence exports reached a record Rs 38,424 crore in 2025-26, from Rs 686 crore in 2013-14, to more than eighty countries. Those three lines describe a different economy from the one that imported three-quarters of its security equipment — the framing used on the older version of this page.
On the internal-security side the envelope is smaller but the direction is the same. The Ministry of Home Affairs is allocated Rs 2.55 lakh crore for 2026-27, up 9.44 per cent, and capital outlay under the Police head — the line that actually buys equipment, vehicles, communications and systems — rises from Rs 16,579.19 crore to Rs 21,272.47 crore, up 28.31 per cent. Border infrastructure and management carries Rs 5,576.51 crore and police infrastructure Rs 5,393.37 crore.
The private side is visible in the accounts rather than the budget. Bharat Electronics grew turnover 15.87 per cent to Rs 26,679.58 crore in FY2025-26 with profit after tax of Rs 6,048.48 crore, a net worth of Rs 23,697.56 crore and 84 per cent of turnover from indigenously developed products. Its materials line at 53 per cent of value of production tells you what the capital is being spent to do: buy components, add design and test, and sell a certified system.
| Investment indicator | Latest value | Direction |
|---|---|---|
| Defence budget, FY2026-27 | Rs 7.85 lakh crore (from Rs 2.53 lakh crore in FY2013-14) | Rising |
| Indigenous defence production, FY2025-26 | Rs 1.78 lakh crore (from Rs 46,429 crore in FY2014-15) | Rising |
| Defence exports, FY2025-26 | Rs 38,424 crore to over 80 countries (from Rs 686 crore in FY2013-14) | Rising |
| MHA allocation, FY2026-27 | Rs 2.55 lakh crore, +9.44% | Rising |
| Capital outlay under Police head | Rs 21,272.47 crore, +28.31% | Rising, faster than the total |
| Border infrastructure and management | Rs 5,576.51 crore | Below projected requirement |
| Police infrastructure | Rs 5,393.37 crore | Below projected requirement |
| Modernisation of state police forces and CCTNS | Rs 450.54 crore | Flat, and small relative to state need |
| Bharat Electronics turnover, FY2025-26 | Rs 26,679.58 crore, +15.87% | Rising faster than the market |
Table 4. Investment indicators for the India homeland security market. Sources as listed; the standing committee’s assessment is used for the direction qualifiers on the two infrastructure lines.
What the capital is actually building
Three categories absorb most of it, and none of them is a factory in the conventional sense.
The first is test and certification capability. In a market where a model that is not registered cannot be sold and a test report expires in three years, the ability to test is the ability to sell. That is a capital investment in chambers, ranges, calibration and documentation, and it is the reason a domestic incumbent can outgrow its market — in the adjacent video surveillance segment the largest domestic manufacturer grew revenue 35.6 per cent to Rs 4,221 crore in FY2025-26 against a market growing 10.11 per cent.
The second is licensed production and joint-venture assembly. Because the Positive Indigenisation Lists progressively prohibit the import of listed items, a foreign original equipment manufacturer’s only durable route into an Indian programme is an Indian entity with an Indian line. The pattern established through the 2010s and now normal is an Indian conglomerate or defence-electronics house paired with an Israeli or European technology partner, with the Indian side holding the customer relationship and the certification, and the foreign side holding the design authority.
The third is software and analytics, and this is where the marginal rupee of private capital now goes. The reason is arithmetic rather than fashion: the decision layer rises from 18 to 27 per cent of project value in this forecast, it carries the highest gross margin in the stack, and it requires far less capital than a production line. A venture-scale team can build a detection model; it cannot build a radar. That asymmetry is why the specialist layer of this market is filling with firms that will never bid as prime.
The pattern that should worry an investor
Capacity built ahead of a domestic appropriation has to find demand somewhere. India’s answer has been export — Rs 38,424 crore in FY2025-26 across more than eighty countries is a genuine achievement and it is the reason the defence-electronics houses can absorb the lumpiness of Indian ordering. But it also means the investment case is no longer purely domestic: a company that has built a line for the Ministry of Home Affairs is now also exposed to export controls, to the foreign-policy posture of its partner’s home government, and to competition from other countries pursuing the same import-substitution logic.
Investment trend direction for the market as a whole is rising, and capital intensity is medium rather than high — the asset is certification, integration capability and working capital, not plant. Recent merger and acquisition activity is present and structural rather than opportunistic: the consolidating logic is an Indian prime buying a specialist capability it cannot build inside a tender cycle, and a foreign OEM buying an Indian entity to keep access to a list it can no longer export into.
Technologie et innovation
Three things have actually changed in Indian homeland security technology since 2024. Everything else is a refresh.
One: the drone turned a barrier problem into a detection problem
The interception record on the Punjab border is the clearest technology signal in this market. Roughly 300 drones were intercepted in 2024, 287 in 2025 and a similar number to August 2026 — and the same reporting describes the 462-kilometre barrier being crossed from above more than 1,200 times in two years. Read those two numbers together and the conclusion is unavoidable: the fence intercepts almost nothing that flies, and the intercepts that do happen are the product of detection and response, not of the barrier.
That shifts the technical requirement from jamming to identification. Jamming is cheap and blunt — it disrupts the link, which works until the device is autonomous, and it disrupts everything else in the band. Detection-to-identification is expensive and specific: radio-frequency detection for the control link, acoustic arrays for the motor signature, radar for the airframe, electro-optical and infrared for the confirmation, and then a decision layer that fuses four disagreeing sensors into one track with a confidence score. The cost asymmetry is brutal and it is the reason the segment compounds: the intruder’s device costs less than the sensor suite that detects it, so the defender cannot win on unit economics and must win on coverage per rupee — which means fewer, better, networked systems rather than more boxes.
This is also why the counter-drone requirement has moved out of the border force and into the command centre. An interceptor deployed at one outpost is a local answer to a problem that arrives anywhere along 3,000 kilometres. Pheonix’s Global Military Drones Market Report 2026-2033 models the platform side of the same asymmetry.
Two: inference moved to the pole, because the backhaul did not arrive
The single most consequential engineering decision in an Indian border deployment is where the computation happens. A camera at a forward post on the China frontier generates more data than the link can carry, and the link is a solar-powered radio or a satellite terminal that costs more than the camera. The answer, now standard among the integrators we spoke to, is to push inference to the edge: the device decides what is an event and transmits the event, not the stream.
Edge inference changes the economics of the whole deployment. It reduces bandwidth, which reduces the recurring cost; it reduces the central storage requirement, which was the binding constraint in the video surveillance market; and it moves the value into the device, which is why value per unit in this market rises 24.78 per cent even as the sensor deflates. The consequence is a new dependency: an edge device with a model inside it must be updatable in the field, and a model that cannot be updated is a specification that ages. Buyers are only now writing model-update and data-residency clauses into tenders, and vendors are only now discovering that a five-year service contract on an intelligent device is a software obligation, not a spares obligation.
Three: the command centre became the product
The Ministry of Home Affairs is building a technology-led command-and-control architecture for India’s land borders: a network of small command centres in forward areas linked to field headquarters and then to Delhi, integrating artificial intelligence, sensors, surveillance systems and unified command-and-control, with a pilot starting on the Pakistan border. The stated design goal is a common operational picture across cameras, sensors, image processing, drones and other monitoring inputs, and the stated benefit is reduced physical patrolling.
Two features of that description matter commercially. The architecture is explicitly not uniform — border technologies will be tailored to terrain, because India’s 15,106.7 kilometres of land frontier run through desert, mountain, riverine and forest, and the 3,488-kilometre China border is undemarcated at several points and cannot be fenced at all in the high Himalaya. And the architecture is explicitly integrative rather than acquisitive: it is a federation of existing and new sensors into a command layer, which is precisely the layer whose share of project value goes from 18 to 27 per cent in this forecast. A buyer who once bought cameras is now buying a decision system that happens to include cameras.
The unglamorous change: interoperability became mandatory
The Inter-operable Criminal Justice System links the five pillars of the criminal justice system — police through CCTNS, courts through e-Courts, prisons through e-Prisons, forensic laboratories through e-Forensics and prosecution through e-Prosecution — under NCRB as nodal agency, with interlinked data flow governed by a data-sharing matrix approved by the Supreme Court’s e-Committee. ICJS 2.0 is upgrading the applications and funding state hardware and network upgrades. CCTNS itself began in 2009 on an approved outlay of Rs 2,000 crore.
For a technology supplier this is the most important programme in the country and the least discussed. It converts policing data from a set of state silos into a queryable national asset, and it makes the police station a data producer with a specification. It is also the reason the law enforcement technology segment compounds at 9.6 per cent on a base of Rs 14,200 crore without any new capital programme: the growth is integration, migration and analytics, not hardware.
What is not changing, and why that limits the innovation premium
Two structural features hold innovation intensity at moderate rather than high, and both are regulatory rather than technical. The first is the registration regime for closed-circuit television: the Essential Requirements for security of CCTV were notified in April 2024 and compulsory registration took effect on 9 April 2025, with test reports valid for three years and non-compliant models deleted from licence scope. A three-year recertification cycle is a tax on catalogue breadth, and it rewards vendors with a narrow, well-tested range over vendors with a wide, fast-moving one. The second is that the buyer’s acceptance criteria are written around proven capability rather than novel capability; a force that must defend a procurement to an auditor will not specify a technology that has no reference site in India.
The result is a market that adopts quickly and invents slowly: sensors and analytics arrive from global supply chains, are integrated and certified locally, and are then re-specified for Indian terrain, Indian languages and Indian evidentiary standards. That is a genuine capability — it is simply a capability in adaptation, and it prices accordingly.
Risque de marché
This is a procurement forecast, and procurement is an appropriation before it is a demand curve. Every risk in this chapter follows from that sentence.
The first risk is the one the Parliamentarians named
The Department-related Parliamentary Standing Committee on Home Affairs, reporting on the 2026-27 Demands for Grants on 17 March 2026, noted that while the overall allocation under Demand No. 51 had increased, it was lower than the projected requirement under several modernisation and infrastructure heads, and observed that sustained moderation from projected levels — particularly under police infrastructure, border infrastructure and technology upgradation — may affect the pace of capacity enhancement. It recommended periodic review and additional provisioning at the Revised Estimates stage.
That is the forecast’s central vulnerability, stated by the body best placed to see it. It is not that the money will not be voted; it is that the voted money is below the stated need, and that year-end spending patterns in Indian public accounts concentrate expenditure in the fourth quarter, which is the worst possible profile for equipment that requires site surveys, installation and acceptance testing.
The magnitude is worth pricing. If the market compounds at 9 per cent rather than 11.93, 2033 lands at Rs 1,51,435 crore — USD 16.22 billion, which is USD 3.83 billion below the base case. Two point nine percentage points of growth is a rounding error in a threat assessment and half a decade of procurement in a funding line.
The second risk: the decision layer may not be a moat
The forecast assigns 15.8 per cent annual growth to cyber and digital forensics and raises the decision layer’s share of project value from 18 to 27 per cent. Both rest on an assumption that deserves to be tested: that analytics stays expensive because it is hard.
It might not. If detection becomes a feature bundled into the camera at no incremental price — which is the normal trajectory of any software capability that can be embedded in silicon — then the layer this report says captures the growth captures nothing, and the value reverts to whoever owns the device and the service contract. The sensitivity is large: if cyber compounds at 7.9 per cent instead of 15.8, the 2033 market is Rs 1,71,160 crore, USD 18.33 billion, at 10.68 per cent — USD 1.72 billion below base.
The counter-argument, and the reason this report keeps the base case, is that certification and evidentiary standards keep analytics expensive even when the algorithm is cheap. A detection model that must survive an acceptance test, a three-year product registration cycle and a court challenge is not a commodity feature, and the cost sits in the proof rather than in the code.
The third risk: the wage floor may not be a wage
The thesis of this report rests on a comparison between a guard-year at Rs 1,86,000 and a camera at Rs 2,675. The Rs 15,500 figure is the statutory minimum for a trained guard. It is not necessarily what the industry pays.
Industry disclosure puts the private security market at Rs 1,00,000 crore across roughly ten million people. That is Rs 1,00,000 of revenue per person per year — 54 per cent of the statutory annual wage of Rs 1,86,000. The two figures cannot both be literal for the whole workforce. Either a large part of the ten million is part-time, informal or unlicensed, or the revenue figure understates the industry, or the floor is widely not paid. Whichever is true, the honest conclusion is that the observed cost of guarding is below the statutory cost.
If it is 54 per cent of it, the substitution ratio is not 69.5 cameras per guard-year but 37.5. The direction of the argument is unchanged — detection still costs a fraction of the wage — but the magnitude is halved, and a reader pricing an investment off the 69.5 figure should use the lower one until they have their own wage data. This report states the caveat rather than resolving it because the resolution requires payroll evidence that no published source holds.
The fourth risk: the cyber demand signal has flattened in value
The volume of reported financial cyber fraud on the National Cyber Crime Reporting Portal rose from 19,18,835 complaints in 2024 to 24,02,579 in 2025, up 25.21 per cent. The amount citizens reported losing fell from Rs 22,848 crore to Rs 22,495 crore, down 1.54 per cent.
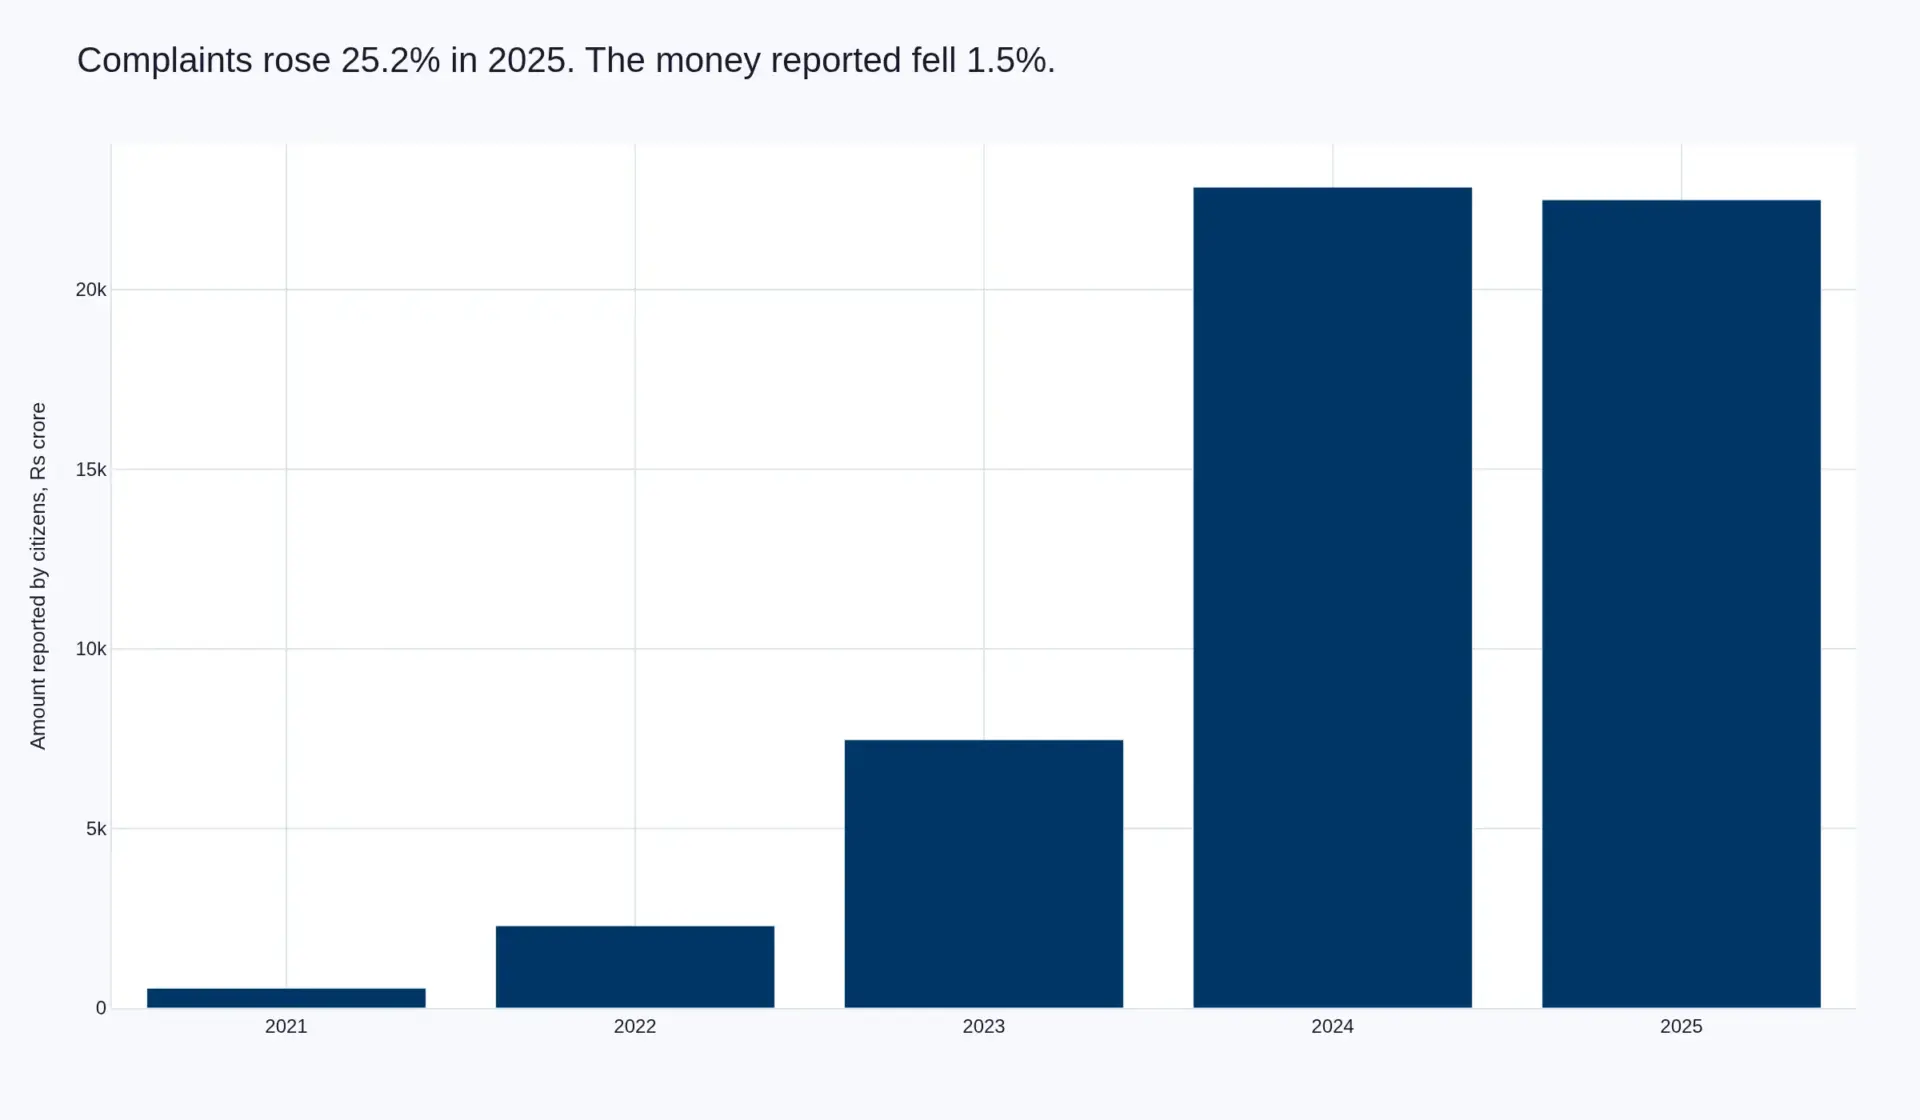
Figure 4. Amount reported by citizens to the National Cyber Crime Reporting Portal, 2021 to 2025, in rupees crore.
Read alone, that is an encouraging pair. Read as a demand signal it is ambiguous, and the ambiguity matters for the forecast. If the willingness to pay for cyber defence tracks the money lost, a flat loss figure is a flat market. If it tracks the number of citizens affected, a 25 per cent rise in complaints is a rising market with 24 million households in it. The evidence in this report leans to the second reading — the intervention with the clearest return, the Citizen Financial Cyber Fraud Reporting and Management System, has saved more than Rs 8,189 crore across 23.61 lakh complaints to 31 December 2025, which is a 36 per cent recovery rate on a per-complaint basis and the kind of number a budget committee funds. But this is the weakest link in the cyber forecast and it is stated as such.
The fifth and sixth risks: supply chain and receivables
Geopolitical exposure is high. The devices may be assembled in India; the image sensors, systems-on-chip, optics and storage inside them are not, and a significant share originates in a single country that is also the strategic subject of much of the spending. An Indian prime can be simultaneously protected from imports by the Positive Indigenisation Lists and dependent on imports for the components inside the protected product. That is a structural exposure with no near-term fix, and it is why this report scores supply-chain complexity high.
Receivables are the quieter risk. Deployments into state police and district administration are billed against budgets released late, and the integrator finances the gap between commissioning and payment. In a market growing near twelve per cent, that is a working-capital problem; in a market growing at nine, it becomes a solvency filter that removes exactly the specialist firms the decision layer needs.
What would falsify this forecast
Three observable things. First, two consecutive Union Budgets in which capital outlay under the Police head grows slower than the MHA total — that would mean the mix shift has reversed and the 11.93 per cent is unsupported. Second, a defence-electronics prime reporting flat or declining indigenous content alongside rising turnover — that would mean the indigenisation is assembly, not capability, and the value is not landing where this report says it is. Third, a mandatory analytics interoperability standard that forces the decision layer to a common interface — that would commoditise the layer this forecast depends on, faster than the 7.9 per cent sensitivity assumes.
None of the three is currently in evidence. All three are the kind of decision that can arrive in a single gazette notification, which is the appropriate level of confidence for a market whose largest single buyer is a ministry whose budget is set annually.
Paysage réglementaire
Four regulatory regimes decide whether a homeland security product can be sold in India, and they are administered by four different parts of the state. A supplier who understands only one of them will lose to a supplier who understands all four.
Regime one: procurement rules, and the trap in assuming which ones apply
The most common commercial error in this market is the assumption that defence procurement rules govern it. They do not, at least not uniformly. Ministry of Home Affairs procurement of police and security equipment runs largely on the General Financial Rules and the ministry’s own procurement manuals, while items that are defence-adjacent are routed through Ministry of Defence channels and fall under the Defence Acquisition Procedure 2020 and now the Defence Procurement Manual 2025. The two regimes have different technical-evaluation logic, different offset obligations, different emergency provisions and different appeal routes. A bid written to the wrong regime fails on form, not on merit.
Three features are shared and matter more than the differences. Procurement is technically qualified and commercially lowest-bid, so the specification is the product. Emergency procurement provisions exist and are used, which compresses the timeline and raises the value of being already qualified. And the Positive Indigenisation Lists progressively close the import route for listed items, which converts a commercial decision into a corporate-structure decision: to sell into the list, you must make in India.
Regime two: product standards, which now decide catalogue survival
The registration regime for closed-circuit television is the most consequential product regulation in the sector. The Essential Requirements for security of CCTV were notified in April 2024 and compulsory registration took effect on 9 April 2025. A model that is not registered cannot be sold. Test reports hold for three years. Non-compliant models are deleted from licence scope. This is not a labelling requirement; it is a gate on the catalogue, and it explains a pattern visible in the adjacent video surveillance market, where the largest domestic manufacturer grew revenue 35.6 per cent to Rs 4,221 crore in FY2025-26 against a market growing 10.11 per cent. That gap is share moving as unregistered supply exits, not demand accelerating.
In aviation, the Bureau of Civil Aviation Security sets the operating standard. Its order of 27 October 2026, approved by the Ministry of Civil Aviation and framed after a year of surveys involving airport operators, the Intelligence Bureau, the CISF and the Home and Civil Aviation ministries, rationalises personnel deployment across security functions, moves non-armed duties toward private agencies, and prescribes staffing for Digi Yatra lanes at one passenger service assistant per lane supervised by one assistant sub-inspector per six. It retains CISF responsibility for armed protection, perimeter security, mobile patrolling, surveillance, quick response and sensitive installations. For a technology vendor the order is a specification of what must be automated and where a human remains mandatory — which is a more useful document than any general standard.
Regime three: data protection, and the deadline that changes the product
The Digital Personal Data Protection Act 2023 and the rules notified on 13 November 2025 are the regime that will re-engineer the video and analytics layer. The rules bring core obligations into force on 13 May 2027. From that date, a system that captures identifiable images is processing personal data under a statutory framework with consent, purpose limitation, retention limits, breach notification and data-fiduciary accountability attaching to it.
Separately, section 105 of the Bharatiya Nagarik Suraksha Sanhita has required audio-video recording of searches and seizures since 1 July 2024, which makes the police station a producer of evidentiary video with a statutory chain-of-custody requirement. Together these two instruments convert what was a hardware purchase into a records-management purchase. A camera estate that cannot prove retention policy, access control and audit trail is a liability after May 2027, not an asset, and the practical procurement consequence is already visible: data-protection annexures are appearing in technical envelopes, and vendors who cannot answer them are being technically disqualified before price is opened.
Regime four: the Constitution, which explains the shape of the market
Police and public order are State subjects under the Seventh Schedule. The States and Union Territories are primarily responsible for prevention, detection, investigation and prosecution, and the Central Government supplements their effort through advisories and financial assistance under central schemes rather than through command. This single fact of constitutional design explains more about this market than any technology trend.
It explains why the market has twenty-nine sales motions rather than one; why central programmes such as CCTNS — approved in 2009 on an outlay of Rs 2,000 crore — and ICJS 2.0 are structured as schemes with state hardware and connectivity funding rather than as procurements; why a system proven in one state does not automatically qualify in the next; and why the national picture is a federation of state estates with a central integration layer on top. For a supplier, the implication is working capital: a national footprint requires parallel state pipelines, each with its own tender calendar, its own technical committee and its own payment behaviour.
What the regulatory stack does to the forecast
The net effect is a compliance-driven approval pathway and a high regulatory complexity score, and it cuts both ways. It raises the cost of market entry and therefore protects incumbents with test facilities and legal capacity. It also lengthens the interval between a product being ready and a product being sellable, which is a real drag on the innovation premium and one of the reasons this report scores innovation intensity at moderate rather than high. The offsetting effect is that compliance itself is becoming a purchased service — certification support, audit tooling, retention architecture — which is part of why the cyber and digital forensics segment and the service layer of the value chain both grow faster than the hardware they sit on.