
Global Food Safety Testing Market Report, Size, Share and Forecast 2026–2033: Eleven Amendments in Thirty-Six Months, and Seventy-Five Per Cent of the Growth Is More Tests, Not Dearer Ones
The finding this report is built on
Eleven times since April 2023, the European Union has amended the regulation that fixes maximum levels for contaminants in food. The most recent amendment, Commission Regulation (EU) 2026/1825, was adopted on 29 July 2026. Each amendment moves a limit. Each time a limit moves, a laboratory that had validated a method against the old number has to validate it against the new one, and a processor that had set its supplier specification against the old number has to reset that specification too.
That is the engine of this market, and it is not a demand story. A compliance category does not expand because people eat more food. It expands because the rulebook is opened again, because the list of things that must be measured gets longer, and because the penalty for not measuring is a recall.
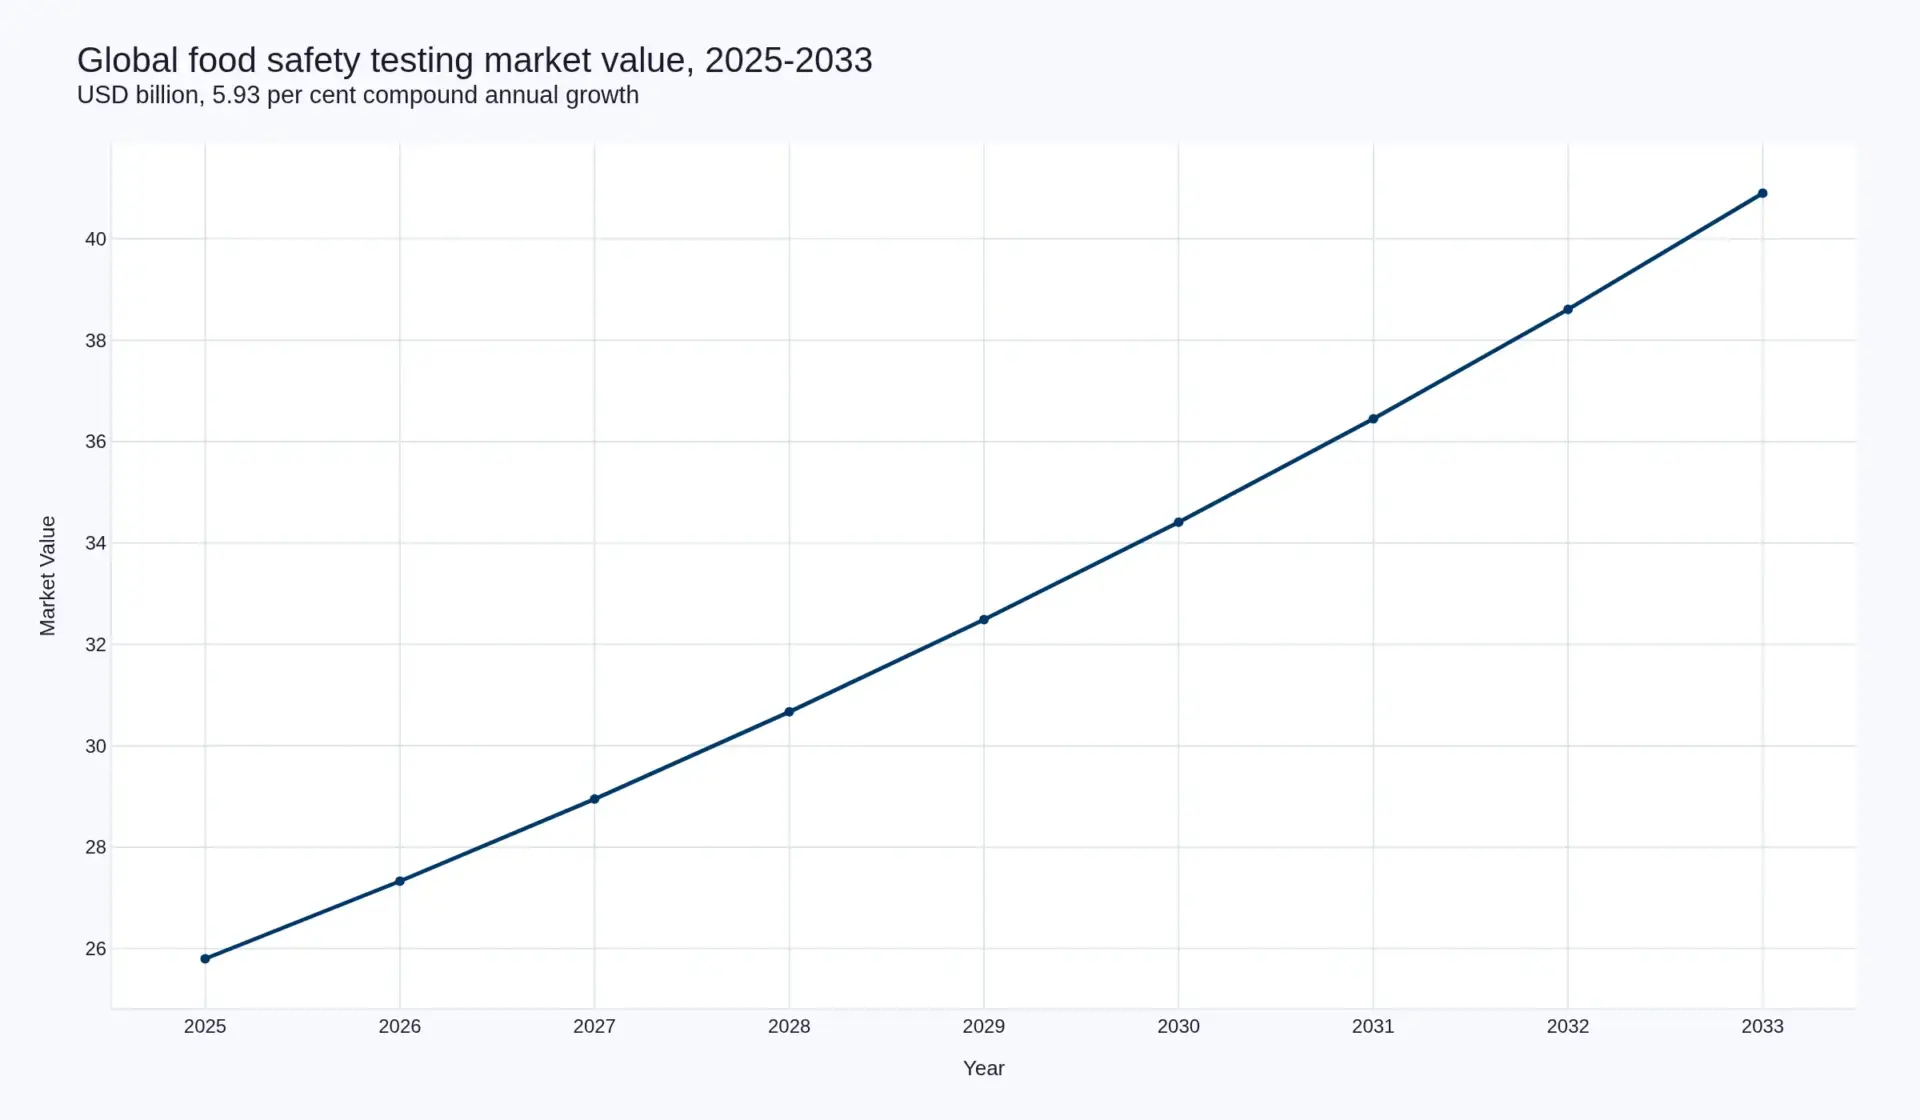
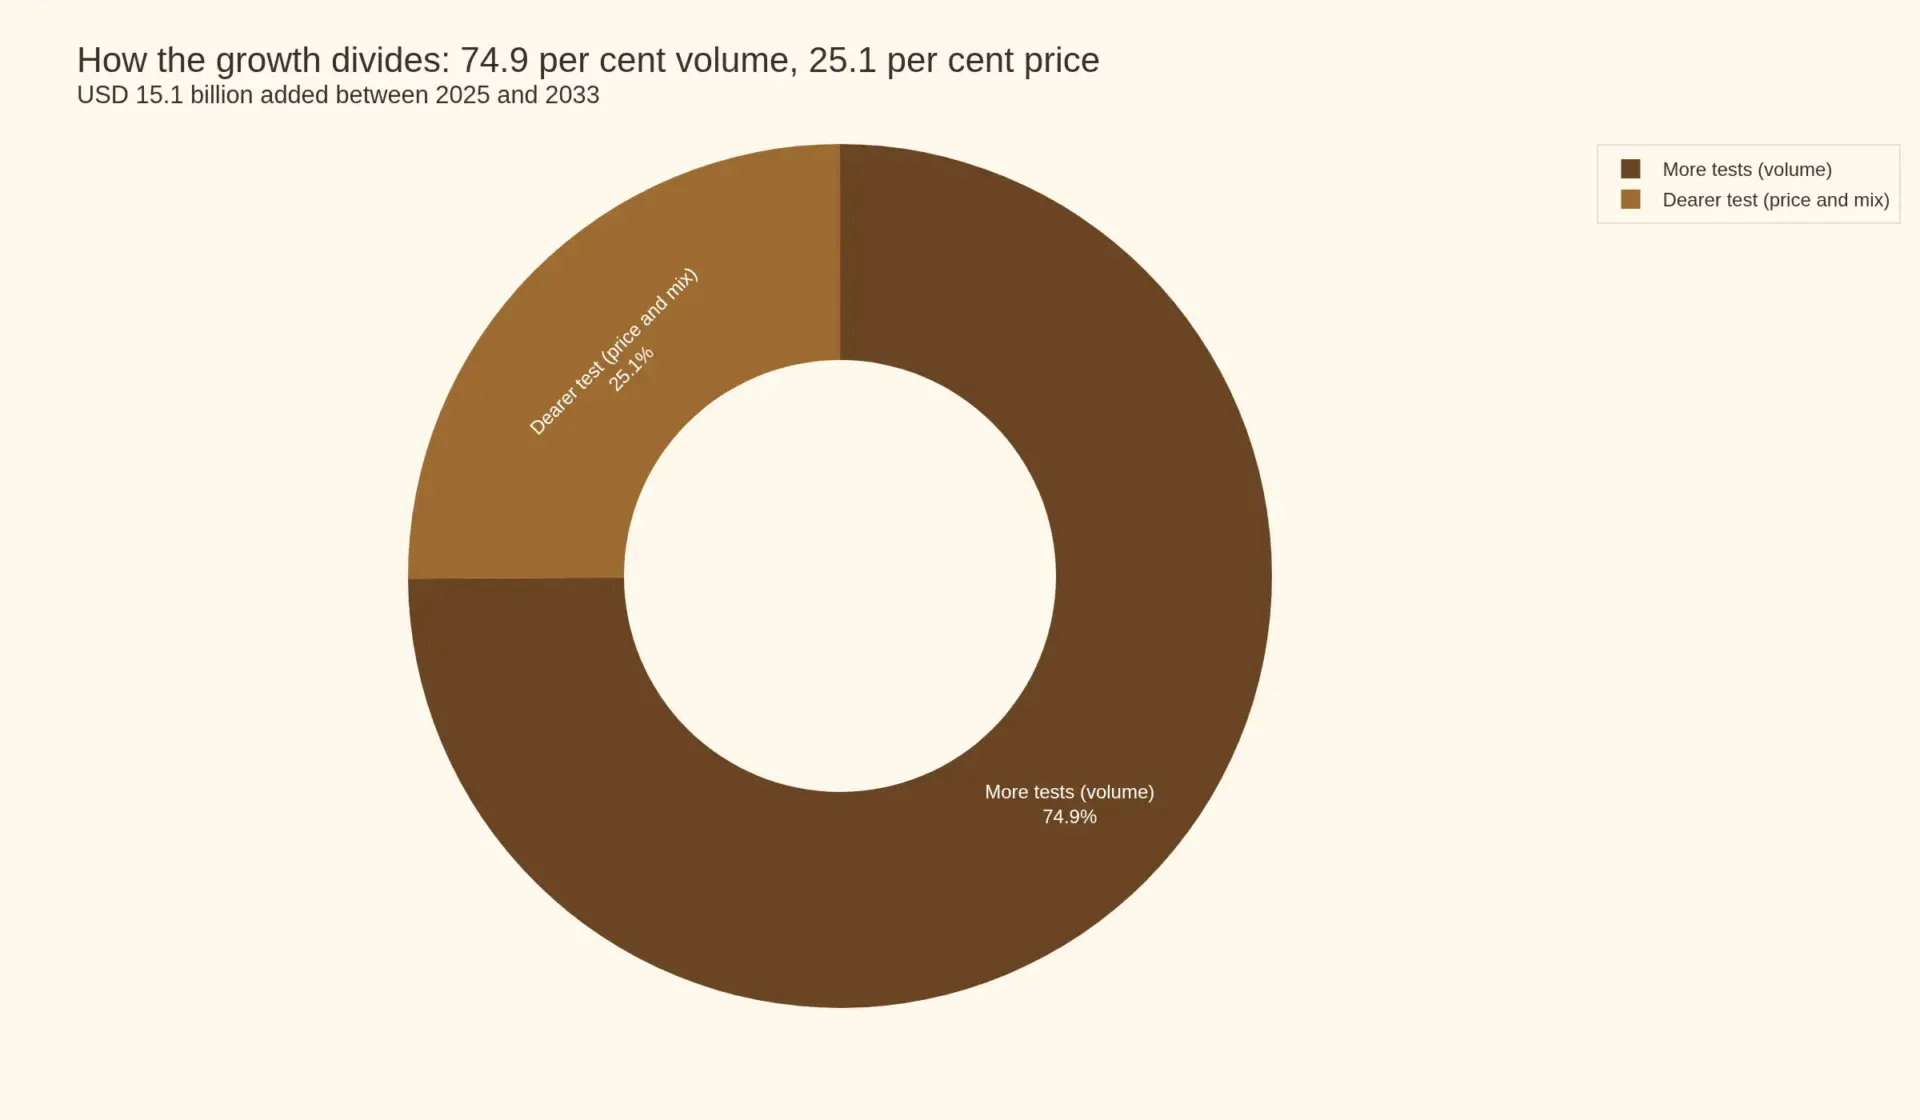
The consequence is arithmetic that looks unusual for a twenty-five billion dollar market. Seventy-five per cent of the growth between 2025 and 2033 is more tests being run, not a dearer test. A test that cost USD 14.49 to buy in 2025 costs USD 15.98 in 2033, a rise of 1.23 per cent a year. The number of tests nearly halves and doubles the other way: 1,780 million rising to 2,560 million, 4.65 per cent a year. Of the USD 15.1 billion added to the market, USD 11.31 billion is volume and USD 3.79 billion is price and mix.
That is the opposite of the pattern in most industrial and consumer categories Pheonix rebuilds, where price and mix carry half the growth or more. It is also the reason the incumbents' published numbers look the way they do. If a market grows because more tests are run rather than because each test is dearer, then the winners are the organisations with the capacity to run them, and the losers are those selling a consumable into a plant that has already bought the instrument.
Market snapshot, 2025 and 2033
| Measure | 2025 | 2033 | CAGR |
|---|---|---|---|
| Market value (USD billion) | 25.8 | 40.9 | 5.93% |
| Tests performed (million) | 1,780 | 2,560 | 4.65% |
| Value per test (USD) | 14.49 | 15.98 | 1.23% |
Value and unit lines are Pheonix constructs; the derivation, and the assumptions each one rests on, are set out in the basis note below.
How the growth divides
| Component of the USD 15.1 billion added | USD billion | Share of growth |
|---|---|---|
| More tests, at the 2025 realised price per test | 11.31 | 74.9% |
| Dearer test: price, method mix, analyte count | 3.79 | 25.1% |
Hold the realised price per test flat at USD 14.49 and 2033 is unchanged at USD 40.9 billion, but it is bought as 2,821.8 million tests rather than 2,560 million. The total is the same and the business is different: a world of four per cent more tests a year at a flat price is a world where laboratory capacity, turnaround time and accreditation are the competitive variables, and where a reagent supplier has no pricing power at all.
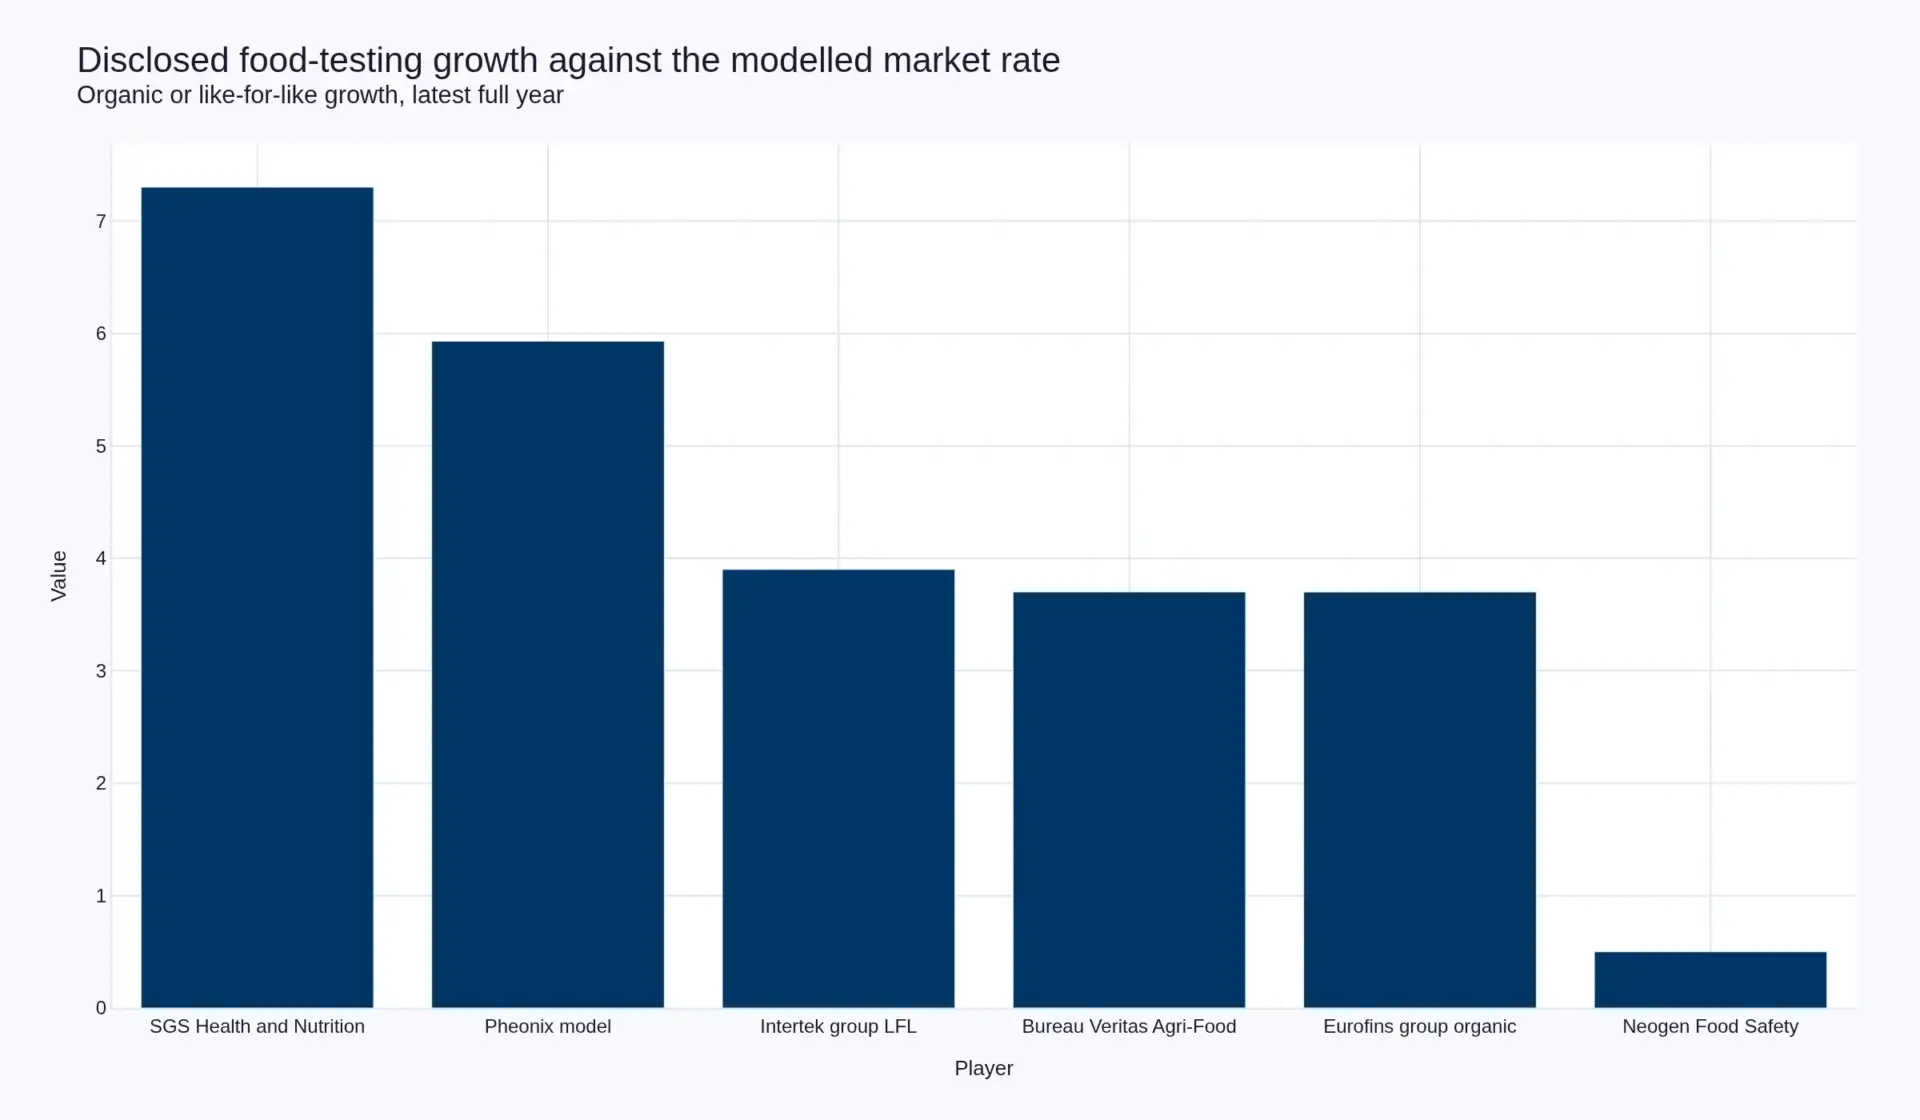
Why the incumbents' own numbers do not match this forecast
The most useful check on any model is whether the companies inside it are growing at the rate the model claims. On the food-testing lines they disclose, they are not.
| Company and line | Latest period | Growth |
|---|---|---|
| SGS, Health and Nutrition | FY2025 | +7.3% organic |
| Intertek, group like-for-like | FY2025 | +3.9% constant currency |
| Bureau Veritas, Agri-Food and Commodities | FY2025 | +3.7% organic |
| Eurofins Scientific, group | FY2025 | +3.7% organic |
| Neogen, Food Safety segment | FY2026 | +0.5% reported |
The simple mean of the four service-heavy lines is 4.65 per cent, below the 5.93 per cent this report models. That gap is not a rounding error and it is not hidden: it means either the model is too high, or the value is migrating to capacity that none of these companies reports as a segment. Both readings are examined in the competitive landscape chapter and neither is dismissed. The honest statement is that a 5.93 per cent market requires growth that happens somewhere other than the five largest disclosed food-testing books.
Basis of preparation
No company in this category reports a clean, comparable "food safety testing" revenue line. SGS reports Health and Nutrition, which includes pharmaceutical, cosmetic and nutraceutical testing alongside food. Bureau Veritas reports Agri-Food and Commodities, which includes trade inspection of grain and softs. Eurofins reports by geography and describes Food and Feed Testing inside that geography rather than as a number. Neogen's Food Safety segment is the closest thing to a pure-play disclosure in the category, and it is a consumable business rather than a laboratory business.
That is itself a finding: the category is an analytical construct rather than a reported segment, and any figure presented as its size is a build. Pheonix's build takes the disclosed food-safety-related revenue of the ten companies profiled here, adds the instrument and consumable revenue attributable to food applications, and grosses up for an unlisted tail of several hundred regional and single-site laboratories that no index covers. The resulting range is USD 24 to 27 billion for 2025; the point estimate used throughout is USD 25.8 billion.
The forecast is set inside the medium-term organic growth targets the major testing houses have published for themselves rather than above them: SGS targets 5 to 7 per cent organic, Eurofins 6.5 per cent long-term average organic, Intertek mid-single-digit like-for-like. The 5.93 per cent used here sits at the low end of that published band deliberately, because the disclosed 2025 outturn of four of the five companies came in below their own targets.
The unit line is a construct and should be read as one. No authority publishes a global count of food safety tests. Pheonix derives it from the value line and a realised price per test built bottom-up from panel pricing across microbiological, contaminant and allergen methods. Because the price is an input rather than an output, the value per test is arithmetically forced rather than observed, and the sensitivity above exists to make that explicit.
The primary component of this report is Pheonix's own analytical build — the unit line, the price and volume decomposition, the channel divergence between laboratories and consumable suppliers, and the regulatory-cadence analysis — together with a qualitative interview programme across processors, retailers, accredited laboratories and instrument distributors, conducted at sector trade events and in open-ended interviews. That interview material is reported thematically and unattributed, and no count of interviews is presented as a quantitative input, because a small non-random sample cannot carry a number.
Editorial sources
The load-bearing claims in this report are drawn from the following primary and official sources, read directly rather than summarised from secondary commentary.
- US Food and Drug Administration — FSMA Final Rule on Requirements for Additional Traceability Records for Certain Foods
- EUR-Lex — Commission Regulation (EU) 2023/915 on maximum levels for certain contaminants in food, consolidated text as at 19 August 2026
- US Centers for Disease Control and Prevention — Facts About Food Poisoning
- Eurofins Scientific — FY 2025 results
- SGS — 2025 full year results
- Bureau Veritas — key figures and revenue by business
- Intertek — 2025 full year results announcement
- Neogen Corporation — fourth quarter and full fiscal year 2026 financial results
Table of Contents
- Executive summary: the finding, the snapshot and the basis note
- How the USD 15.1 billion divides between volume and price
- Why the incumbents’ own numbers do not match this forecast
- Value chain: what a test actually costs to produce and to buy
- Why the laboratory captures the margin and the reagent does not
- Turnaround time as the real product, and the capacity constraint on volume growth
- Method substitution: culture, rapid, molecular, and where next-generation sequencing fits
- The analyte problem: multi-residue panels and why tests grow faster than samples
- Enrichment-free detection and the elimination of the 24-hour wait
- Competitive landscape: five laboratories, five consumable and instrument suppliers
- The divergence: service growth against consumable stagnation
- Regulatory landscape: eleven amendments to (EU) 2023/915 and a US deadline that moved
- Investment and consolidation: forty acquisitions at less than one times revenue
- Market risk: the price-deflation case, capacity, accreditation and reputational exposure
- What would make this forecast wrong
Competitive Landscape
Competitive landscape: two business models inside one market
Ten companies carry most of the disclosed value in this category, and they are not really competitors. Six sell accredited results. Four sell the reagents and instruments with which results are made. The distinction matters more than any market share estimate, because the two groups are moving in opposite directions and the same growth rate means different things to each.
The service laboratories
Eurofins Scientific is the largest pure testing group in the world. It reported revenue of EUR 7,296 million in 2025, up 5.0 per cent as reported and 3.7 per cent organically, with an adjusted EBITDA margin of 22.5 per cent and 24.3 per cent on its mature scope. It describes solid growth in Food and Feed Testing across most European countries, supported by both pricing attainment and volume growth — the two words that matter, because a compliance market that is achieving both price and volume is not a market in deflationary trouble. Its long-term organic growth objective is 6.5 per cent a year, and it targets a 24 per cent adjusted EBITDA margin in 2027.
SGS is the closest comparable by scale and the most useful disclosure in the category. Group sales were CHF 6,945 million in 2025, up 5.6 per cent organically and 2.2 per cent as reported. Inside that, Health and Nutrition reported CHF 882 million of sales, 7.3 per cent organic growth, adjusted operating income of CHF 124 million and a 14.1 per cent margin. The company’s own commentary is explicit that Food delivered double-digit organic growth, driven by demand for contaminants, safety testing and advisory services. It operates more than 2,500 laboratories and business facilities across 115 countries with over 100,000 employees.
Bureau Veritas reported revenue of EUR 6,466.4 million in 2025, up 6.5 per cent organically and 3.6 per cent as reported. Its Agri-Food and Commodities business, which bundles food testing with agricultural trade inspection, generated EUR 1,163.7 million, grew 3.7 per cent organically while falling 8.0 per cent as reported, and earned an adjusted operating margin of 15.1 per cent. That is the slowest-growing of the company’s six businesses alongside Consumer Products, and it sits well below the group’s 6.5 per cent organic rate.
Intertek reported revenue of GBP 3,432 million, up 4.3 per cent at constant currency and 1.1 per cent at actual rates, with like-for-like growth of 3.9 per cent at constant currency, an adjusted operating margin of 18.1 per cent and a return on invested capital of 21.3 per cent. It does not break out food and agricultural testing as a reporting segment, so its food growth cannot be isolated from the disclosures.
ALS Limited and Mérieux NutriSciences are included here as major participants in food and agricultural testing and are named in this report’s company set. Neither company’s food-specific disclosures were re-verified in this cycle, so no revenue figure is attributed to either in this edition. That is a deliberate omission rather than an oversight.
The consumable and instrument suppliers
Neogen Corporation is the purest play in the category and the most revealing company in it. Its fiscal year ends on 31 May, and for fiscal 2026 it reported total revenue of USD 870.4 million, down 2.7 per cent, with core growth of 1.9 per cent. The Food Safety segment produced USD 641.1 million, or 73.66 per cent of group revenue, growing just 0.5 per cent. Inside that segment the product lines tell the story: Indicator Testing and Culture Media, the largest line, grew 6.6 per cent to USD 332.7 million; Bacterial and General Sanitation grew 6.4 per cent to USD 175.4 million; Natural Toxins and Allergens was effectively flat at USD 77.5 million; and Rodent Control, Insect Control and Disinfectants fell 61.3 per cent to USD 18.2 million as the company exited a product line. The company earned an adjusted gross margin of 50.3 per cent and an adjusted EBITDA margin of 20.4 per cent. Its fourth-quarter core Food Safety growth of 5.8 per cent was its highest since fiscal 2023, which is the one genuinely encouraging number in the release.
Thermo Fisher Scientific, Bio-Rad Laboratories and Romer Labs supply the instruments, reagents and reference materials that the service laboratories and larger plant laboratories run. None of the three breaks out food safety testing revenue as a segment, and none is quantified in this edition. They matter structurally rather than numerically: they are the capacity constraint on the volume line, because a market that grows by running more tests cannot grow faster than the installed base of instruments and the people who operate them.
The divergence, and the currency that partly explains it
Set the verified growth rates side by side and a pattern appears. On a reported basis the four service-heavy lines average 4.65 per cent against a modelled market rate of 5.93 per cent, a gap of 1.28 percentage points. But reported growth in 2025 carried a large currency drag. SGS grew 5.6 per cent organically and 2.2 per cent as reported, a 3.4 point difference. Bureau Veritas grew 6.5 per cent organically and 3.6 per cent as reported. Intertek grew 4.3 per cent at constant currency and 1.1 per cent at actual rates.
On a constant-currency basis the same four lines average 4.92 per cent, and the gap to the model narrows from 1.28 points to 1.01. The currency effect is real, it is material, and it is the single largest reason the published numbers understate the category. It narrows the discrepancy. It does not eliminate it.
What remains is the more interesting question. A market growing at 5.93 per cent whose five largest disclosed participants grow at something closer to 4.9 per cent means the residual growth is happening in capacity that no public company reports. The candidates are the several hundred unlisted regional laboratory groups that dominate testing in most national markets, the in-house laboratories inside very large processors and retailers, and the instrument and consumable revenue attached to food applications that the large suppliers bury inside a conglomerate segment. On the evidence available, this report treats the first two as the more likely location, and it is why fragmentation rather than concentration is the correct structural description of this category despite the scale of the largest players.
Consolidation is the competitive strategy
Neither the laboratories nor the suppliers are competing primarily on price at the top of the market. They are competing by acquisition. Eurofins completed 40 business combinations in 2025 with pro-forma revenue of EUR 286 million at a cost of EUR 261 million. SGS completed 24 bolt-on acquisitions in the period from January 2025 to February 2026 representing over CHF 190 million of annual sales, including Murray-Brown Laboratories in the United States, a food, ingredient and nutraceutical testing laboratory acquired in January 2026 into the Health and Nutrition business line. That purchase is a direct move on the nutraceutical side of the demand base — the brand-owner and contract-manufacturer layer covered in the Global Dietary Supplements Market report — where identity, potency and contaminant testing run alongside the food-safety lines measured here. Intertek completed four acquisitions for GBP 156 million.
A purchase price of 0.91 times revenue tells you something about the assets being bought: regional laboratories are cheap, which means they are earning low returns on capital, which means scale is doing real work in this category rather than being a management fashion. That is the competitive fact that matters most for the forecast, and it is examined in the investment chapter.
Reading this chapter alongside the rest of the library
Testing intensity is set by the category being tested, not by its size, and several of the demand pools named above already carry their own coverage on Pheonix. The Global Gluten-Free Products Market is the clearest case in the library of a label that is itself a test result: a gluten-free claim is an analytical assertion before it is a marketing position, and the control burden lands on exactly the laboratories this chapter counts. The Global Dairy Market concentrates contaminant and hygiene volume into a small number of very large, heavily instrumented plants, which is where most of the in-house laboratory capacity described above actually sits — inside the processor, not inside a contract lab.
At the other end, the Global Olive Oil Market and the Global Dried Fruit and Nut Cracking Market are the two categories in this industry where authenticity and mycotoxin exposure respectively drive testing decisions that have little to do with regulatory cadence — a single consignment, or a single rejected lot, can justify a test that no amendment required. The Global Plant-Based Meat Market shows the opposite pressure: a young category whose allergen and protein-identity questions are still being written into specifications, which is where the next leg of method-mix accretion is more likely to come from than from microbiology.
What links them is the arithmetic this report is built on. In every case the number that decides how much testing a category buys is the cost of a result against the value of the consignment it clears, and that ratio differs sharply between categories — which is why a single blended value-per-test figure understates what is happening at either end of the portfolio. The layer that all of them buy from is covered on the Food Safety & Quality Testing segment page.
Each of the ten companies in this chapter is linked at first mention to its Wikidata entity, which is the identifier Pheonix uses to hold a company’s identity stable across reports; dedicated company profile pages for this category are not yet published, and the entity link is the durable reference in the meantime.
Value Chain
Value chain: what a test actually costs to produce and to buy
A food safety test is not one product. It is a sequence of nine steps, and the cost of each step sits on a different balance sheet. The sample is taken at the plant or on the farm. It is transported under chain of custody, usually cold. It is accessioned at the laboratory and given an identity that will survive an audit. It is prepared, which for many matrices means homogenising, subsampling and enriching. It is analysed. A presumptive positive is confirmed, usually by a slower and more specific reference method. It is reported. It sits under an accreditation system that audits the laboratory’s competence rather than its results. And finally a release decision is taken, which is the only step the buyer actually wanted.
Four cost blocks run through those nine steps: the analytical consumable, the labour, the instrument capital, and the quality overhead of running an accredited system. The proportion each takes is what separates one business model in this category from another, and it is why the same market can simultaneously contain a company earning a fifty per cent gross margin and a company earning a fourteen per cent operating margin.
The two production functions
Culture-based microbiology is the older production function and remains the reference method. Its consumable is cheap: a petri dish, a dehydrated medium, a swab, an incubation cabinet. Its labour is high, because colonies have to be read and interpreted, and its turnaround is long, because the organism has to grow. Twenty-four to forty-eight hours is the normal range for a hygiene indicator; a pathogen confirmation with biochemical or serological steps can run longer. In a culture-based workflow the consumable is a small fraction of the cost of the result that reaches the customer.
Molecular methods invert the ratio. A real-time PCR assay carries a materially more expensive consumable per reaction, a capital cost for the thermal cycler and the extraction platform, and far less hands-on labour per result. The turnaround compresses from days to hours. What does not compress is the quality overhead, which is invariant to method: method validation, proficiency testing, internal audit, document control and the accreditation assessment cycle all cost roughly the same whether the laboratory runs plates or probes.
That invariant overhead is the reason the service laboratory is a scale business. Eurofins reports a net floor area of 1,878,000 square metres at the end of December 2025, of which 905,000 square metres is owned, up from 240,000 square metres in 2018. It added 46,000 square metres of net area in 2025 alone. That is a business buying density, because density is what spreads the invariant overhead across more results. The company guides to net operating capital expenditure of around EUR 400 million a year and is completing the deployment of its eLIMS-NG laboratory information system across the network by 2027, which is a productivity investment rather than a capacity one.
Who actually keeps the money
On disclosed figures the margin structures are not close. Eurofins earned an adjusted EBITDA margin of 22.5 per cent of total reported revenue in 2025, and 24.3 per cent on what it calls mature scope. SGS reported a 14.1 per cent adjusted operating income margin in Health and Nutrition on CHF 882 million of sales. Bureau Veritas reported a 15.1 per cent adjusted operating margin in Agri-Food and Commodities on EUR 1,163.7 million of revenue. Neogen, which sells consumables rather than results, reported an adjusted gross margin of 50.3 per cent and an adjusted EBITDA margin of 20.4 per cent.
Read carelessly, that table says the consumable supplier is the best business in the category. Read properly, it says the opposite, because margin is not the same thing as value capture. Neogen’s total revenue fell 2.7 per cent in fiscal 2026 and its Food Safety segment grew 0.5 per cent. SGS’s food testing grew at a double-digit organic rate inside Health and Nutrition. A fifty per cent gross margin on a shrinking ticket is worth less than a fourteen per cent operating margin on a ticket that is growing at double digits and is bought every day of the week.
The asymmetry has a mechanical explanation. A reagent kit is sold once per instrument placement and then again with every sample, but the price of the kit is visible to the buyer and is compared against other kits. A laboratory result is sold as a service that includes sample logistics, accredited method, interpretation, turnaround commitment and an audit trail, and none of those components are line-itemed on the invoice. The laboratory is therefore pricing a bundle, and the reagent supplier is pricing a part.
Accreditation is the gate, not the science
The reason a plant cannot simply buy the kit and declare its own result is accreditation. Retailer specifications, import requirements and most regulatory acceptance routes recognise results produced under ISO/IEC 17025 accredited scope. A plant laboratory can hold that accreditation for a defined set of methods, and many large processors do, but extending scope is slow and expensive, and the consequence of an accredited result being wrong is severe in a way that a supplier’s product complaint is not.
That is the structural reason the audited service share of this market grows with regulatory complexity. Every new analyte, every lowered limit and every new matrix is a scope extension that a plant laboratory has to fund and defend, and the marginal decision is usually to send that analysis out. The service laboratory already holds the scope, already runs the proficiency scheme, and already carries the accreditation assessment.
Turnaround time is the product
The buying criterion that appears most consistently in Pheonix’s interviews with processors and retailers is not price per test. It is release time. A result that arrives after the finished goods have left the yard has no commercial value in a positive-release regime, because the consignment has either shipped untested or is sitting in a warehouse accruing cost. That single operational fact reorganises the entire value chain: it is why rapid methods command a premium despite lower sensitivity in some applications, why environmental monitoring has been the first beachhead for enrichment-free molecular tests, and why the large laboratories compete on courier networks and accessioning speed rather than on analytical price.
It is also the constraint on the volume line in this report. Two thousand five hundred and sixty million tests in 2033 is not a number that can be delivered by hiring. Microbiology technicians are scarce in every major market, and the labour content of the work only falls with automation. Robotics, liquid handling and plate readers are therefore not an adjacent opportunity to this market; they are its capacity constraint, and the suppliers of that equipment sit inside it rather than alongside it.
Where value is migrating, then, is away from the analytical step itself and towards the two ends of the chain: the front end that gets a sample into the system fast and with a defensible identity, and the back end that turns a result into a release decision. The analytical step in the middle is becoming the commodity, and the companies that own the workflow around it are the ones earning the margin.
Investment Activity
Investment and consolidation: capacity is being bought, not built
The capital flows in this category point in two opposite directions at once, and reading them together is more informative than reading either alone. The service laboratories are buying capacity. The consumable suppliers are reshaping their manufacturing and selling non-core assets. Both are rational, and together they describe a market in which scale is becoming more valuable and product ownership less so.
Eurofins: forty acquisitions and a property strategy
Eurofins completed 40 business combinations in 2025 with pro-forma revenue of EUR 286 million and adjusted EBITDA of EUR 19 million, at a total cost of EUR 261 million. That is 0.91 times revenue and 13.7 times adjusted EBITDA. The revenue multiple is the striking one: a global consolidator was able to buy food and environmental testing revenue at less than one times sales, which tells you what the sellers thought their growth and returns were worth.
The 13.7 times EBITDA multiple and the company’s reported return on capital employed of 12.8 per cent including goodwill sit alongside each other uncomfortably. Eurofins earns 34.1 per cent on capital employed once goodwill and acquired intangibles are excluded, and 52.1 per cent on a basis that also excludes the book value of owned sites. The gap between 12.8 and 34.1 is the price paid for acquisition-led growth, and it is the central question any investor in this category has to answer.
The property programme is a genuine strategic signal rather than a balance-sheet detail. Eurofins increased its net laboratory, office and storage area by 46,000 square metres in 2025 to a total of 1,878,000 square metres. Owned floor area reached 905,000 square metres, up from 240,000 square metres in 2018, including an increase of 273,000 square metres in 2025 alone. In the second half it acquired 31 related-party owned strategic campuses across eight countries, representing approximately 239,000 square metres, for EUR 298 million. The stated rationale is that owning strategic sites reserves land for future expansion and avoids the loss of leasehold improvements when a lease is not renewed. That is a company building for a physical footprint it expects to need for decades, in a business where the work is done in rooms.
Capital expenditure is guided at around EUR 400 million a year of net operating capital expenditure plus around EUR 200 million a year of owned-site investment in 2026 and 2027. Against that, Eurofins repurchased 10,693,660 shares in 2025 at an average price of EUR 52.24, representing 5.5 per cent of share capital and a 16 per cent discount to the EUR 62.40 closing price at year end. Net debt stood at EUR 3,641 million, a leverage ratio of 2.2 times against a stated target range of 1.5 to 2.5 times. The company also continued its long-running start-up programme, opening 14 new laboratories and 38 new blood collection points in 2025, part of 333 start-ups launched since 2000.
SGS: bolt-ons, and a deliberate US build
SGS completed 24 bolt-on acquisitions between January 2025 and February 2026 representing over CHF 190 million of annual sales. The one most relevant to this report is Murray-Brown Laboratories in the United States, a testing laboratory specialising in food, ingredient and nutraceutical analysis, acquired in January 2026 into the Health and Nutrition business line with 16 full-time employees. It is small in revenue terms and precise in strategic terms: it adds North American food testing capability to the business line that is already growing fastest inside SGS.
The larger transaction in the period was Applied Technical Services, which SGS describes as significantly strengthening its US position and supporting an ambition to more than double US sales by 2027 against 2023. Management expects EBITDA synergies of at least USD 30 million a year on a run-rate basis within three years of closing, with the deal accretive to earnings per share from the first year.
Intertek: returns-led rather than volume-led
Intertek invested GBP 144 million in capital expenditure, up 7 per cent, and GBP 156 million across four acquisitions in 2025. It reports that its last three years of acquisitions are delivering a 34 per cent margin, a return on invested capital of 21.3 per cent, net debt of GBP 1 billion at 1.3 times EBITDA, a completed GBP 350 million share buyback and a total shareholder return of GBP 602 million. Its capital strategy is the most disciplined of the group and the least acquisitive by count.
Neogen: the opposite strategy, and why
Neogen is doing what a supplier with flat revenue and a leverage problem does. It has agreed to sell its global Genomics business to Zoetis for anticipated total proceeds of USD 160 million and net proceeds of approximately USD 140 million after tax and closing costs, with the intention of using the proceeds primarily for debt reduction. Completion is targeted for the end of the first half of fiscal 2027, and both the Australian Competition and Consumer Commission and the New Zealand Commerce Commission have moved their reviews into a second phase, which introduces timing risk.
Separately, and more interestingly for this market, Neogen is onshoring the manufacture of Petrifilm. It expects to manufacture sellable product and to begin a planned multi-quarter manufacturing transition of Petrifilm to its Lansing, Michigan site from November 2026, with the first fully validated single kit unit anticipated by the end of August 2026. A consumable supplier moving production of its flagship product in-house during a period of revenue decline is a capacity and resilience decision, and it is a reminder that the reagent supply chain is a strategic variable in this market rather than a procurement detail.
What the capital flows imply for the forecast
Two conclusions follow. First, the capacity required to run 2,560 million tests in 2033 is largely being acquired rather than constructed, and it is being acquired cheaply. That is consistent with the volume-led growth modelled in this report, because bought capacity can be brought online faster than built capacity and does not require a price increase to earn a return.
Second, the fact that regional laboratories change hands at under one times revenue is evidence that the unconsolidated tail of this market earns poor returns. Consolidation is therefore a cost story before it is a growth story: the consolidator’s return comes from removing duplicated overhead, spreading the invariant accreditation cost across more results, and filling existing floor area, not from raising prices. That is precisely the mechanism consistent with a market where volume grows at 4.65 per cent and price at 1.23 per cent, and it is the strongest internal check on the forecast in this chapter.
Bureau Veritas’s capital expenditure and acquisition outlay in this segment were not re-verified in this reporting cycle and no figure is attributed to them here.
Technology & Innovation
Technology: four method families, and why three of them survive together
The technology story in food safety testing is usually told as a substitution: rapid and molecular methods displacing culture. That story is half right, and the half it gets wrong is the part that explains the price arithmetic in this report. Culture is not being displaced. It is being surrounded.
The four families and what each one is for
Culture-based methods remain the reference against which everything else is judged. They are slow, labour-intensive and relatively cheap per test, and they have one property no rapid method has fully replicated: a regulator, a retailer and a court will all accept a confirmed isolate. Culture is not a legacy technology awaiting replacement; it is the evidential floor of the category.
Rapid and immunoassay methods — lateral flow strips, enzyme-linked assays, simple colorimetric kits — trade sensitivity and specificity for speed and simplicity. They are the technology of the plant floor rather than the laboratory, and they exist because a screening result in twenty minutes at the line is worth more operationally than a definitive result tomorrow.
Molecular methods — polymerase chain reaction in its several forms, and increasingly isothermal amplification — trade consumable cost and capital for turnaround and specificity. They have taken the environmental monitoring application almost entirely, because that is where the time value of a result is highest: a swab taken on a Friday afternoon that produces a Listeria result on Monday is a result that has already cost the plant a production day.
Whole genome sequencing sits at the top of the stack and does something none of the others do: it establishes relatedness. A sequenced isolate can be linked to an outbreak cluster across state lines and across years, which is why public health agencies have built sequenced isolate databases and why the cost of sequencing has become a regulatory variable rather than a research budget line.
Regulatory acceptance is the adoption mechanism
The gate on any new method is not its technical merit. It is whether the method has been validated by a recognised body and accepted by a regulator, after which a laboratory can use it and still defend the result. The AOAC Performance Tested Methods programme is the most visible route into the North American market, and it is worth tracking because a certification announcement is the closest thing this industry has to a product launch.
Neogen’s Molecular Detection Assay for Listeria Right Now received AOAC Performance Tested Method certification, number 042604, in the period covered by its fiscal 2026 results. The scope is specific and revealing: enrichment-free detection of viable and non-viable Listeria species on stainless steel surfaces. Three things in that sentence matter. It is environmental rather than product testing. It removes enrichment, which is the twenty-four hour step that has always sat between a swab and an answer. And it detects non-viable organisms as well, which means it is measuring contamination history as well as current risk. That is a niche application with a large consequence, because environmental monitoring is the highest-frequency testing a food plant does and the one where turnaround has the most direct effect on whether a line runs.
The analyte problem: why tests grow faster than samples
The single most important technological fact for this report’s unit line is that the number of tests and the number of samples are diverging. A sample arriving at a modern laboratory is not tested once. It is tested for a panel: multiple pesticide residues in a single chromatographic run, multiple mycotoxins in a single mass spectrometry acquisition, several allergens in a single multiplex assay. A method that formerly measured one analyte now measures forty, at a marginal cost per additional analyte that is close to zero.
That changes what a unit is. If a laboratory reports forty analyte results from one extraction, it has performed one sample preparation and forty determinations, and the market is buying the determinations. The practical implication is that test volume can grow at 4.65 per cent a year while sample volume grows materially slower, which is exactly the pattern the unit line in this report describes.
Eurofins’ 2025 disclosure contains a clean illustration. The company launched a test for the emetic Bacillus cereus toxin, cereulide, using liquid chromatography with tandem mass spectrometry performed in accordance with ISO standard 18465:2017, aimed at dairy products, infant formula and oils. Cereulide is heat-stable, pH-resistant and enzyme-tolerant, which means it survives the processing that would kill the organism producing it. It is not a pathogen test. It is a toxin test, on a matrix set that was not routinely screened for it a decade ago. That is how the analyte count grows: not by testing more of the same thing, but by adding a hazard that was previously invisible.
Why the blended price rises only 1.23 per cent
Put those two facts together and the price behaviour in this report stops being a puzzle. Molecular and sequencing methods are more expensive per result than the culture methods they supplement, which pushes the blended price up. But culture does not exit, so the volume of cheap tests does not fall, and the mix shift is therefore gradual rather than stepwise. Meanwhile the cost of the hardware behind molecular testing falls on a learning curve, and competition among accredited laboratories passes some of that through.
The net result is a realised price per test that rises from USD 14.49 to USD 15.98 over eight years, 1.23 per cent a year. That is a modest number and it is the honest one. A market where the average price rose at the rate of the technology adoption curve would be a market where culture had disappeared, and in food safety it has not.
Where the next technology shift is likely to land
Three developments deserve attention over the forecast period. Automation of the front end is the capacity answer: robotic accessioning, automated sample preparation and plate handling determine how many tests a site can physically run, and therefore whether the 2,560 million test line is achievable at all. Sequencing as a routine quality tool rather than an outbreak response tool would move value towards bioinformatics and data interpretation rather than analysis. And rapid on-site molecular devices would, if they achieve accepted status for regulated determinations, begin to move work back out of the central laboratory and into the plant, which is the one scenario that would materially damage the audited service model described in the value chain chapter.
None of those three is yet visible enough in disclosed revenue to justify changing the forecast. All three are visible enough in product launches to justify watching, and the risk chapter treats the third as the principal substitution risk to the service share of this market.
Market Risk
Market risk: what could make this forecast wrong
This report’s forecast rests on two numbers that behave very differently from each other. Test volume is anchored in regulation and in the physical throughput of accredited facilities, which makes it relatively predictable. Price per test is the residual, and it is where the uncertainty sits. The risks below are ordered by how much damage each would do to the 2033 figure, not by how likely each is.
Risk one: price deflation in the blended test
The single largest exposure in this report is the assumption that the realised price per test rises at 1.23 per cent a year. It is the smallest of the three growth components and it carries the entire downside. Hold price flat at USD 14.49 and 2033 is USD 37.1 billion rather than USD 40.9 billion, a shortfall of USD 3.8 billion on the same test volume. That is not a catastrophe; it is a different business, and it is the more likely single alternative.
The mechanism for deflation is already visible in one place. Neogen’s Food Safety segment grew 0.5 per cent in fiscal 2026 while the laboratory service lines grew at several times that rate. A reagent kit is a visible line item on a purchase order and is compared against competing kits on price. If automation drives the cost of running a molecular test down faster than the analyte mix pushes it up, the blended price could be flat or negative for a sustained period. Eurofins’ own commentary is reassuring on this point — it reports pricing attainment alongside volume growth in European Food and Feed Testing in 2025 — but one year of pricing attainment is not eight.
Risk two: capacity and the scarcity of people
The unit line requires the category to run roughly 780 million more tests in 2033 than in 2025. That capacity has to exist physically. The binding constraint is not instruments, which can be bought, but qualified laboratory staff, who cannot be trained quickly in most markets. If automation of accessioning, sample preparation and plate handling does not keep pace, the volume line will underperform and the price line will overperform as scarcity reasserts pricing power. That combination produces a market of similar total value with a substantially different structure, and it would favour the large accredited networks over both the unlisted tail and the in-house laboratories.
Risk three: the regulatory calendar slowing rather than accelerating
This report treats regulatory cadence as the demand engine, so a slower cadence is a direct risk. The clearest live example is the US Food Traceability Rule, whose compliance date moved from 20 January 2026 to 20 July 2028 following a proposed 30-month extension and a Congressional directive that the FDA not enforce before that date. The FDA has also opened a public meeting in November 2026 to consider flexibilities for compliance, particularly on lot-level tracking, and has issued draft guidance proposing enforcement discretion for certain smaller retail food establishments and restaurants. Further deferral or widening flexibility would push traceability-driven spend beyond the forecast window.
Europe presents the opposite risk, and it is a risk of instability rather than of absence. Eleven amendments to the contaminants regulation in thirty-six months is a heavy compliance load and it is good for testing volumes, but it also creates a real possibility that a future simplification agenda consolidates those amendments and slows the cadence. A compliance market cannot assume that its regulator stays busy.
Risk four: accreditation, liability and reputational exposure
The service model rests on accredited scope, and accredited scope is a single point of failure. A laboratory that loses accreditation for a method, or that produces a false negative that becomes a recall, loses the revenue attached to that scope immediately and the customer relationship attached to it over years. The public health stakes are large enough that this is not a theoretical exposure: the US Centers for Disease Control and Prevention estimates that 48 million people fall ill from a foodborne illness each year in the United States, of whom 128,000 are hospitalised and 3,000 die, with norovirus causing the most illnesses and non-typhoidal Salmonella the most deaths.
Every one of those events that is traced to a product is also a test that either was not done, was done at the wrong limit, or was done correctly and was not acted on. The reputational asymmetry runs against the laboratory rather than the reagent supplier, which is another reason the service share of this market commands a structural premium and also carries a structural liability.
Risk five: currency, which is larger than it looks
This category is unusually exposed to translation. In 2025 SGS grew 5.6 per cent organically and 2.2 per cent as reported, a 3.4 point drag. Bureau Veritas grew 6.5 per cent organically and 3.6 per cent as reported. Intertek grew 4.3 per cent at constant currency and 1.1 per cent at actual rates. Eurofins carried a 2.2 per cent foreign exchange headwind on reported revenue growth of 5.0 per cent.
A market measured in US dollars whose participants report in euros, Swiss francs and sterling will always show a gap between the underlying business and the headline. The practical consequence is that reported revenue growth in this category understates organic growth by two to three percentage points in a year when the dollar is strong, and overstates it in a year when it is weak. Any reader comparing this report’s dollar-denominated forecast against a company’s reported local-currency growth is comparing two different things.
Risk six: prevention, and the possibility that less testing is needed
The long-run risk that deserves the most respect is the one the industry talks about least. Testing is a detection cost, not a production benefit. Every improvement in process control, environmental design, supplier qualification, cold chain integrity and predictive microbiology reduces the number of tests a business needs to run to be confident. If rapid on-site molecular devices reach accepted status for regulated determinations, a meaningful share of routine screening moves out of the central laboratory and into the plant, where it is cheaper per test and often not invoiced as a test at all.
This report does not model that as the base case, because the regulatory acceptance pathway is slow and because accreditation currently sits with the laboratory. It is the scenario that would break the service-share assumption rather than the volume assumption, and it is worth stating plainly that a market growing because more tests are run is a market that has an interest in there being more problems to find.
The two scenarios, quantified
| Scenario | 2033 value | What drives it |
|---|---|---|
| Base case | USD 40.9 billion | Tests 2,560 million; USD 15.98 per test |
| Price flat at USD 14.49 | USD 37.1 billion | Volume growth holds, no price or mix accretion |
| Price rises 2.5 per cent a year | USD 45.2 billion | Molecular mix shift outpaces automation and competition |
| Test volume grows 2.0 per cent a year | USD 33.3 billion | Prevention and on-site devices absorb routine screening |
The asymmetry is informative. The base case sits between a narrow downside on price and a wide downside on volume, and the wide one is the scenario in which this market stops being a growth market at all. That is the number to watch, not the price.
Regulatory Landscape
Regulatory landscape: eleven amendments and a deadline that moved
Food safety testing is a market whose demand curve is drawn by legislators. That makes the regulatory chapter the most commercially load-bearing section of this report, because a limit that moves is a test that must be revalidated and a specification that must be rewritten, and both of those are billed.
Europe: eleven amendments in thirty-six months
Commission Regulation (EU) 2023/915 of 25 April 2023 sets maximum levels for certain contaminants in food and repealed Regulation (EC) No 1881/2006, which had governed the field since 2006. The regulation was published in the Official Journal on 5 May 2023 and it has been amended eleven times since.
The amendment history is the single best indicator of the compliance workload in this market. Regulation (EU) 2023/1510 followed in July 2023. Eight separate amending regulations were adopted in 2024: 2024/1002, 2024/1003, 2024/1022, 2024/1038, 2024/1683, 2024/1756, 2024/1808 and 2024/1987. Regulation (EU) 2025/1891 followed on 17 September 2025, and the most recent, Regulation (EU) 2026/1825, was adopted on 29 July 2026. The consolidated text Pheonix read for this report is dated 19 August 2026 and incorporates all eleven.
Eleven amendments in roughly thirty-six months is an average of one every three to four months. Each one alters an Annex I maximum level, a scope, or a matrix. Each one therefore requires an accredited laboratory to consider whether its existing validated method still covers the amended requirement, and where it does not, to revalidate. Each one requires a food business operator to check whether its supplier specification still reflects the law. Neither activity is optional and neither is discretionary spending.
That cadence is the mechanism behind this report’s central claim. The analyte count in a laboratory’s scope expands because the Annex expands. It is not a technology-driven expansion, which would be smooth, but a regulatory-driven one, which is lumpy and which front-loads work into the months surrounding each amendment.
United States: the deadline moved, and the regulator’s own page says both things
The FDA Food Traceability Final Rule, issued under Section 204(d) of the Food Safety Modernization Act, requires persons who manufacture, process, pack or hold foods on the Food Traceability List to maintain records containing Key Data Elements associated with specific Critical Tracking Events, and to provide information to the FDA within 24 hours of a request. The rule also requires a traceability plan, the assignment of traceability lot codes, and — where the FDA requests it during an outbreak or recall — an electronic sortable spreadsheet.
The Critical Tracking Events named in the rule are harvesting; cooling before initial packing; initial packing of a raw agricultural commodity other than a food obtained from a fishing vessel; first land-based receiving of a food obtained from a fishing vessel; shipping; receiving; and transformation. For growers of listed foods, the traceability plan must include a farm map showing growing areas and their geographic coordinates.
The compliance date is where this becomes a case study in reading the primary source. The original compliance date for all persons subject to the recordkeeping requirements was Tuesday, 20 January 2026. The FDA subsequently proposed to extend that date by 30 months, to 20 July 2028. The Continuing Appropriations, Agriculture, Legislative Branch, Military Construction and Veterans Affairs, and Extensions Act of 2026 then directed the FDA not to enforce the Food Traceability Rule before that same date, and the FDA has stated that it intends to comply with the Congressional directive.
Two things follow, and both matter commercially. First, a compliance deadline that was nine months away in mid-2025 is now more than two years away, which defers a substantial wave of traceability-driven systems and testing spend past the near end of this forecast. Second, and more unusually, the FDA’s own Food Traceability Rule page still carries the sentence “The compliance date is January 20, 2026. Start working on this today!” in its body while its own update notice above records the 30-month extension.
That is not a curiosity. It is an operational hazard for every food business that reads the regulator’s website rather than the Federal Register, and it is the kind of ambiguity that generates consulting and verification revenue. The agency is also hosting a virtual public meeting on 6 November 2026 to take comment on implementation and on potential flexibilities for compliance, with particular reference to lot-level tracking, and has issued draft guidance proposing enforcement discretion for certain smaller retail food establishments and restaurants that were not captured by the existing exemption.
The analytical consequence for this report is that traceability is a recordkeeping obligation rather than a testing obligation, but it is not neutral for testing demand. Lot-level traceability is what allows a positive result to be scoped to a specific lot instead of an entire production run. The value of a test rises when the cost of the recall it triggers falls, and traceability is the mechanism by which that happens. That is a slower and less direct effect than a new contaminant limit, and it is why this report does not attribute a volume step-change to FSMA 204 inside the forecast window.
The layers underneath the headline rules
Three further regulatory layers run continuously and are, in aggregate, larger drivers of test volume than either of the two headline frameworks. Pesticide residue maximum residue limits operate on their own amending cycle and generate the highest-volume multi-residue panel work in the category. Allergen labelling and control requirements drive both the analytical testing of finished product and the environmental monitoring that sits behind a precautionary allergen statement. Authenticity and provenance requirements, which are expanding fastest of the three, convert a fraud problem into a testing obligation.
Underneath all of them sits the management system layer: hazard analysis and critical control points as the operating method, and ISO 22000 as its certifiable form. Neither specifies a test, and both specify that a business must know which hazards it controls and demonstrate that the controls work. That demonstration is where the testing budget is authorised.
Jurisdictional divergence is a cost, not an opportunity
The practical difficulty for a globally operating food business is that these regimes move at different speeds. A contaminant limit that has been tightened in one jurisdiction and not in another does not let a manufacturer run two specifications on one line; it usually results in testing to the strictest applicable limit everywhere, because segregating supply is more expensive than over-testing.
That produces a specific and underappreciated effect on price. Regulatory divergence raises cost per test in the compliant direction while competition among accredited laboratories keeps the invoiced price close to the market rate. The cost is absorbed in the laboratory’s operating margin rather than passed through. It is one reason the large laboratories’ food margins sit in the mid-teens rather than the twenties, and it is why the price per test in this report rises at 1.23 per cent a year while the regulatory burden on the same test rises considerably faster.