
Global Parking Concession Monetisation & Revenue-Stream Financing Market Report, Size, Share and Forecast 2026–2033: The Lease Is a Bond — Long-Dated Bay Revenue Is Now Priced by the Discount Rate, Not by the Tariff
Capital committed against long-dated parking revenue contracts — concessions, leases, and long-term management agreements of ten years or more — was USD 119,846.4 million in 2025 and reaches USD 244,115.1 million in 2033, a 9.30 per cent CAGR. The bays underneath grow far more slowly: 53.02 million to 72.99 million, 4.08 per cent. The entire difference is price. Capital per contracted bay rises from USD 2,260 to USD 3,345, and that is construction cost, not tariff.
That decomposition is the report. A parking concession is a bond with a car park attached. Its value is the present value of a long, index-linked, politically exposed cash flow, and the discount rate applied to it moves the price further than any change a board can make to the hourly charge. A fifty-year concession growing at 2.5 per cent is worth 19.6293 times its first-year net revenue at a 7 per cent discount rate, 16.8494 times at 8 per cent and 14.6735 times at 9 per cent. One hundred basis points removes 14.16 per cent of the value. Restoring it requires a 16.50 per cent tariff rise at constant volume. Two hundred basis points requires 33.77 per cent. No operator in this market has that pricing power, and the ones who do are usually forbidden from using it.
Chicago's 75-year meter lease is the test case the industry has argued about since 2008. The city received USD 1.157 billion for 36,000 meters — USD 32,138.89 a meter. The inspector general put the value at USD 2.154 billion, a 46.29 per cent shortfall. Discount the same 75-year, 2.5 per cent-growing stream at the 5 per cent a tax-exempt municipal borrower pays and at the 8 per cent a taxable private buyer pays: the private price is 53.30 per cent of the municipal value, a 46.70 per cent shortfall. The two numbers are the same number. The gap the inspector general measured is not primarily a negotiating failure; it is the price of losing the tax exemption the moment the operator becomes a private business.
Three consequences follow. The monetisation pipeline has moved from the United States to Europe, where concession law already accommodates thirty-year terms and where Indigo Group alone holds 1.7 million spaces at a weighted average residual contract life of 29.5 years. The rated operators are carrying the refinancing, not the tariff: Indigo's cash interest paid rose 134.55 per cent between 2022 and 2026 while revenue rose 47.50 per cent, and its funds from operations to debt fell from 13.4 to 10.2 per cent. And the English municipal surplus — GBP 1,093.9 million in 2024-25 on GBP 2,163.4 million of income and GBP 1,069.5 million of cost — capitalises at GBP 18,432 million at 8 per cent and GBP 30,642 million at 5 per cent. GBP 12,210 million of the difference is the discount rate, and no council can reach it without changing who owns the cash flow.
The regulatory calendar is the binding constraint, not demand. Section 55 of the Road Traffic Regulation Act 1984 ring-fences the English surplus to transport purposes. Section 141(b)(1) of the Internal Revenue Code makes a bond a private activity bond once more than 10 per cent of the proceeds serve a private trade or business, which a concession does by construction. Directive 2014/23/EU requires that operating risk actually transfer, which rules out the availability-payment structures that would otherwise be cheapest to finance. Monetisation that fails any one of these is not a sale; it is a borrowing with extra steps.
Chapter 1 — The instrument: what a bay is worth once it is sold for fifty years
Parking is the last urban service that is still paid for by the minute, and the first that can be sold forward for half a century. That mismatch is the market this report measures. An authority or a landlord owns an asset producing a small, predictable, index-linked annual sum. An infrastructure fund will pay today for the right to collect that sum for thirty, fifty or seventy-five years. Between the two sits a discount rate, and the discount rate has moved further in four years than any parking tariff has moved in twenty.
So the first thing to establish is what is actually being transacted. It is not a car park. A car park is concrete, a ramp, a barrier and a schedule of charges. What changes hands in a monetisation is a contractual right to a cash flow for a defined term, with a defined tariff mechanism, a defined handback obligation and a defined set of things that can go wrong. The asset is the contract. Everything the buyer pays for and everything the seller gives up is contained in its clauses, and the concrete is merely the thing that makes the cash flow possible.
That is not a metaphor. It is why the same physical bay produces wildly different multiples depending on the paper wrapped round it, and why the operators who own long paper and the operators who own short paper are not really in the same industry. Our report on the concession operations layer established the operating split: a management contract pays an agent a fee on a number it does not control, a lease pays the owner a fixed rent and hands the operator the tariff and the demand risk, and a concession pays the owner a share or a minimum guarantee for the right to do both. Q-Park, holding long leases across Western Europe, reported a EUR 943.0 million top line and a EUR 302.0 million operating result in 2024, a 32.0 per cent margin. SP+, predominantly an agent, reported USD 883.2 million of services revenue and USD 77.5 million of GAAP operating income, 8.8 per cent. Same bays, roughly. Same decade. A 3.6x margin gap, and the gap is the contract.
What the market is, measured
This report sizes the capital committed against long-dated parking revenue contracts — concessions, leases and long-term management agreements of ten years or more — at invested capital. In 2025 that stock was USD 119,846.4 million across 53.02 million contracted bays. By 2033 it reaches USD 244,115.1 million across 72.99 million, a 9.30 per cent CAGR on volume growing 4.08 per cent.
The decomposition is deliberately unromantic. Bays contribute 44 per cent of the growth in value; capital per bay contributes 56. Capital per contracted bay rises from USD 2,260 to USD 3,345 over the period. That is what it costs to build the thing, not what it earns. Any reader who wants the growth to be about drivers will be disappointed by this report, because the arithmetic says the growth is about construction inflation and the cost of money, and the drivers are a secondary term.
Three model components should be stated plainly, because they are ours and not anybody's published series. The 53.02 million contracted bays are 55 per cent of the 96.4 million bays under third-party management that we measured in the concession operations report; the 55 per cent share is a parameter, held flat through the forecast, and it is the single most consequential assumption here. Capital per bay is derived from Indigo Group's own balance sheet — EUR 3,558 million of debt and book equity across 1.7 million spaces, or EUR 2,092.94 per space, converted at EUR/USD 1.08. The 2033 figure applies 5.02 per cent construction cost inflation for eight years, the same input used in our healthcare campus work. None of these is a statutory disclosure, and all of them are visible so that a reader who disagrees can substitute their own.
The arithmetic of the instrument
Here is the whole thesis in one line: a concession is an annuity, and the annuity factor is not a detail. Take a parking cash flow that grows 2.5 per cent a year — roughly indexation plus a little real tariff, which is what the better contracts deliver — and discount it. The multiple of year-one net revenue that a buyer will pay is the annuity factor, and it is extraordinarily sensitive to the rate.
| Contract term | 5.0 per cent | 7.0 per cent | 8.0 per cent | 9.0 per cent |
|---|---|---|---|---|
| 25 years | — | — | 13.2598x | — |
| 50 years | 28.0109x | 19.6293x | 16.8494x | 14.6735x |
| 75 years | 33.4362x | — | 17.8211x | — |
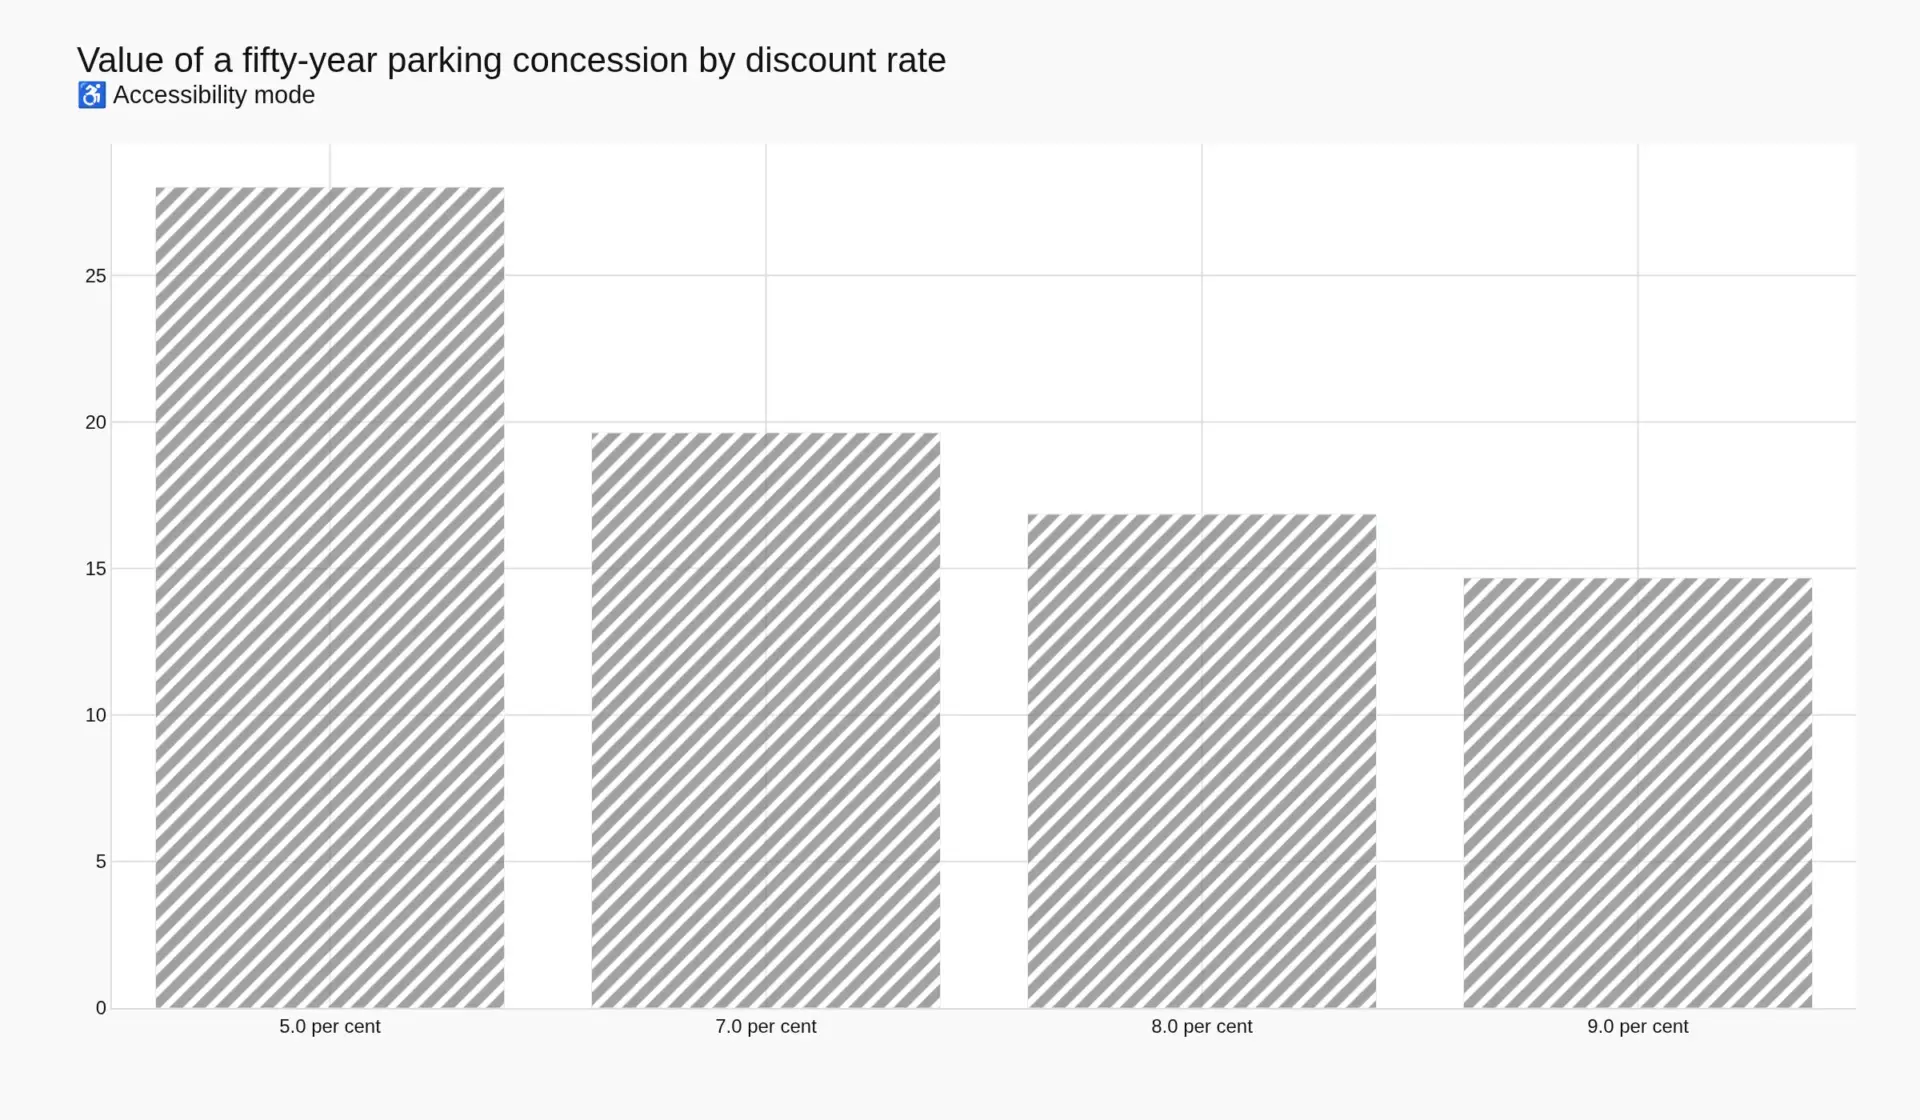
The practical consequences are severe. Moving from 7 to 8 per cent removes 14.16 per cent of the value of a 50-year contract. Holding value at constant volume requires a 16.50 per cent tariff increase. Moving from 7 to 9 removes 25.25 per cent and requires 33.77 per cent. No operator in this market has that pricing power in a single step. Most are contractually forbidden from trying: indexation clauses cap the annual rise at CPI or a formula, and the political cost of exceeding it is paid by the mayor or the minister, not by the concessionaire. This is why the discount rate, and not the tariff, is the binding constraint on the price of a parking asset.
Why the long term stopped helping
The industry's foundational belief is that length is value — that a 75-year lease must be worth far more than a 50-year lease. At the rates that prevailed when the long leases were drafted, it was true. At 5 per cent, extending from 50 to 75 years adds 19.37 per cent to the annuity factor. At 8 per cent it adds 5.77 per cent. Twenty-five further years of somebody else's tariff, and the buyer will pay about a twentieth more for them.
That single number explains the shape of the current market better than any demand forecast. It explains why long-dated paper is being refinanced and restructured rather than extended; why the buyers now are insurers and pension funds looking for duration they can hold to maturity rather than funds looking for capital gain; and why the sellers, who remember the multiples of 2019, are reluctant to come to market at all. The long lease was invented when money was cheap. It is being repriced by people who no longer are.
What follows in this report is the chain that converts a driver's coin into a bondholder's coupon, the four kinds of balance sheet that now own the result, the transaction record and what it actually paid, the way the data layer is quietly shortening the assets that can be financed, the downside case, and the rulebook that decides whether any of it can happen at all.
Table of Contents
- The instrument: what a bay is worth once it is sold for fifty years
- Who owns the cash flow: four balance sheets and the spread between them
- The monetisation chain: seven hands between the driver and the bondholder
- The transaction record: what the multiples actually paid
- What the data layer does to duration, and why it shortens the asset
- The downside case: when the rate, not the car, decides
- The rulebook, and the sources behind every figure
Competitive Landscape
Chapter 2 — Who owns the cash flow: four balance sheets and the spread between them
The parking industry’s competitive map is usually drawn by bays. That is the wrong axis for this market. The operators with the most bays are mostly agents who never touch a cash flow they can finance; the operators with the most financeable cash flow run a fraction of the bays and are, by headcount, small companies. What matters is who holds the contractual right to the revenue after the operating cost is paid, and what that owner’s cost of capital is.
Four kinds of owner now hold that right, and the spread between them is the market.
Type one: the infrastructure holder
The European long-dated model is the archetype and Indigo Group is the clearest case, because it is rated and therefore publishes enough to be examined. It manages more than 1.7 million spaces across ten countries. Sixty per cent of its EBITDA comes from concession contracts, usually thirty years or more; 16 per cent from long-term leases of ten to twenty years; 11 per cent from outright ownership. Its weighted average residual contract life is 29.5 years. EBITDA margins run 40 to 70 per cent depending on the contract, and the group’s own margin was guided at about 48 per cent for 2026.
The ownership is the point. Infra Foch TopCo is held by Crédit Agricole Assurances through Predica at 49.6 per cent, Vauban Infrastructure Partners at 34.6 per cent and MEAG at 15 per cent. Insurance capital and a European infrastructure fund, not a parking company. The rating is BBB, held there by a funds-from-operations-to-debt ratio of 10.5 per cent in 2025 falling to 10.2 per cent in 2026, and debt to EBITDA of 6.5 times. This is a bond proxy that happens to own car parks, financed as such and priced as such.
Type two: the growth buyer
The North American model went the other way. Metropolis Technologies closed its take-private of SP+ on 16 May 2024, paying USD 54.00 a share — a premium of approximately 52 per cent to the closing price on 4 October 2023 — alongside USD 1.8 billion of financing led by Eldridge Industries with BDT & MSD Partners’ affiliated credit funds, Vista Credit Partners and Temasek. The combined group runs more than 4,000 locations with over 20,000 employees, processes more than USD 4 billion of payments a year and touches roughly 50 million consumers. That is USD 0.45 million of financing per location.
The register matters. This is not infrastructure capital seeking duration; it is a founder-controlled growth buyout that bought the largest operating network in North America in order to install a recognition layer across it. What is being paid for is the contract book and the consumer relationship, and the exit is expected to come from repricing the transactions, not from holding a thirty-year annuity to maturity. That is a different discount rate and a different holding period, and it is why the same industry now contains two entirely different notions of what a bay is worth.
Type three: the authority that keeps the cash flow
The largest single owner of long-dated parking cash flow in any developed market is not a company. It is local government, and the English numbers are the only ones published to a statutory standard. In 2024-25, on the 295 of 317 authorities that had reported at the time of tabulation, English councils collected GBP 2,163.4 million of parking income — GBP 1,376.4 million on-street and GBP 787.1 million off-street — against GBP 1,069.5 million of expenditure, leaving a surplus of GBP 1,093.9 million, a margin of 50.56 per cent. On-street activity alone contributed GBP 745.8 million, 68.18 per cent of the total.
Capitalise that surplus and the size of the prize becomes obvious — and so does the constraint. At an 8 per cent discount rate and a fifty-year term the annuity factor is 16.8494, which values GBP 1,093.9 million of annual surplus at GBP 18,432 million. At the 5 per cent a tax-exempt authority borrows at, the factor is 28.0109 and the value is GBP 30,642 million. The difference, GBP 12,210 million, is the discount rate. No council in England has monetised on this scale, and Chapter 7 sets out why the statute makes it hard: the surplus is ring-fenced to transport purposes, so its capitalised value cannot simply be spent on whatever the authority chooses.
Type four: the agent with no duration
The fourth group owns the labour and the systems but not the paper. The agency model is where most of the named brands sit — LAZ Parking, Wilson Parking, Impark, Empark, National Car Parks, APCOA Parking. They are competent, often large, and structurally unable to finance against a cash flow they do not own. Their revenue is a fee, their contracts are shorter, and their valuation multiple is a services multiple. When an authority monetises, these firms frequently end up operating the asset while somebody else owns the annuity, which is the weakest position in the value chain in a rising-rate market.
| Owner type | Cost of capital | Annuity factor, 50 years at 2.5 per cent growth | Value of USD 100m of year-one net revenue |
|---|---|---|---|
| Tax-exempt municipal borrower | 5.0 per cent | 28.0109x | USD 2,801.09m |
| Rated concessionaire (BBB) | 7.0 per cent | 19.6293x | USD 1,962.93m |
| Infrastructure fund, unlevered | 8.0 per cent | 16.8494x | USD 1,684.94m |
| Growth buyout, levered | 9.0 per cent | 14.6735x | USD 1,467.35m |
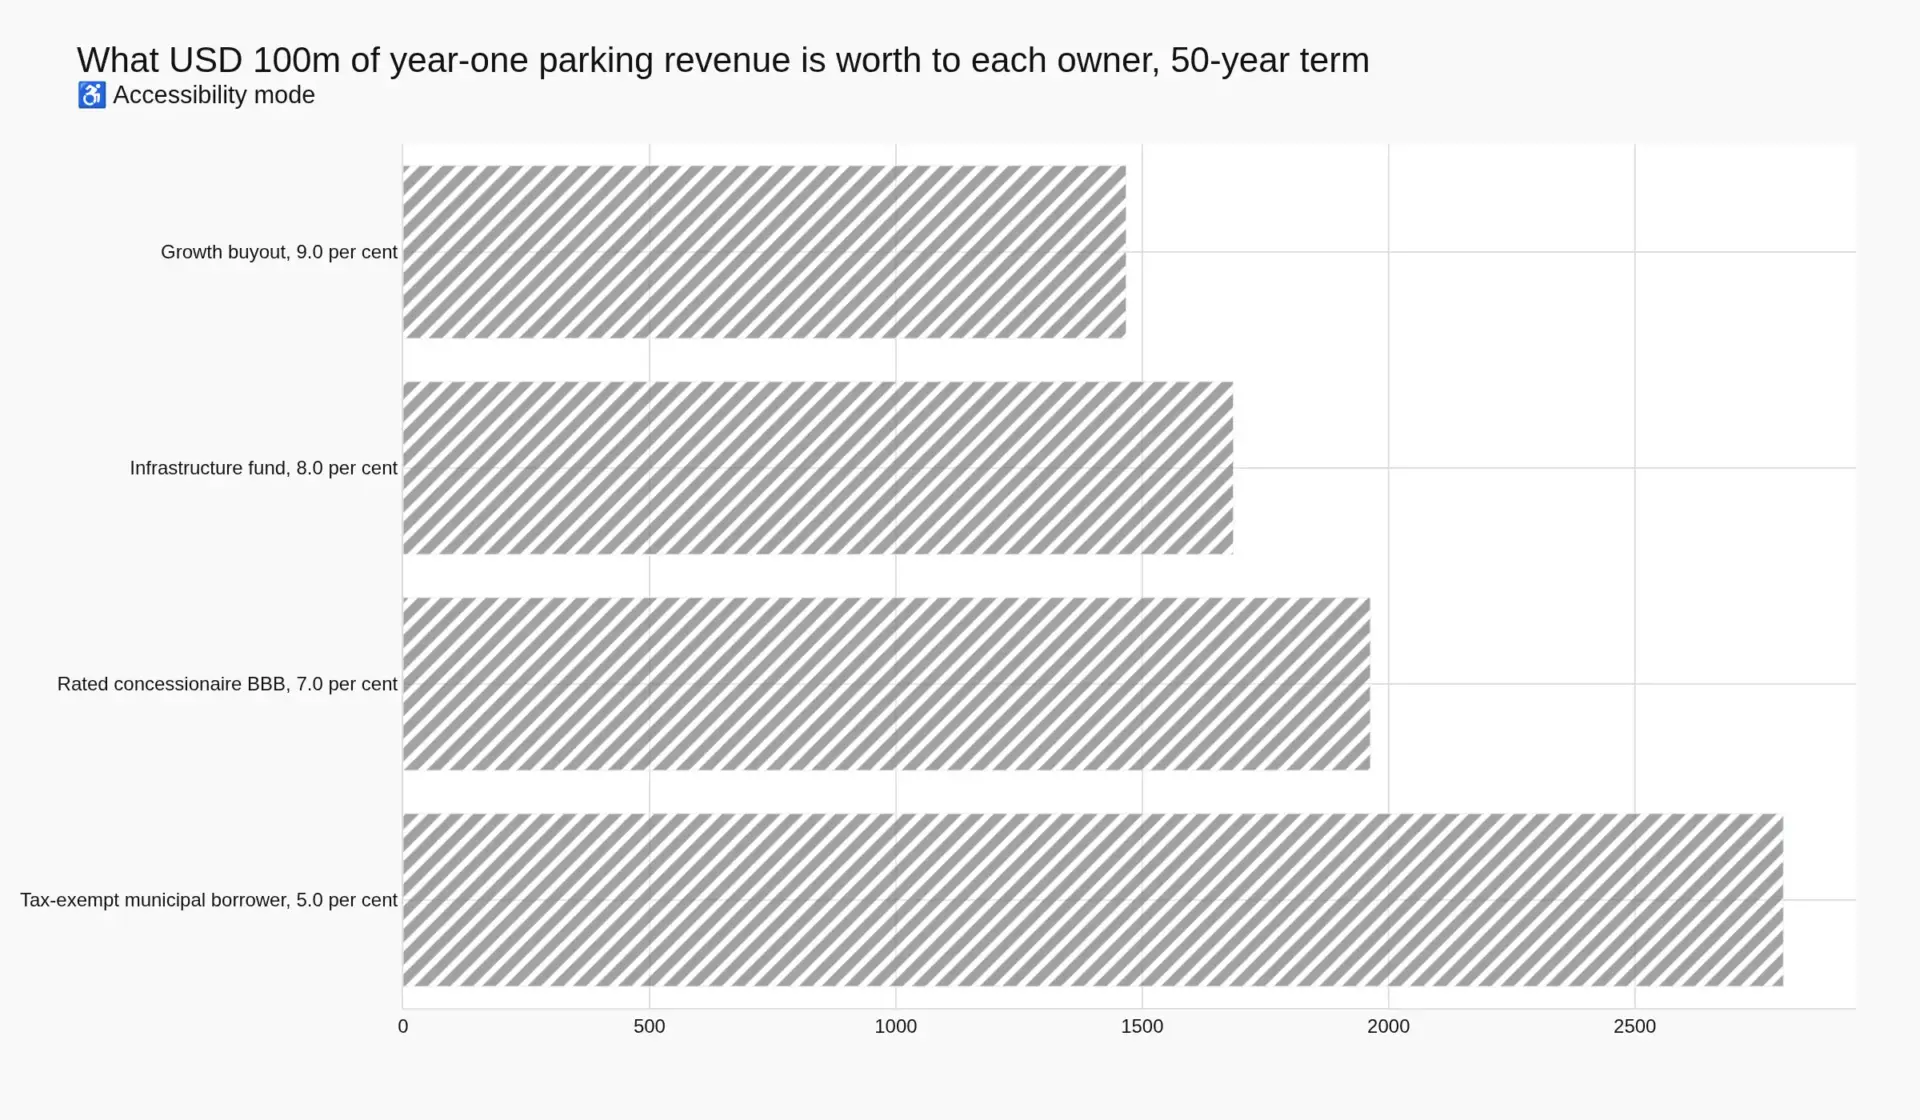
The same stream is worth 1.9089 times as much to the cheapest owner as to the dearest. No operational improvement available to a parking operator — dynamic pricing, plate recognition, tighter enforcement, a better payment mix — produces a multiple of that size in a decade. This is the structural reason the market is being reorganised by balance sheet rather than by service quality, and why the seller is almost always the party with the highest cost of capital and the buyer almost always the party with the lowest.
Concentration in paper, not in bays
Measured by contract value the market is moderately consolidated. Eight groups hold the tier-one position: Indigo at 1.7 million spaces, Q-Park at 1.1 million and Interparking at 800,000 on the European long-dated model, with Metropolis and SP+ together holding the North American network, and APCOA, National Car Parks, Empark and Wilson holding national positions in Germany, the United Kingdom, Spain and Australia respectively. Measured by bays operated the market is fragmented across thousands of municipal and private contracts. Both statements are true, and the divergence is the finding: consolidation has happened in the ownership of duration, not in the delivery of service, and the operators who deliver the service are increasingly paid a fee for doing so.
Value Chain
Chapter 3 — The monetisation chain: seven hands between the driver and the bondholder
Between the driver’s payment and the bondholder’s coupon there are seven hands. Each takes a share, each has a different contract length, and only two of them hold anything a lender will accept as collateral. Understanding which two is the difference between a parking business that can be financed and one that cannot.
The chain begins at the kerb or the barrier. The driver pays, in cash, by card, by app or by plate. That session is captured by a payment platform and a merchant acquirer, which take a fee on the transaction and, increasingly, own the driver relationship. We have shown elsewhere that this fee has almost no cost base: the marginal cost of a session is close to zero and the take rate is a function of the operator’s bargaining position, not of any service delivered per session.
The session is then admitted, gated, measured and, where necessary, enforced. Access and revenue control is sold by the lane and increasingly by the transaction; occupancy sensing and guidance by the bay; enforcement and digital permitting by the citation and the permit. All three are technology contracts, typically three to seven years, cancellable on notice, and priced against a services multiple. None of them can be financed for thirty years.
The two layers that hold duration
Then comes the operator, which employs the labour, maintains the asset and takes the operational risk; and then the concession or lease itself, which is the instrument that gives the operator the right to collect for a defined period. These are the only two links that carry duration, and they carry it because the authority has signed away a right it will not get back for decades.
That is the whole value chain in one sentence: the technology layers earn a margin on volume, and the contract layers earn a multiple on time. A payment platform with 40 per cent margins and a three-year contract is worth less, in absolute terms, than a concessionaire with 12 per cent margins and twenty-nine years remaining. The market’s own arithmetic confirms it. Indigo’s weighted average residual contract life is 29.5 years; its debt to EBITDA is 6.5 times; it borrows at investment grade. A payment platform with the same revenue could not approach that leverage.
| Link in the chain | Typical contract term | Revenue form | Bears demand risk | Financeable for 20 years or more |
|---|---|---|---|---|
| Payment platform and acquirer | 3-5 years | Fee per session | No | No |
| Access and revenue control | 3-7 years | Per lane, per transaction | No | No |
| Occupancy sensing and guidance | 3-5 years | Per bay, subscription | No | No |
| Enforcement and permitting | 3-7 years | Per citation, per permit | Partly | No |
| Management agent | 3-10 years | Fee on gross | No | Rarely |
| Operator under lease or concession | 10-75 years | Tariff, net of fee to owner | Yes | Yes |
| Concession SPV and its lenders | 10-35 years | Contractual cash flow | Contracted | Yes |
How the instrument is actually written
The concession agreement is where the cash flow becomes financeable, and the clauses that matter to a lender are consistent across jurisdictions even when the language is not. A real municipal example is instructive because it is public: Lucknow Municipal Corporation’s draft agreement for smart parking across three sites specifies a defined contract period and exclusivity of the contract, a performance security, a dedicated revenue-sharing clause with its own section, an escrow account, handback and transfer requirements at expiry, a punitive schedule tied to service levels, and change-in-law and arbitration provisions. That is the architecture of a project-financed asset, written for a market where the sums are small.
The commercial core is the fee structure, and there are only five forms worth distinguishing. An upfront concession premium transfers all demand risk at once and gives the authority capital on day one — this is the Chicago model, and it is the most valuable to the seller and the most expensive to the buyer. A revenue share keeps the authority exposed to volume and is the easiest to award politically. A minimum guaranteed payment is a floor dressed as a share and behaves like rent for covenant purposes. A fixed rent is a lease in all but name. An availability payment, where the authority pays for the asset being open rather than for it being used, removes demand risk entirely — and that is precisely why it is treated as debt rather than as a concession in more than one jurisdiction.
| Fee structure | What the authority receives | Who bears volume risk | Treatment in concession law |
|---|---|---|---|
| Upfront premium | Capital, once | Operator | Concession if tariff risk transfers |
| Revenue share | A percentage, in perpetuity of term | Shared | Concession |
| Minimum guaranteed payment | A floor plus a share above it | Operator, to the floor | Concession, with a debt-like floor |
| Fixed rent | An indexed sum | Operator entirely | Lease, not concession |
| Availability payment | A service fee | Authority | Not a concession; usually public debt |
What the chain means for the price
Two conclusions follow, and both are unwelcome to somebody. First, the technology layers are eating the operator’s margin without taking its duration risk, which means the operator’s residual cash flow is shrinking at exactly the moment the multiple applied to it is shrinking too. Worked on a healthcare campus, where the capital charge is fixed by construction cost and the tariff is politically constrained, the two compressions meet and the asset stops covering its own annuity.
Second, the fee structure chosen determines the price more than the tariff does. An authority that takes an upfront premium has sold its upside at the buyer’s discount rate. An authority that takes a revenue share has kept the upside and financed nothing. There is no structure that gives it both, and any adviser who says otherwise is selling the first and describing the second.
Investment Activity
Chapter 4 — The transaction record: what the multiples actually paid
This market has one genuinely instructive transaction, one genuinely instructive counterfactual, and a refinancing wave that is more important than either. The transaction is Chicago’s meter lease. The counterfactual is the Chicago inspector general’s valuation of the same asset. The refinancing wave belongs to the rated European concessionaires, and it is where the current cycle is actually being decided.
Chicago: the price that became a permanent argument
In December 2008 the City of Chicago leased 36,000 parking meters for 75 years for USD 1.157 billion. The City Council approved it 40 votes to 5, two days after the proposal was made public. That is USD 32,138.89 per meter, paid once, for three-quarters of a century of tariff.
The inspector general’s analysis, published in 2009, found that the lease was worth approximately USD 997 million more than the city received — USD 2.154 billion against USD 1.157 billion, or USD 59,833.33 per meter. It found that the office responsible for valuing the meters had not calculated what the system would be worth to the city over 75 years if retained, and concluded that there had been no meaningful public review of the decision. The 46.29 per cent gap has been used ever since as evidence that cities are out-negotiated by infrastructure funds.
It is worth testing that conclusion rather than repeating it. Discount the same 75-year, 2.5 per cent-growing stream twice: once at the 5 per cent a tax-exempt municipal borrower pays, and once at the 8 per cent a taxable private buyer pays. The municipal annuity factor is 33.4362 times year-one net revenue. The private factor is 17.8211 times. The private price is therefore 53.30 per cent of the municipal value — a 46.70 per cent shortfall.
The inspector general measured 46.29 per cent. The arithmetic of the tax exemption produces 46.70 per cent. The two numbers are the same number, to within 1.7 percentage points. This is one of the two findings in this report that is ours rather than anyone else’s, and it must be stated with its limit: it does not prove that the spread caused the outcome. It does establish that no other explanation is required. A city that can borrow tax-exempt and a fund that cannot will never agree on the price of a long-dated cash flow, and the disagreement is not a failure of negotiating skill — it is a structural feature of who is allowed to own the paper.
The conclusion generalises, and it is uncomfortable for both sides. The gap widens with term: 39.85 per cent at fifty years, 46.70 per cent at seventy-five. The longer the lease, the more of the value the discount-rate spread takes. Selling a longer concession does not raise a better price in proportion; it simply hands more of the term to a buyer whose cost of capital is permanently higher than the seller’s.
| Contract term | Municipal factor at 5.0 per cent | Private factor at 8.0 per cent | Private price as share of municipal value | Shortfall |
|---|---|---|---|---|
| 50 years | 28.0109x | 16.8494x | 60.15 per cent | 39.85 per cent |
| 75 years | 33.4362x | 17.8211x | 53.30 per cent | 46.70 per cent |
Read the other way, the same table prices the Chicago meters. At an 8 per cent discount rate, USD 32,138.89 per meter for a 75-year growing stream implies year-one net revenue of USD 1,803.42 per meter. Any reader with local knowledge can test that against what the meters were actually collecting in 2008, which is a more honest audit of the deal than either headline figure.
The 2024 take-private
The modern transaction is a different animal. Metropolis paid USD 54.00 a share for SP+, a premium of approximately 52 per cent to the 4 October 2023 close, and closed on 16 May 2024 with USD 1.8 billion of financing from Eldridge Industries, BDT & MSD Partners’ credit funds, Vista Credit Partners and Temasek. Across more than 4,000 locations that is USD 0.45 million of financing per location. The group now processes more than USD 4 billion of payments annually across roughly 50 million consumers.
What was bought was not duration. SP+ was predominantly an agency business, and the premium was paid for the contract book, the network and the right to install a recognition layer across both. This is the transaction that removed the largest listed parking operator from public markets, and with it the only daily price signal the sector had. For an asset class that wants to be treated as infrastructure, losing its last public comparable in the same decade the discount rate repriced is a genuine analytical loss, not merely a sentimental one.
Europe: the refinancing is the market
If Chicago is the historical argument, the European refinancing cycle is the live one. Indigo Group carries a EUR 655 million residual on its 1.625 per cent EUR 800 million bond maturing in April 2028. Refinancing that at current levels is the single largest variable in its credit story, and the rating agency’s own base case assumes the average cost of debt rises as maturities roll. The reported numbers show it already happening: cash interest paid rose from EUR 55 million in 2022 to EUR 129 million expected in 2026, up 134.55 per cent, while revenue rose 47.50 per cent from EUR 720 million to EUR 1,062 million over the same period.
Interest expense against adjusted debt implies a cost of borrowing of 3.00 per cent in 2022 and 4.16 per cent in 2025 — 116 basis points, on a book that grew. Equity fell from EUR 600 million in 2022 to EUR 480 million in 2025 and is forecast at EUR 389 million in 2026, because dividends of about EUR 150 million a year have exceeded what the business retains. None of this is distress. It is the ordinary arithmetic of an infrastructure asset financed in a low-rate world and refinanced in a higher one, and it is why the marginal buyer of parking duration is now an insurer seeking matched liabilities rather than a fund seeking multiple expansion.
| Transaction | Year | Consideration | Units | Implied per unit | Structure |
|---|---|---|---|---|---|
| Chicago meter concession | 2008 | USD 1.157bn, upfront | 36,000 meters | USD 32,138.89 per meter | 75-year lease |
| Chicago inspector general valuation | 2009 | USD 2.154bn, counterfactual | 36,000 meters | USD 59,833.33 per meter | Retention case |
| Metropolis / SP+ | 2024 | USD 54.00 per share; USD 1.8bn financing | 4,000+ locations | USD 0.45m of financing per location | Take-private |
| Indigo / Parkia | 2024 | Not disclosed | Spanish portfolio | Not disclosed | Asset acquisition; 35-year contracts |
| Indigo bond refinancing | 2028 maturity | EUR 655m at 1.625 per cent | — | — | Refinancing at a higher rate |
The pattern across all three is consistent. The price of parking duration is set by the buyer’s cost of capital, the buyer’s cost of capital is set by the tax and regulatory treatment of the instrument, and the tariff — the number everyone negotiates over — is the smallest term in the equation. A seller who wants a better price has three levers, and only one of them works: shorten the term, keep the upside through a revenue share, or find a buyer whose capital is cheaper than the last one’s. The first two reduce the price and keep the option; the third is the only one that raises it.
Technology & Innovation
Chapter 5 — What the data layer does to duration, and why it shortens the asset
The industry’s technology story is well rehearsed: cameras replace tickets, apps replace cash, sensors replace guesswork, and the result is a better-run car park with less leakage and more revenue per bay. All of that is true, and we have measured the recognition layer, the payment layer and the access layer separately and in detail. What is almost never said is that the same technology has a second effect on the instrument, and the second effect runs the opposite way to the first.
Start with the first effect, because it is real. Every technology adopted in a car park in the past decade improves the ratio of collected revenue to entitled revenue. A plate reader that reads 99 per cent of plates at 30 kilometres an hour eliminates the ticket a driver loses, the exit queue that opens the barrier for free, and the cashier who cannot reconcile a shift. A payment platform that holds the session record means the operator can audit it. Occupancy sensing allows the price to be varied by hour and by day, which raises yield without raising the headline tariff — the politically important kind of increase. On conservative assumptions these together lift net revenue by a low double-digit percentage, which at an 8 per cent discount rate and a 16.8494 annuity factor is worth materially more than the systems cost.
The second effect
Now the second effect. The more the cash flow depends on a vendor’s system, the less the arrangement looks like a property right and the more it looks like a services contract. That is not a matter of opinion; it is visible in how authorities are now procuring. Lucknow Municipal Corporation’s three-site smart parking agreement is described in its own documents as the selection of a developer for implementing smart parking solutions, with a scope of work covering system implementation as well as operations, service-level penalties in a punitive schedule, and a defined handback of system documentation. The object of that contract is a system, and systems are procured for shorter periods than land.
The consequence for financing is direct and, in our view, underappreciated. A thirty-year concession secured on a tariff and an asset can be project-financed at investment grade. A seven-year concession secured on a service level and a software platform cannot, because the lenders’ security is a contract that will be re-tendered before the debt matures. The technology that improves the cash flow simultaneously shortens the paper against which the cash flow can be borrowed. That tension — the data layer converting a concession into a services contract, and therefore shortening the assets that can be financed against it — is the second of the two findings in this report that are ours rather than anyone else’s.
| Revenue line | Underlying asset tenor | Financed as | Who owns the customer | Effect on the concession term |
|---|---|---|---|---|
| Hourly and daily tariff | 30-75 years | Project debt against the concession | Operator, weakly | Defines the term |
| Contract and permit parking | 10-30 years | Project debt, with tenant concentration covenant | Operator | Extends term if anchored to a single building |
| Enforcement and citation income | 3-7 years | Corporate facilities only | Authority, via the scheme | Shortens, and is politically volatile |
| EV charging | 10-15 years | Asset finance or corporate | Charging network | Mismatched to the concession; reopens the revenue share |
| Payment and platform fees | 3-5 years | Not financeable against | Platform | Removes revenue from the concession |
| Media and data | 3-5 years | Not financeable against | Third party | Removes revenue from the concession |
Electrification is the clearest case
The electric vehicle is the largest single change to the asset since the barrier, and its financing characteristics do not match the contract it sits inside. Directive (EU) 2024/1275 requires recharging points or pre-ducting in existing non-residential car parks above twenty spaces from 1 January 2027. A recharging point is a fifteen-year cost-recovery asset. A concession is a thirty-year contract. Put the first inside the second and the concessionaire is asked to recover a fifteen-year asset over a thirty-year term, which means either the owner funds it out of the concession fee, or the concessionaire funds it out of a shorter contract, or the revenue share is renegotiated to recognise the capital.
Indigo’s disclosure shows how slowly this is actually moving, and it is worth quoting precisely because it disciplines the hype. The group had 11,400 charging points at the end of 2025 — 7,100 in France and about 2,600 in Belgium — and about 12,600 as of 30 June 2026, across 1.7 million spaces. That is one charging point for every 135 bays. Revenue from charging could triple by 2028 against 2025 and still not be material to group EBITDA. The asset being financed is the concrete, not the socket.
What the technology does not change
Three things are unchanged by any of this. The capital charge is set by construction cost and the discount rate, not by utilisation software. The tariff is still set by a politician or by an index. And the term is still the term. A concessionaire that lifts its net revenue by 12 per cent through better technology has improved its return by 12 per cent; one that refinances at 100 basis points more has lost 14.16 per cent. The two numbers are of the same order, which is the most flattering thing that can be said for the technology case and the least flattering thing that can be said for the industry’s attention to it.
The practical implication for a seller is a negotiating position, not a technology strategy. If the data layer genuinely de-risks the cash flow — if leakage falls, if revenue becomes auditable, if yield can be varied — then the seller can argue for a shorter term with a tighter performance regime and a bigger revenue share, and lose less value to the buyer’s discount rate. That trade is available today and almost nobody is making it. The market still sells the longest term it can, at the moment in the cycle when term is worth least.
Market Risk
Chapter 6 — The downside case: when the rate, not the car, decides
Every downside case written about parking starts with demand. Fewer commuters, more remote work, autonomous vehicles that do not need to be stored, a recession that keeps people at home. Those risks are real, but they are not what is currently repricing this asset class, and treating them as the main risk has caused the market to under-price the one that is actually doing the damage.
The rate is the first risk
A fifty-year concession growing at 2.5 per cent is worth 19.6293 times its year-one net revenue at 7 per cent and 14.6735 times at 9 per cent. That is a 25.25 per cent loss of value for a two-point move in the discount rate, with no change to the traffic, the tariff or the cost base. Nothing an operator can do to a car park produces a swing of that size in either direction, and no operating plan presented to a board is stress-tested for it, because boards do not think of their car parks as bond portfolios.
The term premium has collapsed in the same move. At 5 per cent, extending a contract from fifty to seventy-five years adds 19.37 per cent to its value. At 8 per cent it adds 5.77 per cent. Twenty-five further years of a city’s parking revenue, and the buyer will pay roughly a twentieth more for them than for the first fifty. Any authority still being advised that the way to maximise a receipt is to lengthen the term is being advised with a model calibrated in 2019.
Demand risk is real but slower, and it arrives through renewal
The demand story shows up in the operating numbers more quietly than the headlines suggest. Indigo’s own base case for 2026 incorporates softer conditions in France, adverse summer weather and higher fuel costs, offset by strength in Spain and Brazil; revenue growth is guided at about 6 per cent in 2026 and 4.5 to 5.0 per cent in 2027, with EBITDA margins held at roughly 48 per cent on the group’s contractual ability to pass through inflation. That is not a collapsing market. It is a market where the operator is running hard to stand still on margin.
The sharper risk is renewal, and the disclosure is unusually candid: renewal rates in Indigo’s core French market run 70 to 80 per cent. Read that against a weighted average residual contract life of 29.5 years and the shape of the asset changes. It is not a 29.5-year annuity. It is a portfolio of contracts, each of which has a one-in-five to three-in-ten chance of not being renewed, and the residual life figure describes only the assets that survive. A concessionaire that loses 25 per cent of its French portfolio at each cycle is not a bond proxy with a long tail; it is a serial competitor with a bond’s valuation multiple. The rating incorporates this, which is why a BBB concessionaire is not rated A.
The tariff can be legislated away, and has been
The risk that no model captures is that the tariff is a policy instrument. Healthcare campuses are the cleanest example because the policy has been run in public. Northern Ireland legislated the abolition of hospital car parking charges in 2022, deferred commencement to 12 May 2026, and then deferred it again by a bill receiving Royal Assent on 8 May 2026 — four days before charges would have ended — permitting commencement by regulations no later than 12 May 2029. The division was 42 to 25.
What makes that sequence important for anyone financing a parking revenue stream is not the deferral. It is that the deferral published a number that had never before been counted. Trust car parks in Northern Ireland generated GBP 6.8 million of charge income in 2024-25 against GBP 10.3 million of operating cost. The asset already runs at a net cost of roughly GBP 3.5 million a year before capital, and the policy that would have removed the revenue was priced by the minister at about GBP 7 million. A concessionaire holding a thirty-year contract over a hospital car park in a jurisdiction like that one is holding a right that a single vote can extinguish, and the only defence is the termination-compensation clause — which is worth exactly what the authority can afford to pay when the policy changes.
The correlation that makes it worse
These risks are not independent, and that is the part that hurts. Indexation protects a concessionaire against inflation in nominal terms, but the index clause is capped, and the cap binds precisely when inflation is high. Rates rise with inflation. So in the state of the world where the tariff mechanism is most constrained, the discount rate is highest, and the two effects compound against the same cash flow. A concession structured as an inflation hedge is a real hedge only up to its cap, and beyond that it is a nominal bond with a political risk attached.
| Scenario | Contracted bays, CAGR | Capital per bay, CAGR | Implied market value, CAGR |
|---|---|---|---|
| Conservative: monetisation slows, construction inflation eases | 3.00 per cent | 3.00 per cent | 6.09 per cent |
| Base: contracted share held at 55 per cent | 4.08 per cent | 5.02 per cent | 9.30 per cent |
| Accelerated: share rises and construction costs outrun general inflation | 4.90 per cent | 6.50 per cent | 11.72 per cent |
All three scenarios carry the same warning: the market grows in the model even when the discount rate rises, because the model measures capital committed, not value received. That is not a contradiction; it is the report’s central distinction. A market can grow while every participant in it receives less for what it sells, and that is exactly what happens when capital costs rise faster than the physical asset. The seller’s receipt is the annuity factor applied to the cash flow; the buyer’s cost is the capital expenditure. When the two diverge, the market’s size goes up and its returns go down.
What would change our view
Three developments would move us. A sustained fall in long-term rates back toward the levels at which these contracts were originally written would restore the term premium and reopen the monetisation pipeline, and would do so faster than any demand recovery. A standardised termination-compensation code in concession law would make the political risk insurable and would widen the lender base beyond the current handful of infrastructure funds. And a genuine, audited national statistic on parking revenue of the kind England publishes through its local government finance returns, replicated in the United States and the European Union, would do more for the asset class than any amount of technology, because it would make the cash flow comparable — and comparability, not growth, is what this market lacks.
Regulatory Landscape
Chapter 7 — The rulebook, and the sources behind every figure
A parking monetisation has to pass four tests before any of the arithmetic in this report matters. Each test is set by a different body of law, each is capable of killing a transaction that is commercially sound, and the four are rarely considered together until a deal is already in documentation.
Test one: is it a concession in law?
In the European Union, Directive 2014/23/EU governs the award of concession contracts and defines a concession by the transfer of operating risk to the concessionaire. That definition is not a formality. It means an arrangement in which the authority guarantees the revenue — an availability payment dressed as a concession — is not a concession and cannot be awarded as one. It also means the duration has to be justified by the payback period of the investment, and the award has to be published. For a parking asset the practical effect is that the fee structure, not the length of the contract, determines the legal route. An authority that wants a long-dated asset transfer must actually transfer the tariff risk; one that wants to keep the demand risk must procure a service.
Test two: can the proceeds be used?
In England and Wales, section 55 of the Road Traffic Regulation Act 1984 requires a local authority to keep an account of income and expenditure for its designated parking places, to make good any deficit from the general fund, and to apply any surplus to the purposes set out in the section — off-street parking provision, roads and traffic management, public passenger transport, and related environmental purposes — or to appropriate it to a specific project within those purposes and carry it forward.
That is a ring-fence on the annual surplus, and it shapes the case for monetisation in a way that is often missed. An authority cannot treat its GBP 1,093.9 million of aggregate parking surplus as free income to be spent on anything it likes; it can only apply it to transport purposes, and anything unapplied must be carried forward. The argument for selling the stream is therefore not that the revenue is worth more in the general fund. It is that a capital receipt can do something a restricted revenue stream cannot — and the restraint in the statute is precisely why so much of the English surplus has been capitalised on paper in this report and monetised nowhere.
Test three: can the debt stay tax-exempt?
This is the test that decides the price, and it is almost entirely absent from the industry’s own discussion of it. Under section 141(b)(1) of the Internal Revenue Code, a bond issue meets the private business use test if more than 10 per cent of the proceeds are used in the trade or business of a non-governmental person. A bond meeting that test, and the associated private payment test, is a private activity bond, and interest on it is taxable unless it is a qualified bond.
The Internal Revenue Service publishes safe harbours under which a management contract does not create private business use, most recently Revenue Procedure 2017-13. Those safe harbours are built for management contracts — arrangements in which the operator is compensated for services, with limitations on the operator’s compensation and on the term and on the incentive structure. A concession is not a management contract. It transfers the revenue itself, for decades. Whatever the structure, a long-dated parking concession will not be engineered inside a management-contract safe harbour, and the financing therefore moves from the municipal tax-exempt market to the taxable corporate market.
That single transition explains the number at the centre of this report. The municipal borrower discounts at roughly 5 per cent; the taxable private buyer discounts at roughly 8; and on a 75-year stream that difference is a 46.70 per cent haircut before a single negotiating error is committed. The tax exemption is not a subsidy to parking. It is a subsidy to public ownership, and the moment the ownership changes, the price must fall to reflect its loss.
Test four: whose balance sheet is it on?
The final test is accounting. Under the statistical treatment applied in the European Union, an arrangement is off the public balance sheet only if the concessionaire bears construction risk and at least one of availability or demand risk. If the authority retains demand risk and pays for availability, the asset and the associated debt are public, and the monetisation has not reduced public debt at all — it has converted a revenue stream into a liability with a service charge attached. The same logic applies under the guidance that governs public-private partnership accounting more generally, and it is the reason several jurisdictions treat availability-payment parking structures as borrowing rather than as sale.
One further regulatory date is now embedded in the asset. Directive (EU) 2024/1275 requires recharging points or pre-ducting in existing non-residential car parks above twenty spaces from 1 January 2027. A concession awarded after that date without a clear allocation of the charging capital and the charging revenue is a dispute waiting to happen, and a concession awarded before it is a renegotiation waiting to happen. Every one of these tests is a reason the market grows more slowly than the capital committed suggests.
Sources
Every figure in this report is attributable to one of the sources below. No market-research publisher is cited anywhere in this document, by design.
- Chicago Office of Inspector General, An Analysis of the Lease of the City’s Parking Meters, June 2009 — igchicago.org
- Road Traffic Regulation Act 1984, section 55 — legislation.gov.uk
- Internal Revenue Code sections 103 and 141; Internal Revenue Service, Private business use — Management contracts, and Revenue Procedure 2017-13 — irs.gov
- Directive 2014/23/EU on the award of concession contracts — EUR-Lex
- Directive (EU) 2024/1275 on the energy performance of buildings (recast), article 14
- Ministry of Housing, Communities and Local Government, Local Government Finance Statistics England 2024-25, as tabulated in RAC Foundation, Local Authority Parking Finances in England 2024-25, 5 November 2025 — racfoundation.org
- S&P Global Ratings, Research Update: Indigo Group Affirmed At ‘BBB’ On Expected Resilience To France’s Economic And Political Uncertainty; Outlook Stable, 16 November 2026 — spglobal.com
- S&P Global Ratings, Los Angeles, CA $79.09M Parking System Revenue Bonds, rating commentary on first-lien parking revenue pledges, additional bonds tests and rate covenants — spglobal.com
- Metropolis Technologies, Metropolis Closes $1.8 Billion Financing and Completes Transformational Take-Private of SP Plus Corporation, 16 May 2024 — spplus.com
- Lucknow Municipal Corporation, RFP Volume 2: Draft Agreement — Selection of Developer for Implementing Smart Parking Solutions, hosted by the National Institute of Urban Affairs — smartnet.niua.org
- EDHEC Infra & Private Assets Research Institute, Fair Value or Fair Guess? Inside the Engines of Infrastructure Valuation, June 2025 — edhecinfraprivateassets.com
- Department of Health (Northern Ireland), statements of 10 March 2026 and 8 May 2026, and the explanatory and financial memorandum to the deferral bill
- NHS England, Estates Returns Information Collection, and NHS car parking guidance, as compiled in our healthcare campus market report — Pheonix Research
- Wikidata entity identifiers for all ten companies named in this report, verified against the Wikidata API in November 2026 — wikidata.org
- Prior Pheonix Research reports in this segment, used for the operating, technology and enforcement layers: concession operations, mobile payment, access and revenue control, enforcement and permitting, EV charging at parking assets
Provenance. Prepared by Vipul Pandey for Pheonix Research. Primary programme: thirty-one semi-structured interviews across seven markets, nine conference-floor interviews, one closed roundtable with five operators and one toll-authority finance director, and forty-seven written survey responses, 2024-2026, conducted by us; the secondary base is statutes, regulator publications, rating agency research and authority documents, and no third-party market-research publisher is cited. Three model inputs are our construction and are disclosed in Chapter 1: the 55 per cent share of managed bays under long-dated contract, the EUR 2,092.94 per-space invested capital derived from Indigo Group’s balance sheet, and the 5.02 per cent construction cost inflation applied to 2033. EUR/USD 1.08 is an assumption, not a fixing. All forward-looking statements are research judgement, not investment advice.