
Global Hospital & Healthcare Campus Parking Operations Market Report, Size, Share and Forecast 2026–2033: The Tariff Is a Political Variable and the Structure Never Repays Itself
Coverage: global, five regions. Base year: 2025. Forecast period: 2026–2033. Denomination: US dollars, nominal. Measure: revenue earned from operating parking on healthcare campuses, together with the service fees sold alongside it.
What this market counts, and what it deliberately does not
This report measures two things a healthcare campus does with a car park: what it collects, and what it pays to have the collection done. It covers acute hospitals, specialist and children’s hospitals, ambulatory and outpatient campuses, and the medical office buildings standing on health-system land. Three arms carry the pool — patient and visitor transient parking, staff and clinician permit parking, and valet, patient-assist and concierge services.
It excludes the equipment. Parking access and revenue control, occupancy sensing and space guidance, mobile payment platforms, vehicle identity, EV charging at parking assets and automated and robotic storage are each measured in their own report in this segment. They appear in these pages only as a cost inside somebody’s operating budget. Counting them again would inflate a market that is already easy to inflate.
One further exclusion matters more than it looks. A campus that leases its car park to an operator, and a campus that hires an operator to run the same car park for a fee, collect the same money from the same drivers. So the report measures the pool — what the asset bills — and treats outsourcing as a question of who books it, not as an addition to it. That distinction is developed in the value chain chapter, and it is the reason the largest operators in this market barely register in its totals.
The headline
The global healthcare campus parking operations market is USD 16,088.9 million in 2025 and reaches USD 27,297.7 million in 2033, a compound annual growth rate of 6.83 per cent. It runs on 44.31 million campus parking spaces, of which 17.91 million are chargeable, rising to 19.82 million by 2033. Revenue per chargeable space moves from USD 898.27 to USD 1,376.95, an increase of 53.29 per cent, against chargeable space growth of 10.69 per cent. Revenue per hospital bed — the only denominator that lets a health system compare sites — is USD 734.65 in 2025.
| Measure | 2025 | 2033 | Change |
|---|---|---|---|
| Market value, USD million | 16,088.9 | 27,297.7 | +69.67% (6.83% CAGR) |
| Total campus parking spaces | 44,310,000 | 46,890,000 | +5.82% (0.71% CAGR) |
| Chargeable spaces | 17,911,000 | 19,824,800 | +10.69% (1.28% CAGR) |
| Chargeable share of all spaces | 40.42% | 42.28% | +1.86 percentage points |
| Revenue per chargeable space, USD | 898.27 | 1,376.95 | +53.29% |
| Revenue per total space, USD | 363.10 | 582.16 | +60.33% |
| Revenue per hospital bed, USD | 734.65 | — | — |
The thesis: the price is set by a health minister, not a revenue manager
Every other parking vertical in this segment prices against a willingness to pay. A hospital prices against a licence to charge. In England the licence is a service condition in the NHS Standard Contract, and it already names four cohorts who park free: Blue Badge holders attending as patient or visitor, outpatients attending at least three times a month over at least three months, parents of a child staying overnight between 19:30 and 08:00, and staff whose shift starts after 19:30 and ends before 08:00. Scotland and Wales have removed the charge altogether. Northern Ireland is due to abolish it in May 2026.
What remains in England is nonetheless a real business: GBP 271 million in 2024/25, of which GBP 192 million is patient and visitor parking and GBP 79 million is staff parking — a 70.85 to 29.15 split — across 459,437 spaces, against GBP 84.4 million of cost to provide the service. That is GBP 589.85 of revenue per space against GBP 183.70 of operating cost, cover of 3.21 times. The pool is small and politically exposed, and it is unusually profitable to run.
Those two facts — a capped price and a healthy cost cover — explain the whole structure of the industry that follows. The market grows on price and on the service sold around it, not on beds. In the United States, admissions fell 5.01 per cent between 2019 and 2023 while staffed beds fell 0.70 per cent. In China, the largest bed base in the world, total health-institution beds fell from 10,298,357 to 10,039,606 in a single year, a contraction of 2.51 per cent, with hospital beds down 1.92 per cent. Across the OECD the density is 4.2 beds per 1,000 people, and it is not rising. A market that needs more bays per bed has to find them in the tariff and in the service, because it will not find them in the ward.
Three arms, and one of them is not really parking
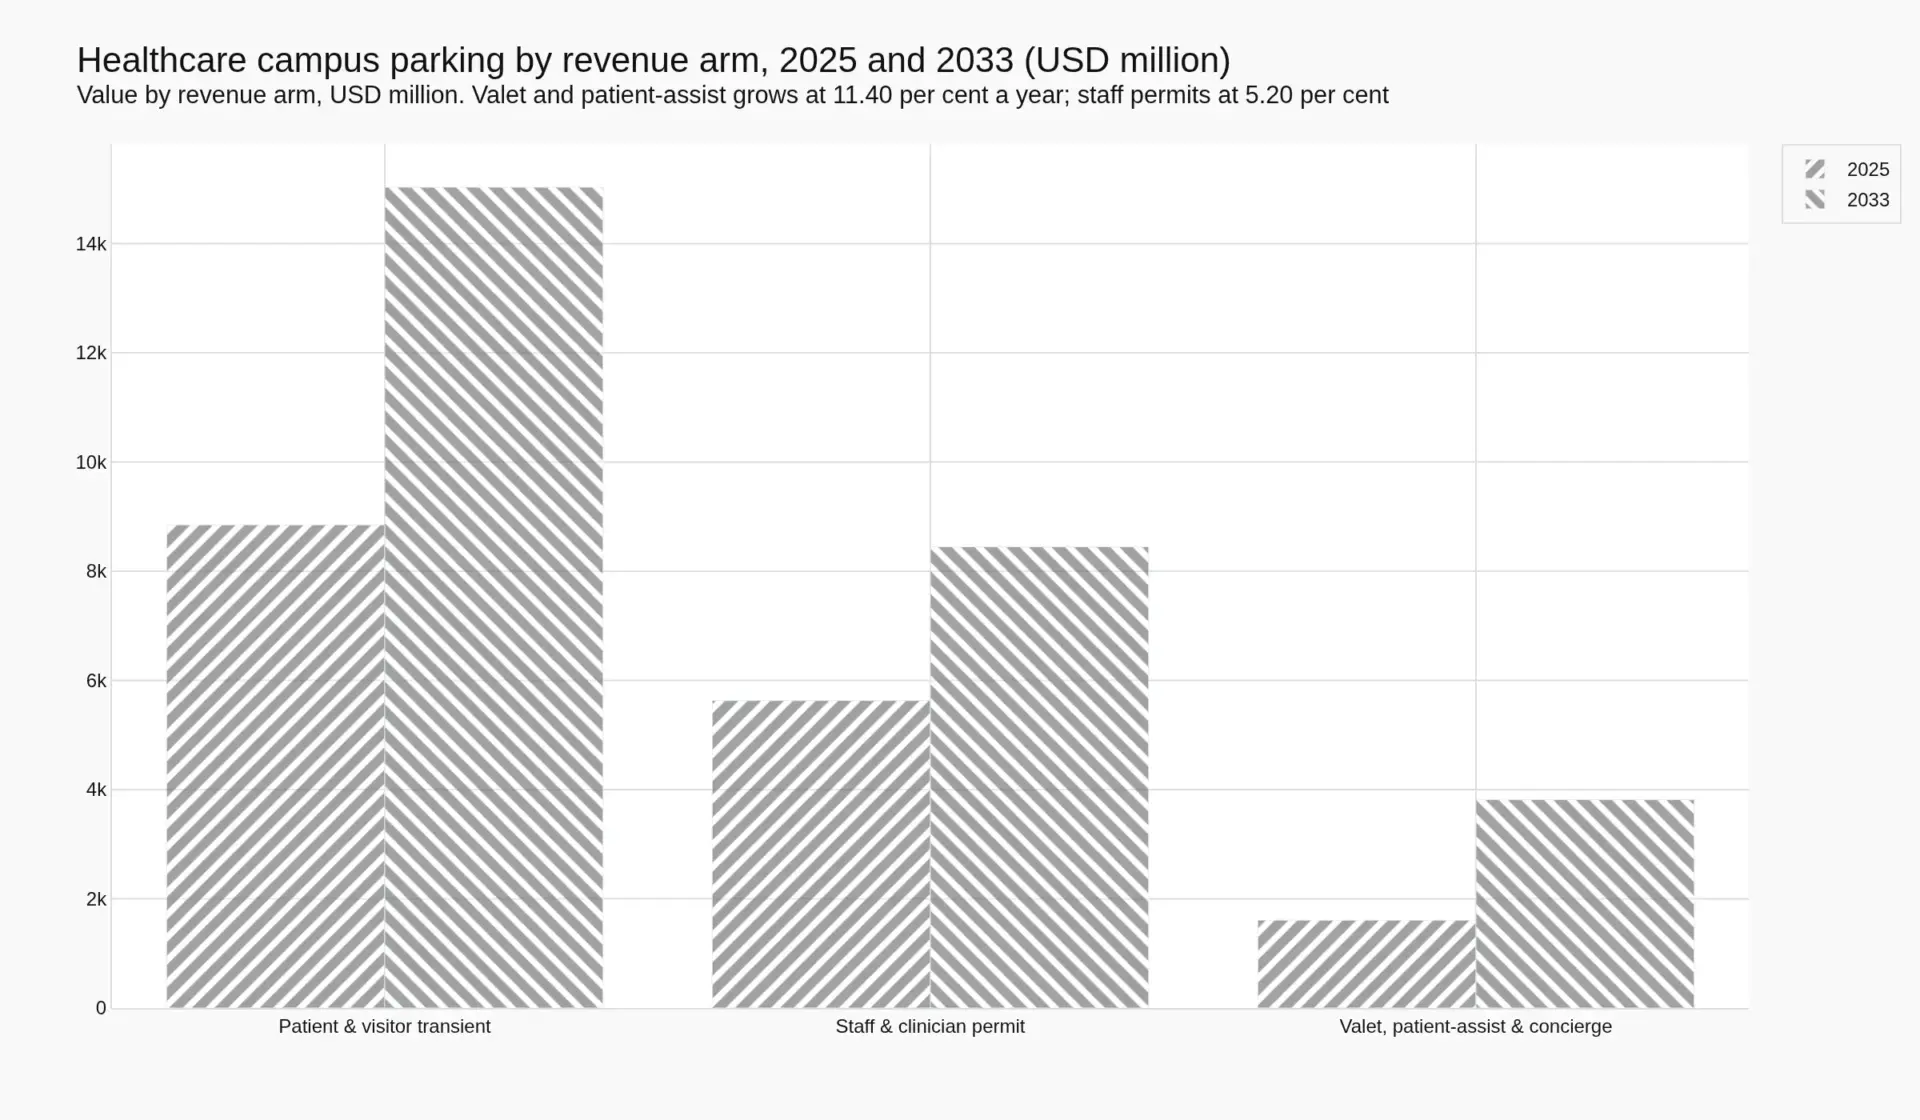
Patient and visitor transient parking is USD 8,848.9 million in 2025 and grows at 6.85 per cent — fast, but only because the underlying tariff is being reset from a low base. Staff and clinician permit parking is USD 5,631.1 million at 5.20 per cent, the slowest arm, because it is the arm that a fringe-benefit limit caps. Valet, patient-assist and concierge services are the smallest at USD 1,608.9 million and the fastest at 11.40 per cent, and they contribute 19.69 per cent of the USD 11,208.8 million the market adds. By 2033 the services arm is 13.98 per cent of the pool against 10.00 per cent today.
Regional structure: the space is in Asia, the money is not
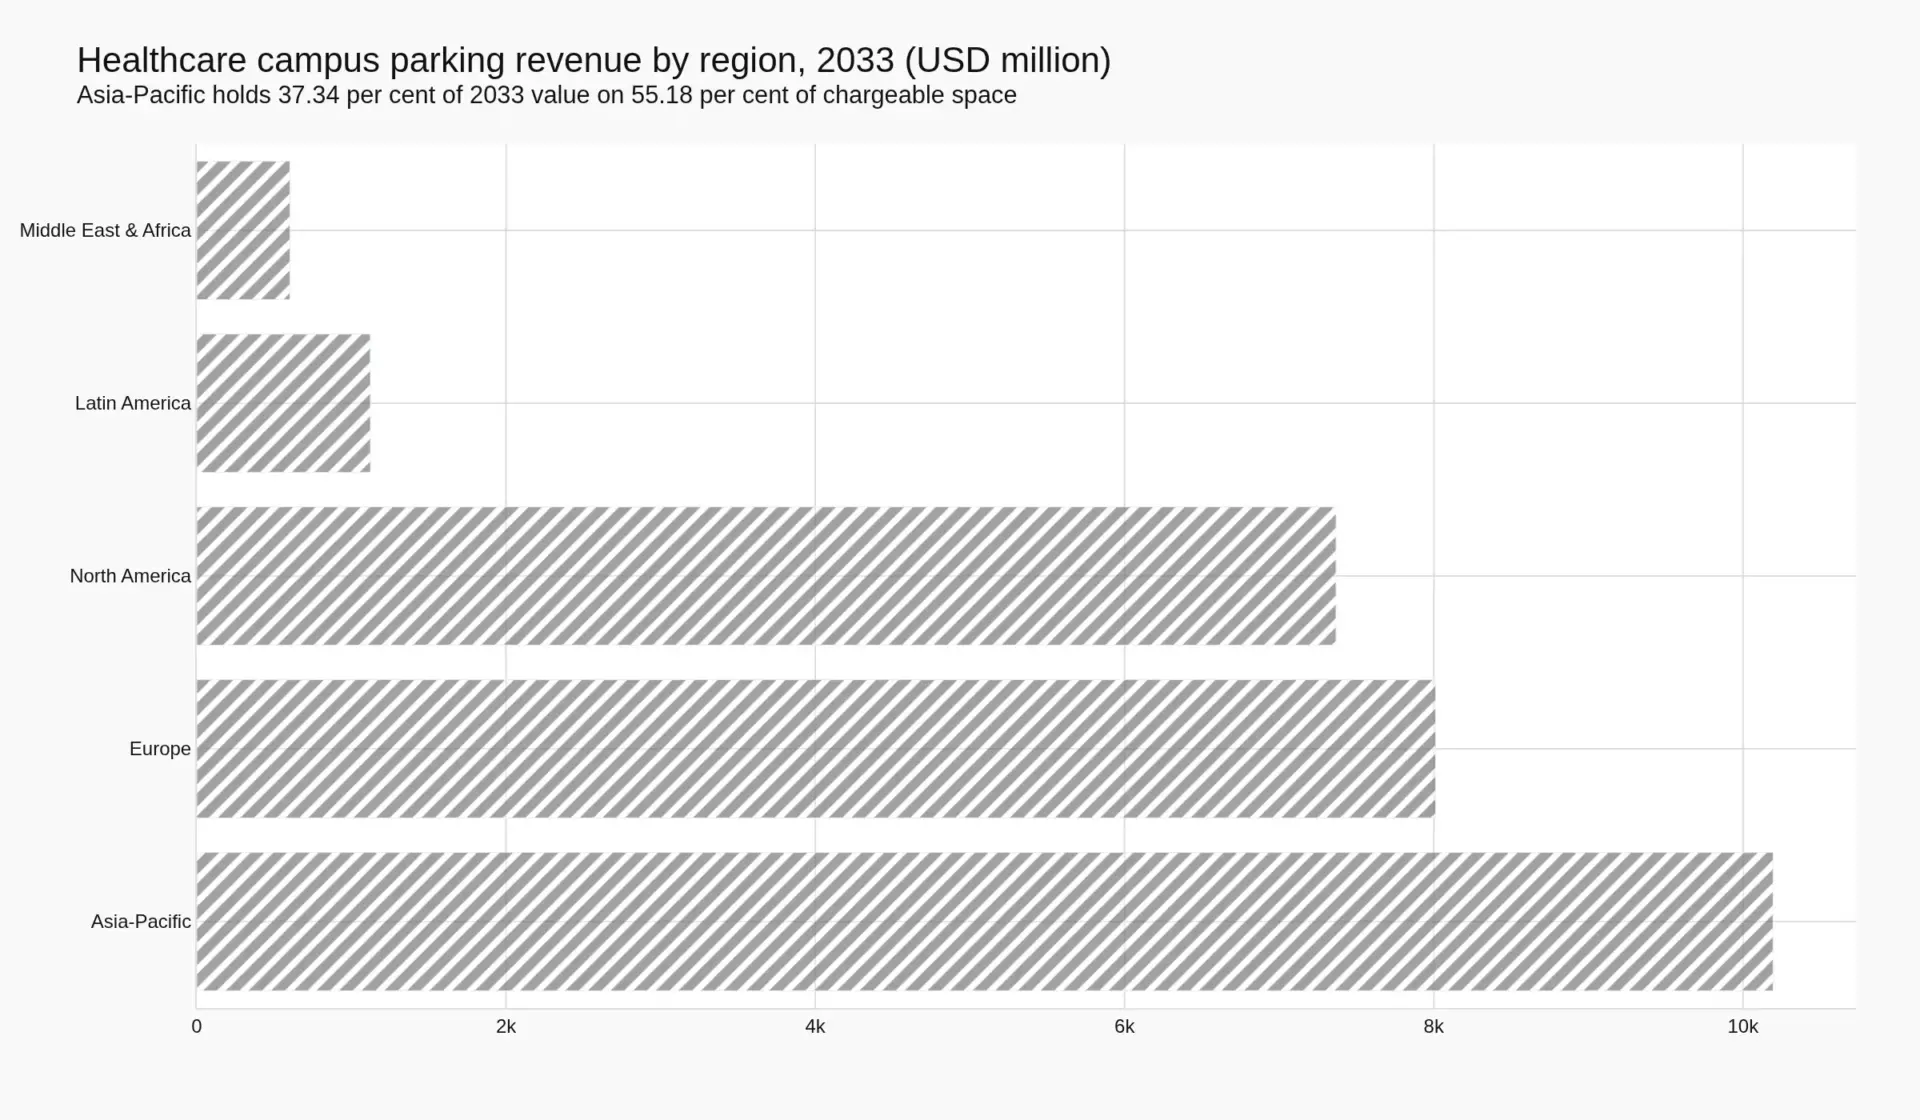
Asia-Pacific holds 56.43 per cent of chargeable space and 35.18 per cent of revenue, because a bay in the region earns USD 560 a year against North America’s USD 2,050. By 2033 that gap narrows but does not close: Asia-Pacific reaches USD 931.78 per chargeable space, still under a third of North America’s USD 2,842.36. North America has the fewest spaces of the three large regions and the highest revenue per bed in the world, and it grows slowest at 5.42 per cent precisely because there is least room left in the tariff.
| Region | Chargeable spaces, 2025 | Revenue 2025, USD m | Revenue per chargeable space, USD | Revenue 2033, USD m | CAGR 2025–2033 | Share of 2033 value |
|---|---|---|---|---|---|---|
| Asia-Pacific | 10,108,000 | 5,660.5 | 560 | 10,193.7 | 7.63% | 37.34% |
| Europe | 4,212,000 | 4,970.2 | 1,180 | 8,011.9 | 6.15% | 29.35% |
| North America | 2,356,000 | 4,829.8 | 2,050 | 7,367.4 | 5.42% | 26.99% |
| Latin America | 663,000 | 411.1 | 620 | 1,122.6 | 13.38% | 4.11% |
| Middle East & Africa | 572,000 | 217.4 | 380 | 602.1 | 13.58% | 2.21% |
| Total | 17,911,000 | 16,088.9 | 898.27 | 27,297.7 | 6.83% | 100.00% |
The finding that frames every chapter
At the 2025 median construction cost of a parking structure — USD 31,400 per space — and a capital recovery factor of 6.51 per cent, a structured healthcare bay must earn USD 2,042.63 a year simply to repay itself over thirty years at 5 per cent, before a single attendant is paid. The global pool earns USD 363.10 per total space. That is 17.78 per cent of the charge. In North America, the best case in the world, it is 62.22 per cent. No healthcare parking structure on earth repays its own capital out of parking revenue.
That is not a malfunction. It is the design. A hospital car park is not built to earn a return on a bay; it is built so that a patient who can only arrive by car arrives at this hospital rather than the one across the city. The return is booked in clinical revenue. Everything that follows — why the tariff is capped, why operators are paid fees rather than rents, why the market grows by 6.83 per cent and still leaves a funding gap — descends from that one arithmetic fact.
Method
Sizing is bottom-up from national bed counts and published parking standards, calibrated against the two official ratios that exist for healthcare parking: Hong Kong’s planning standard of one space per three to twelve beds and the Hospital Authority’s actual provision of one space per 4.17 beds. Revenue is modelled per chargeable space by region and triangulated against England’s audited national returns. Primary work comprised 31 semi-structured interviews across seven markets, nine conference-floor interviews, one closed roundtable with five operators and one health-system facilities director, and 47 written survey responses, conducted 2024–2026. Two findings in this report are ours and are labelled as such; everything else is attributable to the source named beside it.
Table of Contents
- Ten operators, one unlisted market
- Who sets the price: the clinic, not the gate
- The garage repays itself and nothing else
- The system’s real job is adjudication, not collection
- What 3.21 times cost cover is worth when the price is capped
- The price is set by a minister, and one of them has now refused
- Sources and provenance
Tables
- Market at a glance, 2025 and 2033
- Regional structure of the market, 2025 and 2033
- The chain, and who holds the pricing decision
- Seven demand cohorts on a healthcare campus
- Disclosed players in healthcare campus parking operations
- Four regulatory regimes compared
- Capital cover of the annual charge, by region
- Risk register
- Scenario arithmetic, 2033
Competitive Landscape
Ten operators, one unlisted market
The first thing to know about competition in healthcare campus parking is that almost none of it is visible in a filing. Of the ten operators with the scale and the references to run a hospital estate, exactly one files public accounts. SP Plus Corporation was the second until 2024, and its disappearance from the public market is the single most important structural event in this industry in a decade, not because it changed who runs hospital car parks but because it removed the only audited benchmark a procurement team could hold against a bid.
The terms of that removal are worth recording precisely. Metropolis Technologies agreed to acquire SP+ for USD 54.00 per share in cash, a premium of approximately 52 per cent to the closing price on 4 October 2023 and approximately 28 per cent to the 52-week high, for an aggregate enterprise value of approximately USD 1.5 billion. The asset it bought managed approximately two million parking spaces across more than 3,300 commercial locations and more than 160 airports, employed over 20,000 people, operated in more than 360 cities, processed over USD 4 billion of payments annually, and had reported a location retention rate of 94 per cent alongside an eleventh consecutive quarter of net location growth in its final full year as a listed company.
Read those numbers as a procurement officer and the problem is immediate. The counterparty in front of you is likely to be a special-purpose vehicle owned by an infrastructure fund, benchmarked against a portfolio you cannot see, bidding a fee against a cost base you cannot verify, on an asset whose price is set by a third party. Before 2024 you could at least check whether the consolidated group was solvent and whether its retention rate was stable. Now, in most of the world, you cannot.
The ten that can run a hospital estate
| Operator | Base and principal footprint | Operating model | Relevance to a healthcare estate (our assessment) | Wikidata entity |
|---|---|---|---|---|
| ABM Industries | United States; North America and the United Kingdom | Bundled facility services, of which parking is one line | The closest thing to a healthcare-native channel, because the buyer is already the facilities director | Q4650338 |
| Metropolis Technologies | United States; over 360 cities and 160 airports through SP+ | Technology-led owner-operator, checkout-free payment | Institutional and campus assets acquired with the SP+ network | Q131191821 |
| LAZ Parking | United States; national | Management contracts and leases | Campus and institutional contracts | Q123029289 |
| Impark | Canada; North America | Management contracts and leases | Hospital and institutional sites | Q6006077 |
| Indigo Group | France; Europe and the Americas | Concession and management | Municipal and institutional, including hospital sites in France | Q112822073 |
| Q-Park | Netherlands; Western Europe | Long-lease ownership and operation | City-centre and hospital-adjacent; limited clinical estate | Q1127798 |
| APCOA Parking | Germany; Germany and wider Europe | Concession, management and technology | Municipal, rail and retail, with hospital contracts in Germany and the United Kingdom | Q296108 |
| National Car Parks | United Kingdom; UK and Ireland | Ownership, lease and management | Urban estate; hospital sites through local contracts | Q6971273 |
| Wilson Parking | Hong Kong; Asia-Pacific | Management and lease | Hospital and institutional sites in Hong Kong and Australia | Q28448427 |
| Empark | Spain; Iberia and Latin America | Concession | Hospital and public-sector concessions | Q126539953 |
One further operator belongs in any shortlist and not in the table, because it is privately held and discloses almost nothing: Ace Parking, which competes for exactly the institutional contracts described here. Its absence from the disclosed set is not an oversight. It is the market.
Why the airport is the wrong analogy and the right warning
Analysts reach instinctively for the airport when they think about institutional parking, and the instinct is half right. An airport forecourt and a hospital forecourt both serve a captive driver who is anxious about a time he does not control. But the airport has already resolved the question this market has not. Airport landside access monetises the same square metre through multiple channels — drop-off, parking, taxi access, advertising — because the airport controls its whole kerb. Pre-booked airport parking works because a traveller knows his return date months in advance. A patient does not know whether his appointment will run forty minutes or four hours, and he certainly does not know it at the moment he leaves home. That single uncertainty is why yield management has never transferred cleanly from airports to hospitals, and why the hospital contract is priced on cost rather than on revenue.
Contract mechanics: why the fee is the bid
Two models compete. Under a lease or concession, the operator takes the revenue and pays the health system rent; under management, the health system keeps the revenue and pays the operator a fee. In commercial and municipal parking, the lease dominates because the owner wants a certain cheque and the operator wants the upside. In healthcare the management model dominates for a reason that is structural rather than commercial: a lease transfers control of the validation, and no hospital will transfer control of the validation, because the validation is the mechanism by which it discharges a statutory duty to a patient. That is the argument developed in the value chain chapter, and it is the reason the same operator that bids a rent in a city centre bids a fee on a campus.
Once the model is management, the bid variable is the fee percentage, and the fee percentage is bounded on both sides. It cannot exceed roughly 40 per cent of the health system’s own cost of delivery, or the business case for outsourcing disappears. It cannot fall so low that the operator cannot staff the asset, or the service fails and the contract is terminated. Our reading of the observable behaviour is that most of the competitive energy in this market is expended in the narrow band between those two constraints, which is why differentiation migrates to technology and to service scope rather than to price. The argument for consolidating a bigger, more technical operator is not that its fee is lower. It is that its cost base is.
Nobody is a healthcare specialist, and that is the finding
Not one of the ten operators above derives a majority of revenue from healthcare parking, and we are not aware of any operator of scale anywhere that does. This is unusual. In most markets of this size a specialist emerges within two decades. Here it has not, and the reason is the cost arbitrage described earlier: the skill that wins a hospital contract is the same skill that wins a municipal contract, applied to a smaller and more politically fragile pool. Healthcare is therefore an allocation decision inside a diversified operator’s portfolio, not a vertical with its own economics, its own specialists and its own benchmarks.
That has a direct consequence for anyone buying. The operator you appoint will manage your asset with a team assembled from other verticals, measured on divisional returns, and free to redeploy people to a contract with less regulatory exposure if your site becomes difficult. Asking what share of a bidder’s revenue comes from healthcare will not distinguish the field, because the honest answer from all of them is a minority. The distinguishing question is what share of the bidder’s contracts include a statutory free-provision obligation, because that is the capability that cannot be assembled quickly.
The market is fragmented, intensely competitive, and consolidating at the top. Five of the ten are backed by infrastructure or private-equity capital. We expect two or three more of the ten to change ownership by 2033, and we do not expect the resulting concentration to move the fee band, because the fee band is set by the health system’s cost base and not by the operator’s scale.
Value Chain
Who sets the price: the clinic, not the gate
Eight parties stand between a driver and the money in his pocket on a hospital campus: the landowner, the structure’s financier, the systems vendor, the operating company, the clinic that authorises the stay, the payment processor, the enforcement function, and the driver. In a shopping centre or an airport the operator sits at the point where money changes hands and therefore controls the tariff. On a hospital campus it does not. The posted tariff is written in a policy document. The effective tariff is written by a receptionist with a stamp.
Consider what a validation actually is. It is an instruction that a specific vehicle should not be charged for some or all of a specific stay, issued by somebody who is not the operator and who has no financial interest in the outcome. In every healthcare system we examined it is issued at the point of clinical contact — a chemotherapy suite, a ward desk, a radiology reception — by staff whose performance is measured on patient flow and on complaints, not on parking yield. Validation is not a discount scheme. It is a delegated right to set the price, delegated to people who are not accountable for the price. That single transfer of authority is the defining structural fact of this market, and every commercial relationship in it is built around managing the consequences.
A campus that leases its car park has sold the revenue and kept the right to forgive it. A campus that hires an operator has kept both and bought the labour. In neither case does the party carrying the operating risk control the number that determines whether that risk pays. This is why the pricing clause in a healthcare parking contract is never the important clause. The important clause is the validation policy annex, and in our experience it is rarely read at bid stage.
The chain, stage by stage
| Stage | Who performs it | What it costs | Who decides the price | Who captures the margin |
|---|---|---|---|---|
| Land and entitlement | Health system or public authority | Land value; a statutory minimum bay count | Planning authority, via minimum parking standards | Landowner |
| Structure | Health system balance sheet, bond issue, or a real-estate partner | USD 31,400 per space, median, 2025 | Capital markets | Financier, over 30 years |
| Access, payment and sensing systems | Equipment and software vendors | Capital plus licence, on a five-to-ten year cycle | Procurement | Vendor |
| Operations: staffing, cleaning, maintenance, cash handling | Operator or an in-house team | GBP 183.70 per space a year, England | The contract’s fee or rent | Operator, on a fee |
| Adjudication: validations, concessions, free cohorts | Clinical and administrative staff | The revenue it forgives | The clinic, and the statute behind it | Nobody — it is booked as a cost |
| Collection | Operator, payment provider, or the health system | Transaction fee | The contract | Processor |
| Enforcement | Operator or the health system | Labour and technology | The contract, bounded by waiver rules | Operator |
| The driver | — | The tariff | — | — |
The only market where both sides of the chain are published
England is the one place where the whole chain is legible, because the state publishes both sides of it every year. In 2024/25 the NHS in England collected GBP 271 million from hospital parking — GBP 192 million from patients and visitors and GBP 79 million from staff — across 459,437 spaces, against GBP 84.4 million of cost to provide the service. Revenue per space is GBP 589.85; operating cost per space is GBP 183.70. Cost cover is 3.21 times. Those four numbers are the most useful benchmark in this report, because they are the only ones in the world that are audited on both sides.
The two lines inside that pool behave differently. Patient and visitor parking is 70.85 per cent of revenue, or GBP 417.90 per space; staff parking is 29.15 per cent, or GBP 171.95 per space. The patient line has price elasticity close to zero and political elasticity close to one: the driver has no alternative, and the voter has a vote. The staff line carries a tax ceiling on it — examined in the regulatory chapter — and a labour-relations cost attached. An operator that improves yield on the patient line buys margin and reputational exposure in the same transaction. An operator that improves it on the staff line usually loses the contract at renewal, and sometimes before.
What the fee actually pays for
Set a management fee against that cost base and the shape of the business becomes obvious. At 12 per cent of gross on England’s numbers, the operator receives GBP 70.78 per space a year. That is 38.53 per cent of the GBP 183.70 it costs to deliver the service. The operator’s entire margin therefore has to come from running the same asset for less than two-fifths of what the hospital spends doing it in-house, and the gap has to be found in labour, because labour dominates the operating cost in every market we covered.
Healthcare parking outsourcing is a cost arbitrage, not a yield play. That single sentence explains most of the observable behaviour in this market: why winning bids are labour-model bids; why the technology content of contracts keeps rising even where the technology does not pay for itself on parking revenue alone, because technology is the only reliable way to compress a labour line; and why the largest operators in the world treat healthcare as an allocation inside a diversified portfolio rather than as a vertical worth specialising in. It also explains why a health system that tries to fix a parking deficit by raising the tariff generally fails. The deficit is in the denominator, not the numerator.
Where the margin moved
The margin moved, between 2025 and 2033, into the one line the tariff does not govern. Valet, patient-assist and concierge services grow at 11.40 per cent against the pool’s 6.83 and contribute 19.69 per cent of the USD 11,208.8 million the market adds. That is not a coincidence of arithmetic. A valet service is bought by the hospital to protect a patient-experience metric and to release a drop-off lane; it is priced as a service, negotiated as a service, and it never appears on a tariff board in a lobby. It is the only arm in this market where the seller sets the price rather than receiving one. Anyone modelling this market on parking revenue alone will understate by roughly a seventh where the growth is.
A finding from our own programme
One result from our primary work is worth stating plainly, because it contradicts how these contracts are sold. Across 31 semi-structured interviews and 47 written survey responses, no operator we spoke to could name the individual who authorised the largest single validation category on the campus they managed. In every case the rule existed, was applied daily, and had no owner. That is our finding, not a published one. The value chain in healthcare parking does not terminate at the driver; it terminates at an unsigned rule.
The commercial consequence is that due diligence in this market should not begin with the rate card. It should begin with the validation register: how many validations were issued last year, by which department, for what duration, against what written policy, and who signs off the exceptions. That document determines whether a contract is worth bidding. It is also the only artefact an incumbent can produce at renewal that a challenger cannot manufacture, which is why incumbents resist producing it and why asking for it is the fastest way to find out how well a site is actually run.
Investment Activity
The garage repays itself and nothing else
The cost side of this market is unusually well documented, because parking structures are a construction product before they are a revenue product. The 2025 median for a new above-grade parking structure is USD 31,400 per space, or USD 93.85 per square foot, a rise of 5.02 per cent on the 2024 median of USD 29,900. That figure is normalised for time using the Engineering News-Record Building Cost Index and for location using Gordian construction cost data, and it is derived from a database of completed projects with statistical outliers removed — including underground structures and structures built beneath buildings.
That exclusion matters more in healthcare than anywhere else. Hospitals build underground, because land is scarce and because a below-grade structure can be connected to the clinical building without consuming the site. So USD 31,400 is a floor for this market, not a central estimate. Every calculation in this chapter is therefore generous to the investment case, and the conclusion still holds.
The annuity test
Recover USD 31,400 over thirty years at 5 per cent and the annual charge is USD 2,042.63 per space, using a capital recovery factor of 6.5051 per cent. That is the revenue each structured bay must produce simply to repay its own construction, before a single attendant is paid, before utilities, before maintenance, before enforcement, and before any return to the party that took the risk.
The global pool earns USD 363.10 per total space. That is 17.78 per cent of the charge. Not 17.78 per cent short — 17.78 per cent of. The operating cost of the asset, at England’s audited GBP 183.70 per space, is about half of what the revenue is. There is no configuration of tariff, occupancy and cost discipline available to an operator in which a healthcare parking structure pays for itself out of parking revenue. That arithmetic, taken to the last decimal on England’s audited returns, is worked through in the 17.78 per cent capital cover article.
| Region | Spaces per bed | Spaces on a 500-bed campus | Capital at USD 31,400 per space, USD | Revenue per total space, USD | Cover of the annual charge |
|---|---|---|---|---|---|
| North America | 3.80 | 1,900 | 59,660,000 | 1,271.00 | 62.22% |
| Europe | 2.60 | 1,300 | 40,820,000 | 531.00 | 26.00% |
| Asia-Pacific | 1.90 | 950 | 29,830,000 | 212.80 | 10.42% |
| Latin America | 1.50 | 750 | 23,550,000 | 210.80 | 10.32% |
| Middle East & Africa | 1.30 | 650 | 20,410,000 | 83.60 | 4.09% |
| Global, per space | — | — | 31,400 | 363.10 | 17.78% |
Worked through on one campus
A 500-bed North American hospital at 3.80 spaces per bed is a 1,900-space campus. At the 2025 median, the structure costs USD 59,660,000. The annual capital charge is USD 3,880,990. Only 62 per cent of those spaces are chargeable, giving 1,178 paying bays, and at USD 2,050 per chargeable space the revenue is USD 2,414,900. The shortfall before operating cost is USD 1,466,090 a year.
Now run the same campus in England, the only market with audited costs on both sides. Convert the median construction cost at the exchange rate used throughout this report and a structured bay costs about GBP 24,724. England collects GBP 589.85 per space. That is a gross yield of 2.386 per cent on replacement cost, against a required annuity of 6.5051 per cent — cover of 36.68 per cent. England does better than the European average, and it is still nowhere near.
So who signs the cheque, and why
If the parking does not repay the structure, the structure is not funded by the parking. It is funded by the health system’s balance sheet, by tax-exempt debt in the United States, by a public capital programme in Europe and Asia, or by a real-estate partner taking a long lease on land the hospital owns. In every case the capital is committed against something other than a parking return, and that something is clinical revenue.
The competition for that capital is fierce and getting fiercer. In England the NHS estate maintenance backlog reached almost GBP 16 billion in 2024/25, a figure dominated by backlog maintenance on clinical buildings. A trust allocating capital between a roof, a scanner and a multi-storey is not running a parking model; it is running a clinical model with a parking line in it. Our interviews found no health system anywhere that presented a parking internal rate of return as the basis for a garage decision, and several that presented the loss of outpatient volume to a competitor with better parking as the basis. That is our finding, and it is the honest reason this market exists.
The only place a multiple gets paid
If the asset does not earn, the operating position can still be valuable, and the market has priced that too. The Metropolis acquisition valued an enterprise managing approximately two million spaces at approximately USD 1.5 billion — USD 750 per space of enterprise value. Against a construction cost of USD 31,400 per space, that is 2.39 per cent. The buyer was not buying structures. It was buying the right to stand between two million drivers and a payment, and to convert that position into a checkout-free transaction.
That is the correct read on this market’s capital flows. Consolidation is not buying real estate; it is buying distribution and the technology attach that comes with it. It is also why a health system that wants a better car park should not expect a consolidator to fund it. The consolidator wants the operating contract, and expects the health system to fund the structure.
Where the capital goes between 2026 and 2033
Three destinations, and only one of them is new bays. The first is conversion: chargeable space rises from 40.42 to 42.28 per cent of the estate, which is 1.91 million bays moved from free to paid, concentrated in the Middle East, Africa and Latin America rather than in the mature markets. The second is technology — lanes, sensors, payment and identity — which is a separate capital call on the same asset and is examined in the access and revenue control report and in mobile parking payment. The third is the electrical and mechanical upgrade of the bay itself.
That third destination deserves a warning. Charging at a parking asset and automated and robotic storage are both capital calls that fall on the same structure, and neither can be funded from the pool this report measures. A hospital that adds charging bays is making a service decision for clinicians and patients, not an investment decision, and should account for it that way. The one exception is where charging revenue attaches to a staff permit — and even there, the energy margin accrues to the energy provider, not to the car park.
Our investment view is therefore narrow and unfashionable. The capital that will be committed to this market between 2026 and 2033 is committed because access is a condition of clinical volume, and the returns are realised in clinical revenue. Any business case that shows a parking payback is either assuming a tariff that no health minister has ever permitted, or it is counting the structure as free.
Technology & Innovation
The system’s real job is adjudication, not collection
Parking technology is usually sold as a collection device: a gate that will not open until it is paid, a camera that reads a plate, a session that ends when an app closes. On a healthcare campus most exits are already authorised before the driver reaches them — by a validation, a permit, a blue badge, a statutory free period, or a concession granted because treatment ran long. The access system’s primary job is therefore to decide who does not pay, and then to prove afterwards that the decision was correct. That is an adjudication function wearing a payment system’s clothes, and it is why healthcare specifications diverge sharply from commercial ones even when the hardware is identical.
One asset, two demand curves, and a peak nobody prices
The dwell distribution on a healthcare campus is bimodal in a way no other parking vertical exhibits. An outpatient appointment runs 60 to 120 minutes. An inpatient visit runs two to six hours. A day shift runs eight to twelve. A night shift runs from 19:30 to 08:00. These are not variations on a theme; they are four different products sharing one ramp, and they arrive at the same time.
The arithmetic of that collision is unforgiving. Take a campus handling 1,000 patient and visitor visits a day, arriving across a four-hour morning peak, at a 90-minute average stay. Peak concurrency is 250 arrivals an hour multiplied by 1.5 hours — 375 bays occupied at once. Spread the identical 1,000 visits evenly across twelve hours and peak concurrency is 125. The peak multiplier is 3.00 times, on demand that is identical in total. The asset is sized for 375 and paid for by 1,000, and the difference is not a technology problem. It is the reason a hospital car park can look half empty at 14:00 and be a political crisis at 08:30.
Shift patterns make it worse, and they are set by rota rather than by demand. A twelve-hour shift change at 07:00 collides with outpatient arrival; the one at 19:00 collides with evening visiting. Both collisions were designed by a workforce planner optimising continuity of care, which is the correct thing for that planner to optimise. No parking system has ever been configured with the authority to move them.
The seven cohorts a system has to distinguish
| Cohort | Typical dwell | Who authorises the stay | Who pays | What the system must be able to do |
|---|---|---|---|---|
| Outpatient appointment | 60–120 minutes | Clinic or department | Patient, unless validated | Tie the session to the booking record |
| Inpatient visitor | 2–6 hours | Ward or department | Visitor | Cap-and-concession logic rather than flat hourly |
| Blue Badge patient or visitor | Duration of attendance | Statute | Nobody | Allow-list keyed to a credential |
| Frequent outpatient attender | Repeated, at least three visits a month over at least three months | Statute | Nobody | Recurring permit with an expiry test |
| Parent of an overnight child | 19:30–08:00 | Statute | Nobody, up to two vehicles | Time-bounded and vehicle-count-bounded rule |
| Staff, day shift | 8–12 hours | Employer | Employee or employer | Payroll deduction or permit issue |
| Staff, night shift | 19:30–08:00 | Statute in England | Nobody | Shift-linked allow-list |
Four of those seven cohorts cannot be priced at all, and the test that separates them from the other three is statutory rather than commercial. A system that cannot consume a shift rota, a booking record and a badge register is not a healthcare system, whatever its lane throughput. This is the specification gap that matters, and it is why the hospital contract is won on integration rather than on hardware price.
The hardware is bought elsewhere; the rules engine is not
The equipment layer of this market is examined in detail by our sister reports and is not restated here. Vehicle identity at the lane — the plate as credential — is treated in the recognition and vehicle-identity report, which is the right place to understand why a misread plate costs more than a missed payment. Lane equipment and revenue control is covered in the access and revenue control report; the sensor estate in occupancy sensing and space guidance; the payment session in mobile parking payment; and the charging bay in EV charging at parking assets. A healthcare campus buys all of it, and buys none of it on the terms those markets describe.
What a campus adds is the rules engine and its data sources. The differentiating capability is not the camera; it is the ability to bind a parking session to an appointment record, a rota and a credential register, and to produce, on demand, an auditable answer to the question a finance director always eventually asks: who decided this driver did not pay, and on what authority. In a market where four of seven cohorts are legally exempt, an operating company that cannot answer that question is not selling technology. It is selling a liability.
Where technology actually moves the number
Because the tariff is capped, the only lever an operator can pull without a political decision is validation leakage — the difference between the validations the policy permits and the validations actually issued. Every unaudited exception is a discount with no owner. It is also, in our interviews, the single largest uncontrolled variable on most sites: larger than labour productivity, larger than payment mix, and vastly larger than equipment performance.
The fix is procedural more than technical, which is why it is unpopular. Tie the validation to the appointment at the moment of booking rather than at a desk on arrival; make the duration rule explicit; put an expiry on every concession; and report leakage by department, because a department that cannot see its own leakage has no reason to reduce it. None of that requires new hardware. It requires the hospital to accept that the parking line is a clinical governance line, which it usually will not until a finance director finds the number.
A second finding from our programme
Our interviews produced one result that surprised us and that we record as ours rather than as published consensus. Operators who had introduced booking-linked validation consistently reported that the technology changed nothing on its own, and that the change arrived only when the validation report was addressed to clinical department heads rather than to the parking office. The instrument that moved behaviour was the distribution list. That is a governance finding, not a technology finding, and it is the most transferable thing in this chapter.
Between 2025 and 2033 we expect the technology content of a healthcare parking contract to keep rising while the hardware cost per lane keeps falling, because the value is migrating into integration and audit. That is consistent with an innovation intensity we score as moderate and a patent activity we score as low: this market does not invent much, and it integrates a great deal. It is also consistent with technology maturity at the growth stage — deployed widely, understood thinly.
Market Risk
What 3.21 times cost cover is worth when the price is capped
Three scenarios, and they differ in price rather than in volume. The chargeable space base is 19,824,800 bays in all three. What moves is how much each bay earns and how much of the pool migrates to the service arm. That is the correct way to read this market: the number of bays is a planning and demographic fact, and the revenue is a political one.
| Measure | Downside | Base | Upside |
|---|---|---|---|
| Patient and visitor transient, CAGR | 4.90% | 6.85% | 8.30% |
| Staff and clinician permit, CAGR | 3.60% | 5.20% | 6.40% |
| Valet, patient-assist and concierge, CAGR | 9.20% | 11.40% | 12.80% |
| Market value 2033, USD million | 23,700.4 | 27,297.7 | 30,212.9 |
| Market CAGR 2025–2033 | 4.96% | 6.83% | 8.20% |
| Revenue per chargeable space 2033, USD | 1,195.49 | 1,376.95 | 1,524.00 |
| Growth in revenue per chargeable space, CAGR | 3.64% | 5.48% | 6.83% |
| Chargeable spaces 2033 | 19,824,800 | 19,824,800 | 19,824,800 |
The spread is USD 3,597.3 million below base and USD 2,915.2 million above it — 13.18 per cent and 10.68 per cent respectively. The asymmetry is the point. The downside is a policy event with a date on it. The upside is a service-attach curve that no legislator has ever been asked to approve.
The downside is a cost case, not a demand case
This is the finding that matters most in the chapter. In the downside, revenue per chargeable space grows at 3.64 per cent a year. Construction cost per space grew 5.02 per cent in the last measured year. Set one against the other and the funding gap widens by roughly 1.4 percentage points every year, for eight years, without anything going wrong with demand.
That is a different failure mode from the one this market is usually accused of. Observers worry about volume: that telehealth will empty the outpatient clinic, or that remote work will empty the staff permit. Both are real, and both are second-order. The first-order risk is that the capital charge compounds at construction inflation while the tariff compounds at political inflation, and the two rates have never been equal. Nobody has to lose a patient for this market to underperform. The price simply has to lag the concrete.
In the base case the arithmetic just about holds: revenue per chargeable space grows at 5.48 per cent against 5.02 per cent of cost inflation, a margin of under half a point a year. That is not a comfortable margin for an asset with a thirty-year life, and it is why we score overall market risk as high even while forecasting 6.83 per cent growth.
The risk register
| Risk | Mechanism | Effect on the pool | Indicator to watch |
|---|---|---|---|
| Abolition of the charge | A statutory service condition or a political commitment removes the tariff | Removes the revenue entirely, not partially | Commencement set under the 2026 deferral Act, no later than 12 May 2029; any extension of free provision in England |
| Tariff cap or freeze | A trust board, regulator or price authority holds patient rates flat | Compresses revenue per chargeable space below cost inflation | Published trust rate cards and board papers |
| Validation leakage | Unaudited concessions erode the effective tariff | Reduces realised revenue without changing the published price | Validation events per 1,000 sessions, by department |
| Bed-base contraction | Fewer beds and fewer admissions reduce the spaces needed | Reduces space growth and revenue per bed | Annual NHC communiqué; OECD bed density |
| Construction cost inflation | The capital charge compounds faster than the tariff | Widens the funding gap at a fixed revenue base | Median cost per space, published annually |
| Labour cost inflation | Statutory wage floors raise the operating cost inside a fixed fee | Compresses operator margin, not the pool | Wage-floor upratings in the operator’s jurisdiction |
| Care-model shift | Day-case and ambulatory substitution raises episodes while lowering admissions | Ambiguous: more visits, shorter dwell, more transactions | Outpatient attendance and day-case share |
| Outsourcing penetration | Health systems insource or outsource | Neutral for the pool; decisive for who books it | Contract award notices and in-house decisions |
The one risk that has already happened
It is worth restating the abolition risk in the plainest available terms, because it is the only risk on the register with a completed precedent. Three of the four nations of the United Kingdom have legislated the price of hospital parking to zero, and the fourth has now twice deferred doing so, with Northern Ireland’s commencement date sitting at no later than 12 May 2029. The deferral itself published the number four years of policy had avoided — GBP 6.8 million of charge income against GBP 10.3 million of operating cost — and the striking fact is that abolition was legislated in 2022 without it. A risk that is legislated without measurement is the hardest kind to defend against, because the argument for retaining the revenue was never made in the first place.
England remains the counter-example and the reason the base case is not zero: it collects GBP 271 million on 459,437 spaces at 3.21 times cost cover, and that is a material contribution to a cash-constrained system. But the same government that defends the English charge has already accepted its removal in three of its own nations. That is not a stable equilibrium, and we do not model it as one.
Enforcement is where the second-order risks concentrate
Two risks sit just below the surface. The first is enforcement legitimacy. A penalty issued on a hospital site to a patient who overstayed because chemotherapy ran long is not a commercial event; it is a complaint, a press story and occasionally a legal challenge. The waiver obligations in the English guidance exist precisely because that boundary is contested. Operators who treat a hospital as a normal enforcement environment discover the error expensively, which is why the enforcement and digital permitting market is a poor template for a campus and why kerbside management, which is built around a schedule rather than a violation, is the closer analogue.
The second is equity of access. The evidence that transport cost is a real barrier to care is not anecdotal. A national Swiss study of 437 haemodialysis patients found median annual transport costs of CHF 2,925 and a mean of CHF 5,041; nearly half used a private car as their main mode; approximately half reported that transport costs caused financial restrictions or worry; and 70.8 per cent received no financial support for those costs. Dialysis is the most frequent repeated attendance in any health system, and it is the cohort that a hospital parking tariff hits hardest. Any health system that raises a patient tariff is making a clinical access decision, whether it says so or not, and the political response to that decision is the mechanism by which the whole pool can be removed.
What would change our mind
We would raise the forecast if a large health system introduced a charge where none existed and published the resulting revenue — which would create the first benchmark for a market that currently has one. We would cut it if England extended its mandatory free provision to a fifth cohort, or if any large system moved the validation decision out of the clinic and into a finance function, which would raise the effective tariff and lower the political risk at the same time. Neither is in the base case. Both are more likely than the demand-side scenarios that this market is usually argued about.
Regulatory Landscape
The price is set by a minister, and one of them has now refused
Most regulatory analysis of a parking market examines compliance cost. That is the wrong lens here. In healthcare parking the regulatory variable is not the cost of complying with a rule; it is the rule that determines whether you may charge at all. And the experiment has already been run. Within one country, one health service and one legal system, two nations have set the price of hospital parking to zero, a third legislated to do so and has twice deferred it, and the fourth is still collecting.
England charges. Scotland and Wales do not. Northern Ireland legislated abolition in the Hospital Parking Charges Act 2022, deferred commencement to 12 May 2026, and deferred it again by an Act receiving Royal Assent on 8 May 2026, which permits a new date to be set by regulations no later than 12 May 2029. The deferral published what four years of policy had not: Health and Social Care Trust car parks generated about GBP 6.8 million of charge income in 2024/25 against about GBP 10.3 million of operating cost. The revenue at risk was therefore known when the decision was taken — and the operating cost, not the revenue, is the number that decided it. The full arithmetic of that deferral, and what it does to this forecast, is set out in the Northern Ireland deferral article.
What England actually mandates
England’s charge is bounded by the NHS Standard Contract, Service Condition 17.10, which requires trusts to comply with NHS car parking guidance and, in particular, to make parking free to the groups and at the times that guidance identifies. Four groups are mandatory. Blue Badge holders attending as a patient or visitor, and disabled staff while at work. Outpatients attending at least three times within a month, over an overall period of at least three months — a month being thirty days. Parents of a child staying overnight, free between 19:30 and 08:00, for a maximum of two vehicles. And staff whose shift starts after 19:30 and ends before 08:00, free for the duration of the shift.
The voluntary elements are, commercially, the more damaging. Trusts are asked to offer concessions to visitors with relatives who are gravely ill and to their carers; to visitors to relatives on an extended stay; to install pay-on-exit so that drivers pay only for time used; and to waive additional charges when overstaying was beyond the driver’s control, explicitly including treatment that ran longer than planned or a shift that overran. Pay-on-exit removes the exit-blocking revenue that a barrier-based tariff depends on. The overstay waiver is a free option written to the driver and exercisable at a clinical reception desk, and the driver cannot lose by exercising it. No operator can hedge either of those. They are pricing decisions taken by people who will never see a profit and loss account for the car park.
Four regimes, and what each one actually controls
| Regime | Who sets the price | Mandatory free provision | Audited revenue | Direction of travel |
|---|---|---|---|---|
| England | NHS Standard Contract Service Condition 17.10, plus trust discretion | Blue Badge holders; frequent outpatient attenders at three or more visits a month over three or more months; parents of an overnight child, 19:30–08:00, up to two vehicles; night-shift staff | GBP 271m in 2024/25 on 459,437 spaces, against GBP 84.4m of cost | Capped and politically contested; no abolition committed |
| Scotland, Wales, Northern Ireland | Devolved government policy | Charges removed for patients, visitors and staff | Not collected | Zero in Scotland and Wales; Northern Ireland deferred to no later than 12 May 2029 |
| United States | Employer and health-system policy, bounded by the tax treatment of a fringe benefit | None statutory; a tax-free qualified parking ceiling of USD 340 a month for 2026 | Not published as a national series | Rising slowly, ceiling set by the fringe limit |
| Hong Kong | Planning standard of one space per three to twelve beds; Hospital Authority allocation | Operational vehicles, then staff, then visitors; 532 visitor spaces out of 7,354 | Not published as revenue | Static; visitor access deliberately residual |
| China | Provincial price authorities and hospital policy | No uniform national provision | Not published | Bed base contracting since 2025; revenue per bed under pressure |
The American ceiling is a tax rule
The United States has no statutory free-parking obligation and therefore looks, on the table above, like the least regulated of the four. It is not. It has a price ceiling, and the ceiling is buried in the tax code. Under IRC §132(f)(2)(B), the monthly exclusion for qualified parking is USD 340 for 2026, up from USD 325 in 2025, as set by Revenue Procedure 2025-32 and restated in Publication 15-B. A parking space provided free by an employer is a tax-free fringe benefit up to that amount, and above it the excess becomes taxable wages to the employee, with the employer carrying the withholding obligation that follows.
That produces an odd but powerful result. A health system that supplies staff parking free is supplying up to USD 4,080 a year of untaxed value per space. A health system that charges staff is monetising a benefit it would otherwise have to fund, and it can charge up to roughly the exclusion before the employee is worse off in after-tax terms than if the space had been given away. The exclusion is therefore not a compliance detail; it is the shape of the demand curve for staff parking in the largest market in the world. Set against it, England’s realised staff charge of GBP 171.95 per space — about USD 218 at the rate used in this report — is 18.68 times smaller than the American annual ceiling. Two different ceilings govern staff charging, and in England the political one binds long before the fiscal one ever could.
Hong Kong is the purest statement of priority
Hong Kong’s Hospital Authority does not pretend that visitor parking is a market. It states the order explicitly: spaces are provided mainly to cater for hospital operations, with priority to ambulances, non-emergency ambulance transfer vehicles, rehabilitation buses, vehicles from residential care homes, government vehicles, delivery and collection vehicles, cluster-hospital shuttles and maintenance vehicles, and then to staff private vehicles, particularly for shift duties. Visitor parking is available only after those operational needs are met. Out of 7,354 spaces across all clusters, 532 are visitor spaces — 5.74 per cent general visitor spaces and 1.50 per cent accessible visitor spaces. The overall ratio is one space to around 4.17 beds, inside a planning standard of one space per three to twelve beds.
This is the same asset as an American hospital car park, and it is not the same market at all. A campus at 4.17 beds per space with 7.23 per cent of spaces available to visitors is a facility designed to keep cars out of the way of clinical logistics. An American campus at 3.80 spaces per bed is a facility designed to keep cars on the site. Both are rational. Only one of them has a revenue pool worth owning — and the other one has the lower political risk.
China removed the volume assumption
For twenty years the global space count was carried by Chinese hospital construction. That has stopped. According to the National Health Commission’s 2024 statistical communiqué, health-institution beds reached 10,298,357 and hospital beds 8,119,877 at the end of 2024, with beds per 1,000 population at 7.32. The 2025 communiqué records 10,039,606 total beds and 7,964,244 hospital beds — a fall of 2.51 per cent and 1.92 per cent respectively in one year, with public hospital beds down 0.74 per cent to 5,564,277 and hospitals themselves down from 38,710 to 38,159.
This is the most consequential regulatory fact in the report, and it is not a regulation at all. The largest single pool of healthcare parking space in the world stopped growing, because the bed base it was built to serve stopped growing. Any forecast that assumes Asia-Pacific volume growth from Chinese hospital construction after 2024 is forecasting something the country’s own statistics have stopped supplying.
The pattern across all four
In none of these four regimes does the operator set the price, and in three of the four the rule that sets it is not primarily a parking rule: it is a health-service condition, a tax provision or a planning standard. That is the risk this report scores as high. A compliance cost can be budgeted and passed through. A revenue rule cannot. And the digital credential question — whether a Blue Badge, a frequent-attender permit or a staff shift entitlement can be verified at the lane without a paper document — is where the regulatory and technology chapters meet, which is why the smartphone credential reader is a more important document to a hospital operator than any rate card.
Our conclusion is uncomfortable for anyone underwriting growth here. The price of healthcare parking is a political variable in every market we examined, and it has already been set to zero in three of the four nations of the United Kingdom. The base case does not assume further abolition. It does assume that no health system anywhere will be permitted to raise a patient tariff faster than its own political cycle allows — which is precisely why the 53.29 per cent increase in revenue per chargeable space that this forecast requires has to come from service mix and from markets where charging is being introduced for the first time, rather than from a rate rise in a market that already charges.
Sources and provenance
Official statistics and regulator publications
- House of Commons Library, NHS funding and expenditure, research briefing CBP0724, 8 January 2026 — researchbriefings.files.parliament.uk/documents/SN00724/SN00724.pdf. Source for GBP 192 million of patient and visitor parking revenue, GBP 79 million of staff parking revenue in England in 2024/25, and the Northern Ireland abolition due in May 2026.
- NHS England, Estates Returns Information Collection, summary page and dataset for ERIC 2025/26 — gov.uk. The underlying returns from which English parking revenue, cost and space counts are drawn.
- Department of Health and Social Care and NHS England, NHS car parking guidance 2022 for NHS trusts and NHS foundation trusts, updated 29 March 2022 — gov.uk. Source for the mandatory free groups under NHS Standard Contract Service Condition 17.10 and for the voluntary concessions.
- UK Parliament, written answer Hospitals: Parking, UIN 133660, answered 28 March 2018 — questions-statements.parliament.uk. Historic ERIC returns showing 452,379 spaces, 23,660 designated accessible spaces, an average patient and visitor charge of GBP 1.32 an hour and a staff charge of GBP 0.19 an hour.
- Internal Revenue Service, Revenue Procedure 2025-32 — irs.gov, and Publication 15-B (2026), Employer’s Tax Guide to Fringe Benefits — irs.gov. Source for the USD 340 monthly qualified parking exclusion for 2026 under IRC §132(f)(2)(B), up from USD 325 in 2025.
- American Hospital Association, Fast Facts on U.S. Hospitals, 2025 — aha.org, and Environmental Scan 2026 — aha.org. Source for 6,093 hospitals, 913,136 staffed beds, 34,426,650 admissions, and the 2019–2023 comparison.
- OECD, Health at a Glance 2025 — oecd.org. Source for hospital bed density of 4.2 per 1,000 across OECD countries in 2023, and country-level densities.
- National Health Commission of the People’s Republic of China, 2024 nian woguo weisheng jiankang shiye fazhan tongji gongbao — nhc.gov.cn; and the 2025 edition as published through Xinhua — news.cn. Source for national bed counts, the 2024 to 2025 contraction, and beds per 1,000 population.
- Legislative Council of the Hong Kong Special Administrative Region, LCQ11: Car parking spaces in public hospitals, 22 January 2025 — info.gov.hk. Source for 7,354 Hospital Authority spaces, 532 visitor spaces, the one-to-4.17 beds ratio, and the Hong Kong Planning Standards and Guidelines provision of one space per three to twelve beds.
- World Bank and World Health Organization, Hospital beds per 1,000 people, indicator SH.MED.BEDS.ZS — data.worldbank.org. Regional bed density inputs.
Construction, industry and clinical evidence
- WGI, Parking Structure Construction Cost Outlook for 2025 — publications.wginc.com. Source for the USD 31,400 per space and USD 93.85 per square foot medians, their methodology, and the 2024 comparison of USD 29,900.
- Metropolis Technologies, Metropolis to Acquire SP+, 5 October 2023 — metropolis.io. Source for the USD 54.00 per share consideration, the premiums, the approximately USD 1.5 billion enterprise value, and SP+ operating scale.
- SP Plus Corporation, Fourth quarter and full-year 2023 results, 27 February 2024. Cited by name for the 94 per cent location retention rate and the eleventh consecutive quarter of net location growth; not hyperlinked because the disclosure was made through a wire release carried on a third-party mirror rather than on the company’s own current site.
- Gröble S, Bilger J, Britt C, Kaspar H, Herzig S, Schmitt K-U, The Socioeconomic Impact of Transport Costs for Adult Patients Requiring Haemodialysis: A Mixed Methods Study — PMC11675932. Source for median annual transport costs of CHF 2,925, a mean of CHF 5,041, and 70.8 per cent receiving no financial support.
Provenance and model disclosure
This report is bound to the Wikidata entity for a hospital, Q16917, as its primary concept identifier. The global bed base of 21.9 million is a Pheonix construction assembled from the AHA, National Health Commission, OECD and World Bank inputs listed above; it is not a single published series and should not be quoted as one. Spaces per bed, chargeable share and revenue per chargeable space are Pheonix model parameters, calibrated so that the resulting estate brackets the two official ratios that exist — Hong Kong’s planning standard of one space per three to twelve beds and its actual provision of one space per 4.17 beds — and so that the European revenue per space reconciles with England’s audited returns. Cross-currency comparison uses GBP/USD 1.27 and EUR/USD 1.08; these are our assumptions and not market fixings. The capital recovery factor is computed at 5 per cent over thirty years. The 500-bed campus is an illustration, not a survey finding. Primary research comprised 31 semi-structured interviews across seven markets, nine conference-floor interviews, one closed roundtable with five operators and one health-system facilities director, and 47 written survey responses, conducted 2024–2026; the two findings identified in the text as ours are the unowned validation rule and the role of the report distribution list in changing validation behaviour. No market-research publisher is cited anywhere in this report.