Company Profile
Mistras Group, Inc.
Identifiers and reference data
| Legal name | Mistras Group, Inc. (Delaware corporation) |
|---|---|
| Listing | New York Stock Exchange, ticker MG — to be delisted on completion of the H.I.G. Capital merger |
| Headquarters | Princeton Junction, New Jersey, United States |
| Founded | 1978 (Wikidata property P571) |
| Employees | Approximately 4,800 worldwide at 31 December 2025 — 3,200 in the United States, 500 in Canada, 1,100 in other non-US locations |
| Footprint | Operations in 11 countries and approximately 95 facilities |
| Operating segments | North America · International · Products and Systems |
| Fiscal year | Calendar year, ended 31 December |
| SEC CIK | 1436126 |
| Wikidata | Q30298397 |
| Pheonix entity | MIEN-node_b3f24c04 |
| Website | mistrasgroup.com |
| Investor relations | investors.mistrasgroup.com |
| Filings | EDGAR — Mistras Group, Inc. |
Executive summary
MISTRAS is the largest listed pure-play in industrial asset integrity. It sells inspection labour — technicians applying ultrasonic, radiographic, magnetic particle, penetrant and visual techniques at customer sites — together with the laboratories, monitoring hardware and integrity software that surround it. Revenue in FY2025 was USD 724.0 million, 0.8 per cent below FY2024. Adjusted EBITDA was a record USD 91.1 million, up 10.5 per cent, at a 12.6 per cent margin.
The mix, not the topline, carried that improvement. Oil and gas was 54.8 per cent of FY2025 revenue and fell 5.3 per cent to USD 396.8 million, while the three markets management calls strategic — aerospace and defense, power generation and transmission, and infrastructure, research and engineering — grew 7.8, 21.1 and 13.2 per cent respectively and reached 24.2 per cent of revenue, from 21.5 per cent a year earlier. In the second quarter of 2026 those three grew 28 per cent in aggregate while oil and gas fell 8.2 per cent.
Nine months into 2026 revenue was USD 566.8 million, 4.5 per cent higher, third-quarter gross margin reached 30.3 per cent, and full-year guidance was raised in August to USD 740–755 million of revenue and USD 92–95 million of adjusted EBITDA. On 17 September 2026 the company agreed to be acquired by H.I.G. Capital at USD 20.35 per share in cash — an enterprise value of approximately USD 866 million, or 9.5 times FY2025 adjusted EBITDA — with a special stockholder meeting set for 24 November 2026.
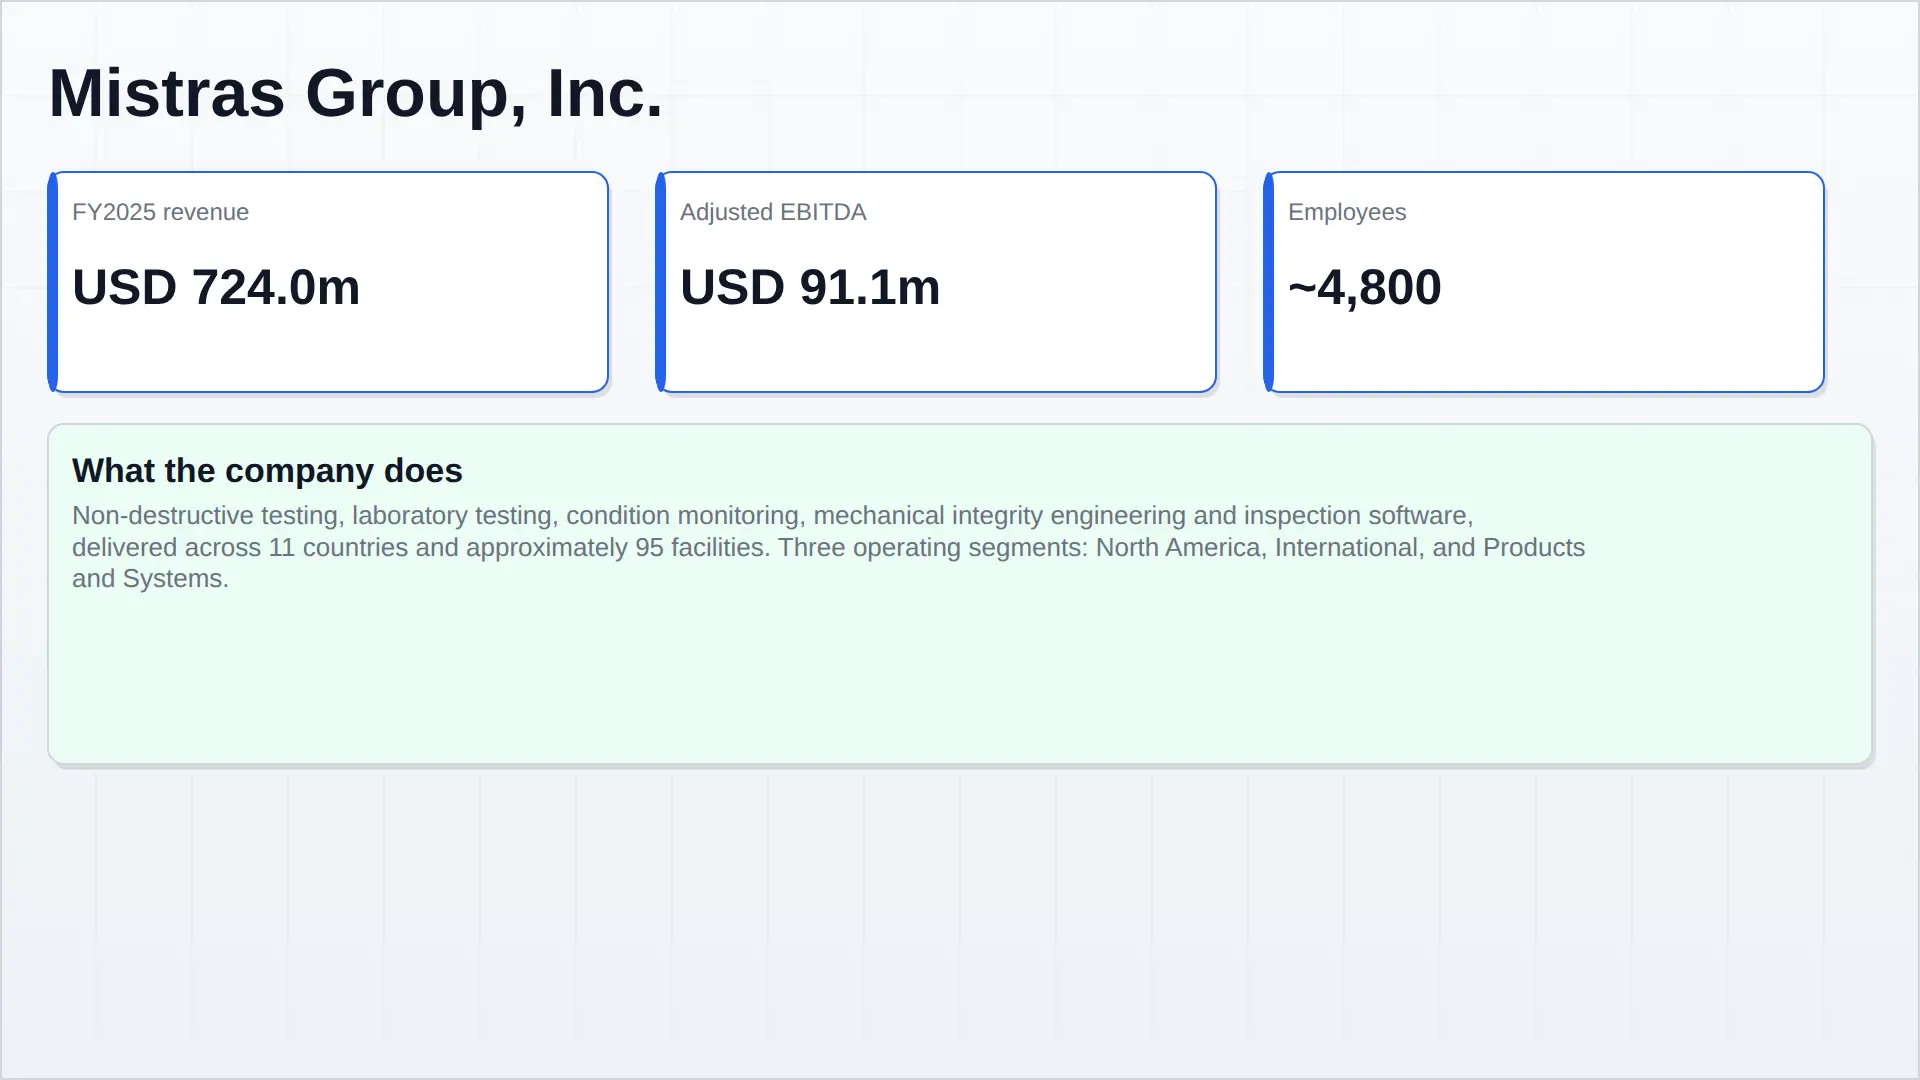
| USD 724.0m FY2025 revenue, down 0.8% |
USD 91.1m FY2025 adjusted EBITDA, 12.6% margin, up 130 bps |
54.8% Oil and gas share of FY2025 revenue |
USD 866m Merger enterprise value, USD 20.35 per share |
Company overview
Business description
MISTRAS provides a portfolio running from non-destructive testing and pipeline inspection through real-time condition monitoring and maintenance planning to engineering services, mechanical support work such as heat tracing and insulation removal, and a proprietary software suite that centralises asset integrity data. Its stated markets are oil and gas, aerospace and defense, power and utilities, manufacturing and civil infrastructure — sectors where inspection is a regulatory requirement and an insurance condition rather than a discretionary purchase.
Most work is performed at customer facilities and is recurring in nature, because the assets inspected are subject to periodic statutory examination. Aerospace and defense is the exception: those customers are served largely through the company’s own laboratory network, which is accredited to Nadcap and to individual prime standards, and which lists Boeing, Safran, Airbus, Bombardier and Embraer among the manufacturers it tests for. Hardware is manufactured at Princeton Junction, New Jersey (acoustic emission products and NDT Automation ultrasonic equipment) and in France (automated ultrasonic systems and scanners).
Customer concentration is low for a company of this size: the top ten customers accounted for approximately 36 per cent of FY2025 revenue, and no single customer exceeded 10 per cent. Less than 1 per cent of United States employees are unionised.
Segment structure
Three operating segments are reported. North America is the franchise — inspection, in-laboratory testing, mechanical and engineering services in the United States and Canada, and the home of the software, digital and data businesses. International serves Europe, the Middle East, Africa, Asia and South America. Products and Systems designs, manufactures and services monitoring equipment and instrumentation, predominantly in the United States, and also serves customers in China and South Korea.
| USD thousands | FY2025 revenue | FY2025 gross profit | FY2024 revenue | FY2024 gross profit |
|---|---|---|---|---|
| North America | 584,131 | 154,520 | 593,527 | 146,026 |
| International | 143,843 | 43,149 | 135,969 | 39,058 |
| Products and Systems | 13,970 | 7,385 | 13,661 | 6,997 |
| Corporate and eliminations | (17,920) | (543) | (13,517) | 92 |
| Total | 724,024 | 204,511 | 729,640 | 192,173 |
| Gross profit as % of revenue | 28.2% | 26.3% | ||
Gross profit is the segment measure the company publishes in its results; segment operating income is not disclosed quarterly, so none is shown here. The International segment carries a materially higher gross margin than North America, and Products and Systems a structurally higher one again, on a small revenue base.
Revenue by end market
| USD millions | FY2025 | FY2024 | Change |
|---|---|---|---|
| Oil & Gas | 396.8 | 418.9 | −5.3% |
| Aerospace & Defense | 93.8 | 87.0 | +7.8% |
| Industrials | 80.7 | 71.7 | +12.6% |
| Power Generation & Transmission | 44.2 | 36.5 | +21.1% |
| Other Process Industries | 40.1 | 49.8 | −19.6% |
| Infrastructure, Research & Engineering | 37.5 | 33.2 | +13.2% |
| Other | 17.7 | 16.9 | +4.7% |
| Petrochemical | 13.1 | 15.6 | −15.6% |
| Total | 724.0 | 729.6 | −0.8% |
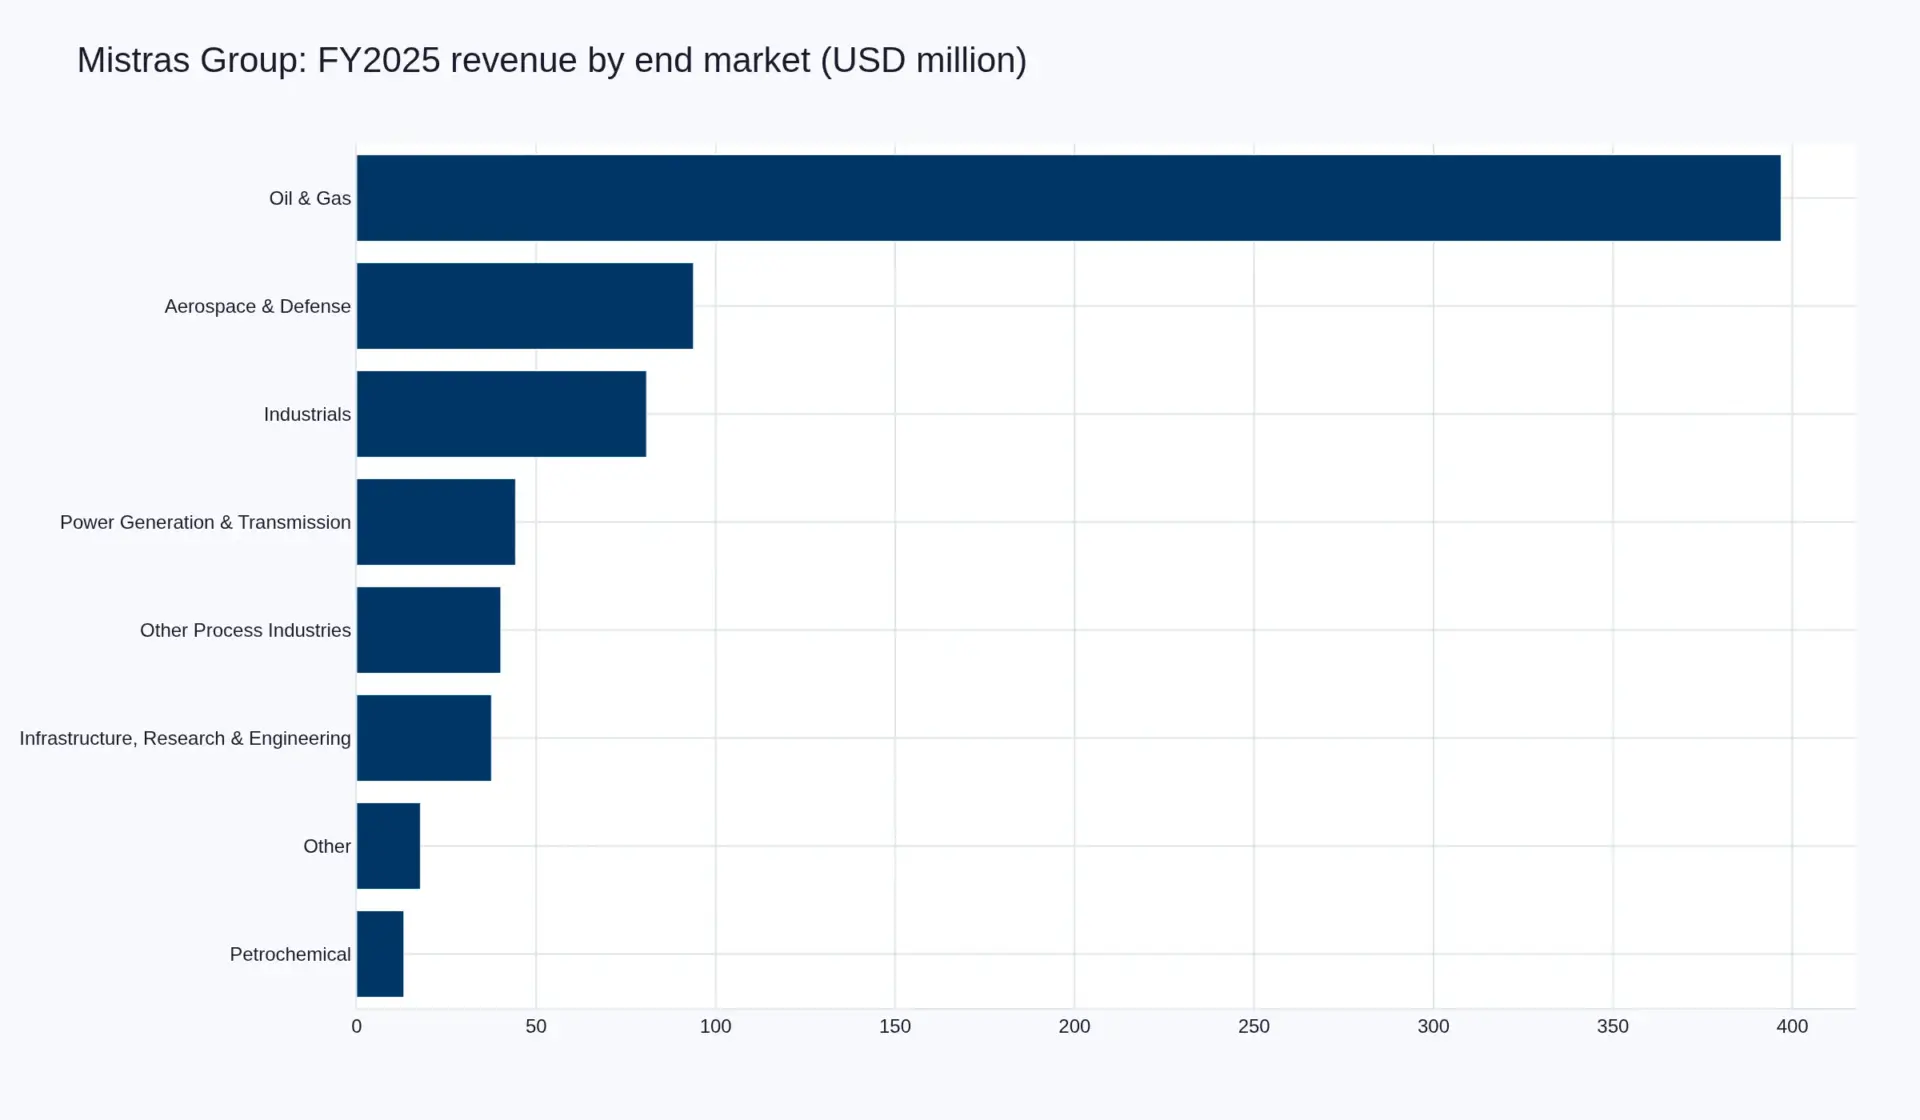
FY2025 revenue by end market. Source: Mistras Group FY2025 results, 4 March 2026.
Revenue by type
| USD millions | FY2025 | FY2024 | Change |
|---|---|---|---|
| Field Services | 475.6 | 502.8 | −5.4% |
| Other, including mixed laboratory and field locations | 108.2 | 93.1 | +16.3% |
| Laboratories | 72.4 | 64.6 | +12.1% |
| Data Analytical Solutions | 67.8 | 69.2 | −2.0% |
| Total | 724.0 | 729.6 | −0.8% |
The pattern inside those four lines is the clearest statement of where the company is. Field services, the labour-heavy core, fell 5.4 per cent. Laboratories, which serve aerospace and defense, grew 12.1 per cent. Data Analytical Solutions — the software, subscription and analytics business that management treats as the differentiated layer — declined 2.0 per cent to USD 67.8 million, or 9.4 per cent of revenue.
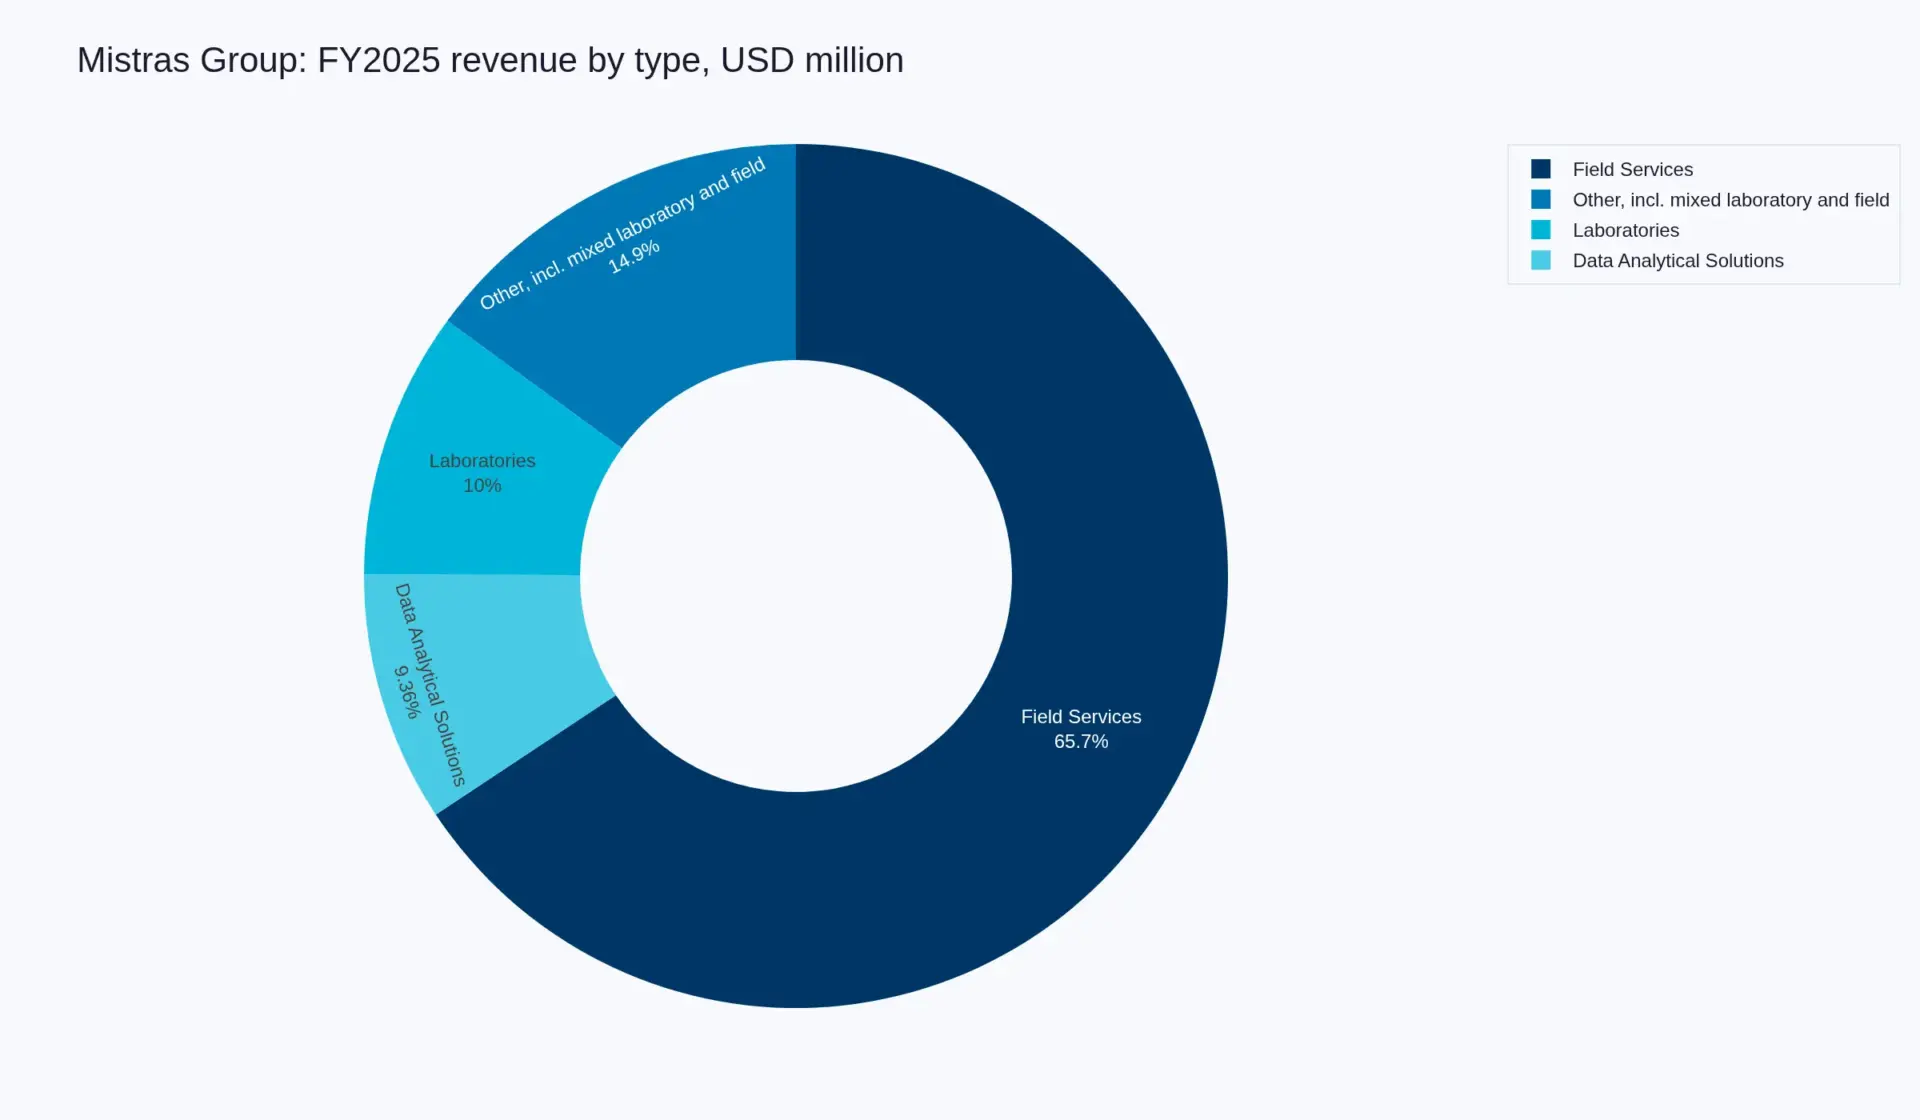
FY2025 revenue by type. Source: Mistras Group FY2025 results, 4 March 2026.
Footprint
| Measure | FY2025 |
|---|---|
| Employees, United States | 3,200 |
| Employees, Canada | 500 |
| Employees, other non-US | 1,100 |
| Countries with operations | 11 |
| Facilities | Approximately 95 |
| Revenue outside the United States | Approximately 30% |
| Primary non-US operations | Canada, Germany, France, United Kingdom, Netherlands, Brazil |
| Also present in | Belgium, Greece, India, Mexico |
Financial performance
Selected income statement lines, FY2023–FY2025
| USD thousands except per-share | FY2025 | FY2024 | FY2023 |
|---|---|---|---|
| Revenue | 724,024 | 729,640 | 705,473 |
| Cost of revenue | 497,143 | 513,864 | 497,177 |
| Depreciation in cost of revenue | 22,370 | 23,603 | 23,995 |
| Gross profit | 204,511 | 192,173 | 184,301 |
| Selling, general and administrative expenses | 139,876 | 135,452 | 147,243 |
| Reorganization and other costs | 12,654 | 5,517 | 12,278 |
| Environmental expense, net | 1,743 | 1,660 | — |
| Goodwill impairment charges | — | — | 13,799 |
| Legal settlement and litigation, net | — | (808) | 1,058 |
| Research and engineering | 1,028 | 1,119 | n/a |
| Depreciation and amortization | 8,638 | 9,407 | 10,104 |
| Income (loss) from operations | 40,572 | 39,826 | (1,904) |
| Interest expense | 14,643 | 17,067 | 16,761 |
| Other (income) expense, net | 3,451 | (1,485) | — |
| Income (loss) before income taxes | 22,478 | 24,244 | (18,665) |
| Provision (benefit) for income taxes | 5,557 | 5,274 | (1,220) |
| Net income (loss) | 16,921 | 18,970 | (17,445) |
| Net income (loss) attributable to Mistras Group, Inc. | 16,837 | 18,958 | (17,453) |
| Diluted earnings per share | 0.53 | 0.60 | (0.58)* |
| Adjusted EBITDA (non-GAAP) | 91,109 | 82,459 | n/a |
*FY2023 earnings per share is shown on a basic basis as reported. Research and engineering expense is not presented for FY2023 in the FY2025 results release, and no FY2023 adjusted EBITDA figure appears there either, so neither is shown.
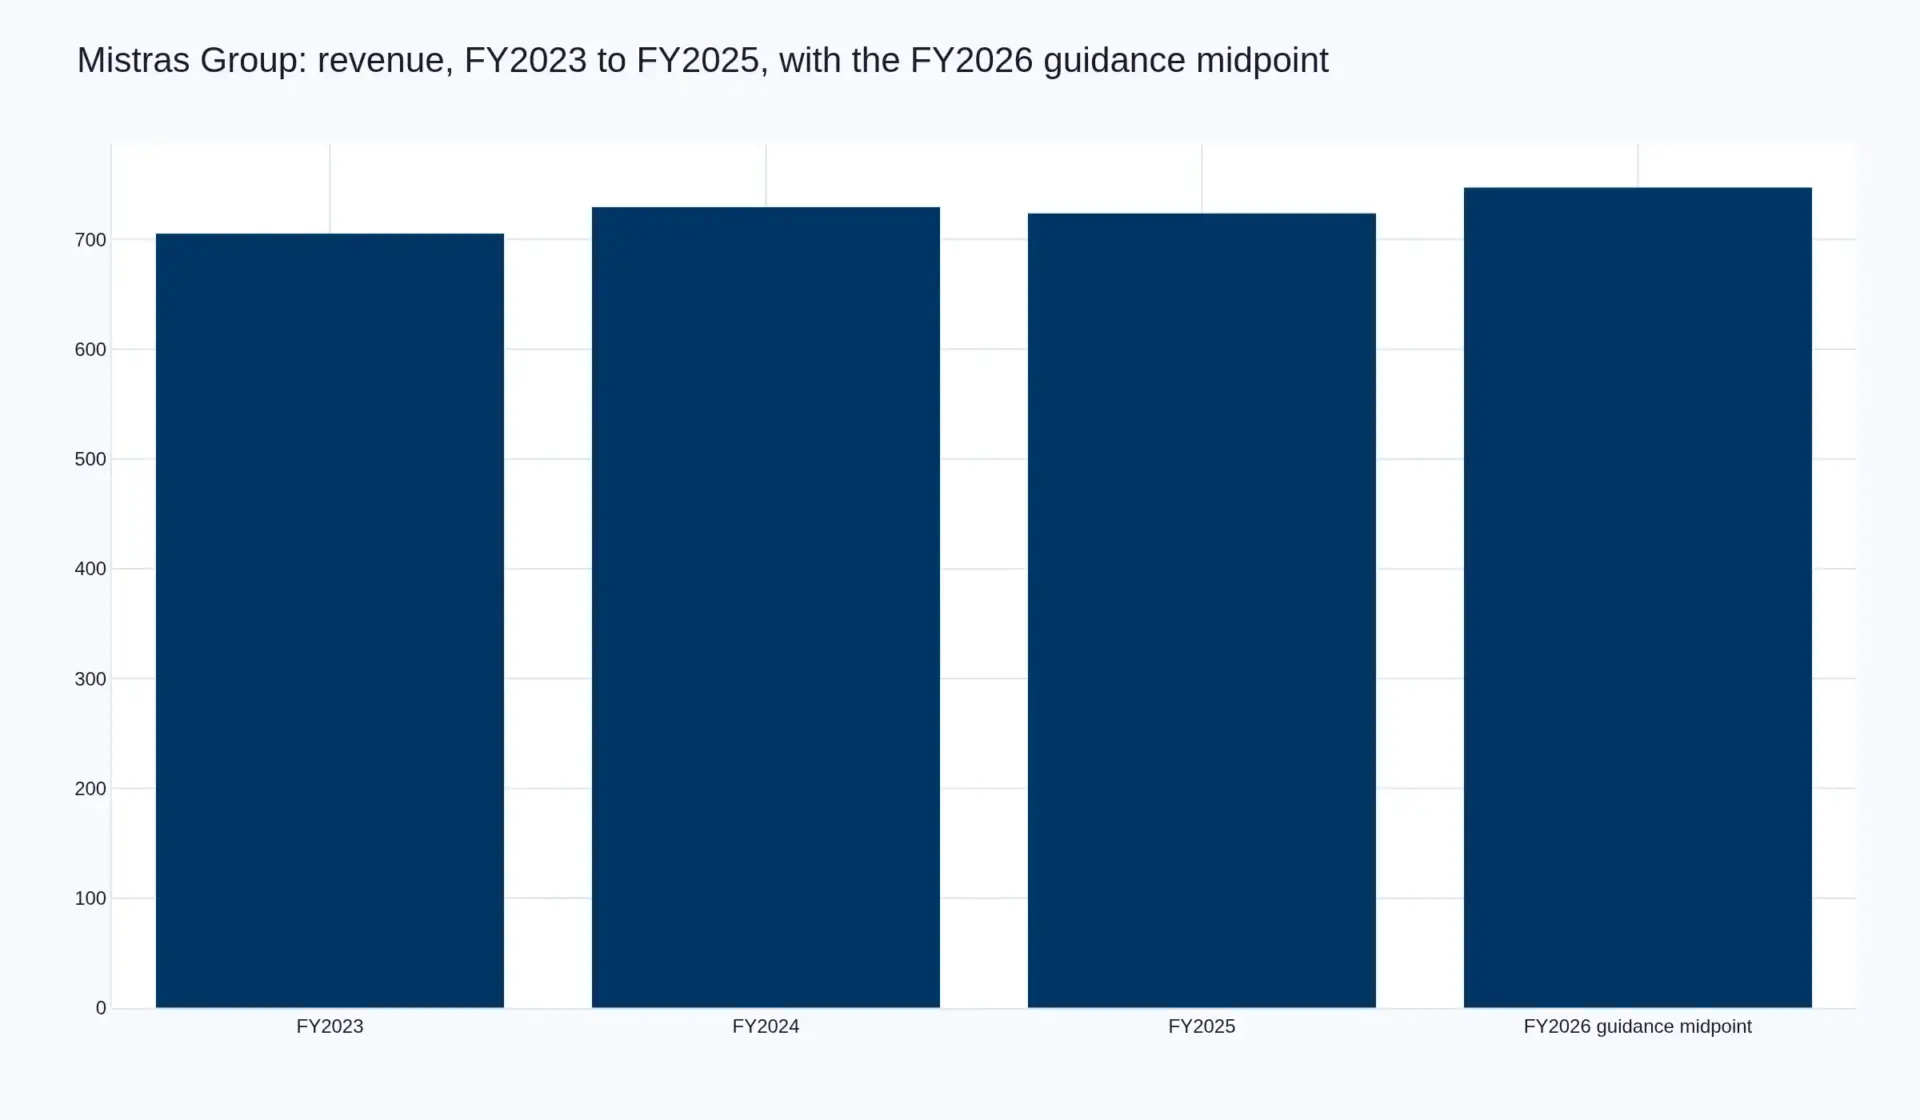
Revenue, FY2023 to FY2025, with the midpoint of FY2026 guidance. Sources: FY2025 Form 10-K; Q2 2026 results.
Margin and cash generation
| 28.2% FY2025 gross margin, up 190 bps from 26.3% |
12.6% FY2025 adjusted EBITDA margin, up 130 bps from 11.3% |
2.3% FY2025 net margin — USD 14.6m of interest absorbed a third of operating income |
30.3% Q3 2026 gross margin, the highest quarterly figure in the period covered here |
Cash generation turned in the first half of 2026: operating cash flow of USD 17.7 million against a USD 3.6 million outflow in the prior-year period, and free cash flow of USD 3.7 million against negative USD 15.9 million. Management attributes the swing to higher net income and improved working-capital timing, and added a dedicated working-capital role in January 2026 to institutionalise it. The company recorded USD 12.7 million of reorganization and other costs in FY2025 related to overhead reduction and recalibration, against USD 5.5 million in FY2024.
Balance sheet and leverage
| USD thousands | 30 September 2026 | 31 December 2025 |
|---|---|---|
| Cash and cash equivalents | 18,987 | 28,008 |
| Long-term debt, including current portion | 173,764 | 177,992 |
| Finance lease obligations | 30,547 | 24,365 |
| Goodwill | 182,282 | 184,829 |
| Total assets | 597,463 | 578,781 |
| Total equity | 248,403 | 235,645 |
Leverage under the credit agreement was 2.2 times trailing twelve-month consolidated debt at 30 June 2026 — described by the company as its lowest since 2018 and well inside the 3.75 times covenant — against a stated target of 2.0 times by the end of 2026. Goodwill of USD 182.3 million represents 30.5 per cent of total assets, a figure worth remembering given the USD 13.8 million impairment charge taken in FY2023.
Where the figures are thin
Four things a reader might want are not available from validated sources, and are not presented rather than estimated here: FY2023 adjusted EBITDA (not published in the FY2025 results release); quarterly segment operating income (only gross profit is disclosed); order backlog or book-to-bill (the company refers to a healthy aerospace and defense backlog without quantifying it in its release); and end-market gross margin (disaggregated revenue is given by end market and segment, but profitability only by segment).
SWOT analysis
| Strengths | Weaknesses |
|---|---|
|
|
| Opportunities | Threats |
|
|
Recent developments
| Date | Event |
|---|---|
| 28 January 2026 | Three leadership appointments: Executive Vice President, General Counsel and Corporate Secretary; Vice President of Working Capital Management; Vice President of Building and Infrastructure. |
| 4 March 2026 | FY2025 results: revenue of USD 724.0 million and record adjusted EBITDA of USD 91.1 million at a 12.6 per cent margin. |
| 11 March 2026 | FY2025 Form 10-K filed with the SEC. |
| 10 August 2026 | Q2 2026 results: revenue of USD 193.1 million, up 4.2 per cent; record second-quarter adjusted EBITDA of USD 25.8 million; full-year guidance raised to USD 740–755 million of revenue and USD 92–95 million of adjusted EBITDA. |
| 27 August 2026 | AI and digital strategy accelerated; Samer F. Sarrouh appointed Executive Director of Artificial Intelligence to lead an enterprise AI centre of excellence. |
| 17–18 September 2026 | Definitive agreement to be acquired by affiliates of H.I.G. Capital at USD 20.35 per share in cash, an enterprise value of approximately USD 866 million, a premium of approximately 8 per cent to the 30-day and 13 per cent to the 90-day volume-weighted average price. |
| 22 October 2026 | Federal Trade Commission grants early termination of the Hart-Scott-Rodino waiting period. |
| 27 October 2026 | Go-shop period expires: 122 third parties contacted (24 strategic, 98 financial sponsors), 40 confidentiality agreements signed, no competing proposal received. |
| 2 November 2026 | Q3 2026 Form 10-Q filed: nine-month revenue of USD 566.8 million, up 4.5 per cent, and third-quarter gross margin of 30.3 per cent. |
| 5–6 November 2026 | Two purported stockholder class actions filed in New York Supreme Court alleging the proxy statement omitted material information; the company denies the claims. |
| 13 November 2026 | Form 8-K: proxy statement voluntarily supplemented to moot the disclosure claims; special meeting of stockholders set for 24 November 2026. |
Business strategy
The operating plan is called Vision2030 and has three stated priorities: expand wallet share by selling more integrated scope to existing customers, diversify into higher-growth end markets, and build operational leverage through efficiency and productivity. Beneath those sit the growth elements described in the FY2025 Form 10-K — digitalising asset protection data, expanding in aerospace and defense, broadening pipeline integrity and mechanical services, extending the OneSuite software ecosystem, selling more to existing customers, entering adjacent end markets and making acquisitions.
| Priority | What it means in practice | The number behind it |
|---|---|---|
| Expand wallet share | Attach proprietary technology — ART Crawler robotics, condition monitoring, PCMS integrity data — to inspection programmes already being won, and simplify proposals to win more scope per customer. | Data Analytical Solutions revenue of USD 67.8 million, 9.4 per cent of FY2025 revenue, down 2.0 per cent year on year. |
| Diversify growth markets | Shift resources toward aerospace and defense, power generation and transmission, and infrastructure, research and engineering; manage oil and gas selectively for margin rather than volume. | Strategic end markets at 24.2 per cent of FY2025 revenue, against 21.5 per cent in FY2024, and up 28 per cent in aggregate in Q2 2026. |
| Build operational leverage | Automation and AI in workflows, collections and support functions; technician recruiting and targeted benefits to protect delivery capacity. | Gross margin from 26.3 to 28.2 per cent and adjusted EBITDA margin from 11.3 to 12.6 per cent in one year; USD 12.7 million of reorganization cost incurred in FY2025. |
| Capital allocation | Use residual free cash flow to pay down debt toward a 2.0 times leverage target while funding capacity in the highest-return markets. | Leverage of 2.2 times at 30 June 2026, the lowest since 2018; free cash flow of USD 3.7 million in the first half of 2026 against negative USD 15.9 million a year earlier. |
| Technology and AI | An AI centre of excellence applied to inspection intelligence, mechanical integrity, engineering productivity and customer-facing data; automation and throughput in the laboratory network. | Executive Director of Artificial Intelligence appointed in August 2026; in-lab capacity in Houston and Los Angeles expanded, with management indicating a path to nearly triple in-lab testing capacity over time. |
The strategic question now sits outside the operating plan. A private owner at 9.5 times FY2025 adjusted EBITDA removes the quarterly earnings constraint that has shaped the oil-and-gas trade-off — accepting lower volume in exchange for margin — and it removes the public-market scrutiny of a 2.3 per cent net margin. What it does not change is the underlying arithmetic: growth in this business comes from end-market mix and from hours billed per inspection, and both move slowly.
Sources
- FY2025 fourth-quarter and full-year results, GlobeNewswire release filed as Exhibit 99.1 to Form 8-K on 4 March 2026 — sec.gov
- Form 10-K for the fiscal year ended 31 December 2025, filed 11 March 2026 — sec.gov
- Form 10-Q for the quarter ended 30 September 2026 — sec.gov
- Q2 2026 results, Exhibit 99.1 to Form 8-K, 10 August 2026 — sec.gov
- MISTRAS Group, Inc. enters into definitive agreement to be acquired by H.I.G. Capital, 18 September 2026 — investors.mistrasgroup.com
- MISTRAS Group accelerates AI and digital innovation strategy, 27 August 2026 — investors.mistrasgroup.com
- MISTRAS Group announces strategic leadership appointments, 28 January 2026 — mistrasgroup.com
- Form 8-K, 13 November 2026, supplement to the definitive proxy statement (merger litigation and go-shop outcome), as filed with the SEC.
- Wikidata entity Q30298397 for the legal identity, founding year and headquarters, retrieved from the Wikidata API on 18 November 2026 — wikidata.org
Provenance: this profile is bound to Wikidata Q30298397 and to Pheonix entity MIEN-node_b3f24c04. Financial figures are in USD thousands unless stated otherwise. Last verified 18 November 2026 against the FY2025 Form 10-K (filed 11 March 2026), the Q3 2026 Form 10-Q (filed 2 November 2026) and company releases through 13 November 2026.
Market Presence
Mistras Group, Inc. is mentioned across 2 market reports.
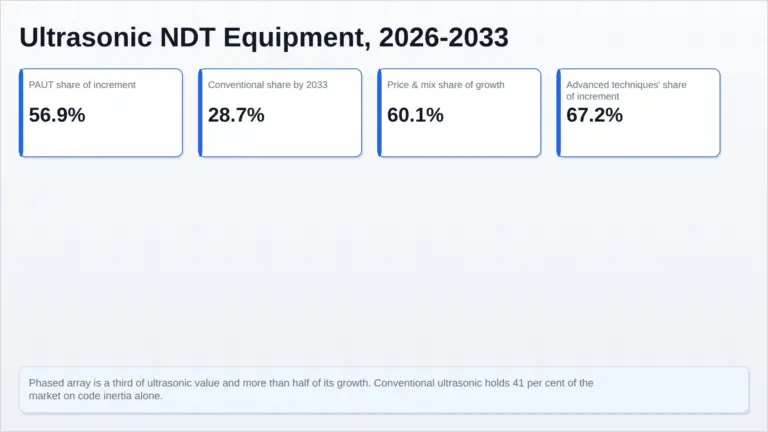
Global Ultrasonic NDT Equipment Market Report, Size, Share and Forecast 2026–2033: Thirty-Four Per Cent of the Market, Fifty-Seven Per Cent of the Growth