
Global Mycotoxin Testing & Feed Binder Market Report, Size, Share and Forecast 2026–2033: USD 3.28 Billion to USD 5.80 Billion at 7.39 Per Cent — the Test Is Priced Like a Commodity and the Binder Is Priced Like Insurance
One company bought both halves in 2020. It is selling them separately in 2026.
On 2 October 2020, Royal DSM completed the acquisition of Erber Group for an enterprise value of EUR 980 million. It bought two businesses that almost every published treatment of this subject keeps in separate documents: Biomin, which specialised in mycotoxin risk management — the binder a feed mill adds to a ration it cannot fully trust — and Romer Labs, which specialised in food and feed safety diagnostics, the test that determines whether the ration needs it at all. DSM set out the logic plainly: one business sells the diagnosis, the other sells the treatment, and both were described as higher value-add specialty solutions serving the same customer.
Five and a half years later, on 9 February 2026, dsm-firmenich agreed to sell its remaining Animal Nutrition & Health business to CVC Capital Partners at an enterprise value of about EUR 2.2 billion, including an earnout of up to EUR 500 million. ANH represented roughly EUR 3.5 billion of the group's annual net sales and around EUR 0.5 billion of its Adjusted EBITDA in 2025. The 50 per cent stake in the Feed Enzymes Alliance had already gone to Novonesis on 2 June 2025 for EUR 1.5 billion, about EUR 1.4 billion net of transaction costs. The residual business will be split into two standalone companies, both based at Kaiseraugst.
So the most sophisticated owner in this market validated the combination — diagnosis plus treatment — over five years, and then unwound it. That disagreement is the most useful thing in this report, because it marks exactly where the two halves behave alike and where they stop.
Market snapshot: four numbers that decide this report
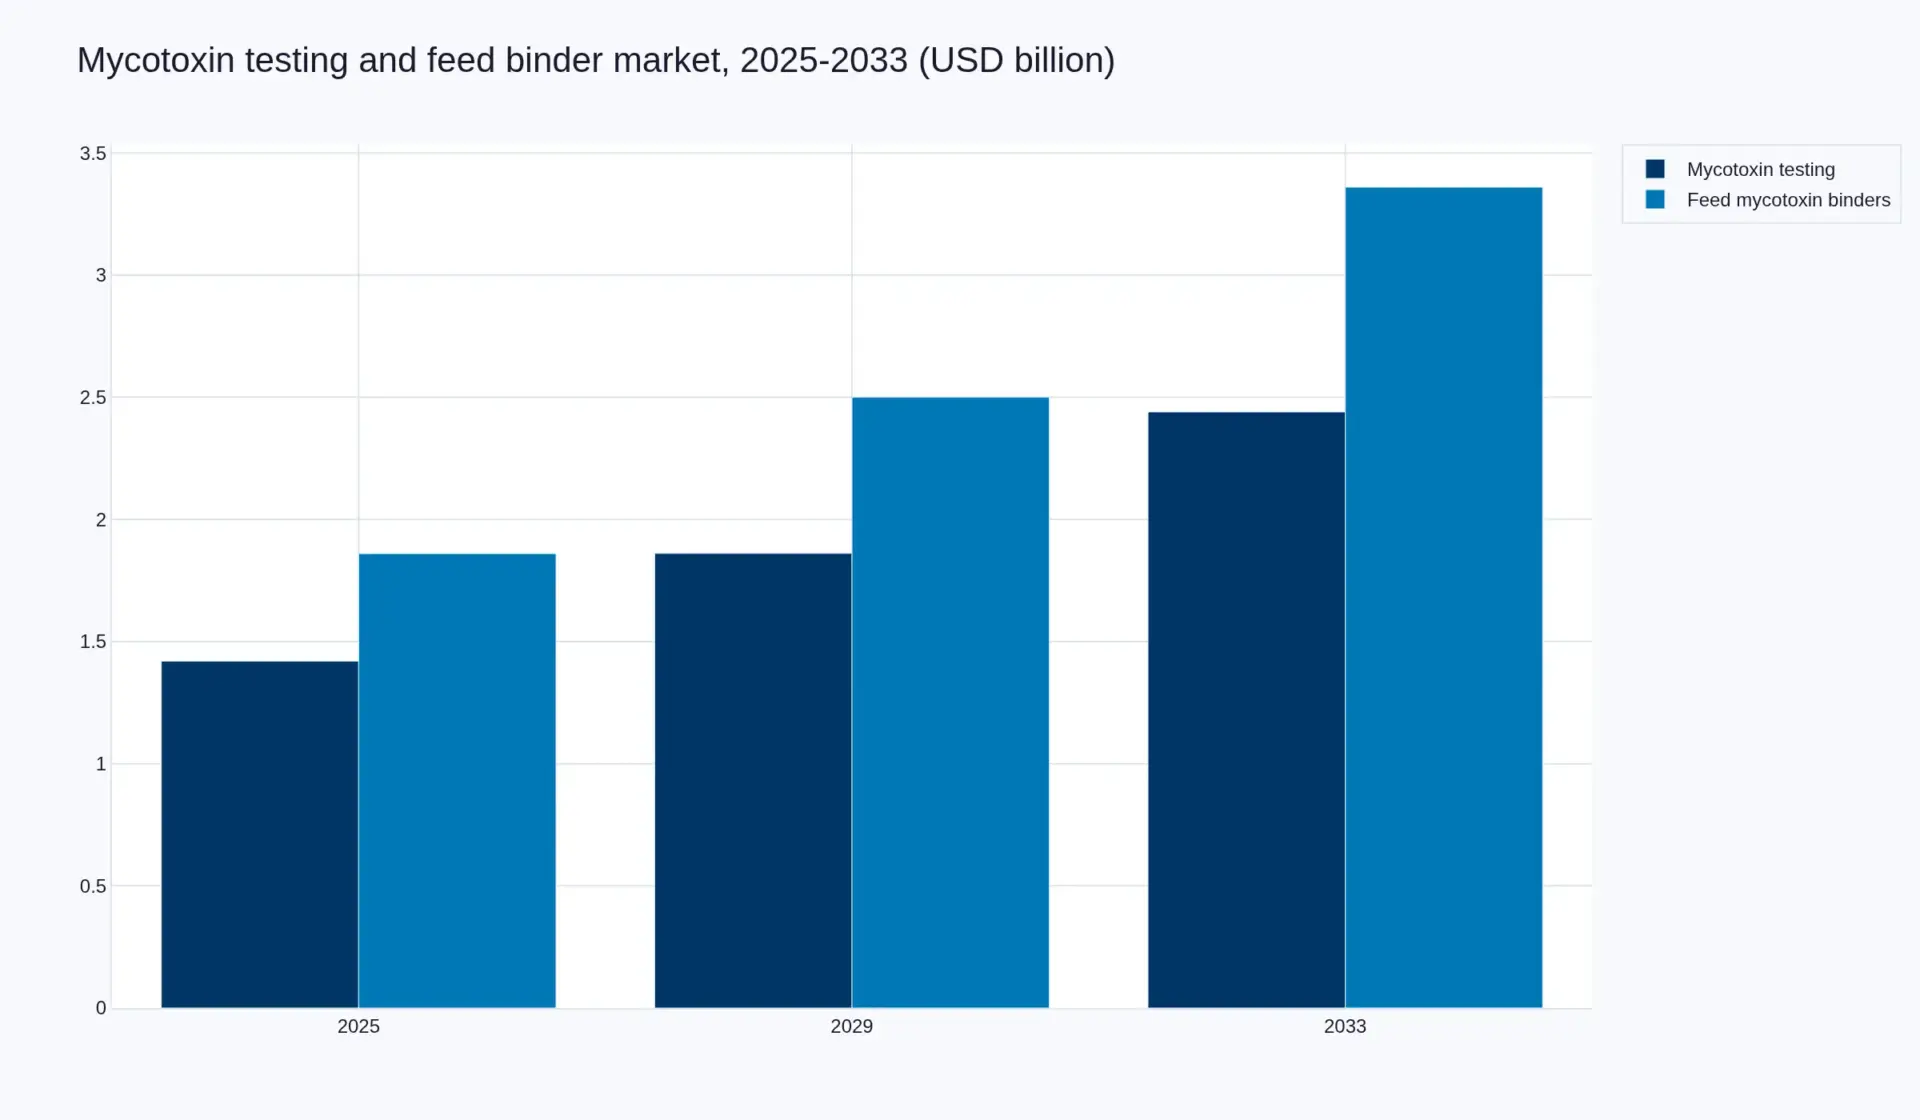
The combined market is USD 3.28 billion in 2025, reaching USD 5.80 billion in 2033 — a compound annual rate of 7.39 per cent. It divides unevenly. Mycotoxin testing is USD 1.42 billion of the 2025 total and reaches USD 2.44 billion at 7.00 per cent. Feed mycotoxin binders are USD 1.86 billion and reach USD 3.36 billion at 7.67 per cent. By 2033 the mitigation side is still more than a third larger than the measurement side.
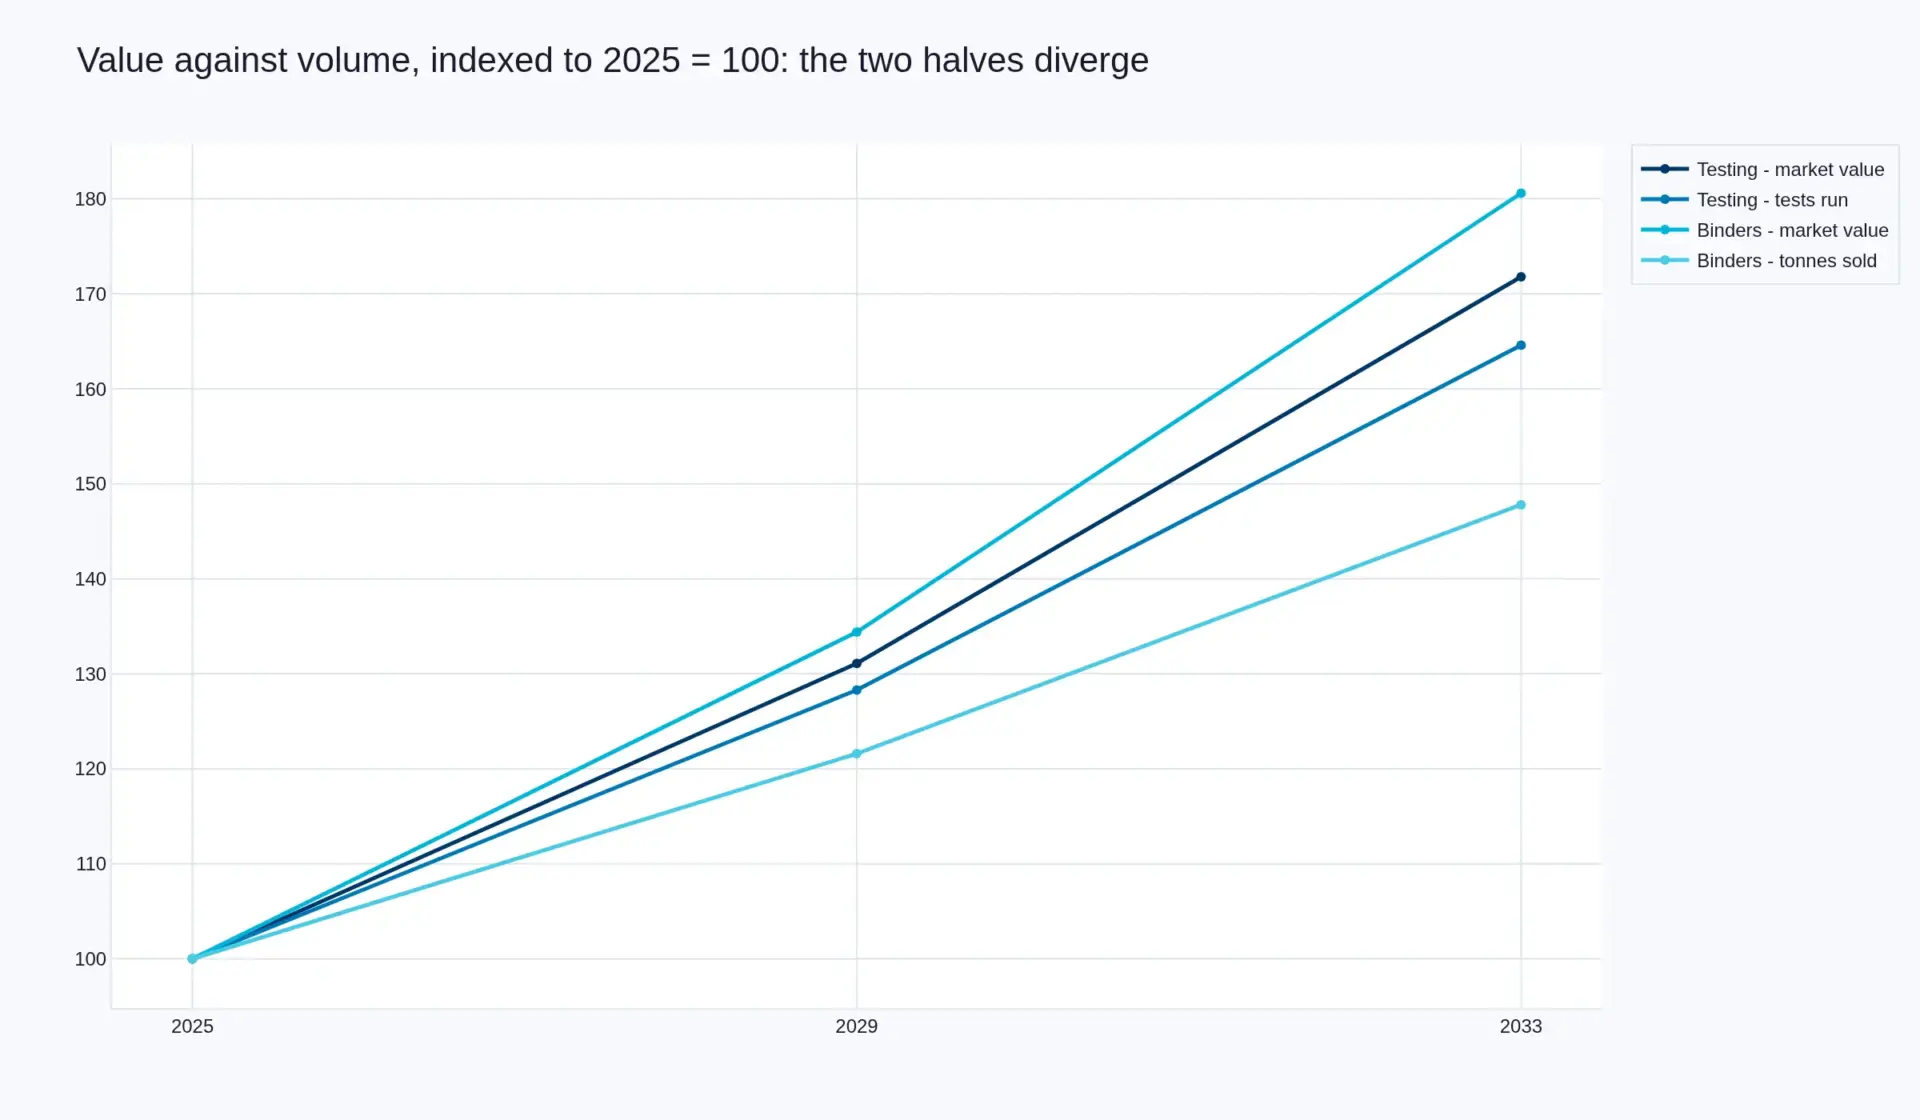
Tests run rise from 96.0 million to 158.0 million at 6.43 per cent, and the realised value of a test moves from USD 14.79 to USD 15.44 — 4.4 per cent across eight years, or 0.54 per cent a year. Tonnes of binder rise from 320,000 to 473,000 at 5.01 per cent while the realised price moves from USD 5,812 a tonne to USD 7,104 — up 22.2 per cent, or 2.54 per cent a year.
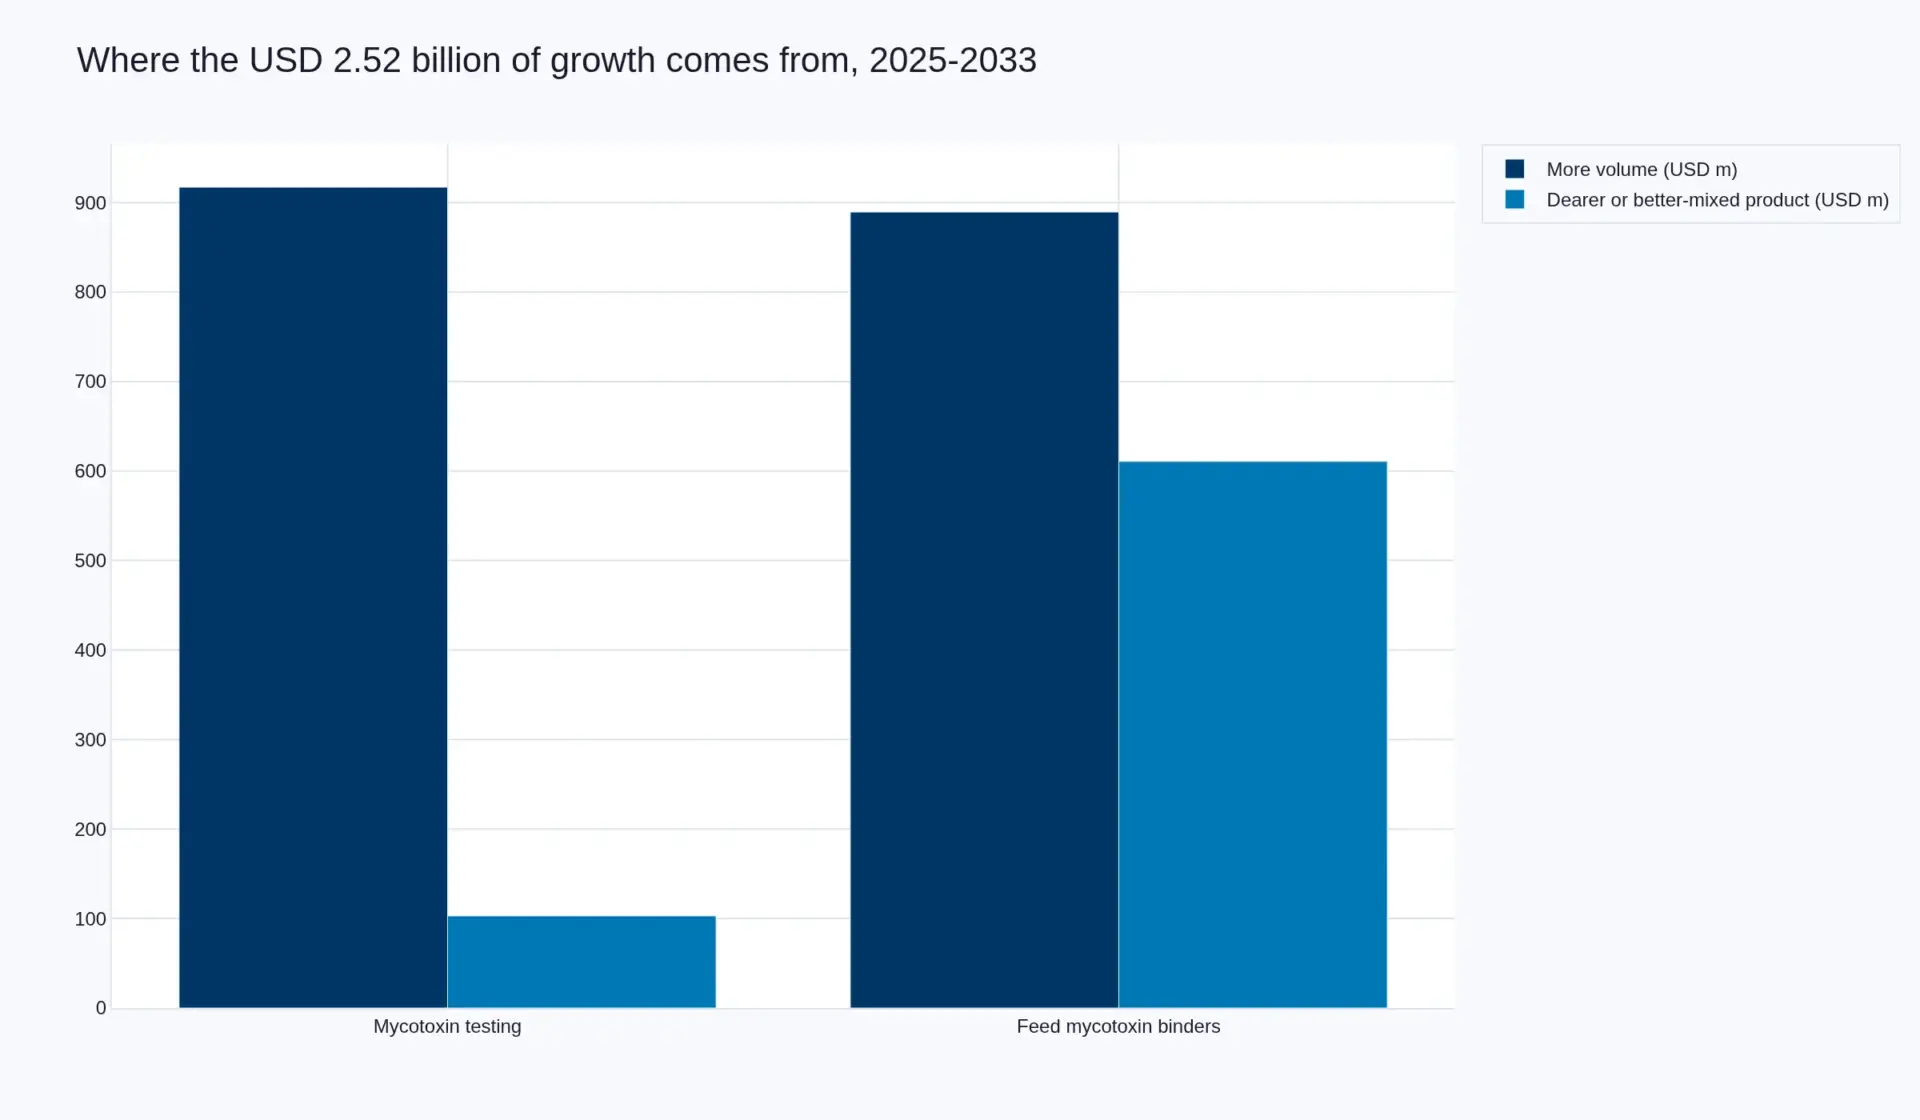
Of the USD 2.52 billion added, USD 1.81 billion (71.7 per cent) is more volume and USD 0.71 billion (28.3 per cent) is price and mix. That combined figure conceals the finding, because the two halves are close to opposites. Testing is 89.9 per cent volume-led and 10.1 per cent price. Binders are 59.3 per cent volume-led and 40.7 per cent price and mix.
Why one half is a commodity and the other has pricing power
Mycotoxin testing is pinned to a published method. A result survives a regulator, a customer specification or a court only if it derives from a validated procedure with a documented limit of detection, and the reference methods — liquid chromatography with fluorescence or mass-spectrometric detection for confirmation, enzyme-linked immunosorbent assay or lateral flow for screening — are public and shared. Where the method is shared, the reagent is comparable; where the reagent is comparable, the price converges. A buyer can move a plate from one supplier to another without revalidating an entire laboratory system. The consequence is visible in the arithmetic: the price of a test barely moves in eight years.
The binder sits under no such discipline, and this is the report's least comfortable finding. Under Regulation (EC) No 1831/2003 a mycotoxin binder is authorised as a technological additive, in the functional group formally described as substances for reduction of the contamination of feed by mycotoxins. In 2013 the European Food Safety Authority assessed a bentonite-and-sepolite preparation for use in all animal species and concluded that it was safe up to 20,000 mg/kg of complete feed — and that there was insufficient evidence to conclude on its efficacy. Safety was established. The claim was not. That opinion concerns one product, but it describes the structure of the category: the market sells a reduction in risk that the authorisation does not certify.
A buyer who cannot verify efficacy buys on trust, and trust is where margin lives. That is why a tonne of binder rises 2.54 per cent a year while a test rises 0.54 per cent — and why the rise is concentrated in the shift away from raw clay toward yeast cell wall preparations and enzymatic biotransformers, where a supplier can make a claim it is willing to defend in a sales conversation and support with trial data from the customer's own barn. Where the method is free, the price is free with it. Where the claim is unfalsifiable, the claim is the product.
The regulatory level is a property of the species, not of the toxin
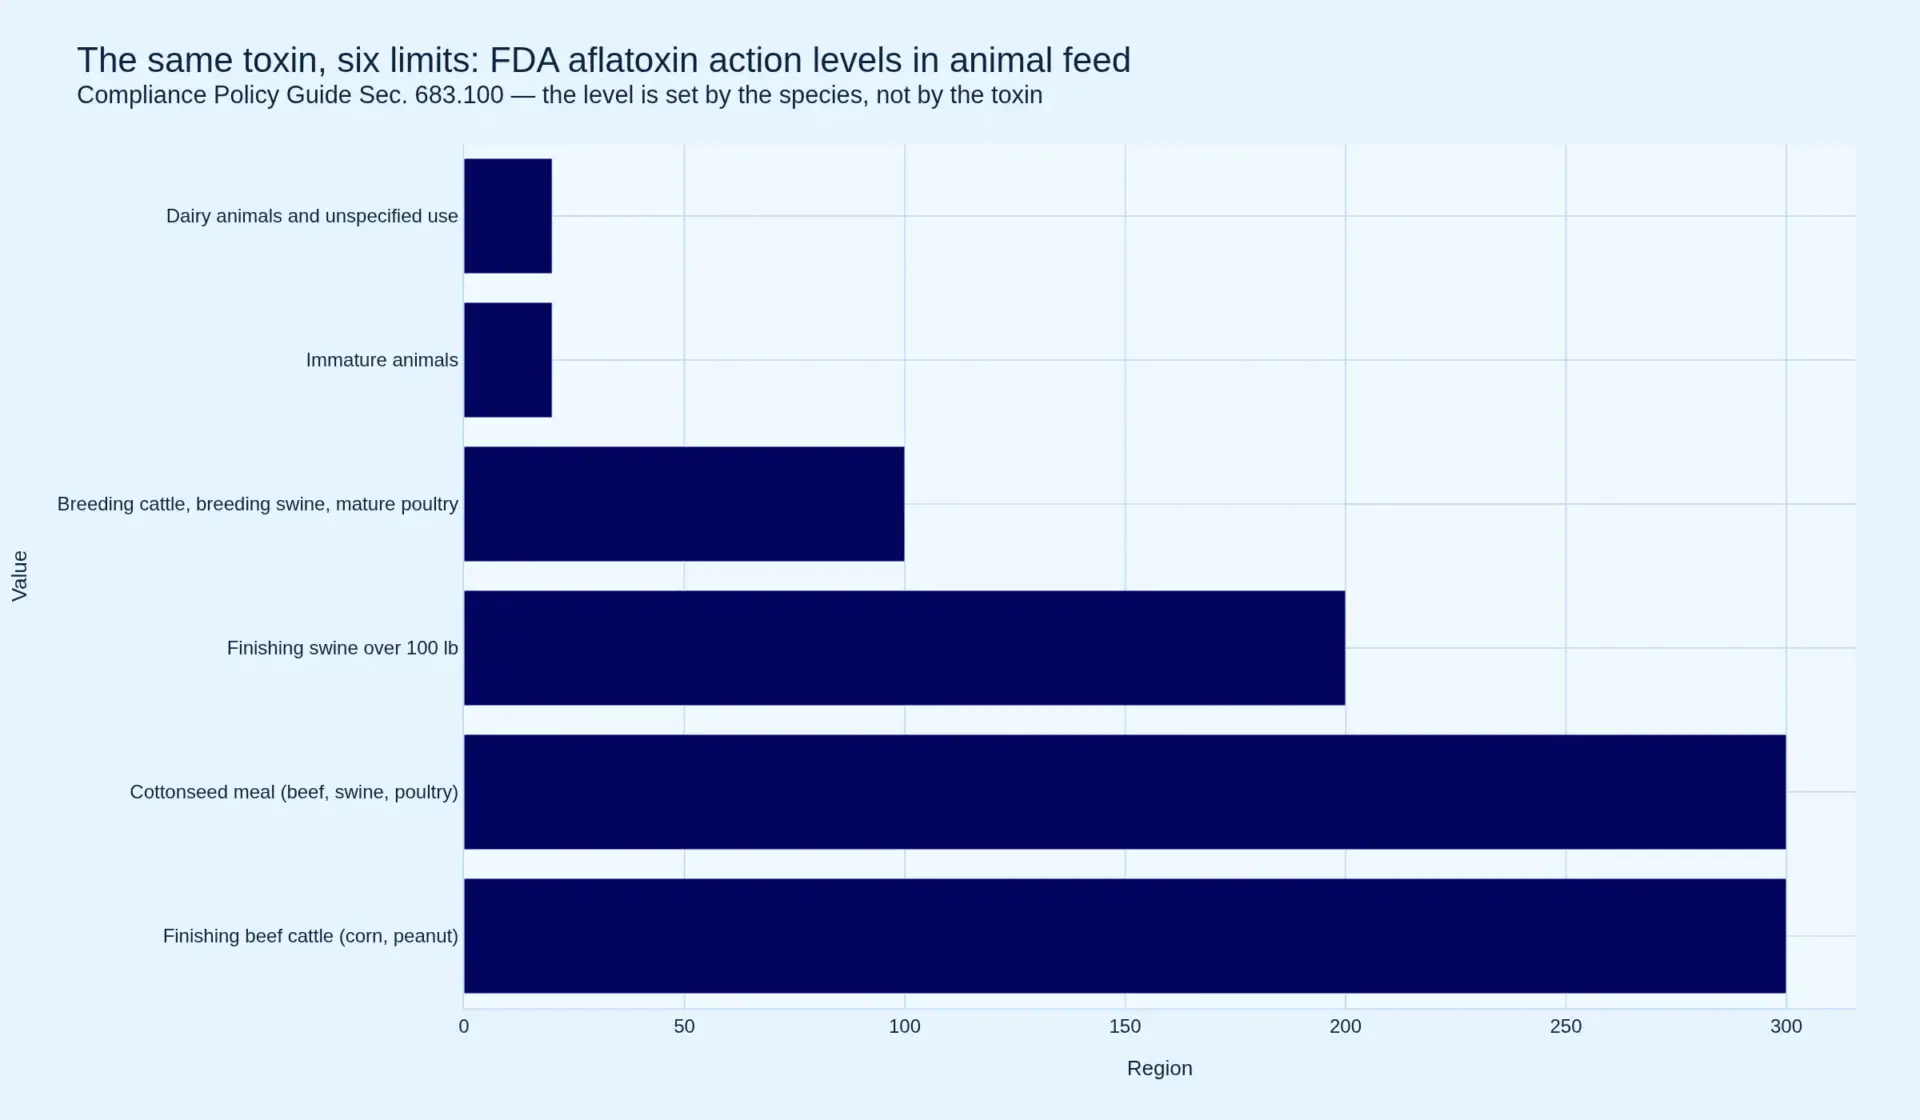
The demand engine in this market is not appetite. It is the shape of the limits. Under the US FDA's Compliance Policy Guide Sec. 683.100, aflatoxin in corn and peanut products intended for finishing beef cattle is permitted to 300 parts per billion. The same toxin, in corn and peanut products intended for dairy animals or for uses not specified, is permitted to 20 parts per billion. That is a fifteen-fold spread, and nothing about the molecule changes between the two rows. The limit is set by what the animal does with the feed, and what the human then does with the animal.
Three consequences follow, and they run through everything after this. First, testing frequency is set by destination rather than by contamination risk, so a single lot routed to two customers needs two results and may need two methods. Second, the binder requirement is set by the same species logic — a dairy ration at 20 ppb has almost no headroom, which is why dairy and breeding stock are dosed prophylactically rather than on evidence of a problem in that particular batch. Third, and commercially the most important: a batch that fails a food limit does not disappear. It becomes feed.
COCERAL, presenting its mycotoxin management report to an EFSA standing group in June 2025, described precisely that mechanism. Its members expect aflatoxins and ochratoxins in corn, deoxynivalenol and the T-2 and HT-2 toxins in all cereals, and zearalenone and Alternaria toxins in oilseeds to become more prevalent over the next decade. Its stated future constraint is that a growing share of grain currently fit for human consumption will have to be declassified to feed as food limits are missed — and that in the worst case some corn will not meet the limits set for feed material either.
The test is the gate and the binder is the toll
That is the mechanism this report is built on, and it is why the two halves belong in one document even though their owner has decided they belong in two. The test is the gate: it decides whether a lot may be sold as food, must be downgraded, or must be rejected. The binder is the toll: it is what makes the downgraded lot usable. Every declassification event creates binder demand, and every tightening of a feed limit raises the dose required to clear it. The relationship is sequential, not substitutive — which is a very different thing from two adjacent markets that happen to share a customer.
The climate record makes that sequence more frequent rather than less. The European Environment Agency's March 2025 assessment found Europe warming at twice the global average, and under a +2°C scenario aflatoxin contamination in maize rises particularly in Spain, Italy and the Balkans; under +5°C the risk widens northward as southern extremes begin to suppress the fungus. The agency's own framing is that the highest risk sits in developed countries with moderate climates — which is to say, in markets where testing and binders are already routine, and where each new positive result is a purchase order for both.
The two reports published immediately before this one fix the boundary conditions. Global Food Safety Testing found a market in which 74.9 per cent of growth was more tests rather than dearer ones. Global Food Allergen Testing & Control found a test that gets cheaper in real terms because no statutory reference method exists to anchor its price. Mycotoxins sit between the two: a standardised method, so a flat price, and a limit that moves often enough to keep the volume line growing. This report is the third panel of that triptych and sits in the Food Safety & Quality Testing segment.
Table of Contents
- One company bought both halves in 2020, and is selling them separately in 2026
- Market snapshot: four numbers that decide this report
- Why one half is a commodity and the other has pricing power
- The regulatory level is a property of the species, not of the toxin
- The value chain from field sample to feed mill decision
- Sampling is the error term nobody prices
- In-house screening against outsourced confirmation
- The method stack: ELISA, lateral flow, HPLC and LC-MS/MS
- Binder chemistry: clays, yeast cell walls and biotransformers
- Competitive landscape: five businesses with a disclosed line
- Margin is not value capture, and the binder proves it
- The amendment cadence and what it costs a feed mill
- EUR 980 million in, EUR 2.2 billion out
- Market risk and the sensitivity that would break this forecast
- Sources, methodology and the limits of this build
Competitive Landscape
Competitive landscape: five businesses with a disclosed line
Ten companies matter in this market, and almost none of them can be compared using a number from a financial statement. That is the defining feature of the competitive landscape. On the testing side, the European inspection majors report food testing inside divisions that also contain pharma, cosmetics, grain inspection and industrial work. On the mitigation side, the additive companies report animal nutrition as a whole. Of the ten, exactly one discloses a segment close enough to read: Neogen’s Food Safety line. The rest of this chapter is therefore about business models, because business models are what the disclosures actually support.
Two models on the measurement side
Eurofins Scientific is the purest expression of the network model: a very large number of accredited laboratories, built largely by acquisition, selling testing as a service. The model’s advantage is coverage — a customer with plants in six countries wants one contract — and its discipline is utilisation, because a laboratory is a fixed-cost asset and the marginal cost of the next sample is low. Its constraint is that service work is priced against other service work, which is why the group grows by adding capacity and geography rather than by raising price.
SGS runs the same model with a different portfolio balance, and its 2025 disclosure is the most useful single data point in the testing half of this report: Health and Nutrition grew 7.3 per cent organically, with the Food business described as double-digit, while the group as a whole carried a currency drag. That is a faster rate than this report’s 7.00 per cent testing forecast, and it is the strongest evidence that volume in testing is not slowing.
The second model sells the kit rather than the result. Neogen Corporation sells tests, reagents and instruments to laboratories, mills and processors — the consumable layer — and its Food Safety segment grew 0.5 per cent in the same period on a 50.3 per cent adjusted gross margin. Read those two numbers together and you have the central competitive fact of this report: the highest margin in the market belongs to the business with the lowest growth, and the highest growth belongs to the business with the lowest margin. Margin is not value capture. The party selling the bundle collects the volume-led growth; the party selling the part does not.
Romer Labs sits on the same side as Neogen and illustrates the ownership question that opens this report: it was acquired inside Erber Group in 2020 as the diagnostic half of a diagnosis-and-treatment combination, and it is among the assets now moving to new ownership. Bruker occupies the layer beneath both: it sells the mass spectrometry and spectroscopy platforms that confirmation laboratories run, which means it earns from the capital purchase and from the service contract rather than from the per-test price. That position is structurally protected — an instrument installed is a decade of consumables and service — and it is why instrument makers can hold value in a market where the test itself is commoditised.
Three models on the mitigation side
dsm-firmenich built the only franchise in this market that spanned both halves. Biomin, acquired with Romer Labs in 2020, is the largest dedicated mycotoxin risk-management business in the world by most reckonings, and its model is advisory as much as chemical: the binder ships with a risk assessment, a recommended programme and a person who will visit the mill. That advisory layer is the reason the price holds. It is also the layer that is hardest to transfer when a business changes owner, and the market should watch whether the separation announced in February 2026 keeps it intact.
Alltech and Kemin Industries are the specialists: privately held, feed-additive-focused, and selling mycotoxin management as one line inside a broader portfolio of gut health, enzymes, antioxidants and pigments. Both compete on the strength of a technical sales force and on trial data generated at customer sites, which is exactly the currency this category trades in. Neither discloses a mycotoxin line, and neither is likely to.
Nutreco represents the integrated model, and it is the one most often overlooked in analyses of this market. Through Trouw Nutrition it sells premixes and feed additives including mycotoxin binders, and through Skretting it owns one of the largest aquafeed businesses in the world. That combination means Nutreco can capture the binder margin at the premix stage and the formulation decision at the feed stage — and it means the company is simultaneously a supplier to, and a competitor of, the independent binder producers.
Novonesis is the hinge between the two chemistries. Its June 2025 purchase of the remaining 50 per cent of the Feed Enzymes Alliance from dsm-firmenich for EUR 1.5 billion put the biological end of feed additive technology under one owner, and biologicals are where the biotransformer products sit — the enzymes that act on the toxins clays cannot bind. If the binder mix continues shifting toward biotransformers, as this report’s price assumption requires, Novonesis is the best-positioned company in the category.
Where the competitive pressure actually falls
Three observations follow from the structure, and none of them is visible in a market share table.
First, the two halves compete for the same budget line without competing for the same purchase order. A mill that has decided to bind prophylactically has materially reduced its reason to confirm by instrument, and a mill that screens every load has a documented basis for binding less. The Food Safety Testing report found the same tension between test volume and test price; here it appears as a tension between two products sold to one buyer.
Second, the additive side is consolidating around biologicals and the testing side around capacity. That is a different logic in each half, and it is why the ownership question is genuinely open rather than a matter of presentation. Global Food Allergen Testing & Control reached the same conclusion from the opposite direction: where no reference method anchors a price, the value migrates to whoever can make the most defensible claim.
Third, there is an unclaimed position between the halves, and it is the one Pheonix would watch. Nobody in this market currently sells the mill a single decision — here is your grain’s risk profile, here is the test that proves it, here is the binder and the dose — on a subscription rather than a per-unit basis. The data required to do it exists at both ends: the laboratory holds the results and the additive supplier holds the outcomes. The company that joins them owns the customer relationship, and it does not have to own either asset. Feed Phosphates is a useful comparison here: an additive whose demand is set by the animal’s ability to digest something else, where the winning supplier sells a formulation rather than a commodity, and where the price line has behaved very differently from this one.
The honest state of the disclosure
Four of these ten companies carry a number in this report, and the other six are named without one. That is not an omission to be corrected by estimation at company level — it is the market’s actual reporting behaviour, and pretending otherwise would produce a table whose precision exceeded its evidence. Where a figure is attributed to a company in this report, it comes from that company’s own disclosure and is dated. Where no figure appears, none was available at the segment level from a source this report was prepared to rely on.
Value Chain
The value chain from field sample to feed mill decision
This market has two branches, and they converge on a single decision taken by one person — usually a quality manager or a mill nutritionist — with a lot of grain in front of them and a specification to meet. Understanding where money is captured requires following both branches to that desk.
Branch one: the sample that decides the lot
Contamination is not uniform. Mycotoxin in a silo, a truck or a railcar is distributed in pockets, because the fungi that produce it grow in patches and because a hot spot in store concentrates the problem rather than spreading it. Every testing method in commercial use therefore begins with a sampling plan, not an assay: a defined number of incremental samples taken across the lot, aggregated, reduced by a mill or riffle divider to a laboratory portion, then sub-sampled again for extraction. Each reduction is an opportunity to lose the very particle that carries the toxin.
From there the chain runs through extraction and clean-up, then either a screening assay or straight to an instrument. Screening is an enzyme-linked immunosorbent assay or a lateral flow strip: fast, cheap, usable at intake by a person who is not an analyst, and semi-quantitative at best. Confirmation is chromatography — high-performance liquid chromatography with fluorescence detection for aflatoxin after derivatisation, or liquid chromatography with tandem mass spectrometry for multi-analyte work — and it is slower, dearer and requires a laboratory that maintains accreditation for the method. The output is a certificate, and in most commercial relationships the certificate, not the result, is the product: it is what allows a lot to change hands.
Branch two: the additive that makes the lot usable
The binder branch starts in a mine, not a laboratory. Mineral adsorbents are bentonite, montmorillonite, sepiolite and zeolite — clays with a layered or cage structure that traps molecules — and the first stage of the chain is extraction, drying and activation, because raw clay is not a feed additive until its surface has been prepared and its dust controlled. The second stage is formulation: blending clay with yeast cell wall fractions rich in beta-glucans and mannans, with enzymes or microbial cultures that transform toxins rather than adsorb them, and with carriers and flow agents that let the product dose evenly through a mill’s micro-ingredient system.
That formulation step is where the chain’s value sits, and it is deliberately complicated. A single binder seldom covers a single toxin, so a supplier sells a programme — a different blend for poultry, for swine, for dairy, for a wet harvest year against a dry one — and the complexity of the programme is exactly what makes it hard to compare across suppliers. The product ships as a bagged or bulk premix, is included at a dose measured in kilograms per tonne of finished feed, and is either bought through a distributor or specified by the integrator and supplied to its contracted mills. In the second case the decision-maker is a nutritionist working for a company that owns the animals, the feed and the slaughterhouse, and the binder is a line item inside a formulation matrix rather than a purchase in its own right.
At mill level the two branches meet in a three-way choice that is repeated whenever a lot arrives or a spec changes: screen it, bind it, or divert it. Screening tells you which of the other two you need. Binding lets you keep the lot. Diversion — to a lower-value species, or to a different customer, or back to the seller — is the option nobody wants and the one most often taken by default because it requires no purchase at all. That default is the most under-appreciated constraint on this market: doing nothing is free at the moment of decision, and both the test and the binder have to be justified against doing nothing.
What the two cost against each other
Here the arithmetic becomes uncomfortable for the testing side. At the 2025 realised values in this report, one mycotoxin test costs USD 14.79 and a tonne of binder costs USD 5,812 — which, at the dosing rates typical of the category, works out to roughly USD 5.81 of binder per tonne of finished feed. For the price of a single test, a mill can dose binder into about 2.5 tonnes of feed.
That asymmetry explains more about the relative growth rates than any regulatory argument. The test is a discrete, visible, per-lot cost that produces a document; the binder is a per-tonne premium that is small against the value of the feed and can be written into a formulation without anyone approving a purchase order for it. A quality manager who binds prophylactically never has to have the argument about what the result would have been. The consequence is that binder volume does not require test volume to grow — which is why tonnage grows at 5.01 per cent while tests grow at 6.43 per cent, and why the money on the binder side grows faster than either.
Sampling is the error term nobody prices
Every published maximum level in this market is a concentration, and every concentration is a statement about a sample. A lot that tests at 18 parts per billion against a 20 ppb limit has not been shown to comply; it has been shown to have complied in the increment that reached the laboratory. Sampling plans exist to control that risk — Codex and the European Union both specify incremental sampling for mycotoxins in cereals — but the plan is a fixed cost that no supplier invoices and no buyer audits, and it is the largest single source of variance in the result.
This is the step where Pheonix’s interview programme found the widest gap between what the literature says and what the mill does. The literature treats sampling as the dominant error term. The mill treats it as a job somebody does at the intake pit before the truck tips. In practice the number of increments actually taken correlates with how much time the driver is prepared to wait, and the mills that have solved it have done so by moving the sample point upstream — at the country elevator, or at the port, or in the contract — rather than by improving the assay. Brazil Animal Feed and Latin America Animal Feed both describe feed systems in which the intake decision is concentrated at a small number of very large mills, which is precisely the structure that makes upstream sampling economic.
In-house screening against outsourced confirmation
The commercial split between in-house and outsourced work is stable and predictable. Mills and elevators keep screening in house because the value of a rapid result is in the ten minutes before the truck leaves; they outsource confirmation because accreditation, instrument time and the competence to defend a result in a dispute are not worth owning at a single site. Laboratories therefore capture the confirmation work, and the confirmation work is where multi-analyte methods have changed the cost structure — which is the subject of the next chapter.
The channel consequence is worth stating plainly. Because screening is bought by the mill and confirmation is bought by the lab, the two halves of the testing market have different buyers, different procurement cycles and different price sensitivity. A kit sold to a mill competes on speed and simplicity. A service sold to a lab competes on turnaround, accreditation scope and price per analyte. Neither competes on the same terms, which is one reason the TIC majors and the kit makers can occupy the same market without destroying each other’s margins.
Investment Activity
EUR 980 million in, EUR 2.2 billion out
The most informative transaction record in this market belongs to a single company, and it spans six years. Read as a sequence rather than as isolated deals, it is the best available evidence about what the owners of this market believe the two halves are worth.
2020: buying the combination
Royal DSM agreed to acquire Erber Group on 12 June 2020 and completed on 2 October 2020 at an enterprise value of EUR 980 million, excluding two smaller units. The assets were Biomin — mycotoxin risk management and gut health — and Romer Labs — food and feed safety diagnostics. DSM’s disclosure in its 2020 annual report records that the business, consolidated from the fourth quarter of 2019, generated EUR 81 million of sales and EUR 18 million of Adjusted EBITDA in its first quarter within the group.
That single-quarter disclosure is the only near-clean financial data point the public record offers on a combined diagnosis-and-treatment business, and it must be handled carefully. If the quarter were representative, it would annualise to roughly EUR 324 million of sales and EUR 72 million of Adjusted EBITDA — implying about 3.0 times sales and 13.6 times EBITDA at the EUR 980 million price. Pheonix does not present those multiples as established. One quarter, the first under new ownership, is not a reliable run rate, and the annualisation is arithmetic rather than evidence. The disclosure is used here for one purpose only: to establish that the combination was bought at a substantial multiple of the earnings the two businesses were then generating, which is what a buyer pays when it believes it is purchasing a franchise rather than a portfolio.
2025: selling the enzymes
The unwinding began with the biologicals. On 2 June 2025 dsm-firmenich completed the sale of its 50 per cent stake in the Feed Enzymes Alliance to Novonesis for EUR 1.5 billion, receiving about EUR 1.4 billion net of transaction costs. The strategic reading is straightforward: phytase and xylanase are the highest-volume, most technically defensible products in feed additives, and they went to the company best equipped to make them at scale. Novonesis paid EUR 1.5 billion for half of an alliance it already part-owned, which is a price that says more about the value of biologicals in feed than any statement in this report.
2026: selling the rest
On 9 February 2026 dsm-firmenich agreed to sell its remaining Animal Nutrition & Health business to CVC Capital Partners at an enterprise value of about EUR 2.2 billion, including an earnout of up to EUR 500 million. The business represented approximately EUR 3.5 billion of net sales and around EUR 0.5 billion of Adjusted EBITDA in 2025. It will be divided into two standalone companies based at Kaiseraugst — a Solutions Company covering performance solutions, premix and precision services, and an Essential Products Company covering vitamins, carotenoids and aroma ingredients — with dsm-firmenich retaining a 20 per cent equity stake in each alongside CVC’s 80 per cent.
The tempting calculation is a multiple, and it should be resisted. The EUR 2.2 billion price applies to a residual perimeter — after the Feed Enzymes Alliance stake was sold, before the two new companies are separated — so dividing it by the group-level EUR 3.5 billion of ANH sales would compare a price for part of a business with the revenue of all of it. What can be said without overreach is this: the entire animal nutrition complex, bought into over a decade and assembled at EUR 980 million for its specialty core in 2020, was exited for EUR 1.5 billion plus EUR 2.2 billion, against roughly EUR 3.5 billion of sales. A sophisticated owner decided that the whole was worth slightly less than one times its revenue, and it made that decision while the underlying market was growing at more than seven per cent.
What the rest of the field is paying
The testing side transacts on a different basis. Eurofins has been the most active consolidator in food and feed testing, and its disclosed programme for one recent period — 40 acquisitions for EUR 261 million, against EUR 286 million of pro-forma revenue — implies about 0.91 times revenue and 13.7 times adjusted EBITDA. That is the price of capacity. A laboratory network buys another laboratory network at close to one times sales because the asset is accredited space, trained people and customer contracts, and none of those is defensible on its own.
SGS took the same route into a specific niche with its January 2026 acquisition of Murray-Brown Laboratories, a nutraceutical testing business — a purchase that makes sense only if read alongside its Health and Nutrition growth: buy capability in an adjacency where the customer is already sending samples. Neogen moved in the opposite direction, agreeing to sell its Genomics business to Zoetis for USD 160 million, which is what a company does when it has decided to concentrate on the consumable side of food safety rather than on animal genetics.
Three things the transaction record establishes
First, buyers pay for biologicals and for capacity, and almost nothing for kits. The two highest-value transfers in this market — Novonesis for the enzymes stake, CVC for the additive business — are both about owned technology or owned relationships. The lowest multiple in the set is Eurofins buying accredited laboratory revenue at under one times sales. A kit is a product; a claim, a strain or a customer relationship is an asset.
Second, the diagnosis-and-treatment thesis was genuinely tested and is now being retested by default. DSM’s 2020 purchase asserted that selling the test and selling the treatment to the same buyer is worth more than selling them separately. The 2026 sale does not assert the opposite — private capital buying a portfolio at this valuation is a judgement about a conglomerate’s focus and about the earnout structure, not a verdict on market structure — but the market will now find out whether the combination was worth EUR 980 million or whether the value was in the parts. That is an unusually clean natural experiment, and this report’s forecast does not depend on its outcome.
Third, capital intensity in this market is medium and the returns sit in the wrong place for a commodity. A clay activation plant, an accredited laboratory and an instrument fleet are all real capital, and none of them generates a differentiated return. The returns in this market come from formulation IP, from trial data, and from the advisory relationship that turns a binder into a recommendation. That is why the deal activity in binders is strategic and the deal activity in testing is arithmetic.
Where the next transaction is
The pipeline this build would watch is narrow and specific. Biotransformer intellectual property is the most likely target, because it is the only part of the mitigation side that acts on the toxins clays cannot bind and because the regulatory pathway for a feed additive authorisation is a moat once cleared. On-site quantitative capability is the second: the gap between a lateral flow strip and a defensible number is a small instrument, and whoever closes it moves the testing purchase from the laboratory to the intake pit. Digital risk scoring embedded in formulation software is the third, and the least capital-intensive — a software position that sits between the laboratory result and the binder dose would capture a toll on both, which is the one structural gap identified anywhere in this report.
Technology & Innovation
The method stack: ELISA, lateral flow, HPLC and LC-MS/MS
Four technologies carry almost all commercial mycotoxin testing, and their economics are not interchangeable. Thin-layer chromatography, the historical method, has effectively exited commercial use outside a few reference settings. What remains is a stack in which each layer does a different job at a different price.
Enzyme-linked immunosorbent assay is the workhorse of quantitative screening. An antibody raised against a specific toxin competes with the toxin in the sample for a fixed number of binding sites, and the colour that develops is inversely proportional to the concentration. It is cheap per well, runs in plates of 48 or 96, and is quantitative enough to be defensible if the method has been validated for the matrix. Its weakness is specificity: cross-reactivity with structurally similar compounds produces false positives, and matrix effects in feed — which is a chemically aggressive sample compared with grain — produce both false positives and false negatives.
Lateral flow is the same immunochemistry reformatted into a strip, and it is the technology that put mycotoxin testing into the intake pit. It is fast, requires no laboratory, and is qualitative or semi-quantitative. It is also where the instrument-plus-consumable model appears in this market: a reader that quantifies the strip’s line intensity is sold once and then earns on cartridges for its working life. That model is well understood in diagnostics, and it is the clearest example in this report of a business that earns from a recurring consumable rather than from a test.
High-performance liquid chromatography with fluorescence detection remains the reference confirmatory method for aflatoxins in most regulatory settings, typically with post-column derivatisation to make the toxin fluoresce. It is precise, it is slow, and it is expensive per sample because instrument time is expensive and the method requires a trained analyst and a validated clean-up step.
Liquid chromatography with tandem mass spectrometry is the method that changed the structure of the laboratory business. A single injection can resolve and quantify dozens of mycotoxins simultaneously — aflatoxins, ochratoxin A, fumonisins, trichothecenes including deoxynivalenol and the T-2 and HT-2 toxins, zearalenone, ergot alkaloids and emerging toxins such as the Alternaria group — at detection limits well below any regulatory level in force.
The economics of a multi-analyte method
This is where the price of a test gets pinned. When one injection returns twenty analytes, the marginal cost of the twentieth result is close to zero, and laboratories price accordingly: a multi-mycotoxin panel sells for a multiple of a single-analyte test that is far smaller than the analyte count would suggest. The method also removes the need to choose which toxin to look for, which means the buyer’s decision changes from whether to test to how many analytes to include — a decision that almost always resolves upward once the price per analyte is low.
The strategic consequence is counter-intuitive and it is central to this report’s forecast. Detection capability is no longer the binding constraint on this market. Instruments reach sub-parts-per-billion routinely against limits measured in tens or hundreds of parts per billion. The constraint has moved to sampling — whether the increment in the laboratory represents the lot — and to interpretation — whether a result near a limit means anything. Neither of those is solved by a better instrument, and neither of them generates instrument revenue. That is why the testing half of this market grows on volume at 6.43 per cent while its realised price creeps up 0.54 per cent a year: the technology has outrun the problem it was bought to solve, and it is now being bought as a commodity service with a certificate attached.
Adjacent capability is arriving anyway. Near-infrared spectroscopy is being applied to intake screening, where the prize is a result in seconds without reagents; on-site quantitative readers are extending lateral flow upward into territory that used to require a plate reader; and formulation software now ingests risk scores so that a mill can adjust a ration before the laboratory result arrives. None of these has yet moved the aggregate price line, and the report does not model them as doing so within the forecast window. They are named here because they are the most likely source of a downside surprise to the price assumption in the testing half.
Binder chemistry: clays, yeast cell walls and biotransformers
The chemistry on the mitigation side is older and, commercially, more interesting. Three families do the work, and they do not do the same work.
Mineral adsorbents — bentonite and other montmorillonite clays, sepiolite, zeolite — bind toxins physically. The mechanism depends on the geometry of the molecule: aflatoxin B1 is planar and relatively polar, so it fits the interlayer space of a smectite clay and is held there. Deoxynivalenol and zearalenone are less planar and less favourably shaped, which is why clays that perform well against aflatoxin perform poorly against them. This is not a formulation weakness that better marketing can fix; it is a property of the molecules. One clay cannot cover the toxin spectrum, which is why the category sells programmes rather than products.
Organic adsorbents — yeast cell wall fractions, principally beta-glucans and mannans — bind through a different surface chemistry and are effective against a somewhat different range, and they have the commercial advantage of being a fermentation product with a defensible supply chain and a story a nutritionist can repeat to a customer.
Biotransformers are the newest and the most expensive. Rather than holding a toxin, they change it: fumonisin esterase hydrolyses fumonisins into less toxic metabolites, and microbial or enzymatic de-epoxidation attacks the trichothecene ring that carries the toxicity of deoxynivalenol and the T-2 toxins. These products target exactly the toxins that clays handle badly, and they are sold on a mechanism rather than on a surface.
Why the chemistry explains the price
Put the regulators’ efficacy finding together with this chemistry and the pricing behaviour in this report stops being mysterious. No single agent covers the spectrum of toxins that arrive in a bad harvest; the correct answer is a blend, segmented by species and by the toxin profile expected in a given region and season; and the performance of that blend cannot be certified by any authority, because the authorisation establishes safety rather than efficacy. A supplier therefore competes by formulating and advising — by knowing which blend to recommend for this customer’s grain, this species and this year — and formulation and advice are precisely the kinds of offer that carry a margin, because they are not comparable line by line on a specification sheet.
That is the mechanism behind the 2.54 per cent annual rise in binder price and the 40.7 per cent price and mix contribution to binder growth. It is not that binders are becoming scarcer or that raw materials are inflating. It is that the mix is moving from clay toward formulated blends and biotransformers, and the buyer is paying for a judgement about risk rather than for a commodity. Patent activity in the category is accordingly moderate rather than high — the underlying minerals and organisms are old, and the novelty sits in formulation, delivery and the data used to support a recommendation.
The one thing chemistry cannot do is settle the argument the buyer actually cares about, which is whether the product works in their barn. That question is answered in this market by trial data, by reference sites and by advisory relationships, and it is the reason the next two chapters matter: the competitive landscape is a landscape of people who can make that argument credibly, and the regulatory landscape determines how often they get to make it.
Market Risk
Market risk and the sensitivity that would break this forecast
This forecast rests on a specific claim about where the money comes from, so the honest way to test it is to remove that claim and see what is left.
The sensitivity that matters
Of the USD 2.52 billion added between 2025 and 2033, USD 0.71 billion is price and mix. Remove it entirely — hold every realised price at its 2025 level and let only volume grow — and the market reaches USD 5.09 billion in 2033 rather than USD 5.80 billion, a compound rate of 5.64 per cent instead of 7.39. The entire price story is worth about 175 basis points of compound growth.
The two halves are not equally sensitive, and that asymmetry is the more useful test. Hold only the binder price flat and the market reaches USD 5.19 billion at 5.90 per cent — most of the gap. Hold only the testing price flat and it reaches USD 5.70 billion at 7.15 per cent, barely a dent. In other words: if the binder mix stops shifting toward formulated blends and biotransformers, this forecast is wrong by a wide margin; if the price of a test stops rising, almost nothing happens.
Everything that follows should be read against that hierarchy.
The five risks that could move the number
1. An efficacy standard for binders. This is the largest single downside and it is structural rather than cyclical. The mitigation half’s pricing power depends on the absence of a certified measure of effect, and the regulatory record examined in this build contains no signal that one is coming. If a reference method and certified materials were established — even in one major jurisdiction — products would become comparable, the differentiation premium would compress, and the price contribution would converge toward the testing side’s 10 per cent rather than staying near 41. The report does not model this, but it is named here because it is the assumption on which the forecast most depends.
2. Harvest quality. Binder tonnage tracks perceived risk, and perceived risk tracks the weather. A run of dry, hot years in the wrong places reduces fungal pressure and reduces the reason to dose; a wet harvest in a major growing region does the opposite and can move a single season’s volume materially. The EEA’s assessment cuts both ways here: under a +2°C scenario aflatoxin in maize rises in southern Europe, but under +5°C the southern risk may fall as extreme heat suppresses the fungus while the risk band widens northward. The direction is toward more contamination in aggregate, but the variance around that direction is large enough that any single year can look like a trend.
3. Upstream substitution. Sorting and cleaning remove contaminated fractions before anyone has to bind them. Optical sorting, density separation and the increasingly routine practice of discarding the light, damaged and broken fraction at the elevator all reduce the toxin load that reaches the mill — and therefore reduce the dose required. This is a genuine and under-modelled substitute for binding, it is capital rather than consumable, and it is bought by the same large elevators that the sampling discussion in the value-chain chapter identifies as the place where testing decisions are increasingly concentrated.
4. Buyer consolidation. Every trend in this market runs toward fewer, larger buyers: fewer and larger mills, more integration between feed and livestock, more centralised procurement. A large integrator buys binder for millions of tonnes and negotiates accordingly, and it will trade a programme for a price. The pressure this creates is on the additive side specifically, where the whole pricing argument rests on advisory differentiation that a centralised procurement function is designed to commoditise.
5. Ownership fragmentation. The separation of Animal Nutrition & Health into two standalone companies, with a private-equity majority holder and an earnout, changes incentives. An earnout rewards near-term earnings, and a portfolio carried by a sponsor is managed for cash and for exit rather than for the slow construction of an advisory franchise. The combination of diagnosis and treatment that this report argues is the market’s real structure is, for the moment, owned by two different management teams with two different balance sheets. That could sharpen focus on each half — or it could remove the one participant able to sell the whole decision.
What would have to be true
For 7.39 per cent to hold, four things must remain true, and they are stated so that a reader can check them rather than accept them.
- The amendment cadence in major jurisdictions continues at roughly its recent rate, so method revalidation and specification resets keep creating non-discretionary testing demand.
- The binder mix keeps shifting toward formulated blends and biotransformers, so the realised price per tonne keeps rising at about 2.5 per cent a year.
- No certified efficacy standard for binders is introduced in a major market.
- Global trade in grain and oilseeds keeps growing, because testing volume is a function of lots changing hands and crossing borders far more than it is a function of consumption.
Three of the four are extensions of trends already visible in the disclosure. The third is an assumption, not a trend, and it is the one a sceptical reader should attack first.
Sources, methodology and the limits of this build
This report follows the Pheonix 70/30 convention: roughly 70 per cent of the evidential weight is secondary and roughly 30 per cent is Pheonix’s own analytical contribution. The 30 per cent consists of the market construct, the volume and price decomposition, the species-differentiation reading of the action levels, the sequence model connecting food-limit failure to feed-side binder demand, the pricing-power analysis built on the EFSA efficacy finding, and an interview programme of open-ended conversations and conference-floor discussions with feed additive suppliers, laboratory managers, mill nutritionists and quality managers during the build.
Editorial sources relied on in this build, by name:
- US Food and Drug Administration, Compliance Policy Guide Sec. 683.100, Action Levels for Aflatoxins in Animal Food (revised March 2019), and Guidance for Industry: Action Levels for Poisonous or Deleterious Substances in Human Food and Animal Feed (August 2000), for all action levels cited, including aflatoxin M1 in milk at 0.5 ppb.
- European Food Safety Authority, FEEDAP Panel, Scientific Opinion on the safety and efficacy of a preparation of bentonite-and-sepolite (Toxfin Dry) as feed additive for all species, EFSA Journal 2013;11(4):3179, for the 20,000 mg/kg safe inclusion and the finding of insufficient evidence on efficacy.
- European Environment Agency, Mycotoxin exposure in a changing European climate (March 2025), for the warming scenarios and the geographic shift in aflatoxin risk in maize.
- COCERAL mycotoxin management report, presented to an EFSA standing group on emerging risks, 5 June 2025, for member expectations on prevalence and on the declassification of food-grade grain to feed.
- Regulation (EC) No 1831/2003 on additives for use in animal nutrition, for the technological additive category and the functional group covering substances for reduction of feed contamination by mycotoxins.
- Commission Regulation (EU) 2023/915 on maximum levels for certain contaminants in food, and Codex Alimentarius CXS 193-1995, for the European and international maximum level frameworks.
- dsm-firmenich Integrated Annual Report 2025, Animal Nutrition & Health; dsm-firmenich press release of 2 October 2020 on completion of the Erber Group acquisition; dsm-firmenich disclosure of 9 February 2026 on the sale to CVC Capital Partners; and the 2 June 2025 completion of the Feed Enzymes Alliance stake sale to Novonesis.
The limits, stated plainly.
- The value base is a construct. No company discloses a clean mycotoxin-testing line or a clean binder line. The 2025 base of USD 3.28 billion is built from disclosed revenue allocated to mycotoxins plus trade volumes for the unlisted tail, and the plausible range is USD 2.95 billion to USD 3.65 billion. The point estimate sits mid-range because the unlisted regional laboratory tail is large and poorly measured in both directions.
- The one disclosed line in the category is not clean either. Neogen’s Natural Toxins & Allergens line, at USD 77.5 million, bundles mycotoxins with allergens and is not split, so the only auditable number in this market cannot be audited to mycotoxins alone.
- The unit line is a construct and the price per test is arithmetically forced by it. The realised value of a test is derived from the value and unit lines; the price is an input, not an observation. The sensitivity above is published so that a reader can see what happens when it is wrong.
- Binder dosing rates come from the interview programme, not from a published source. The USD 5.81 of binder per tonne of finished feed and the 2.5-tonne comparison that follows from it are Pheonix’s own estimate of typical inclusion, and a mill dosing at a materially different rate would reach a different answer.
- Company website domains are asserted rather than fetched. The Wikidata identifiers for all ten companies were resolved live during this build; the corporate domains were not independently verified.
- The European amendment count is carried forward from the preceding report in this cluster rather than re-derived from the consolidated text in this build.
- No regional split is published. The model carries no geography, so this report makes no claim about Europe, North America or Asia-Pacific shares and does not infer one from secondary commentary.
- No interview count and no named interviewee. A small, non-random sample cannot carry a number, and presenting one would misrepresent its weight.
Two further limits inherited from the two reports that precede this one remain unresolved and should be read as standing caveats on the cluster: the segment page still resolves through a query-string form rather than its canonical path despite the canonical being correct, and, although the incremental graph queue has been flushed for this build, no full graph export has been run since these reports were published.
Regulatory Landscape
The amendment cadence and what it costs a feed mill
Two regulatory facts drive this market, and they push in opposite directions. One is that the limits change often, which grows the testing line. The other is that the efficacy of the mitigation product is not certified, which grows the price of the binder line. Understanding the market means keeping both in view, because a reader who sees only the first will forecast a testing business and a reader who sees only the second will forecast a supplement business.
Fact one: the limits move
In the European Union the operative instrument is Commission Regulation (EU) 2023/915 on maximum levels for certain contaminants in food, which replaced the previous consolidation and has been amended repeatedly since April 2023 — eleven times in under three years at the last count taken for this cluster, most recently by (EU) 2026/1825 of 29 July 2026. That is an amendment roughly every three to four months, and each one changes an annex that a laboratory method and a purchase specification are both written against.
Three months is faster than the revalidation cycle of a typical accredited method. The practical consequence, and it is the single most commercially important behavioural effect in this report, is that laboratories respond to amendment cadence by consolidating onto multi-analyte methods. Revalidating a single-analyte method is a fixed cost per method per site; revalidating one multi-analyte method that covers twenty toxins spreads that cost across twenty results. Regulatory churn therefore pushes the testing market toward the technology whose price per analyte is lowest — which is one of the mechanisms holding the realised test price at 0.54 per cent a year.
In the United States the structure is different and, for this report’s purposes, more revealing. There is no single consolidated contaminants regulation. Aflatoxin in animal feed is governed by action levels published in the FDA’s Compliance Policy Guide Sec. 683.100, and those levels are set by species and by class of animal rather than by commodity alone. The spread runs from 300 parts per billion for corn and peanut products intended for finishing beef cattle, and for cottonseed meal regardless of species, down to 200 for finishing swine over 100 pounds, 100 for breeding beef cattle, breeding swine and mature poultry, and 20 for immature animals, dairy animals and any use not specified. Aflatoxin M1 in milk carries a separate action level of 0.5 parts per billion — the carry-over metabolite, regulated where the consumer actually meets it.
Figure 3 in this report’s opening chapter plots those feed levels. The fifteen-fold range across a single molecule is the most useful regulatory fact in the market, because it explains a behaviour that looks irrational from outside: why the same grain, tested once, may need to be tested again when its destination changes, and why dairy and breeding customers buy binder prophylactically. The limit is a function of the animal’s physiology and the human food chain behind it, not of the toxin’s chemistry. No analytical advance can collapse that spread.
Fact two: efficacy is not certified
The mitigation side of the market is governed by feed additive law rather than contaminant law. Under Regulation (EC) No 1831/2003 a product intended to reduce the contamination of feed by mycotoxins is authorised as a technological additive in that specific functional group, and authorisation requires a safety assessment and an efficacy assessment by the European Food Safety Authority.
The efficacy assessment is where the category’s commercial character is decided. When the FEEDAP panel assessed a bentonite-and-sepolite preparation for all animal species in 2013, it found the additive safe up to 20,000 mg/kg of complete feed, found no consumer-safety concern from residues, and then concluded that there was insufficient evidence to conclude on its efficacy as a substance for reduction of contamination of feed by mycotoxins, on the basis of a single in vivo study in chickens. The opinion is specific to one product and one submission. Its consequence is general: the regulatory framework establishes that a binder is safe, not that it works, and no certified reference material or reference method exists against which a claimed effect could be measured in a customer’s own feed.
That asymmetry has an exact commercial translation, and it is the finding this report is built on. In testing, the standard is public and shared, so the product is comparable and the price converges. In mitigation, the standard does not exist, so the product is differentiated by claim, by formulation and by advice, and the price does not converge — it rises 2.54 per cent a year as the mix shifts toward biologicals and formulated blends whose claims are the most defensible.
What this costs a mill, and why it buys
A feed mill experiences both facts as recurring, non-discretionary cost. An amended limit requires the specification to be rewritten, the supplier contracts to be reviewed and the method to be revalidated; a positive result on an incoming lot requires a decision within hours, because grain waiting at an intake pit is a truck, a driver and a demurrage charge. Neither event is optional, and neither is within the mill’s control.
That is why the demand in this market is best described as compliance-driven rather than growth-driven, even though it grows. The mill does not buy testing because the market is expanding; it buys testing because a lot cannot move without a result. The same is true of the binder: it is bought because the alternative is a rejected lot or a condemned animal, not because the nutritionist expects a return. The two purchases are both defensive, which is what makes them durable through a downturn and also what caps the price on the testing side — a defensive purchase that can be standardized will be.
The trade dimension compounds it. Codex Alimentarius maximum levels in CXS 193-1995 are the reference point when an exporting country’s limit and an importing country’s limit disagree, and a rejected container is a far larger loss than the cost of any test in this report. That asymmetry between a small sampling cost and a large rejection cost is the economic reason testing survives at all in a market where the analytical result is increasingly cheap: the buyer is not purchasing information, they are purchasing the right to move goods. Global Corn (Maize) Seed is where this begins at the top of the chain — the genetics determine the hybrid, but the harvest year determines whether the grain clears a border — and Colombia Soybean Grain shows the same mechanism operating in a market where import specifications rather than domestic regulation set the practical level.
The regulatory risk in the forecast
The forecast in this report assumes the amendment cadence continues and that no efficacy standard for binders is introduced. Both assumptions deserve scrutiny.
If the European Union were to establish a reference method and certified materials for binder efficacy, the competitive basis of the mitigation half would change within a product cycle: comparable products converge in price, and the 40.7 per cent price and mix contribution would compress toward the testing side’s 10.1. That is the single largest downside risk in this report, and it is not currently signalled by anything in the authorisation pipeline this build examined. Conversely, if a major jurisdiction were to tighten a feed limit toward the dairy-type level across more species, binder dosing would rise without any change in grain quality at all — a pure volume event, and the most plausible upside.
What is not modelled, and is therefore stated rather than assumed: no regional split, because the model carries no geography; no regulatory-approval pipeline forecast, because the authorisation queue is not published in a form that supports one; and no assumption about future trade disputes, which historically move this market more than any single amendment. The limits cited here were read from their official sources during this build, with the European amendment count carried forward from the preceding report in this cluster rather than re-derived.