
Global Food Allergen Testing & Control Market Report, Size, Share and Forecast 2026–2033: USD 1.18 Billion to USD 2.18 Billion at 7.97 Per Cent — a Test Costs Less in 2033 Than It Does Today, and Every Dollar of Growth Is More Tests
Market snapshot
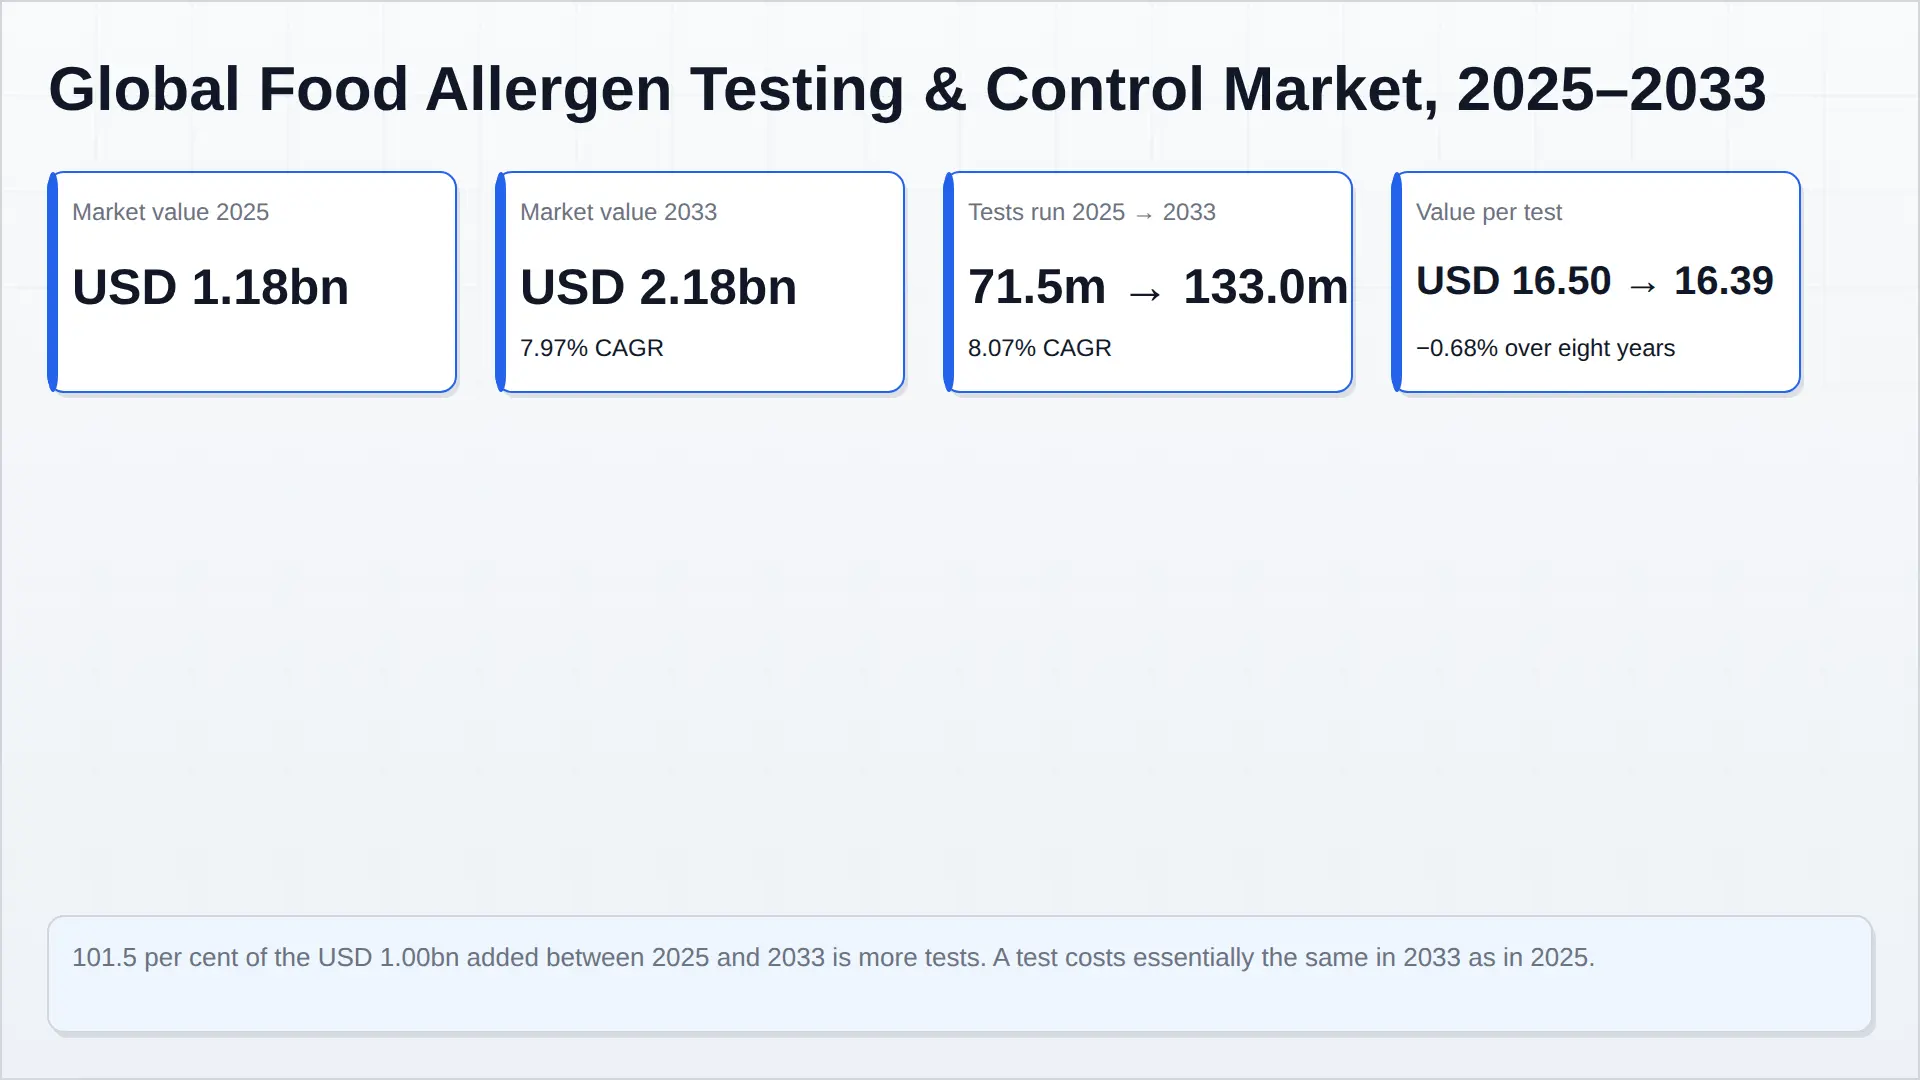
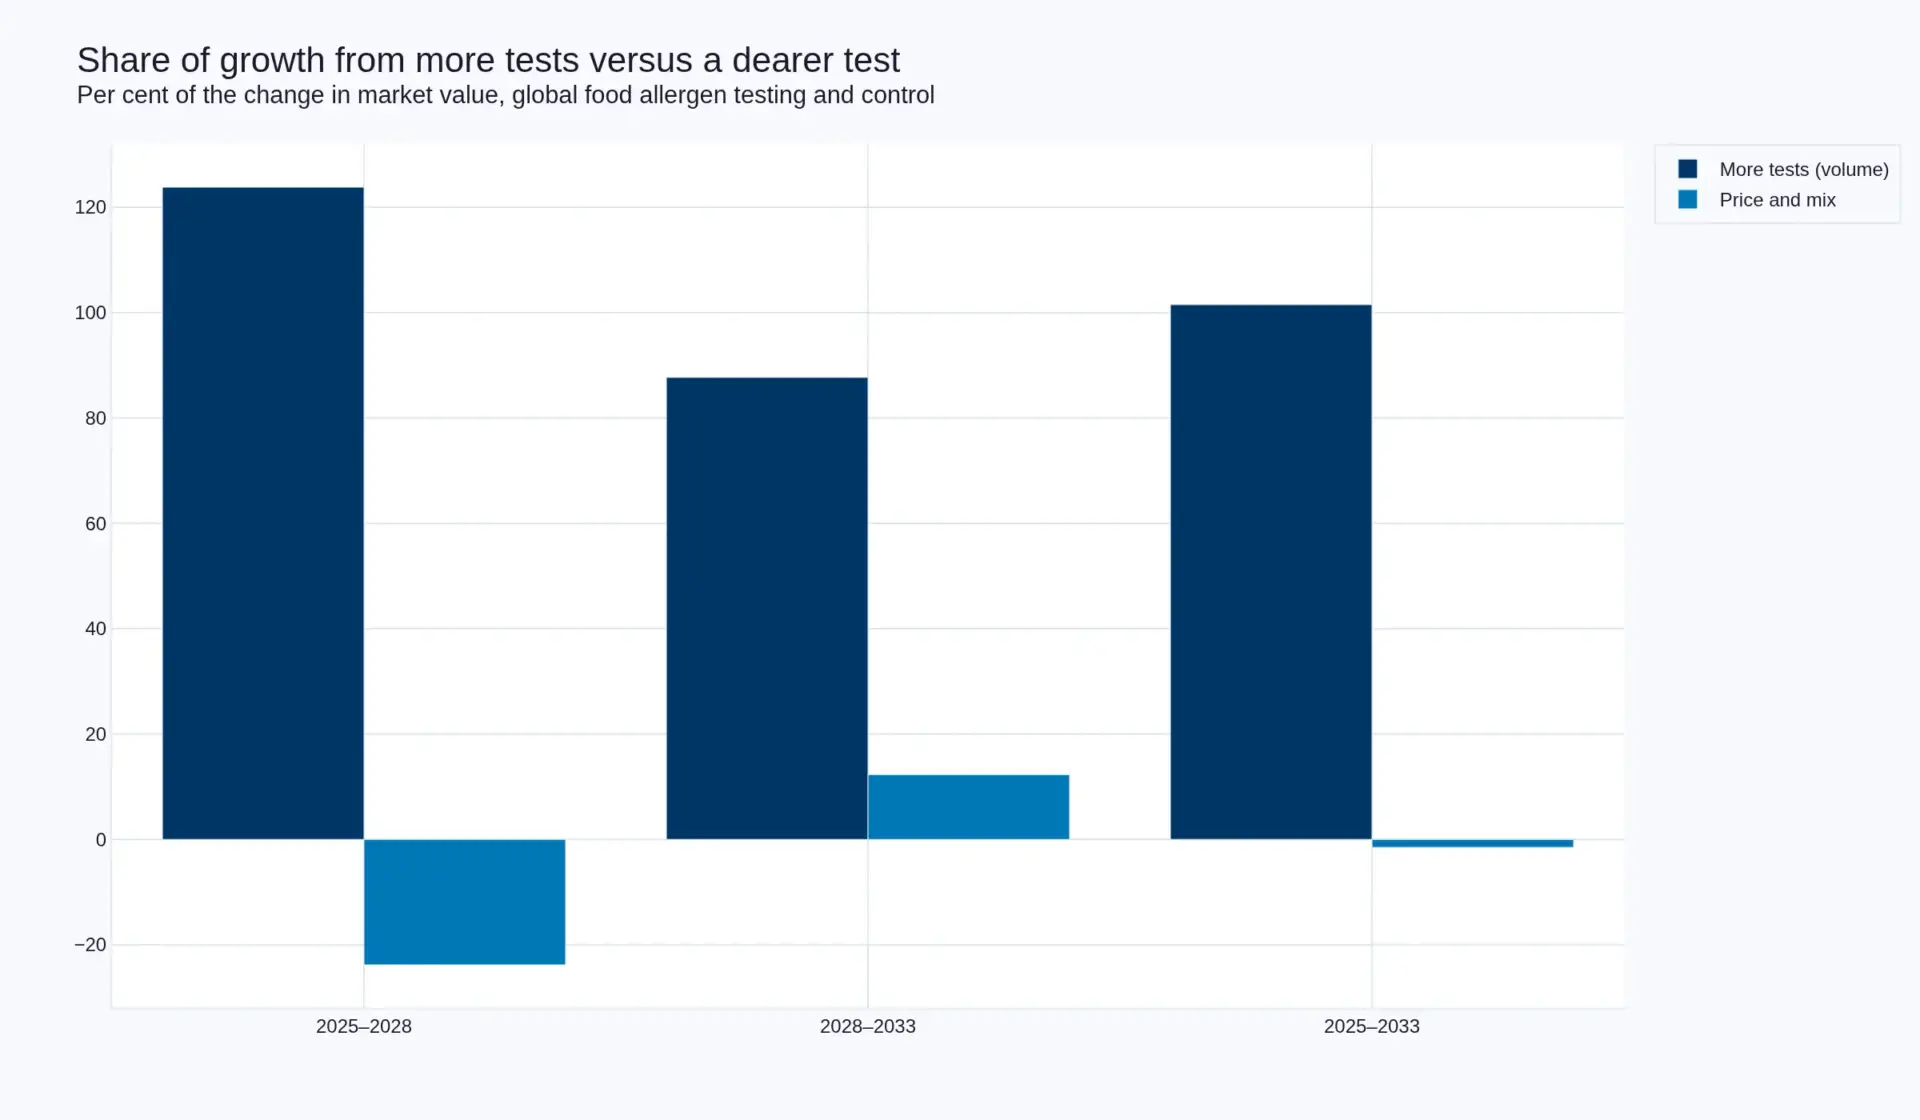
This market adds a billion dollars over eight years and spends none of it on making a test dearer. Global food allergen testing and control is a USD 1.18 billion market in 2025, reaching USD 2.18 billion in 2033 at 7.97 per cent. Of the USD 1.00 billion added, USD 1,015 million — 101.5 per cent — is more tests. Price and mix remove USD 15 million. A single allergen test is worth USD 16.50 in 2025 and USD 16.39 in 2033: 0.68 per cent cheaper across the whole forecast.
That is the inverse of the food safety testing report published alongside this one, where price carried 25.1 per cent of growth. It should be. A pathogen test is pinned to a method — an enrichment step, a plating medium, an ISO or BAM procedure that a regulator, a retailer or a court will accept. An allergen test is not. No statutory reference method for allergen detection exists anywhere in the world, and the method literature names the consequence plainly: a lack of certified reference materials, and wide variation in method between laboratories. Where the method is free, the price is free with it.
Against that, July 2026 did something no allergen regulation had done. The Codex Alimentarius Commission adopted a precautionary allergen labelling annex to the General Standard for the Labelling of Pre-packaged Foods, with 21 reference doses running from 1.0 milligram of total protein for almond, cashew, celery and mustard to 200.0 milligrams for crustacea, plus 4.0 milligrams of gluten for coeliac disease. The action level is the reference dose divided by the amount of food reasonably eaten at a single sitting. A “may contain” statement is justified above that level and — the half that matters commercially — should not be used below it.
That converts a free liability shield into a priced decision. Removing a precautionary statement is worth money: shelf appeal, retailer listings, export eligibility, and in one documented American case the avoidance of a recall. Proving absence takes more samples than finding presence, which is why test volume grows at 8.07 per cent while value grows at 7.97 per cent, and why the price line only turns positive after 2028, when quantifying to an action level replaces detecting to a yes or a no.
| Measure | 2025 | 2028 | 2033 | 2025–2033 |
|---|---|---|---|---|
| Market value, USD billion | 1.18 | 1.48 | 2.18 | 7.97% |
| Tests run, million | 71.5 | 94.0 | 133.0 | 8.07% |
| Value per test, USD | 16.50 | 15.74 | 16.39 | −0.68% |
| Testing and consumables, USD billion | 1.075 | 1.325 | 1.860 | 7.09% |
| Control layer, USD million | 105 | 155 | 320 | 14.95% |
| Control layer share of market | 8.9% | 10.5% | 14.7% | — |
Where the USD 1.00 billion comes from
Decompose the growth and the market looks strange. Volume contributes USD 1,015 million and price subtracts USD 15 million, which means the price of an allergen test does nothing at all across eight years — and that is the finding, not an absence of one. A market whose unit price is flat while its unit count rises 8 per cent a year is a market where demand is being created by something other than appetite, and where suppliers have no pricing power over the thing they sell.
The eight-year aggregate hides the movement that matters. Split it at 2028 and the two effects reverse role. Between 2025 and 2028 value per test falls from USD 16.50 to USD 15.74 and price subtracts 23.8 per cent of the growth — multiplex panels are collapsing analyte-level pricing fast, and the first-line screen is migrating to a lateral flow device at the line. Between 2028 and 2033 value per test recovers to USD 16.39 and price adds 12.3 per cent, because the Codex action level asks for a concentration rather than a flag, and a concentration needs a calibration curve.
Two forces of almost identical size, pulling in opposite directions, netting out at 1.5 per cent. That is why a top-down analyst working from a published growth rate will never find the 2028 trough in the price of a test, and why it is where a laboratory’s margin actually compresses.
What this report claims, and what it does not
The value base is a construct and it is the weakest number here. No company reports allergen testing as a standalone line. Neogen’s USD 77.5 million of Natural Toxins and Allergens revenue bundles mycotoxins with allergens and is not split; Eurofins reports by geography; SGS and Bureau Veritas bundle food with adjacent inspection businesses; R-Biopharm is private. The build combines disclosed testing revenue with a grossed-up unlisted laboratory tail, and carries a range of USD 1.10–1.30 billion around the USD 1.18 billion point estimate. The unit line is derived from realised price rather than observed, which makes value per test an output of the model and not an input to it. Both limitations are stated here, in the press release and in the first FAQ rather than buried in a footnote, and the market risk chapter publishes the sensitivity that would move the answer.
Table of Contents
- Market snapshot: four numbers that decide this report
- Where the USD 1.00 billion comes from
- The value chain from farm gate to label decision
- In-house against outsourced: the two price points
- Kit economics and the instrument-plus-consumable model
- The method landscape: ELISA, PCR, lateral flow and mass spectrometry
- Why allergen testing has no statutory reference method
- Multiplex and the collapse of analyte-level pricing
- Competitive landscape: three business models, one disclosed line
- Margin is not value capture
- The July 2026 Codex annex and the arithmetic of an action level
- One product, four markets, four thresholds
- Investment activity: capacity, instruments and consolidation
- Market risk and the sensitivity that would break this forecast
- Sources, methodology and the limits of this build
Competitive Landscape
Competitive landscape: three business models, one disclosed line
Ten companies matter in this market and they compete in three entirely different ways. Neogen Corporation, R-Biopharm, Romer Labs, Thermo Fisher Scientific and Bio-Rad Laboratories sell kits, plates, devices and readers — the consumable side. Eurofins Scientific, SGS, Bureau Veritas, Intertek Group and Mérieux NutriSciences sell capacity, accreditation and a report that a retailer will accept. The two models are exposed to the same demand and to opposite risks.
One company discloses a line, and it barely moved
Only one of the ten publishes a revenue line with food allergens inside it. Neogen’s fiscal 2026 Form 10-K reports Natural Toxins and Allergens at USD 77.5 million, against USD 77.0 million in fiscal 2025 — growth of 0.6 per cent. In the same filing, its Bacterial and General Sanitation line grew 6.4 per cent, from USD 164.8 million to USD 175.4 million.
Same company. Same customers. Same salesforce, same channel, same price list discipline. A tenfold difference in growth between the pathogen line and the line that contains allergens. That is not a marketing failure and it is not a mix accident; it is the market structure in a single disclosure. Pathogen detection is compelled by a regulatory method and a regulated tolerance, so a processor has little discretion about doing it and limited discretion about how. Allergen detection, until July 2026, was compelled by nothing except the fear of being wrong, and the cheapest way to answer that fear was not a test.
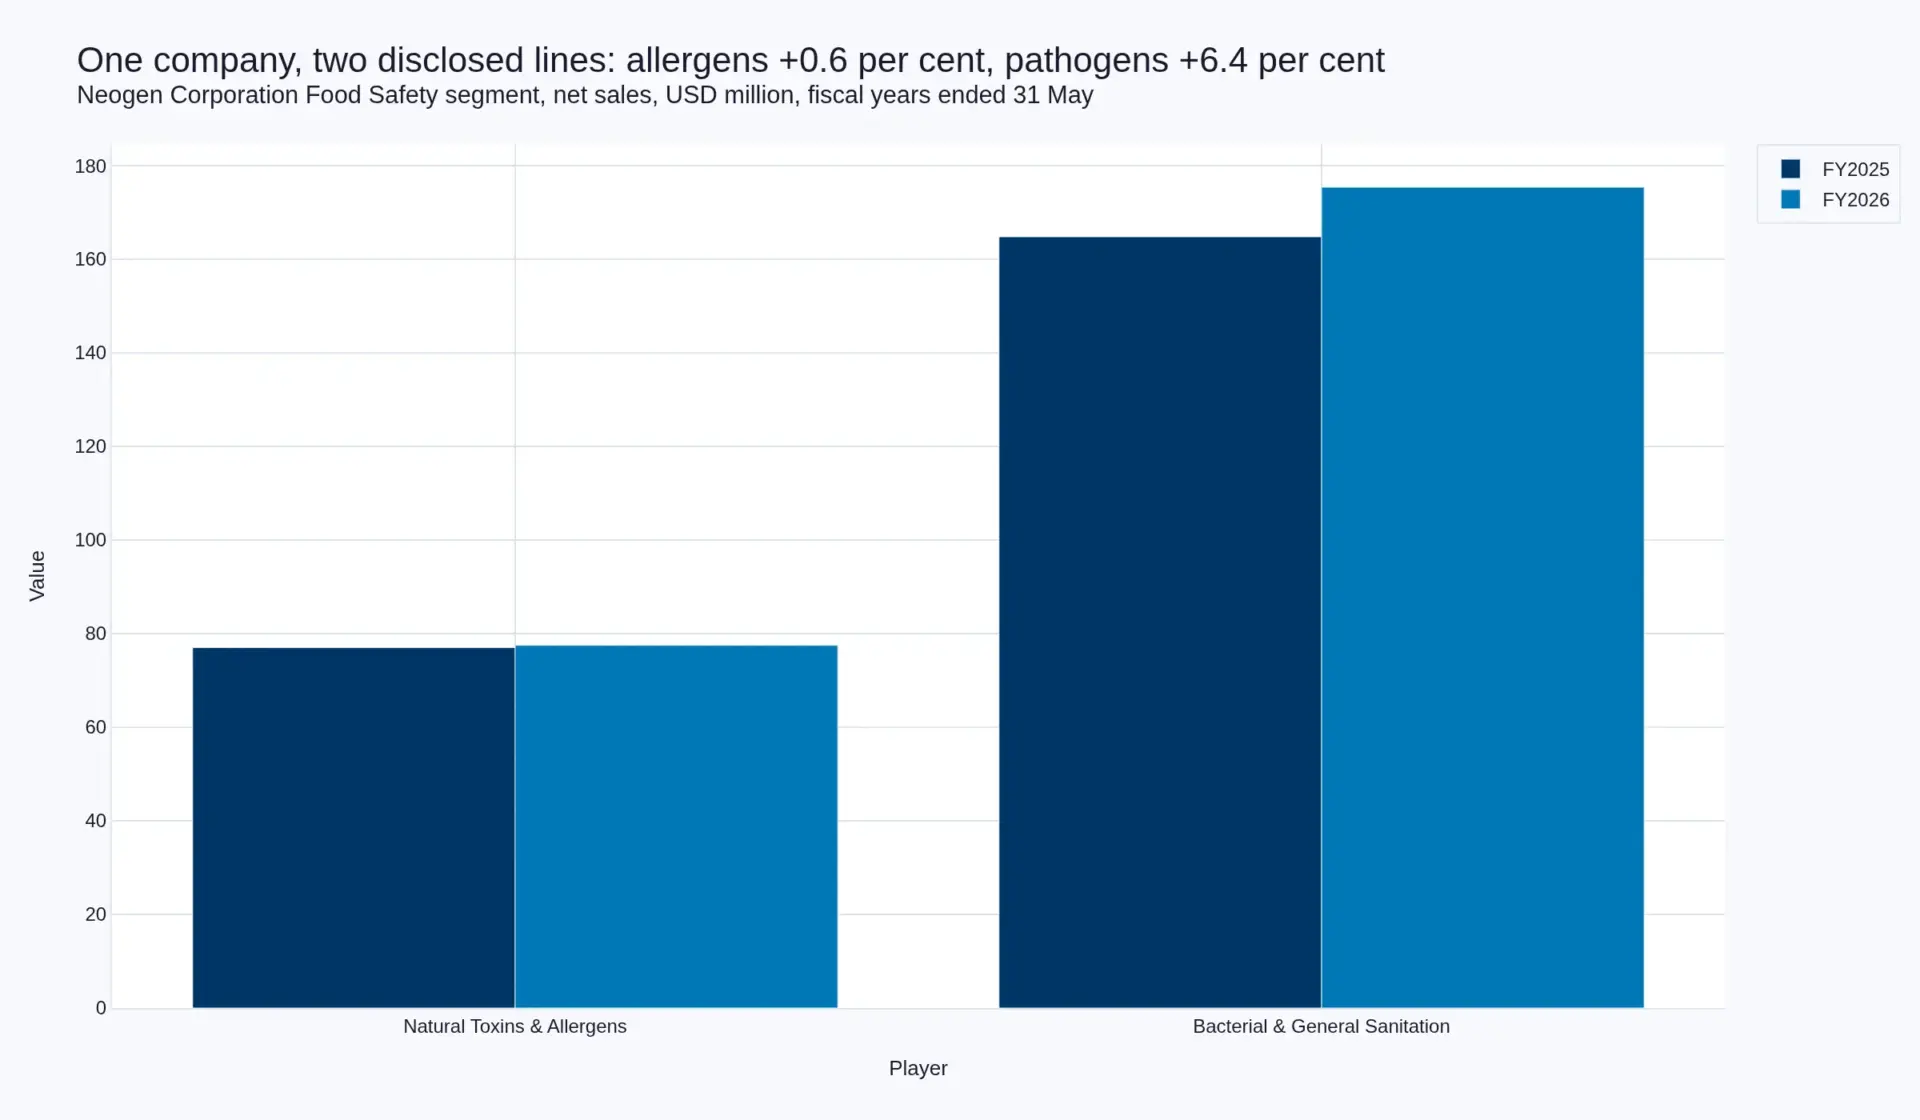
Two cautions on that number. The line is not allergen-only — mycotoxins sit inside it, sold largely to the milling and grain industry, and a strong or weak harvest year in aflatoxin testing moves it independently of anything allergen-related. And it is a kit vendor’s number, which means it measures consumable sales and not the total value of the testing event. It is still the best single anchor this market has, and the fact that it is broadly flat is the most important honest fact in the report.
The laboratory side is growing faster than the kit side
Eurofins’ first-half 2026 report gives the cleanest available read on the service side of the same market. Group revenue was €3,701 million, up 2.5 per cent as reported and 2.7 per cent organically, against a 2.9 per cent currency headwind, with the company noting that organic growth improved as the half progressed. Within Europe, the Food and Feed business delivered mid-single-digit organic growth across most geographies and end markets, held back at the start of the year by unusually adverse weather rather than by demand.
Mid-single-digit organic in food and feed testing sits above Neogen’s 0.6 per cent and below this report’s 7.97 per cent, and the ordering is not a coincidence. Food and feed testing as Eurofins reports it includes contaminants, authenticity, nutrition labelling and allergens together, so it is diluted relative to a pure allergen measure and flattered relative to a kit-only one. What it establishes is that the party selling the bundle is collecting growth that the party selling the part is not. Neither SGS, Bureau Veritas, Intertek nor Mérieux NutriSciences discloses allergen revenue at all; all four bundle food testing into a wider inspection or health and nutrition line, which is precisely why this market has no published size and why every estimate in circulation, including this one, is a construct.
Three models, three exposures
| Company | Model | Allergen visibility in disclosure | Exposure to this forecast |
|---|---|---|---|
| Neogen | Kits and consumables | One combined line, USD 77.5m, +0.6% | Bears the flat-price risk directly |
| R-Biopharm | Kits and consumables | Private; no disclosure | Multiplex leader; drives the price trough |
| Romer Labs | Kits, plus method guidance | Not separated | Regulatory education as demand generation |
| Thermo Fisher | Kits inside a broad platform | Not disclosed | Installed base rather than kit margin |
| Bio-Rad | Kits inside a broad platform | Not disclosed | PCR and multiplex positioning |
| Eurofins | Laboratory network | Food and Feed, geography only | Benefits from the control layer |
| SGS | Laboratory network | Bundled with health and nutrition | Volume-led, currency-exposed |
| Bureau Veritas | Laboratory network | Bundled with inspection | Volume-led, currency-exposed |
| Intertek | Laboratory network | Bundled with food services | Volume-led, currency-exposed |
| Mérieux NutriSciences | Laboratory network | Not separated | Pure-play food exposure |
R-Biopharm deserves separate attention because it is the company most responsible for the shape of the price line. Its four-plex cereals kit separates wheat, barley and rye in a single well. That is a better product and a smaller revenue event than three separate analyte tests, and it is the mechanism of the 2028 trough in one catalogue item. Its private ownership is also why this market cannot be sized from filings: the company with the deepest allergen franchise in Europe publishes no segment revenue at all.
Romer Labs is doing something the others are not. It published a detailed public explainer on the Codex precautionary labelling change within four months of adoption, working through the difference between a reference dose and an action level, and being explicit that Codex did not adopt the VITAL programme and that the two are not interchangeable. That is regulatory education as demand generation, and it is a rational response to a market whose buyers do not yet know how to calculate the number they are now expected to defend.
Margin is not value capture
Two business models, one demand driver, opposite economics. A kit vendor earns gross margin on a consumable and is exposed to tests run. A laboratory earns utilisation on capacity and is exposed to samples sent out. This report forecasts tests run growing 8.07 per cent, and it also forecasts that a growing share of those tests happens in-house, because a lateral flow device at the line costs single-digit dollars and a send-out costs tens. Kit revenue therefore grows faster than laboratory revenue in this forecast, even though the laboratory side is where the control layer sits and where the price recovery after 2028 is captured.
That is the competitive prediction worth carrying out of this chapter: the vendors of consumables win the volume, and the owners of accredited capacity win the price. A company exposed to both — selling kits into a plant and running the confirmatory laboratory that plant sends the difficult samples to — is in the strongest position in the market, and no one of the ten has that position fully.
Fragmentation cuts the other way. Beneath the ten, several hundred regional laboratories and a long tail of national kit distributors hold the majority of the volume, which is why no company in this market has a share above the low double digits and why no transaction in the sector can be read as a share number. The structure is the reason this report leans on regulatory arithmetic rather than on concentration statistics: in a fragmented market with no reference method and no certified material, the regulation is the only thing that behaves like a moat.
Read against the rest of the library, the competitive pattern repeats. In cookies, premium chocolate and functional confectionery, the testing proposition is cross-contact in plants that handle nuts, milk and wheat on shared lines — a changeover problem. In dairy it is the reverse, because milk is the most frequently undeclared allergen in American recall data and is usually undeclared in products that were never supposed to contain it. Each of those markets buys from the same ten companies, and each buys a different mix of the same two things: a test result, and the paperwork that makes it defensible. The segment page for Food Safety and Quality Testing collects the full set.
Value Chain
The value chain from farm gate to label decision
An allergen does not enter a food business as a contaminant. It enters as a declared ingredient, correctly labelled, in a consignment bought on specification. The failure happens later, and almost always in one of three places: a recipe change that puts an allergen into a line that never carried one, a changeover that did not clean to the required standard, or a supplier who altered their own formulation without telling anyone downstream. All three are supply-chain events. That is why the money in this market is not distributed evenly along the chain — it concentrates where a supply-chain change becomes a label decision, and where somebody has to prove the label was right.
Step one, ingredient supply. The allergen arrives documented. The commercial risk sits in the specification and the supplier verification behind it, not in the delivery. This is the cheapest link in the chain and the one where the control layer earns most of its value, because a single undeclared change at a supplier propagates to every customer who used that ingredient.
Step two, product development and label design. The label is written before the product exists. The allergen declaration and any precautionary statement are set during development, and under the Codex annex this is now the moment an action level has to be calculated — reference dose divided by the portion the consumer is expected to eat. That calculation is product-specific and cannot be inherited from a sister product, which is the single largest generator of new work in the control layer.
Step three, in-plant verification. Environmental swabs, changeover validation and at-line screening. This is where 59.5 million of the 71.5 million tests in this market are run: cheap, fast, on the line, and not intended to be evidentially final.
Step four, external laboratory confirmation. Accreditation to ISO/IEC 17025, method validation against a matrix, and a report that will survive a retail audit or a regulator. 12.0 million tests a year, at a realised value nearly four times the in-house figure.
Step five, customer and retailer assurance. Specification sheets, certificates of analysis, audit evidence. This link is buyer-driven rather than regulator-driven, and in practice it is often the strictest — a retailer specification can require a test frequency that no statute does.
Step six, documentation and defence. The retained risk assessment, the supporting evidence for a labelling decision, and the record of what was done when a result came back positive.
In-house against outsourced: the two price points
The market has two prices, not one, and the gap between them is where the value chain decision is made.
| Channel | Tests 2025, million | Realised value per test, USD | Testing value, USD million | Share of testing value |
|---|---|---|---|---|
| In-house, kit-based | 59.5 | 10.4 | 619 | 57.6% |
| Contract laboratory | 12.0 | 38.0 | 456 | 42.4% |
| Total testing | 71.5 | 15.0 | 1,075 | 100% |
| Control layer (no tests) | — | — | 105 | 8.9% of total market |
Blended across both channels, testing is worth USD 15.03 per test. Add the control layer and the whole-market figure rises to USD 16.50, which is the number used throughout this report. The difference between the two — USD 1.47 per test — is what a manufacturer pays for the documentation surrounding the result rather than the result itself, and it is the fastest-growing part of the market.
The switch point between the two channels is crude and consistent: a site moves a test in-house when its annual volume justifies an analyst, a plate reader or a reader, and the cost of accreditation or of method validation is recovered against send-out fees. Below that volume it sends samples out. The practical consequence for this forecast is that kit revenue tracks the number of sites testing, while laboratory revenue tracks the number of samples per site — and sites are growing faster than samples per site in the categories where allergen exposure is newest.
Kit economics and the instrument-plus-consumable model
Nothing in the supply chain is sold the way it is priced. A reader is placed, discounted or given away; the kit, the plate, the swab and the lateral flow device are sold per test and carry the margin. That is not unusual in diagnostics, but it has a specific consequence here: the vendor’s incentive is to maximise the number of answerable questions per site, not the price per answer. Every additional analyte a vendor can put into a multiplex panel increases the site’s consumable spend while reducing the site’s cost per analyte — and the vendor captures the first effect while the buyer captures the second. That is the mechanism by which a market can grow 7.97 per cent while its unit price falls.
The gluten-free products category shows the model at its purest, because the claim and the test are the same thing: a product is gluten-free because a result says so, at 20 milligrams per kilogram in the European Union and under a separate reference dose regime for coeliac disease under the Codex annex. In dairy, the exposure is different — milk is the single most frequent undeclared allergen in American recall data, and it is undeclared mostly in products that were never meant to contain it, which makes changeover validation rather than ingredient control the binding test. In plant-based meat the position is reversed again: the allergens are the formulation, and the testing question is whether the declaration is complete rather than whether a contaminant is present.
Three categories, three different testing propositions, one instrument fleet. That is why the segment this report sits in — Food Safety and Quality Testing — is the right place for it rather than a bakery or dairy shelf.
The control layer, and why it grows three times faster than testing
The control layer is USD 105 million in 2025, 8.9 per cent of the market. It reaches USD 320 million and 14.7 per cent by 2033, a 14.95 per cent compound rate against 7.09 per cent for testing. It is not a rounding error; it is the only place in this market where price rises.
What is being bought is the answer to a question the Codex annex made unavoidable: on what basis did you decide this label? A precautionary statement is now justified only above an action level, and the action level depends on the portion size of that specific product. Deriving it requires a consumption estimate, a reference dose, a validated method and a written risk assessment — per product, not per site. Add the retained documentation the annex expects a business to hold, and add the supplier verification that sits behind any declaration, and the growth rate stops looking aggressive. Most of the world’s food businesses have never had to do this calculation, and from 2026 they are being told what it looks like.
Pheonix’s judgement, stated as judgement: the binding constraint on this layer is not demand but supply. Accredited allergen risk assessors are a small population, and the firms that employ them are the same firms selling the tests. That bundling is the most important commercial fact in the report and it is the subject of the competitive landscape.
Investment Activity
Investment activity: capacity, instruments and consolidation
Capital in this market goes to three places and they have almost nothing in common. It buys laboratory capacity — accredited space, instruments, method validation and the certified materials that validation needs. It buys kit development — denser multiplex, faster extraction, enhanced lateral flow. And increasingly it buys documentation — the risk assessments, action-level derivations and retention systems that the Codex annex has made a cost of doing business rather than a nice-to-have.
The first is capital-intensive and utilisation-led. The second is research-intensive and gross-margin-led. The third is labour-intensive and is the only one of the three that is currently under-supplied.
What the disclosed spending actually shows
Eurofins Scientific is the clearest window on capacity investment, because it reports acquisitions and organic growth separately. In its first-half 2026 report, acquisitions contributed €23 million to consolidated revenue in the period, on a base of €3,701 million — a modest inorganic contribution, against 2.7 per cent organic growth and a 2.9 per cent currency headwind. The company also describes continued investment in technology and digitalisation and an ongoing footprint-optimisation programme, which is the language of a network buying productivity inside existing capacity rather than adding capacity at the same rate as a decade ago.
That matters for this report because it implies the laboratory side of the allergen market is not being over-built. A network that grew historically by acquiring regional laboratories and now grows by improving the ones it owns will not compete test prices to fill new square footage. The price compression in this forecast comes from the consumable side, not from excess laboratory capacity.
Neogen sits at the other pole. Its own results narrative dates a step change in Food Safety performance to the period following its acquisition of the 3M Food Safety business in fiscal 2023, and its most recent full year shows core Food Safety revenue growing 5.8 per cent in the fourth quarter, the highest rate since that acquisition. That is a coherent story about scale in consumables: the moat is breadth of portfolio and channel, not any single allergen kit. It is also the reason to read the 0.6 per cent growth in the Natural Toxins and Allergens line as a category problem rather than an execution problem. The platform grew; the allergen line inside it did not.
The instrument is not the investment
In this market the instrument is a customer-acquisition cost and the consumable is the revenue. A reader, a plate reader or a thermal cycler is sold near cost, bundled with an initial kit order, or placed on a lease that is recovered within a contract term. The return on that placement is measured in consumable annuity over the life of the relationship, which is why kit vendors defend installed base with catalogue breadth and technical support rather than with price.
The investment consequence is easy to state badly. It is not that instruments are unimportant; it is that no investment in this market can be justified by the margin on the instrument. Every capital decision is a bet on test volume at a particular site for a particular number of years. In a market where the unit price is flat to slightly negative across eight years, that bet has to be underwritten by volume — which is exactly what this forecast predicts and exactly what the disclosed data, at 0.6 per cent, has not yet confirmed.
The reference-material gap is the obvious unmet need
The method literature names the absence of certified reference materials as one of the three constraints on allergen analysis, alongside inter-laboratory method variation and the difficulty of extracting target protein from complex matrices. Read as an investment signal rather than an academic complaint, that is the most clearly identified, worst-served need in the market. Certified reference materials are what turn a method into a comparable result, and comparability is the precondition for an action level that four jurisdictions can agree on.
Pheonix’s judgement, offered as judgement: whoever supplies certified allergen reference materials at scale in the next five years will set the terms on which every laboratory validates, and that position is more defensible than any kit. The companies currently closest to it are the national metrology institutes and the larger kit vendors, and none of them currently treats it as a product line with a price list.
Consolidation, and what cannot be concluded from it
The plausible direction of travel is obvious: testing networks consolidating regional laboratories into accredited hubs, and consumable vendors consolidating detection portfolios so that one salesperson can cover every analyte a site tests. Both are strategies for covering more of a fixed cost base with more of the same volume.
What cannot be concluded is any valuation. No allergen-specific transaction is disclosed anywhere in this market. When a testing network buys a laboratory, the consideration covers pathogens, chemistry, authenticity, nutrition and allergens together, and there is no basis on which to apportion it. Any multiple quoted for an allergen business is an apportionment of convenience rather than a disclosed fact, and this report does not offer one. The investment direction is genuinely rising on the evidence of the annex and the regulatory timetable; the size of the cheques is not knowable from the outside.
One structural note closes this chapter. The food safety testing market analysed separately in this segment attracted capacity investment on a pathogen-led thesis, where the regulatory requirement is unambiguous and the method is fixed. Allergen testing is now being funded on a label-led thesis whose regulatory requirement is new, non-binding in most jurisdictions, and differently worded in each of them. That is a different quality of demand, and it deserves a different cost of capital. Nothing in the market currently prices the difference.
Technology & Innovation
The method landscape: ELISA, PCR, lateral flow and mass spectrometry
Four method families carry essentially all allergen testing, and they differ less in whether they work than in what they cost per answer and what they can prove.
Immunoassay is the incumbent. The R5 sandwich ELISA is the most widely used and most extensively validated format for gluten, and it is also the format whose limitations are best documented: it under-recovers glutenins, and it is sensitive to heat processing and to the food matrix. Two later formats exist specifically to answer those failures — the G12 antibody format and the Morinaga kit range — which is itself a price signal. Where a method has to be re-engineered to remain credible, the re-engineered version sells at a premium, and the old version keeps selling at a discount to the users for whom the compromise is acceptable. Competitive ELISA covers the hydrolysed and fermented matrices where a sandwich assay finds nothing to bind.
PCR is the specificity answer. Real-time PCR and loop-mediated isothermal amplification both tolerate processing better than protein-based methods, because DNA survives heat that denatures the epitope an antibody was raised against, and both can discriminate the cereal of origin — which matters, because a wheat-free claim and a gluten-free claim are not the same claim. The limitation is extraction: a qPCR result is only as good as the DNA that came out of the matrix, and highly processed or heavily hydrolysed material yields little. Multiplexing is where PCR has moved fastest. A four-plex cereals kit that separates wheat, barley and rye in a single well is, functionally, three analyte tests sold as one — and that is the mechanism behind the price trough in this forecast, in a single product.
Lateral flow is the volume answer. A device that gives an answer at the line in minutes, for single-digit dollars, changes the economics of environmental and changeover monitoring completely. It is qualitative or at best semi-quantitative, it is less sensitive than a laboratory method, and it is the reason 59.5 million of the 71.5 million tests in this market are run in-house rather than sent out. Enhanced lateral flow formats are closing the sensitivity gap, which will pull more screening volume out of the laboratory.
Mass spectrometry is the evidential answer. LC-MS/MS identifies marker peptides, discriminates the grain of origin, and does not depend on an antibody recognising a protein that processing has already altered. It is expensive per sample and demands expertise most plant laboratories do not have. It is what you buy when the answer has to survive a dispute.
Why allergen testing has no statutory reference method
This is the structural fact that decides the price line in this report. Pathogen testing has reference methods — an enrichment protocol, a selective medium, a confirmation step — that a regulator publishes and an industry adopts, and a laboratory that deviates from them does so at commercial risk. Allergen testing has no equivalent. There is no single internationally mandated procedure for detecting peanut protein in a biscuit, and the reason is not regulatory neglect: it is analytical. What you are measuring is a protein class, not an organism, and the protein class behaves differently in every matrix.
The systematic literature is explicit about what this costs. The recurring constraints named across the field are the lack of certified reference materials, methodological variation among laboratories, and difficulty extracting the target efficiently from complex matrices. Read those three together and you have the definition of a market with no price floor. Any laboratory can select any validated kit, and validation in the absence of a certified reference material means validating against a spiked matrix of your own making.
In pathogen testing, the reference method is the moat. In allergen testing, there is no moat, which is why value per test is flat across eight years while every adjacent food testing market in this library has seen price contribute positively. The food safety testing report measured price at 25.1 per cent of growth. The same laboratories, the same instruments and many of the same customers produce minus 1.5 per cent here.
Multiplex and the collapse of analyte-level pricing
Every price mechanism in this market has one cause: the unit of sale changed from an analyte to a panel without the price per answer following it down proportionally. A laboratory that once ran three ELISA plates to report wheat, barley and rye now runs one four-plex well. The buyer’s cost per sample falls; the seller’s revenue per sample falls; and the number of analyte decisions the buyer can make rises. That is a genuine productivity gain and it is being competed away, which is precisely what a market with no reference method and no certified material does.
The countervailing force arrived in July 2026 and is the reason the trough is in 2028 rather than 2033. A Codex action level is a concentration in milligrams per kilogram, derived from a reference dose in milligrams of total protein divided by the portion consumed. Detecting presence does not answer it. Neither does a lateral flow device with a limit of detection above the action level. What answers it is a calibrated quantitative method — sandwich or competitive ELISA with a validated standard curve, or LC-MS/MS — and that is priced above a qualitative screen. Multiplex compresses the price of the panel; quantification restores it.
The innovation frontier, and who pays for it
The technologies in development are the ones that shrink the gap between an on-line answer and a defensible one: biosensors, near-infrared spectroscopy, enhanced lateral flow, and denser multiplex platforms. None of them changes the structure of the market, because all of them push in the same direction as the price trough — more answers, cheaper, closer to the line. The commercial model that pays for that development is not the instrument. A reader, a luminometer or a thermal cycler is placed, sold near cost, or leased; the annuity is the consumable, priced per test, forever. That is why kit vendors defend installed base so aggressively and why the instrument-plus-consumable model, not the instrument, is the unit of competition.
One consequence deserves stating plainly. The companies with the deepest installed base have the strongest interest in keeping testing cheap and frequent, not in making it expensive and rare. The gluten-free products market is the clearest illustration: every unit sold under a gluten-free claim is an analytical result before it is a marketing position, and the volume of those claims, not their price, is what the method business is exposed to. The same is true of the emerging protein categories, where plant-based meat brings soy, wheat and legume cross-contact into plants that previously handled none of them. In dietary supplements the exposure is different again — highly concentrated powders, long ingredient declarations and frequent reformulation, which is the worst combination for cross-contact and therefore the best combination for test volume.
The judgement Pheonix draws from its own interview programme, and states as judgement rather than measurement, is that the binding constraint on method upgrade in most mid-sized processors is not the price of the kit. It is the cost of revalidating the method and rewriting the allergen risk assessment that sits behind the label. A new method is cheap; the documentation that makes it defensible is not. That asymmetry is what the control layer in this market is actually selling.
Market Risk
Market risk and the sensitivity that would break this forecast
Five things can move this forecast, and they are ordered here by how much damage they would do rather than by how likely they are.
One: the value base is a construct
The USD 1.18 billion starting point is not observed anywhere. It is assembled from disclosed testing revenue, a judgmental split of which proportion of a bundled food testing line is allergen work, and a grossed-up unlisted laboratory tail. The defensible range around it is USD 1.10–1.30 billion. Move the base to USD 1.10 billion and hold the 2033 value, and the compound rate rises to 9.0 per cent; move it to USD 1.30 billion and it falls to 6.7 per cent. Neither of those is a small difference, and neither is resolvable with better research, because the underlying disclosures do not exist. It is the first thing a reader should discount.
Two: the disclosed data contradicts the forecast
This is the honest problem at the centre of the report. The one company that discloses a line containing food allergens grew it 0.6 per cent in its most recent fiscal year. The largest testing network’s food and feed business grew at a mid-single-digit organic rate. This report forecasts 7.97 per cent.
There is no currency explanation available here, unlike the equivalent report on food safety testing, where a 3 per cent translation drag in the testing majors did much of the work. Neogen reports in dollars and its allergen line was flat in dollars. So the gap is real and it has to be located.
It can only be in three places. First, the unlisted tail — several hundred regional laboratories and national distributors that no one discloses and that this build weights at a little over a third of the market; if allergen testing is growing fastest where there is least published data, the disclosed names understate the whole. Second, geography — adoption of allergen testing in Asia-Pacific and Latin America is far behind Europe and North America, and the growth rate of a market is set by the fastest-growing part of it, not by the most disclosed part. Third, the control layer, which is not in anyone’s disclosed testing line at all and which this report grows at 14.95 per cent.
If all three are wrong, this market grows at five to six per cent and the report is a good description of a slower market than it claims. That is stated here rather than left in a footnote, and it is the single most important caveat in the document.
Three: reformulation beats testing
The FASTER Act episode is the template and it should be taken seriously as a forecast risk, not just as history. When declaring sesame became mandatory and no threshold existed, some manufacturers added small amounts of sesame to products that had not contained it. Adding the allergen was cheaper than proving it absent. Every threshold that is set too tight, every action level that is expensive to demonstrate, and every regulator who declines to set one at all, pushes the same decision the same way.
This is why the Codex annex is treated in this report as the market’s central event rather than as a compliance chore. A threshold prices the alternative. Without one, a manufacturer’s cheapest route to a clean label is a reformulation, and reformulation generates no test volume at all. The substitution risk in this market is unusually high precisely because the substitute is free.
Four: the regulatory timetable slips
European legislation to harmonise precautionary labelling is listed for consideration in the fourth quarter of 2027. That is a consultation timetable, not a statute, and it can move. The FDA met on thresholds in February 2026 and has published no rule. The Codex annex is an international reference text and does not bind anyone until a national authority adopts it.
If European harmonisation slips by two years, the price recovery in the second half of this forecast weakens materially, because the recovery depends on quantification replacing detection and that demand is regulatory. Volume growth would survive — the annex exists and the large retailers will push it through specifications regardless — but the value per test would not recover to USD 16.39 by 2033.
Five: four regimes, one conservative number
The threshold tables have holes. There is no Codex reference dose for rye, barley, oats, mollusc or sulphite, and competent authorities are invited to set their own. Combined with 14 allergens in Europe, 9 in the United States and a UK position set independently, a manufacturer selling into four markets faces a calculation per product per market.
The rational response, and the one Pheonix expects to see in practice, is to adopt the strictest action level across all four markets and apply it everywhere. That satisfies every regime with one number — and it means regulatory divergence raises compliance cost without proportionally raising test volume. Divergence is therefore a risk to this forecast, not the opportunity it might appear to be. The countervailing force is documentation: one action level across four markets still has to be documented four different ways.
The sensitivity that matters
Only one variable does enough work to change the conclusion, and it is value per test. The table holds tests run at 133.0 million in 2033 in every case and moves only the price of a test.
| Scenario | Value per test, 2033 | Market value, 2033 | CAGR 2025–2033 |
|---|---|---|---|
| Bear — multiplex compounds, no quantitative premium | USD 14.50 | USD 1,928 million | 6.33% |
| Base | USD 16.39 | USD 2,180 million | 7.97% |
| Bull — control layer reaches 18 per cent of market | USD 16.80 | USD 2,234 million | 8.31% |
The spread is 1.98 percentage points, and it is entirely a regulatory bet. In the bear case the July 2026 annex is adopted slowly, lateral flow and multiplex take the screen and never give it back, and the market grows almost exactly in line with the volume of food produced. In the bull case the annex is transposed into national law within four years, retailers write action levels into specifications ahead of the regulators, and the documentation burden becomes a priced service line large enough to move the blended unit value.
The base case sits closer to the bull than the midpoint, deliberately, because the regulatory events already happened. The annex was adopted, the timetable exists and the FDA has met. What is uncertain is the speed of transposition, not its direction — and that is a different risk from the one this market carried in 2024, when there was no annex at all.
Sources
Every figure in this report traces to one of the following. Regulatory and standards text is cited to the issuing body rather than to commentary.
- Codex Alimentarius Commission. Code of Practice on Food Allergen Management for Food Business Operators, CXC 80-2020 (adopted 2020). Full text.
- Codex Committee on Food Labelling, 49th session. Proposed annex to the General Standard for the Labelling of Pre-packaged Foods (CXS 1-1985): Guidelines on the use of precautionary allergen labelling, including reference dose tables 4.3.1 and 4.3.2. Working document.
- Codex Alimentarius Commission, July 2026. Adoption of the precautionary allergen labelling guidelines at CAC49. Commission announcement.
- US Food and Drug Administration. The FASTER Act: sesame is the ninth major food allergen, effective 1 January 2023, including the agency’s note on post-enactment recipe changes. FDA guidance and consumer update.
- Neogen Corporation. Form 10-K for the fiscal year ended 31 May 2026, Food Safety segment product categories. SEC filing.
- Neogen Corporation, 30 July 2026. Fourth-quarter and full-year fiscal 2026 results, including net sales by Food Safety product line. Results release.
- Eurofins Scientific, 23 July 2026. First-half 2026 report, revenue by operating segment and Food and Feed commentary. Half-year report.
- US PIRG Education Fund. Annual food recall tallies, used for the 2025 recall-cause shares and the 2024 and 2023 allergen recall counts. Food for Thought.
- R-Biopharm. Allergen and gluten testing portfolio, including the four-plex cereals PCR format used in this report as the multiplex evidence. Product documentation.
- Romer Labs, November 2026. Technical explainer on the Codex precautionary labelling change and its relationship to the VITAL programme. Knowledge library.
- Quirino Junior et al., Food Reviews International, 2026. Systematic review of analytical methods for the detection and quantification of gluten in foods, including reference material, matrix and inter-laboratory constraints. Review.
- Regulation (EU) No 1169/2011, Annex II (14 allergens requiring declaration) and Commission Implementing Regulation (EU) No 828/2014 (conditions for gluten-free and very-low-gluten statements).
Not claimed in this report. No regional market split is published here, because the model does not carry one; the geography discussion above is directional and does not carry a number. No allergen-specific transaction multiple is quoted, because no allergen-specific transaction is disclosed. No figure is attributed to ALS Limited-type food laboratories whose allergen line is not separately reported. Company domains are asserted rather than fetched; entity identifiers were resolved live against Wikidata at the time of writing.
Regulatory Landscape
The July 2026 Codex annex and the arithmetic of an action level
Until this year, allergen regulation had two halves that did not meet. One half said what had to be declared. The other said nothing at all about what could be said on a precautionary basis, which is why “may contain” became the most ignored sentence on a food package: a statement so widely applied that it carried no information.
The management half. The Codex Code of Practice on Food Allergen Management for Food Business Operators, CXC 80-2020, adopted in 2020, covers the supply chain from primary production to retail and food service. It names eight foods and food groups that cause most food allergy globally — cereals containing gluten, crustaceans, eggs, fish, milk, peanuts, soybeans and tree nuts — and it is deliberately explicit that the recognised list varies between countries, so an exporter must work out which list applies to the destination. It sets out controls, not thresholds. It tells a business how to prevent cross-contact; it does not tell it when a residual amount is small enough to stop worrying about.
The threshold half. In July 2026 the Codex Alimentarius Commission adopted guidelines on precautionary allergen labelling as an annex to the General Standard for the Labelling of Pre-packaged Foods, CXS 1-1985. The annex establishes 21 reference doses for IgE-mediated allergy and one for coeliac disease, and it defines the action level as:
Action level (mg total protein per kg of food) = reference dose (mg total protein) ÷ amount of food consumed (kg)
with the amount consumed established from the quantity reasonably expected to be eaten at a single sitting, preferably at the 50th percentile.
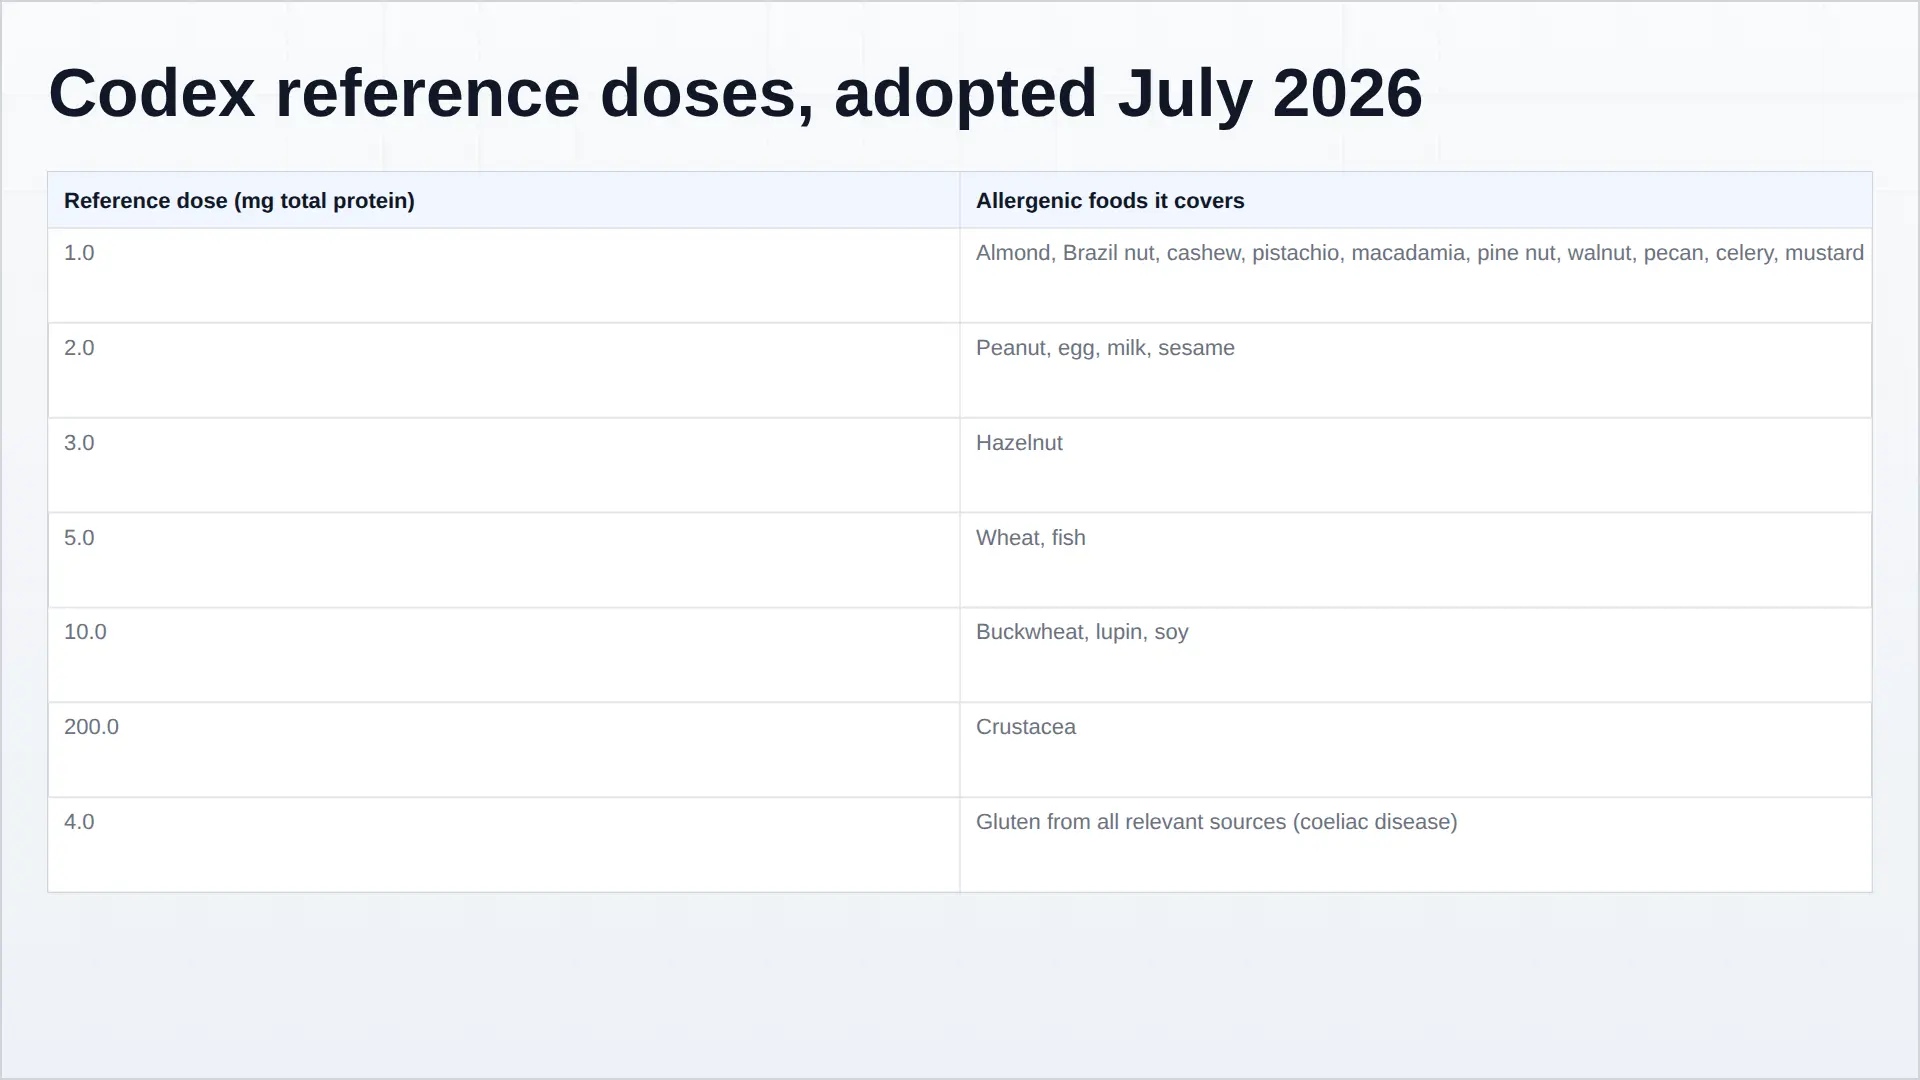
Three features of that formula do the commercial work.
It has a denominator. The same concentration in the same food is compliant or non-compliant depending on how much of it a person eats. A spice blend used as a seasoning carries a far higher permitted concentration than the identical blend used at 30 per cent inclusion in a snack, because the snack is eaten in a larger portion. An action level is therefore not a universal number for an allergen. It is a number per product, and every product needs its own calculation.
It runs both ways. Precautionary labelling is justified where unintentional presence cannot be mitigated to or below the action level, and should not be used where it can. That second clause is new in kind. It creates an obligation to demonstrate absence, and demonstrating absence requires sampling designed to find nothing rather than to catch something — more points, more composite samples, more occasions.
It has holes. The reference dose table has no row for rye, barley, oats, mollusc or sulphite, and the annex leaves it to national competent authorities to set a reference dose consistent with recognised principles where none is established. Every one of those gaps becomes a market-by-market difference in the action level, and a company selling into twelve countries has to hold twelve calculations rather than one.
The gluten provision is the sharpest illustration of why this cannot be treated as a look-up. The annex sets a reference dose of 4.0 milligrams of total gluten for coeliac disease, expressed as a dose. European law sets a limit of 20 milligrams of gluten per kilogram for the term “gluten-free” under Commission Implementing Regulation (EU) No 828/2014, expressed as a concentration. A dose and a concentration are not comparable quantities, and the annex says so directly: whether “gluten-free” may be used requires both parameters to be considered. It also adds a rule with immediate commercial consequence — where a precautionary statement for wheat, barley or rye is necessary, the term “gluten-free” must not be used at all. A product cannot be simultaneously gluten-free and carrying a may-contain for gluten, which retires a labelling position that a number of brands currently occupy.
One product, four markets, four thresholds
| Jurisdiction | Allergens requiring declaration | Precautionary labelling | Quantitative basis | Next scheduled change |
|---|---|---|---|---|
| Codex (international reference text) | 8 food groups in CXC 80-2020; 21 reference doses in the 2026 annex | Permitted above the action level, discouraged below it | Reference dose ÷ portion consumed | National adoption, no fixed date |
| European Union | 14 under Regulation (EU) No 1169/2011, Annex II | Not harmonised across member states | 20 mg/kg for gluten-free claims under Reg. (EU) No 828/2014 | Harmonising legislation listed for consideration in the fourth quarter of 2027 |
| United States | 9 major allergens, sesame since 1 January 2023 under the FASTER Act | Allergen advisory statements, not regulated as to level | None statutory | FDA meeting on allergen thresholds held February 2026 |
| United Kingdom | 14, plus labelling for non-prepacked food | FSA position on precautionary labelling criteria published | Threshold levels set within the FSA position | Alignment with the Codex annex under review |
In the United States the gap between declaration and precautionary practice has produced the single most instructive episode in this market. The FASTER Act made sesame the ninth major food allergen from 1 January 2023, and the Food and Drug Administration’s own consumer guidance records what happened next: some manufacturers changed their recipes, and there are now products containing small amounts of sesame that did not contain it before. Faced with choosing between proving a line clean and declaring the allergen outright, a number of businesses chose to add the allergen. The declaration requirement met the absence of a threshold, and adding was cheaper.
The recall statistics read at first as though the opposite happened. US PIRG’s annual tally found 320 American food recalls in 2025, of which 38.8 per cent were for undeclared allergens — by some distance the largest single cause. Milk accounted for 20.6 per cent of the allergen recalls, tree nuts 16.8, wheat 7.6, eggs 6.1 and sesame 5.3, with 25.2 per cent involving several allergens at once. PIRG’s previous edition recorded 101 allergen recalls in 2024, 34 per cent of that year’s total, down from 154 and nearly half in 2023 — and noted that sesame-only recalls fell from 13 to 7.
Both things are true at once, and together they describe the market precisely. Sesame failures fell because sesame stopped being undeclared — in many cases by putting it into the product. The allergen did not leave the food. It left the recall statistics. That is what a declaration-only regime produces, and it is the strongest available argument for the Codex approach: a threshold is not a bureaucratic refinement, it is the difference between a label that informs and a label that discharges liability.
The United Kingdom shows the other side of the same coin. Food Standards Agency alert data records 85 allergy alerts among 142 recall events in 2025, roughly 61 per cent of everything recalled, against 55 recalls for microbiological and other safety problems combined. A product that is entirely safe for most of the population is withdrawn because its label omits one of fourteen allergens. No other failure mode in food manufacturing converts a paperwork error into a public withdrawal at that rate.
Why regulatory cadence, not prevalence, is the demand engine
Food allergy prevalence is roughly stable on any timescale relevant to an eight-year forecast. Regulatory cadence is not. In the three years to 2026 the Codex allergen framework moved from a code of practice with no numbers to an annex with 21 reference doses and a defined action level; the European Union put harmonised precautionary labelling legislation on a 2027 timetable; the FDA convened a threshold meeting in February 2026; and the UK published a precautionary labelling position with threshold levels. Each of those events obliges a food business to re-derive an action level, revalidate a method against it, and rewrite the risk assessment that sits behind the label.
That is the demand engine this forecast is built on, and it is why the control layer grows at 14.95 per cent against 7.09 per cent for testing. The testing follows the paperwork, not the other way round. Pheonix’s judgement, stated as judgement: the single largest risk to this forecast is not that the thresholds fail to arrive but that they arrive at different levels in different markets, which raises the cost of compliance without proportionally raising the volume of testing — a company can satisfy four regimes with one conservative action level, and many will.