
Global Flexible Packaging Market Report, Size, Share and Forecast 2026–2033: Paper and Bio-Based Structures Take 37 Per Cent of the Growth on 25 Per Cent of the Market
Flexible packaging is a USD 268,000 million market across 41.50 million tonnes in 2025, growing to USD 370,070 million across 53.63 million tonnes in 2033 at 4.12 per cent in value and 3.26 per cent in tonnage. Realisation rises from USD 6,458 to USD 6,900 a tonne — 0.83 per cent a year, and every one of the five substrate lines contributes to it.
- The growth is migrating off plastic. Paper and paperboard flexibles plus cellulose and bio-based structures are 24.7 per cent of the 2025 market and take 37.1 per cent of the USD 102,070 million increment. Polyolefin films are 44.4 per cent of the market and take 35.7 per cent. Paper grows 5.62 per cent, polyolefin 3.40.
- Price, not mix, explains the realisation gain. Held at 2025 prices, 2033 tonnage would be worth USD 346,320 million; the model has USD 370,070 million. The USD 23,750 million difference is price, and all five lines gain between 0.77 and 1.33 per cent a year. In the rigid container market not one substrate gained a cent.
- The value chain is a film purchase with a printing business attached. 55 per cent of revenue is bought substrate, 31 per cent is the converter's own conversion cost, and 14.1 per cent is EBIT — the margin Amcor's Flexibles segment reported in the quarter to June 2025 on combined volumes that fell 1.5 per cent. Roughly half of Amcor's USD 650 million Berry synergy programme is procurement, which is the value chain stated as a corporate strategy.
- Consolidation is the response, and it is now complete at the top. Amcor completed its all-stock combination with Berry Global on 30 April 2025; CD&R agreed to buy Sealed Air at USD 10.3 billion enterprise value, shareholders approved on 25 February 2026, closing expected mid-2026. Sealed Air's USD 5,360 million of 2025 net sales is 2.0 per cent of this market. Nobody consolidates a fragmented market into a leader; they consolidate it into a purchasing position.
- Regulation is the binding constraint, and the arithmetic does not close yet. European polyolefin flexibles need about 2.5 million tonnes of post-consumer recyclate by 2030; supply is around 1.5 million tonnes. Recycling input capacity must go from 2.4 million tonnes in 2024 to 7.4 million in 2030. Even on favourable assumptions, only about 25 per cent of flexibles recycle back into flexibles in 2030, or 42 per cent including open-loop applications — and 80 per cent of mechanical recyclate demand lands in stretch film, shrink film, refuse sacks and heavy-duty bags, not in the food-contact laminate that generates the waste.
Foodservice and QSR is the fastest end use at 5.68 per cent, but at 9.5 per cent of the market it is adding USD 14,140 million, and most of that is delivered-food volume rather than substitution. The substitution into foodservice is the film around the cup, not the cup.
Paper and bio-based structures take 37 per cent of the growth on 25 per cent of the market
The global flexible packaging market is USD 268,000 million across 41.50 million tonnes in 2025, reaching USD 370,070 million across 53.63 million tonnes in 2033 — 4.12 per cent in value, 3.26 per cent in tonnage, and 0.83 per cent a year in realisation per tonne, from USD 6,458 to USD 6,900.
Those are quiet numbers for a format that has spent thirty years taking share from every rigid alternative. The number that matters is underneath them. Paper and paperboard flexibles plus cellulose and bio-based structures are USD 66,200 million — 24.7 per cent of the 2025 market — and they absorb USD 37,870 million of the USD 102,070 million increment, which is 37.1 per cent of the growth. Polyolefin films are 44.4 per cent of the market and take 35.7 per cent of the growth. For the first time in this packaging dataset, the material doing the substituting is not a polymer film, and it is not a lighter polymer film either.
| Metric | 2025 | 2033 | Change | Per year |
|---|---|---|---|---|
| Market value | USD 268,000m | USD 370,070m | +USD 102,070m | 4.12% |
| Volume | 41.50 Mt | 53.63 Mt | +12.13 Mt | 3.26% |
| Realisation | USD 6,458/t | USD 6,900/t | +USD 442/t | 0.83% |
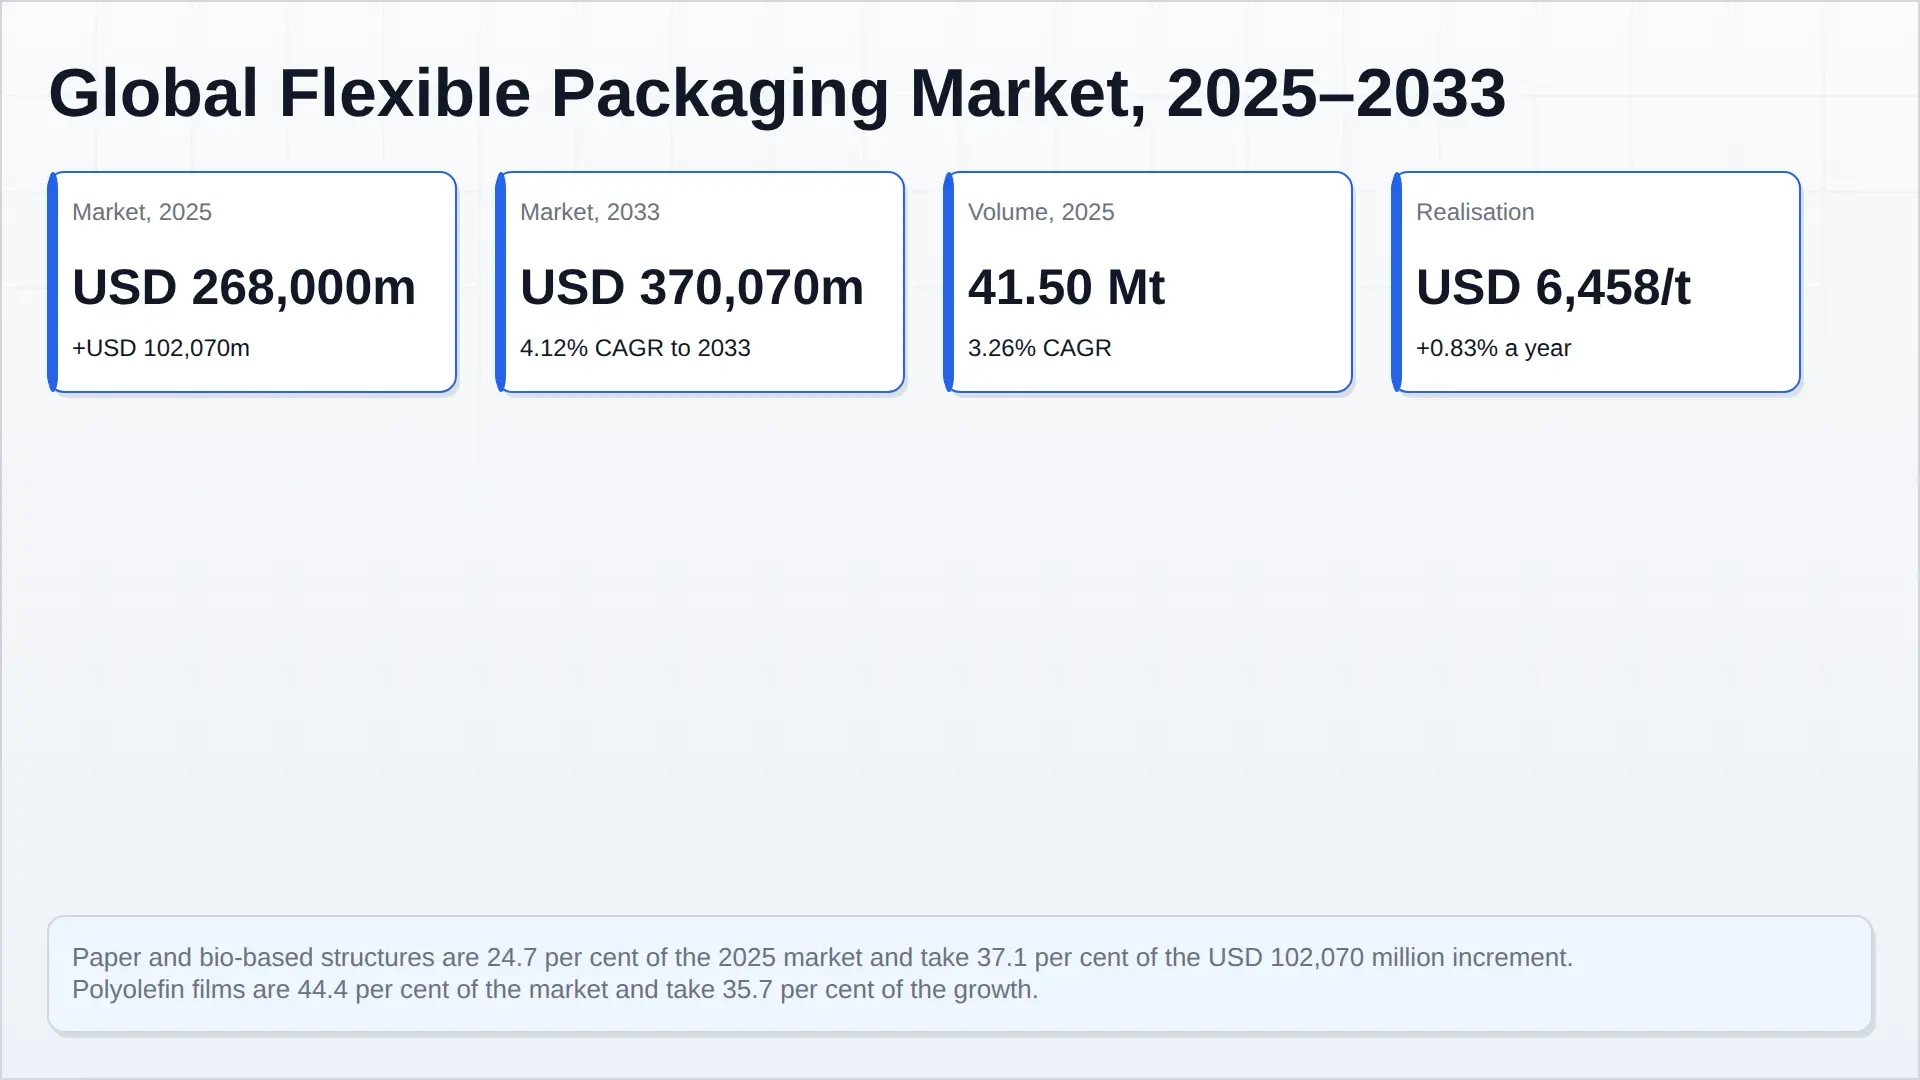
Realisation is value divided by tonnage. At USD 6,458 a tonne, flexible is the most expensive packaging format in this dataset per tonne and comfortably the cheapest per unit of product protected: the paper cup market clears 470.0 billion units for USD 15,340 million, which is 3.26 cents each, while a film carries its share of a retail pack at a fraction of that in mass and cost. The two facts are the same fact. Flexible wins on grams, and grams are what the price is made of.
Where the value sits, and where the growth sits
| Substrate | 2025 value (USD m) | 2025 volume (Mt) | USD/t | 2033 value (USD m) | 2033 volume (Mt) | USD/t | Value CAGR | Share of increment |
|---|---|---|---|---|---|---|---|---|
| Polyolefin films — PE, PP, mono and laminated | 118,900 | 22.10 | 5,380 | 155,300 | 27.15 | 5,720 | 3.40% | 35.7% |
| Polyester and other polymer films — PET, PA, EVOH, metallised | 60,300 | 6.85 | 8,803 | 83,800 | 8.81 | 9,512 | 4.20% | 23.0% |
| Paper and paperboard flexible | 49,700 | 7.90 | 6,291 | 76,960 | 11.50 | 6,692 | 5.62% | 26.7% |
| Aluminium foil and foil laminates | 22,600 | 1.95 | 11,590 | 26,900 | 2.18 | 12,339 | 2.20% | 4.2% |
| Cellulose, bio-based and other | 16,500 | 2.70 | 6,111 | 27,110 | 3.99 | 6,794 | 6.40% | 10.4% |
| Total | 268,000 | 41.50 | 6,458 | 370,070 | 53.63 | 6,900 | 4.12% | 100% |
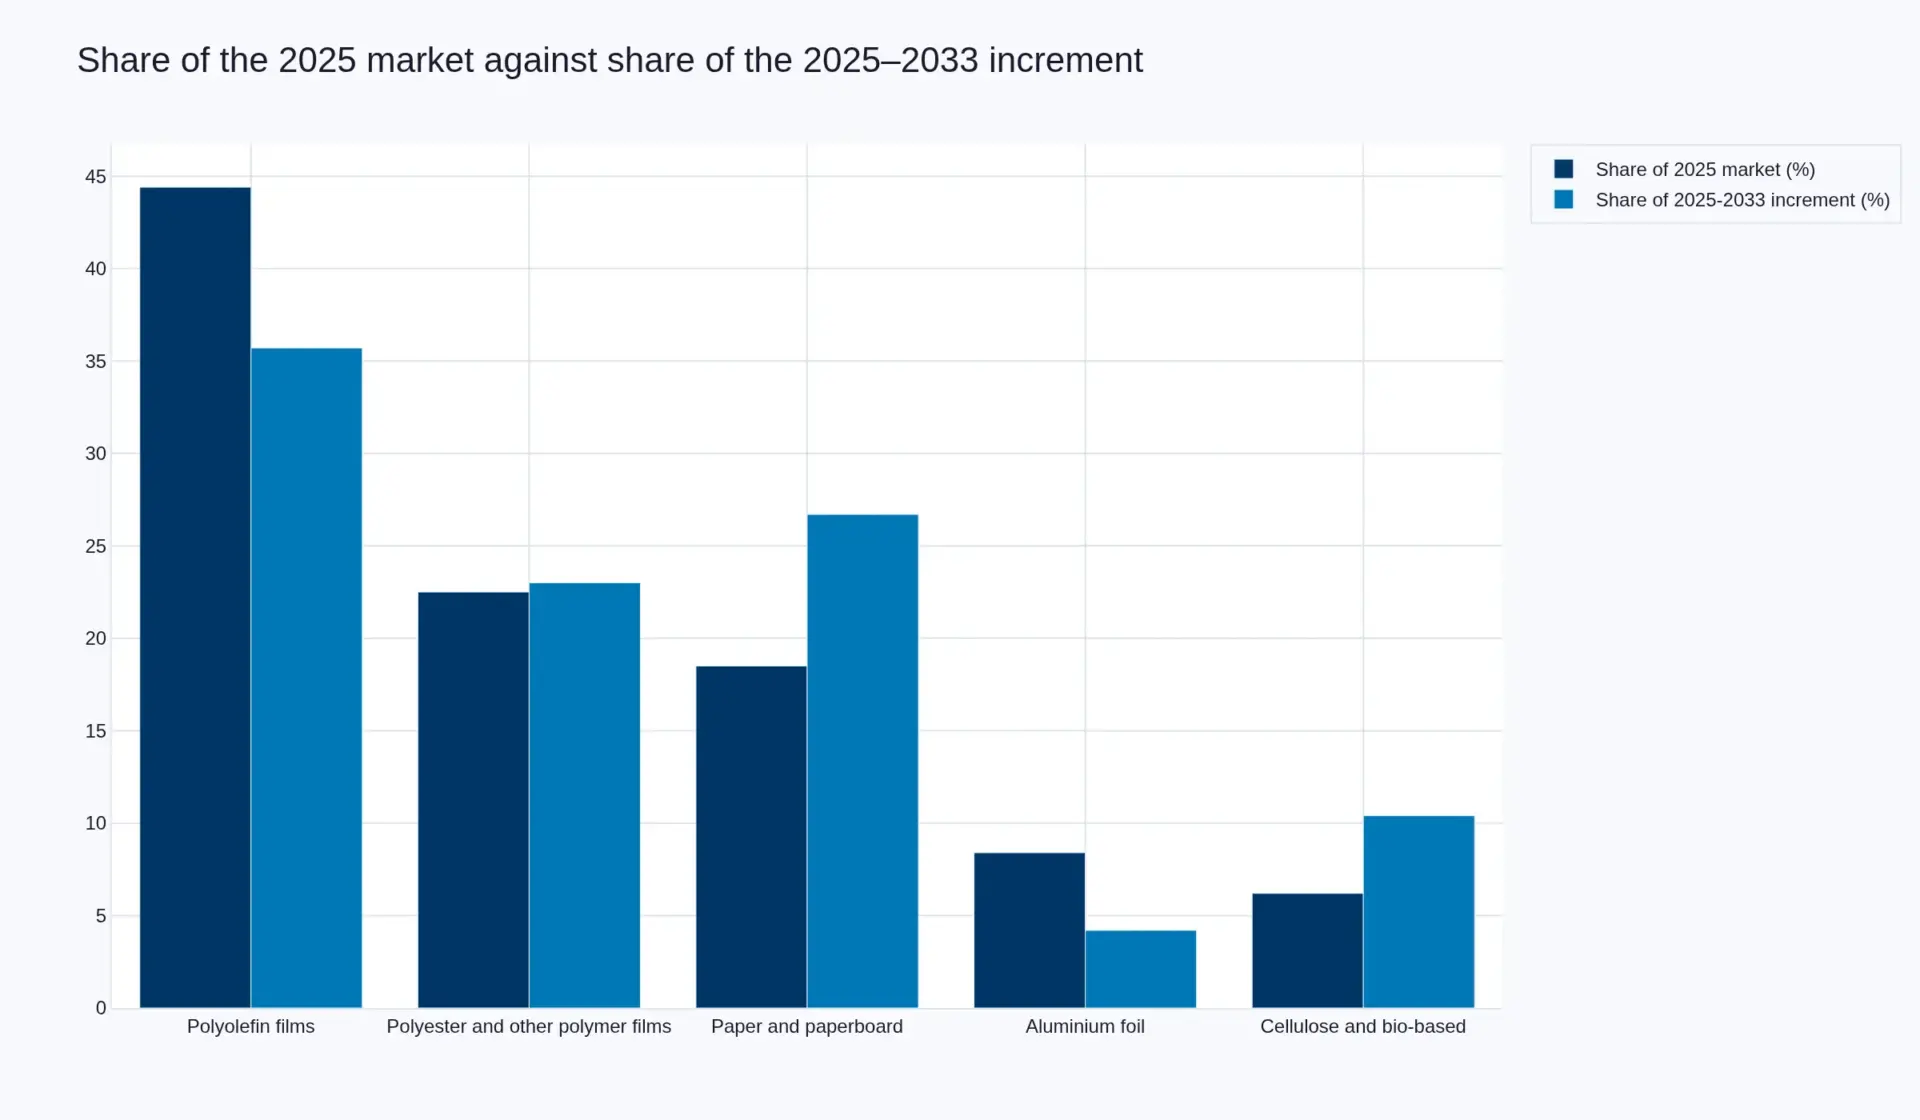
Three things fall out of that table. Polyolefin films lose 2.4 points of share despite still taking a third of the growth. Aluminium foil, the highest-realisation substrate at USD 11,590 a tonne, grows 2.20 per cent and loses 1.2 points — a retort and pharmaceutical material that is structurally expensive and structurally hard to displace, which is why it grows slowest rather than because it shrinks. And paper plus bio-based moves from 24.7 per cent to 28.1 per cent of the market in eight years, on a growth rate 65 per cent faster than polyolefin.
End use: foodservice is the fastest of six, and it is the smallest
| End use | 2025 (USD m) | Share | 2033 (USD m) | Share | CAGR |
|---|---|---|---|---|---|
| Food retail | 107,200 | 40.0% | 145,700 | 39.4% | 3.91% |
| Beverage | 28,140 | 10.5% | 36,450 | 9.8% | 3.29% |
| Foodservice and QSR | 25,460 | 9.5% | 39,600 | 10.7% | 5.68% |
| Healthcare and pharmaceutical | 32,160 | 12.0% | 48,600 | 13.1% | 5.30% |
| Personal care and home care | 37,520 | 14.0% | 49,700 | 13.4% | 3.58% |
| Industrial, agricultural and other | 37,520 | 14.0% | 50,020 | 13.5% | 3.66% |
| Total | 268,000 | 100% | 370,070 | 100% | 4.12% |
Foodservice and QSR is 9.5 per cent of the market and grows fastest of the six at 5.68 per cent, adding USD 14,140 million. The substitution boundary is physical rather than commercial, and it is worth stating plainly because it is the question this report was asked to answer. Flexible substitutes into foodservice wherever the product is a solid in a wrapper or a fluid in a sealed sachet — sandwich flow-wrap, sauce sachets, condiment pouches, cutlery film, bakery bags, and the lid film lidding a rigid container. It does not substitute where the package has to hold liquid standing on a table. The 470.0-billion-unit paper cup market and the 246.0-billion-unit rigid container market are not at risk from film; the film is the layer on top of them. Two thirds of the flexible foodservice increment is therefore volume growth in delivered food, not share taken from another substrate, and that is a different and safer kind of growth than the rest of this report.
What the 0.83 per cent is: price, not mix
Strip the mix out. Grow the 2025 tonnage to 53.63 million tonnes at the 2025 blended realisation of USD 6,458 and the market is worth USD 346,320 million in 2033. The model has it at USD 370,070 million. The gap is USD 23,750 million, 6.4 per cent of the 2033 market, and unlike the rigid container market — where every substrate was held at a flat price and the entire 6.2 per cent came from mix — here mix explains almost none of it. Every one of the five substrate lines gains realisation: 0.77 per cent a year on polyolefin, 0.97 on polyester, 0.77 on paper, 0.78 on foil, 1.33 on bio-based.
That is what a business with a 55 per cent purchased-material content and a 31 per cent conversion content does when it is squeezed. It re-prices. The converter buys film, prints it, laminates it, slits it and sells the structure at a margin that has held at 14.1 per cent through a year in which its volumes fell. Price is the only lever left, and regulation is about to add cost to the structure faster than resin deflation can remove it.
Four numbers that frame everything that follows
- 55 per cent of a flexible converter's revenue is purchased film, resin and foil. Roughly half of the value of the Amcor–Berry combination is a purchasing programme.
- 5 per cent by weight is the CEFLEX limit on adhesives and coatings in a recyclable polyolefin structure. The entire barrier function of a modern food laminate has to live inside that allowance.
- 2.5 million tonnes of post-consumer recyclate is what European polyolefin flexibles need by 2030 to satisfy the PPWR recycled-content targets. The supply is about 1.5 million tonnes.
- 2.4 to 7.4 million tonnes is the recycling input capacity build Europe needs between 2024 and 2030 — a 3.1-fold increase, on assets that take two and a half to four and a half years from decision to operation.
Articles on this market
- Fifty-Five Per Cent of a Flexible Packaging Converter's Revenue Is Film Somebody Else Made — the cost stack reconciled to Amcor's 14.1 per cent flexibles EBIT margin, and why half of a USD 650 million synergy programme is procurement.
- Europe Needs 2.5 Million Tonnes of Flexible Recyclate in 2030, Has About 1.5, and the Plants Take Four Years — the capacity ladder, the twenty lines a year it implies, and why 80 per cent of the recyclate demand lands in refuse sacks rather than food film.
Table des matières
Paysage concurrentiel
Competitive landscape: two USD 10 billion mergers and no leader
This is a fragmented market in the literal sense that the largest disclosed participants hold low single-digit shares of it, and the evidence is arithmetic rather than assertion. Sealed Air reported FY2025 net sales of USD 5,360 million against a USD 268,000 million market: 2.0 per cent. Mondi’s Flexible Packaging segment reported revenue of about EUR 3.9 billion with underlying EBITDA of EUR 583 million and a 14.8 per cent margin — roughly 1.6 per cent of the market at EUR/USD 1.08. Amcor does not disclose a flexibles revenue line that divides cleanly against this base, but its Flexibles segment reported adjusted EBITDA of USD 450 million in the quarter to June 2025 at a 14.1 per cent EBIT margin.
| Company | Latest disclosed result | Basis | Measure | Share of USD 268,000m |
|---|---|---|---|---|
| Amcor plc, including Berry Global from 30 April 2025 | Flexibles adjusted EBITDA USD 450m; 14.1% EBIT margin; combined volumes −1.5% | Segment, Q4 FY2025 | Margin and volume | not disclosed |
| Sealed Air Corporation | Net sales USD 5,360m; adjusted EBITDA USD 1,134m, 21.2% | Group, FY2025 | Value | 2.0% |
| Mondi Group | Flexible Packaging revenue ~EUR 3.9bn; underlying EBITDA EUR 583m, 14.8% | Segment, 2025 | Value | 1.6% |
| Constantia Flexibles | Private; held by One Rock Capital | Group | — | not disclosed |
Why the margins cluster where they do
Amcor’s flexibles EBIT margin is 14.1 per cent. Mondi’s flexibles underlying EBITDA margin is 14.8 per cent, which is a pre-depreciation measure and therefore not comparable line for line with Amcor’s figure — a distinction worth holding onto, because the two numbers are routinely quoted as if they described the same thing. What can be said without qualification is that both sit in a narrow band well below the margins that brand owners and film producers earn on either side of them, and that the band is set by the structure described in the value chain chapter: the converter buys 55 per cent of its revenue and converts the other 45.
There is no participant large enough to set price. There is no participant integrated backward into resin. The largest film producers — the BOPP and BOPET specialists — sit upstream of the converters and sell to all of them. That is the structural reason this industry has consolidated twice in fourteen months and still has no leader.
What the volume line tells you that the margin line does not
Amcor’s combined flexibles volumes fell about 1.5 per cent in the June 2025 quarter. The detail matters more than the aggregate: healthcare, protein including meat and dairy, and liquids each grew low to mid single digits, pet care was strong, and those gains were more than offset by softer demand in unconverted film, snacks and confectionery, and home and personal care. Then, for fiscal 2026, management guided to broadly flat volumes and said explicitly that it was not factoring in a meaningful rebound in consumer demand.
Read that against the model. A market growing 3.26 per cent in tonnage, in which the largest converter guides flat, is a market where the growth is being captured by converters below the disclosed line — in Asia, in the mid-tier European mono-material specialists, and in paper. Unconverted film is the tell: it is the least differentiated product in the market, it is the first to lose volume when brands shorten runs and reformulate for recyclability, and it is where the incumbent’s weakness is largest.
The two deals, and what they buy
- Amcor and Berry Global completed on 30 April 2025 for a purchase consideration of USD 10.4 billion. The strategic logic was stated as complementarity — Berry brings a rigid and closures franchise and a North American footprint, Amcor brings film and laminating depth and a European and Latin American base. The financial logic is procurement, and management has said so: about half of the committed USD 650 million synergy programme by fiscal 2028 is purchasing.
- CD&R and Sealed Air: a definitive agreement announced 17 November 2025 at an enterprise value of USD 10.3 billion, USD 42.15 per share in cash. Stockholders adopted the merger agreement on 25 February 2026. Closing is expected mid-2026 subject to remaining regulatory clearances, after which Sealed Air leaves the New York Stock Exchange.
Two of the four largest flexible converters in the world have changed ownership inside fourteen months, and one of them is leaving public markets entirely. That is not a growth story. It is a margin story: a 14 per cent EBIT business with a 55 per cent purchased-material content and a 4.6 per cent depreciation charge is worth more to a buyer who can renegotiate the first number and consolidate the second than it is to a public market marking it on volume.
Chaîne de valeur
Value chain: 55 per cent of the price is film somebody else made
A flexible converter buys film, prints it, laminates it, slits it, seals it and ships it. Rebuilt against the blended realisation of USD 6,458 a tonne and reconciled to the 14.1 per cent EBIT margin Amcor’s Flexibles segment reported in the June 2025 quarter, the stack looks like this.
| Line | USD per tonne | Share of price | What it is |
|---|---|---|---|
| Purchased film, resin and foil | 3,555 | 55.1% | PE, PP, PET, PA, metallised and foil substrates bought from film producers and resin suppliers |
| Inks, adhesives and barrier coatings | 385 | 6.0% | The layer that does the work and the layer regulation restricts |
| Energy and direct conversion labour | 615 | 9.5% | Printing, lamination, slitting, pouching, sealing |
| Depreciation on print, lamination and slitting assets | 300 | 4.6% | The machine content, and it is small |
| Freight, warehousing and distribution | 190 | 2.9% | Converted rolls and pouches are light and bulky |
| SG&A, R&D and print waste | 505 | 7.8% | Including the make-ready and trim loss inherent to short runs |
| EBIT | 908 | 14.1% | Reconciled to Amcor Flexibles, Q4 FY2025 |
| Realisation | 6,458 | 100% | Market value divided by market tonnage |
The converter’s own contribution — inks, energy, labour, depreciation, freight and overhead — is 31 per cent of the price. Everything else is bought. This is precisely the opposite of the moulded fibre business, where recovered paper and drying energy are 12.9 per cent of realisation and 87 per cent is the machine, the hall, the people, the tooling and the truck. Fibre converting is a manufacturing business that happens to buy pulp. Flexible converting is a purchasing business that happens to print.
The proof is in the merger maths
You do not have to accept the cost stack on our reconstruction, because Amcor has told the market what it thinks the value is in. The company has committed to USD 260 million of synergies in fiscal 2026 rising to USD 650 million by fiscal 2028, and described the composition directly: procurement savings make up about 50 per cent of the committed synergies. Two businesses with roughly USD 25 billion of combined sales believe that the single largest source of value in combining them is buying film more cheaply.
That is the value chain, stated by the largest participant, as a target. It also explains the shape of the consolidation in the previous chapter: in a business where 55 cents of every revenue dollar is bought, scale is not a route to brand equity or pricing power. It is a route to a better resin contract.
Where the three instruments collide
The structure that carries the value is the structure regulation restricts. A food laminate earns its price from barrier — oxygen, moisture, light, aroma — delivered by 3 to 12 microns of EVOH, metallised PET, aluminium foil or PVDC sitting inside 40 to 120 microns of total film. The design rules for recyclability are expressed as a mass limit: adhesives and coatings no more than 5 per cent by weight, PA6 in a PE structure no more than 35 per cent and then only with specific tie layers. Barrier is a functional requirement measured in cubic centimetres per square metre per day. Recyclability is a mass threshold measured in percentage points. They are not the same axis, and the industry has spent four years discovering that the second one is easier to legislate than the first is to engineer.
Add the third instrument and the squeeze is complete. EPR fees are levied per tonne and modulated by recyclability grade, so the producer pays more for the structure that performs better and less for the structure that recycles better. The brand owner, who chooses the structure, does not pay the fee directly. The converter, who does, does not choose the structure. This is the same misalignment this dataset identified in rigid containers, where a per-tonne fee penalised the heavier compliant substitute; in flexibles the fee penalises the multi-material structure that the application actually requires.
Activité d'investissement
Investment activity: buying scale because you cannot buy price
There are two completely separate capital stories in flexible packaging and they are moving in opposite directions. Public-market capital is leaving the converting layer. Private and strategic capital is entering the recycling layer. Neither is being deployed at the scale the second one needs.
Out of the converting layer
- Amcor and Berry Global — completed 30 April 2025 as an all-stock combination. Deleveraging from 3.5x at the June 2025 year end toward 3.1–3.2x over the following twelve months, before any asset-sale proceeds.
- CD&R and Sealed Air — USD 10.3 billion enterprise value, USD 42.15 per share, announced 17 November 2025, stockholder approval 25 February 2026, closing expected mid-2026. A 21.2 per cent adjusted EBITDA margin business taken private.
- Amcor portfolio review — approximately USD 2.5 billion of annual sales identified as less aligned with the go-forward portfolio, including the USD 1.5 billion North American beverage business. Ten further businesses make up the balance, spread across both legacy companies.
Amcor’s own capital numbers describe a business in transition rather than expansion: capex of USD 580 million in fiscal 2025, guided to USD 850–900 million in fiscal 2026, with free cash flow guided to roughly double from USD 926 million to USD 1.8–1.9 billion. Most of that cash is earmarked for deleveraging and integration, not for new film capacity. When the largest converter in the market guides flat volumes and prioritises balance sheet repair, the industry is not adding primary capacity at a rate that matches a 3.26 per cent tonnage market.
Into the recycling layer, at the wrong speed
The investment the regulation requires is upstream of the converters and it is enormous. CEFLEX modelling puts the requirement for flexible polyolefin recycling input capacity at 2.4 million tonnes in 2024, 7.4 million tonnes in 2030 and 10 million tonnes in 2035.
| Milestone | Flexible polyolefin recycling input capacity | Implied addition |
|---|---|---|
| 2024 | 2.4 Mt | — |
| 2030 | 7.4 Mt | +5.0 Mt in six years, roughly 830,000 t a year |
| 2035 | 10.0 Mt | +2.6 Mt in five years, roughly 520,000 t a year |
The constraint is not capital availability or technology. It is time, and the arithmetic is unforgiving. CEFLEX puts a recycling plant at one to two years for permitting, a further one to two years for construction, and about six months to become operational — a decision-to-output lag of two and a half to four and a half years. A plant committed in 2026 is producing in 2029 at the earliest and 2030 at the latest. Anything not committed in the next eighteen months cannot count toward the 2030 target. Five million tonnes of input capacity over six years is roughly 830,000 tonnes a year of new plant, which at a representative 40,000-tonne line is twenty new lines a year, every year, for six years, across the whole of Europe.
The same modelling identifies 12 distinct PCR quality grades and nine complementary recycling pathways needed to produce them — six mechanical, two physical or delamination, one chemical. That is the investment thesis stated as a portfolio: not one technology at scale, but nine technologies each sized to a different quality of output, in a market where the buyer of last resort does not yet exist for the highest grades.
Why the money has not moved faster
Three reasons, and all of them are visible in the disclosed numbers. Recyclers need feedstock certainty and the feedstock is in residual waste: CEFLEX data puts up to 50 per cent of flexible packaging — and nearly 100 per cent in some countries — in the residual stream. Recyclers need offtake and the offtake is regulated rather than commercial: the 2.5 million tonnes of 2030 demand exists because the PPWR creates it, not because a brand owner has signed for it at a price. And recyclers need the quality question resolved before they build, which is why CEFLEX has spent two years testing 600 samples across 55 materials to generate 1,760 data points on sortability and mechanical recyclability. You cannot underwrite a plant against a specification that is still being written in a CEN committee.
Technologie et innovation
Technology and innovation: the barrier is the product and the barrier is the problem
A high-barrier food laminate is 40 to 120 microns thick and contains five to nine functional layers. The outer web carries the print and the stiffness. The barrier layer carries the shelf life. The sealant layer carries the seal. They are different polymers because no single polymer does all three, and they are bonded with adhesives because you cannot coextrude a PET and a PE through one die at commercial line speed. The structure is the engineering achievement, and the structure is the recycling problem.
The most useful peer-reviewed measurement of how deep that problem runs comes from a Fraunhofer IVV study of European polyethylene-containing flexible waste streams. Across polyolefin sorting fractions, the material is 85 to 90 per cent PE — the sort is working. But within food packaging specifically, 63 to 84 per cent of structures are multi-layer and 50 to 70 per cent are multi-material. The sort cannot fix a structure that was never separable, and mechanical recycling cannot restore a barrier that was designed to resist exactly that kind of attack.
The design rules, as numbers
CEFLEX’s Designing for a Circular Economy guidelines are the most operational statement of what a recyclable flexible structure is allowed to be in Europe, and they are written as thresholds rather than principles:
| Element | Condition for compatibility with polyolefin mechanical recycling |
|---|---|
| Adhesives and coatings | No more than 5% by weight of the structure |
| Polyamide in a PE structure | No more than 35% by weight, and only with specific tie layers |
| Barrier layers, metallisation, inks, pigments, fillers | Material-specific compatibility thresholds, updated in 2025 with test evidence replacing expert opinion |
| Sortability | Must be identifiable by near-infrared, eddy current and metal detection |
| Base design | Mono-PE, mono-PP or mixed polyolefin |
The base design rule is the one that bites. Europe’s consumer flexible market is about 8.4 million tonnes a year, and CEFLEX estimates 50 to 60 per cent of it is already mono-PE, mono-PP or mixed polyolefin. That is a better starting position than the recycling rates suggest, and it means the redesign programme is not starting from zero — early adopters using the guidance have identified redesign opportunities across 20 to 40 per cent of their SKUs. It also means 40 to 50 per cent of the market is not mono-polyolefin and has no route to mechanical recyclability without changing what it is made of.
MDO-PE, and what it costs to get there
The technology the industry is betting on is machine-direction orientation of polyethylene. Stretching PE in the machine direction gives it stiffness, barrier and clarity that plain blown PE does not have, which lets an MDO-PE web replace the oriented polyester print web in a laminate — and if the sealant is also PE, the whole structure becomes mono-PE and passes the design test.
Walki and Dow demonstrated a commercial prototype in June 2026: an MDO-PE pouch with a matte finish for frozen food, printed, laminated and finished on Walki Plasbel’s lines in Murcia before evaluation at Dow’s Tarragona studios. The matte finish is not a cosmetic detail. MDO films come out glossy, brand owners in frozen and prepared foods want matte, and until that was solved the recyclable structure lost the shelf. Frozen food is the right beachhead because the freezer cabinet, not the ambient shelf, sets the barrier requirement.
What MDO-PE does not do is replace aluminium foil, metallised PET or EVOH in the applications that need an oxygen transmission rate below about 1. It improves the property envelope of PE. It does not make PE into a barrier polymer. That is why the honest reading of the technology pipeline is a substitution at the margin of the food market — frozen, chilled, dry goods, household — and not a replacement of the retort pouch, the coffee capsule lid or the pharmaceutical blister lidding, which is where aluminium’s 2.20 per cent growth and USD 11,590-a-tonne realisation comes from.
The chemistry nobody has solved at line speed
Three routes compete to put barrier back into a mono-material structure, and all three have the same defect: the thing that carries the barrier is not a polyolefin. Vacuum-deposited aluminium oxide or silicon oxide leaves a ceramic layer nanometres thick that does not disturb a PE sort but does disturb a recycler. Barrier coatings — acrylic, PVOH, EVAL dispersions — perform well, and a dispersion is still a polymer. Water-based barrier coatings are the most promising environmentally and the hardest to run at 300 metres a minute without pinholes. Every one of these is a 5-per-cent-by-weight problem under the design rules, and every one of them is the difference between a 21-day and a 120-day shelf life. The market has not decided which shelf life it is prepared to give up, which is why the paper substitution in this report’s headline is happening in dry goods and produce first.
Risque de marché
Market risk: three scenarios and three falsifiers
The base case is USD 268,000 million in 2025 to USD 370,070 million in 2033 at 4.12 per cent. The three scenarios below move the two variables that matter — the rate at which paper and bio-based structures take share from polyolefin, and the cost at which recycled content is delivered into the structure.
| Scenario | Value CAGR | 2033 market | What has to be true |
|---|---|---|---|
| Conservative | 3.10% | USD 342,140m | Paper substitution accelerates into food contact and takes 45% of the increment; PCR carries a 25–40% cost premium converters cannot pass through; mono-PE redesign stalls at the 20–40% SKU opportunity already identified; foodservice growth is absorbed by rigid formats |
| Base | 4.12% | USD 370,070m | Paper and bio-based take 37.1% of the increment; realisation gains 0.83% a year on every line; recycled content is delivered at a modest premium and passed through; the 2030 capacity build is late but not absent |
| Optimistic | 5.00% | USD 395,958m | MDO-PE and barrier-coated mono-PE convert the frozen and chilled food market to recyclable mono-material at line speed; foodservice delivers 7%+ growth on delivered-food volume; healthcare flexibles hold 5.3%+ on biologics and injectables |
Sensitivities
- One point on polyolefin growth is USD 16,000 million of 2033 value. Polyolefin is 42 per cent of the market; a 1.0-point swing in its 3.40 per cent rate moves the 2033 total by roughly 4.3 per cent.
- The realisation line is worth more than the volume line. Holding tonnage at base and removing the 0.83 per cent annual realisation gain takes USD 23,750 million off 2033 — twice the effect of a 0.5-point shortfall in tonnage growth.
- Foodservice is small but leveraged. At 9.5 per cent of the market, a 2.0-point swing in its 5.68 per cent rate moves the total by about USD 1,500 million. It is the fastest-growing end use and the least consequential to the total, which is worth remembering before anyone builds a thesis on it.
Four risks that would change the number
1. The paper substitution gives up barrier and the bill arrives as food waste. A paper flexible structure without a plastic coating has a fraction of the moisture and oxygen barrier of a metallised laminate. Where the product is dry goods, produce or a bakery item, that costs nothing. Where the product is coffee, crisps, cheese or pet food, it costs shelf life, and shelf life lost is food wasted — which is a worse environmental outcome than the plastic it replaced and, increasingly, a reportable one. The regulatory framework has not yet priced that trade, and when it does the paper share of the increment will be revised down.
2. The recyclate premium lands on the converter, not on the brand. The 2.5 million tonne requirement is created by law; the price at which it clears is not. Converters buy 55 per cent of their revenue as material and sell into contracts that reprice annually with a lag. A 25–40 per cent premium on 30 per cent of the material content is a 7–12 per cent cost increase on the largest line in the stack, against a 14.1 per cent EBIT margin. That is not a pass-through; that is a margin event.
3. Two leveraged consolidations in fourteen months. Amcor is deleveraging from 3.5x and guiding flat volumes; Sealed Air is being taken private at USD 10.3 billion by a buyer who will want the 21.2 per cent EBITDA margin defended. Both will be managing a balance sheet and an integration in the exact years the regulation requires them to invest in recyclable structures and recycled content. Consolidation creates the purchasing power to absorb the recyclate premium and simultaneously removes the balance-sheet freedom to redesign the product.
4. Collection reform is a national competence, and the variance is nine-fold. Flexible packaging capture ranges from 18.9 per cent of the recyclables stream in Germany to 1.3 per cent in the UK. The PPWR sets the target; the member states set the bin. Any forecast that assumes European collection harmonisation by 2030 is assuming something no instrument in force requires.
Three falsifiers
1. If committed European flexible recycling input capacity passes 4.5 million tonnes by the end of 2027, the 2030 shortfall becomes a price problem rather than a capacity problem, the recyclate premium compresses faster than this report assumes, and the paper substitution loses its cost rationale. We would expect to see it in announced, permitted and funded lines rather than in pledges — a distinction the sector has not been careful about. This thesis is wrong if the permitted pipeline triples inside two years.
2. If a mono-PE structure demonstrates an oxygen transmission rate within 1.5 times that of a metallised PET laminate at commercial line speed and commercial price, the 63–84 per cent multi-layer share is a design failure rather than a physical constraint, the redesign opportunity is the whole market rather than 20–40 per cent of SKUs, and the paper share of the increment falls instead of rising. This thesis is wrong if mono-PE barrier film arrives in frozen and ambient food at scale before 2030.
3. If Amcor’s flexibles volumes return to growth in fiscal 2026 and 2027 without giving back price, the flat guidance was cyclical destocking and not a format maturing, the 3.26 per cent tonnage forecast is too low, and the realisation gain is a cyclical recovery rather than a structural repricing. This thesis is wrong if two consecutive quarters of positive combined flexibles volume arrive with the 14.1 per cent margin intact.
Two of the three falsifiers are observable in public disclosures inside eighteen months. That is the test of whether this is a forecast or a story.
Paysage réglementaire
Regulatory landscape: 2.5 million tonnes that do not exist
Flexible packaging is the format where the European Packaging and Packaging Waste Regulation bites hardest, because it is the format with the lowest recycling rate, the highest multi-material share, and the highest ratio of surface area to mass — which is to say, the worst capture characteristics in a kerbside sort and the least material per unit of waste-handling cost.
| Milestone | Requirement | Consequence for flexibles |
|---|---|---|
| 2025 | PPWR enters into force; CEN design-for-recyclability standards established | The design rules become a procurement document, not a guideline |
| 2027 onward | Delegated acts on design for recycling and recyclability assessment | The grade boundaries that determine market access are still being written |
| 2030 | All packaging recyclable by design; EPR fees linked to recyclability grades; mandatory recycled content targets for all plastic packaging | 35% recycled content for non-contact-sensitive polyolefin flexibles; 10% for contact-sensitive |
| 2035 | All packaging recycled at scale — a 55% recycling rate; only grades A to C allowed on the market | Grades D and E are banned outright, which removes the structures nobody has redesigned |
The recycled content target, converted into tonnage
A percentage rule becomes a physical requirement once it meets a tonnage. CEFLEX has done that arithmetic: by 2030, polyolefin-based flexible packaging in Europe will need around 2.5 million tonnes of post-consumer recyclate to satisfy the 35 per cent non-contact-sensitive and 10 per cent contact-sensitive thresholds. Current supply is conservatively estimated at around 1.5 million tonnes. The gap is a million tonnes, and it is not a rounding error in a market that consumes 8.4 million tonnes of the stuff.
Set the two numbers against each other and the implied average recycled content of the European polyolefin flexibles pool is 29.76 per cent — because 2.5 million tonnes divided by 8.4 million tonnes is 29.8 per cent. That is what a 35/10 split means in aggregate once the contact-sensitive share is weighted in. It is also the single most important number in this report for anyone thinking about converter margins: a 30 per cent recycled-content requirement on a material that costs more than virgin resin is a cost line, not a target.
Where the recyclate can actually go
The most uncomfortable finding in the CEFLEX analysis is not the shortfall. It is the destination. Around 80 per cent of mechanical recyclate demand in 2030 is concentrated in a small number of high-volume applications — stretch film, shrink film, refuse sacks and heavy-duty bags. These are the lowest-specification film applications in the market, and they are being asked to absorb the output of a system built to serve the highest-specification ones.
The consequence is stated in the same work: even under favourable assumptions, recycling flexible packaging back into flexible packaging delivers around a 25 per cent recycling rate in 2030, rising to around 42 per cent once open-loop applications — rigid and non-packaging — are included. The 55 per cent recycled-at-scale test in 2035 requires a further step change, and the modelling puts the total recycled material requirement at 5.9 million tonnes in 2035, against a total potential demand across all applications, regulated and unregulated, of about 4.3 million tonnes in 2030. The system is being built to a demand that packaging alone cannot supply and that non-packaging markets will only absorb at a price they choose.
Collection is the binding physical constraint
| Measure | Value | Source basis |
|---|---|---|
| Flexible packaging in separately collected recyclables, by weight | 18.9% Germany, 17.6% Netherlands, 6.8% France, 1.3% UK | CEFLEX multi-country compositional study |
| Flexible packaging in residual waste, by weight | 1.8% Germany, 3.7% Netherlands and France, 5.3% UK | CEFLEX multi-country compositional study |
| Flexible packaging that is already mono-PE or mono-PP | 40–60% depending on country and stream | CEFLEX multi-country compositional study |
| Flexible packaging going to residual, by country | Up to 50%, and nearly 100% in some countries | CEFLEX |
| Post-consumer packaging waste collected for recycling, Europe, 2020 | About 46% | Fraunhofer IVV / SUEZ, 2024 |
| New packaging products containing post-consumer recycled plastic, Europe | About 8.5% | Fraunhofer IVV / SUEZ, 2024 |
| Plastic packaging used in Germany, 2021 | 3.2 Mt used, 3.19 Mt of waste, 55% sent to recycling | Fraunhofer IVV / SUEZ, 2024 |
The German and Dutch numbers show what a functioning separate collection does to a light material: nearly a fifth of the recyclables stream by weight is flexible packaging. The UK number shows what its absence does. Same material, same consumers, a nine-fold difference in capture. Nothing about the polymer changed; only the bin did.
The other jurisdiction that matters
Seven US states now operate producer-responsibility programmes covering packaging, with California’s SB 54 and Oregon’s Recycling Modernization Act the furthest advanced and Colorado, Maine, Minnesota, Maryland and Washington building behind them. None of them sets a recycled-content threshold on flexible film as demanding as the European 35 per cent, and all of them levy a per-tonne fee modulated by recyclability. The direction of travel is identical, the timetable is five to seven years behind, and the practical effect for a global converter is that a structure designed to the European rule will be compliant in the United States and a structure designed to the US rule will not be compliant in Europe. That asymmetry is why the design programme is being run once, in Europe, at European cost.
Questions fréquemment posées
How large is the global flexible packaging market?
The global flexible packaging market is USD 268,000 million across 41.50 million tonnes in 2025, which is a realisation of USD 6,458 a tonne. It reaches USD 370,070 million across 53.63 million tonnes by 2033 — 4.12 per cent a year in value and 3.26 per cent in tonnage. Food retail is the largest end use at 40.0 per cent of value, and polyolefin films are the largest substrate at 44.4 per cent.
Why does flexible packaging grow faster in value than in tonnage?
Because realisation per tonne rises 0.83 per cent a year, from USD 6,458 to USD 6,900, and this is a price effect rather than a mix effect. Every one of the five substrate lines gains realisation between 0.77 and 1.33 per cent a year, so holding the 2025 mix and growing tonnage to 2033 would still produce USD 346,320 million against the modelled USD 370,070 million. The USD 23,750 million difference is the conversion layer repricing a structure whose purchased-material content is 55 per cent of revenue.
Which material is taking share in flexible packaging?
Paper and paperboard flexibles plus cellulose and bio-based structures. Together they are 24.7 per cent of the 2025 market and take 37.1 per cent of the USD 102,070 million increment to 2033. Paper alone grows 5.62 per cent a year against 3.40 per cent for polyolefin films, which lose 2.4 points of share despite still taking 35.7 per cent of the growth. The gain is concentrated in dry goods, produce, bakery and e-commerce where a lower barrier is acceptable.
Is flexible packaging recyclable, and what does the regulation require by 2030?
Partially. Europe's consumer flexible market is about 8.4 million tonnes a year, and CEFLEX estimates 50 to 60 per cent is already mono-PE, mono-PP or mixed polyolefin and therefore mechanically recyclable in principle. But 63 to 84 per cent of food structures are multi-layer and 50 to 70 per cent multi-material, which limits what sorting can achieve. The PPWR requires all packaging to be recyclable by design by 2030, with EPR fees linked to recyclability grades and mandatory recycled content — 35 per cent for non-contact-sensitive polyolefin flexibles, 10 per cent for contact-sensitive. That implies about 2.5 million tonnes of post-consumer recyclate for European polyolefin flexibles in 2030, against a current supply of around 1.5 million tonnes, and recycling input capacity of 7.4 million tonnes against 2.4 million in 2024. By 2035 only packaging in recyclability grades A to C may be placed on the market.