
Global Foodservice Rigid Containers & Clamshells Market Report, Size, Share and Forecast 2026–2033: The Ban Removed the Lightest Container and Replaced It With the Heaviest
Executive summary
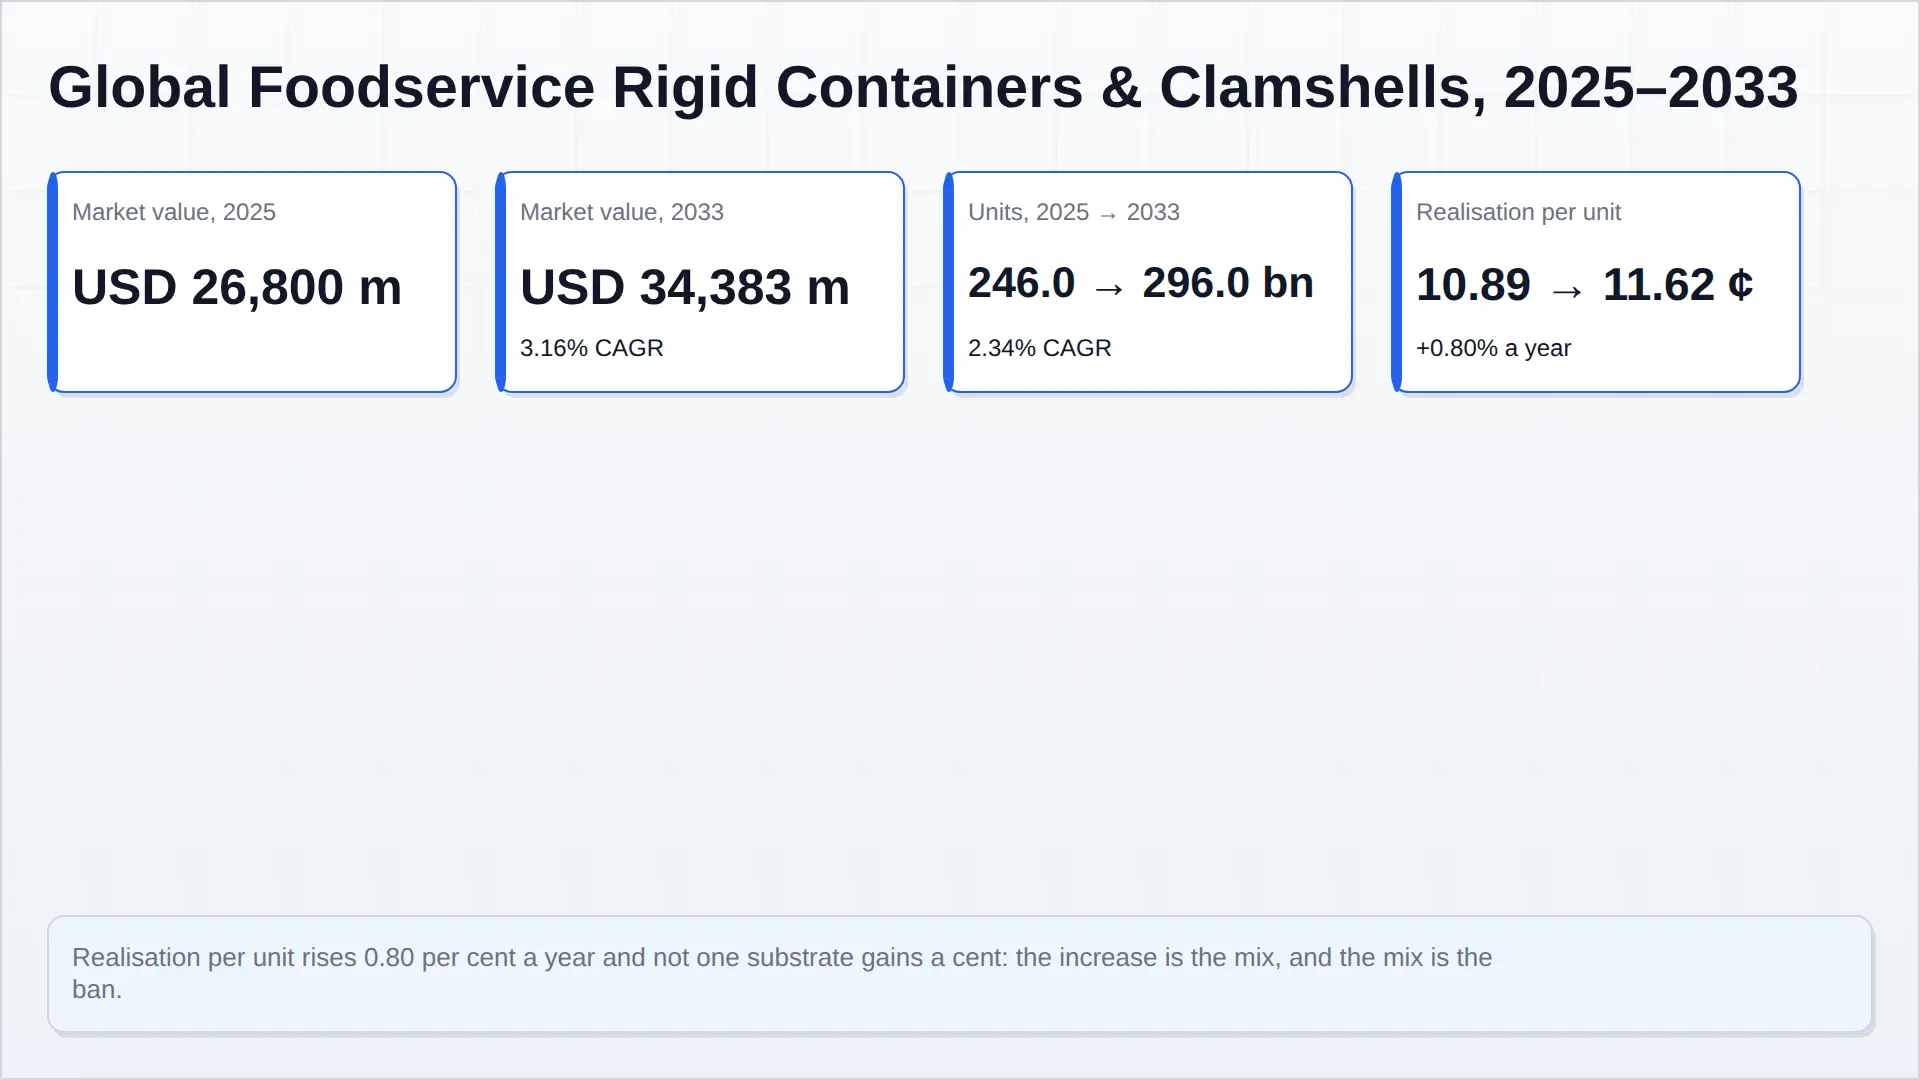
The global foodservice rigid containers and clamshells market is 246.0 billion units and USD 26,800 million at converter realisation in 2025, reaching 296.0 billion units and USD 34,383 million by 2033 — 2.34 per cent unit growth and 3.16 per cent value growth.
Three findings carry the report. First, realisation per unit rises from 10.89 to 11.62 cents at 0.80 per cent a year and not one substrate gains a cent: all five are modelled flat, and the increase is entirely the mix moving from a 5.81-cent EPS container to a 14.10-cent fibre one. Second, the container the regulation removes weighs 13 grams and every compliant substitute weighs 31 to 42, so replacing the EPS pool with fibre adds 1.07 million tonnes of mass to remove 0.48 million tonnes of plastic. Third, the margin in the disclosed seats has roughly halved — Huhtamaki Foodservice from 9.0 to 8.3 per cent, Graphic Packaging Americas Paperboard from 15.06 to 8.94 — while the sales line stayed flat.
The band is plus or minus twelve per cent on the level. The direction is not in doubt.
The ban removed the lightest container in the market and replaced it with the heaviest
Start with the object, because the category name hides it. A foodservice rigid container is the thing a restaurant hands you food in and does not want back: the hinged clamshell, the two-piece deli tub, the bowl with a lid, the three-compartment combo tray, the bakery dome. It is thermoformed from sheet or moulded from pulp, it is filled at a counter or a kitchen line, and it ends its life within the hour. That object — not the retail tray, not the cup, not the healthcare blister — is what this report sizes.
It is a 246.0 billion unit, USD 26,800 million market at converter realisation in 2025, reaching 296.0 billion units and USD 34,383 million by 2033. Those are the level numbers, and they behave differently from the cup market next door. Units grow 2.34 per cent a year. Value grows 3.16 per cent. Realisation per unit therefore rises, from 10.89 to 11.62 US cents, at 0.80 per cent a year.
That is the opposite of the paper cup, which loses 0.94 per cent a year of realisation, and the reason is not that anyone in this market has pricing power. Read the substrate table below: every one of the five substrate lines is modelled at a flat price from 2025 to 2033. Not one gains a cent. The blended figure rises because a container that realises 5.81 cents is leaving the market and a container that realises 14.10 cents is arriving.
| Headline | 2025 | 2033 | CAGR |
|---|---|---|---|
| Market value, converter realisation | USD 26,800 m | USD 34,383 m | 3.16% |
| Volume | 246.0 bn units | 296.0 bn units | 2.34% |
| Realisation per unit | 10.89 US cents | 11.62 US cents | +0.80% |
| Value multiple over the forecast | 1.28× | ||
| Total container mass | 7.47 m tonnes | 8.31 m tonnes | 1.34% |
| Of which fossil plastic | 5.39 m tonnes | 4.51 m tonnes | −2.19% |
| Scenario band, 2033 | USD 30.2 bn – 39.6 bn | — | |
The split that matters
| Substrate | 2025 value | 2025 units | Realisation | 2033 value | 2033 units | Value CAGR |
|---|---|---|---|---|---|---|
| Polypropylene | USD 11,792 m | 118.08 bn | 9.99 ¢ | USD 13,287 m | 133.0 bn | 1.5% |
| PET / rPET | USD 5,360 m | 36.90 bn | 14.53 ¢ | USD 6,902 m | 47.5 bn | 3.2% |
| Moulded fibre | USD 5,896 m | 41.82 bn | 14.10 ¢ | USD 10,913 m | 77.4 bn | 8.0% |
| EPS foam | USD 2,144 m | 36.90 bn | 5.81 ¢ | USD 1,360 m | 23.4 bn | −5.5% |
| Other (board, PLA, aluminium) | USD 1,608 m | 12.30 bn | 13.07 ¢ | USD 1,921 m | 14.7 bn | 2.2% |
| Total | USD 26,800 m | 246.0 bn | 10.89 ¢ | USD 34,383 m | 296.0 bn | 3.16% |
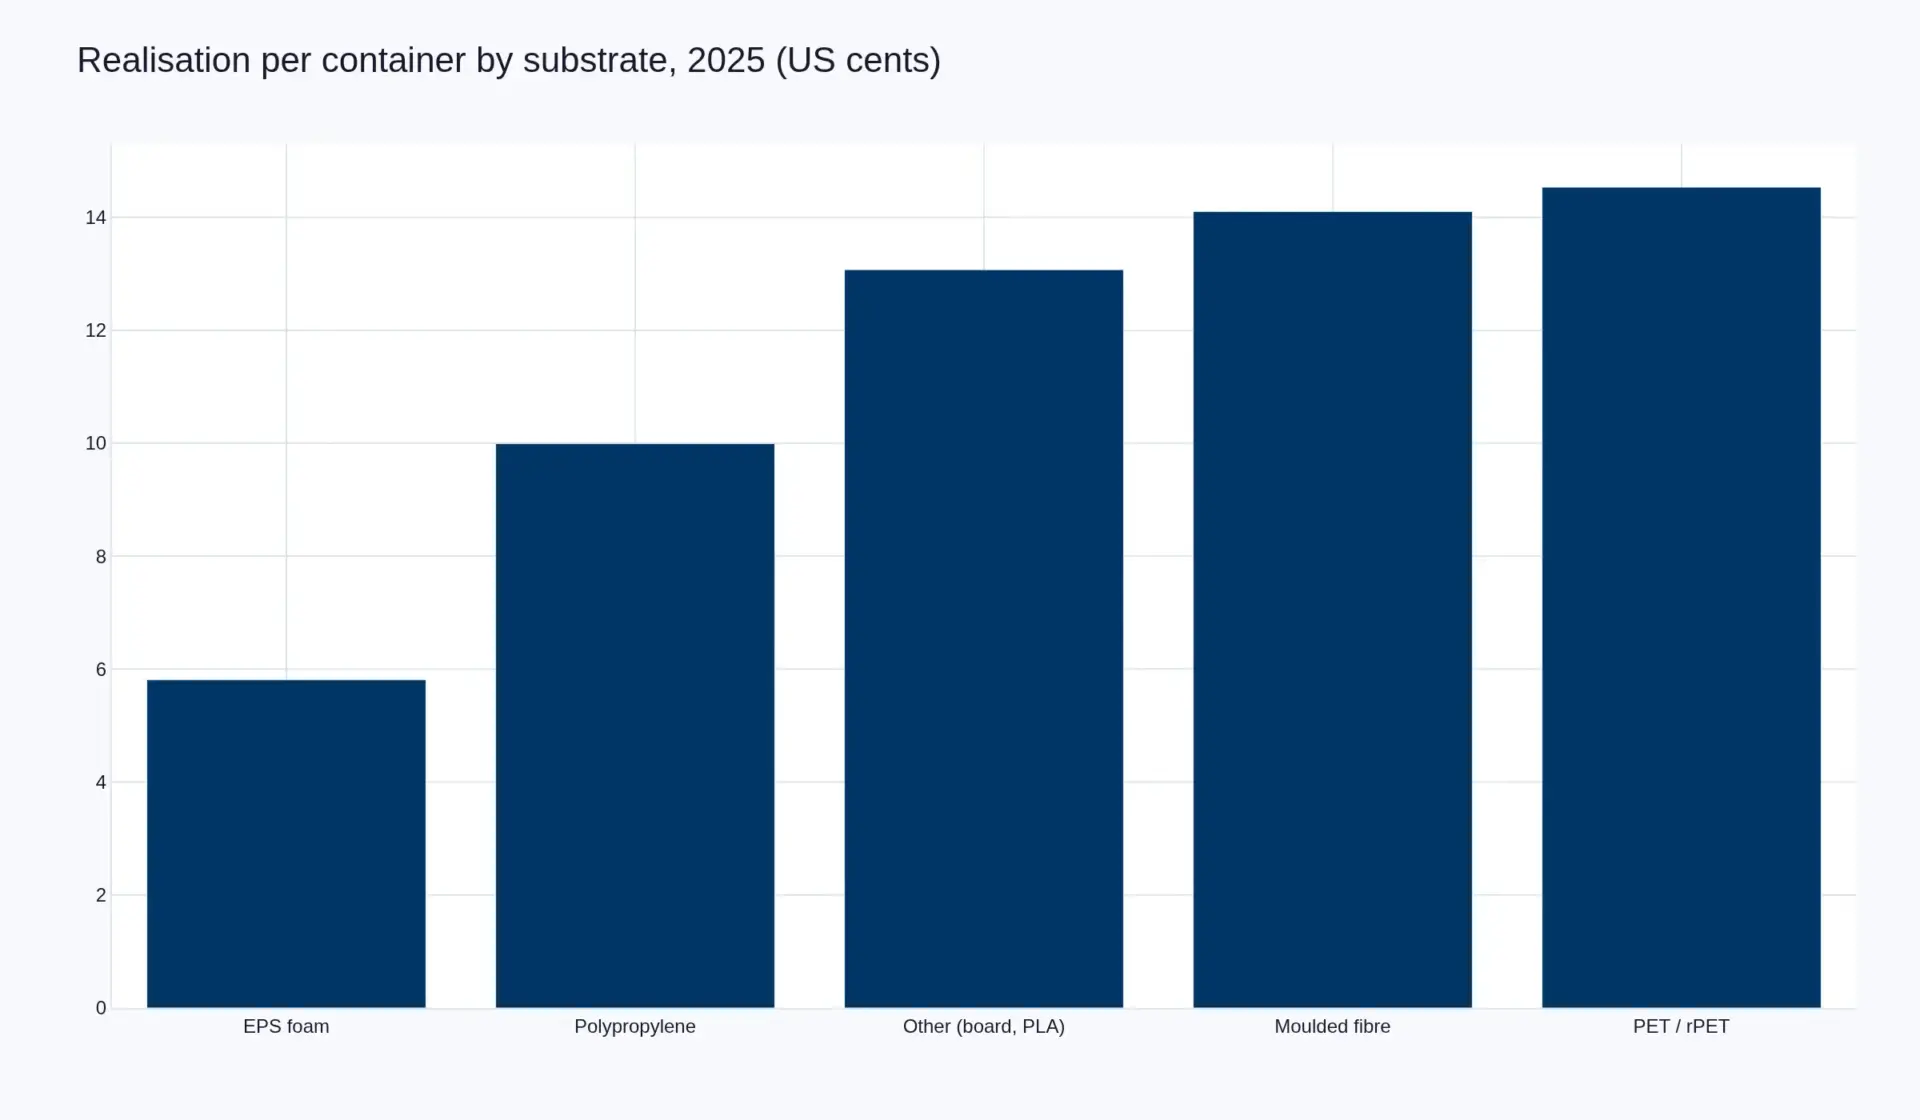
Decompose it, because the arithmetic is the report. Hold the 2025 substrate mix constant and grow the market to 296.0 billion units: 2033 value is USD 32,246 million. The actual figure is USD 34,383 million. The difference — USD 2,137 million, or 6.2 per cent of the 2033 market — exists only because the mix changed. That is the size of the regulatory transfer, and it is being booked as market growth.
What the substitution costs in grams
Here is the physical fact that makes the financial one strange. Weigh the formats.
| Format | Typical unit weight | Realisation | Material cost per unit | Material share of price |
|---|---|---|---|---|
| EPS clamshell, 9×9 in | 13 g | 5.81 ¢ | 1.69 ¢ | 29.1% |
| PP hinged clamshell, 9×9 in | 31 g | 9.99 ¢ | 3.41 ¢ | 34.1% |
| PET two-piece deli container | 34 g | 14.53 ¢ | 3.91 ¢ | 26.9% |
| Moulded fibre clamshell | 42 g | 14.10 ¢ | 3.57 ¢ | 25.3% |
The container the statutes remove is the lightest one in the market. Every compliant substitute is 2.4 to 3.2 times heavier. Replacing the entire 36.9 billion unit EPS pool with moulded fibre would add 1,070,000 tonnes of container mass to a market that already moves 7.47 million tonnes — a 14.3 per cent increase in everything that has to be made, palletised, shipped and collected, in exchange for removing 480,000 tonnes of plastic. Replace it with polypropylene instead and the addition is 664,000 tonnes.
So two policy instruments now point in opposite directions on the same object. The material bans, which are what actually moved this market, are written against a substrate and reward the lighter-to-recycle answer. The extended producer responsibility fees, which are what will price it, are levied per tonne and modulated by recyclability — so they charge for the mass the substitution creates while rewarding the grade it delivers. The converter stands in the middle and eats the difference, and the difference is why realisation rises while margins fall.
Regional structure
| Region | 2025 value | Share | Value CAGR to 2033 | What sets the pace |
|---|---|---|---|---|
| North America | USD 8,308 m | 31.0% | 2.4% | Substrate substitution, not volume growth |
| Asia-Pacific | USD 8,576 m | 32.0% | 4.0% | Delivery density and QSR unit openings |
| Europe | USD 6,432 m | 24.0% | 2.9% | PPWR implementation and re-use targets |
| Latin America | USD 2,144 m | 8.0% | 3.6% | Delivery growth off a low base |
| Middle East & Africa | USD 1,340 m | 5.0% | 4.4% | QSR expansion and import dependence |
| Total | USD 26,800 m | 100% | 3.16% |
Regional shares are Pheonix estimates. They are not sourced from any single published table, because the published tables available commercially disagree with each other by a factor of two on the global level — they differ on whether cups and lids sit inside the pool, whether retail trays do, and whether the price basis is converter realisation, distributor price or operator spend. Section six states the band that follows from that.
What is inside this number and what is not
Inside: clamshells and hinged containers; two-piece tubs and deli containers; bowls, platters and combo trays; bakery and dessert containers; foodservice pails and portion pots; the lids sold with those containers other than drink lids. Sold to quick-service and fast-casual chains, independent operators, caterers, contract caterers, hospitals, schools and workplace canteens.
Outside: drink cups and their lids, which are sized separately in the Global Paper Cups & Lids Market 2026–2033; retail and CPG trays, which are sold to a supermarket rather than an operator; healthcare sterile barrier systems, a different regulatory regime entirely; and closures, cutlery and bags.
Two existing Pheonix reports bracket this one and should be read against it. The Europe Monodose Packaging Market 2026–2033 is the same thermoforming economics at clinical unit-dose scale, where the format is set by a filling machine rather than a menu. The Peru Thermoformed Packaging Market 2026–2033 is the clearest worked example of a single dated prohibition rebuilding a national format, and it is the closest analogue to what the twelve state EPS statutes are now doing to a 36.9 billion unit pool.
The base is a Pheonix model built from a unit count and a realisation ladder, and section six sets out the band around it: roughly plus or minus twelve per cent on the level, and considerably narrower than that on the direction, because the direction is visible in twelve state statutes and two sets of published segment accounts.
Articles on this market
Table des matières
Contents
Seven sections. Each states what it establishes and what test it applies, so a reader can go to the section that answers the question in front of them. The forecast rests on two numbers that move in the same direction for opposite reasons — 2.34 per cent on units and 3.16 per cent on value — and every section below tests one of them.
| Section | What it establishes | Test it applies |
|---|---|---|
| 1. The ban removed the lightest container and replaced it with the heaviest | Definition, exclusions, the 2025 base of 246.0 billion units and USD 26,800 million, the substrate split, the mass arithmetic and the regional structure | What is counted, how much of it there is, and what the substitution physically costs |
| 2. Competitive landscape | Why a market built on thousands of tools has no category owner, and what the two disclosed seats earn | Whether any supplier can hold price |
| 3. Value chain | The 9.99 cents between a resin pellet and a counter, and who takes each part of it | Where the margin sits and who sets it |
| 4. Investment activity | The 2.56-million-dollar fibre line, capital per annual unit, and why incumbents stopped spending | Where capacity is being added, in which substrate |
| 5. Technology and innovation | Three grams of resin and twenty-nine grams of consequence: weight, barrier, dry moulded fibre, food-grade recycled feedstock | Whether the mix path in the forecast is physically buildable |
| 6. Market risk | Three scenarios, the sensitivity of each variable, four risks that break the base case and three falsifiers | What would prove this report wrong, and how quickly |
| 7. Regulatory landscape | Twelve state EPS statutes, seven state EPR regimes, the EU packaging regulation and the PFAS exit | Whether the pricing half of the forecast is legislated or aspirational |
At a glance
| Measure | 2025 | 2033 | CAGR |
|---|---|---|---|
| Value, converter realisation | USD 26,800 m | USD 34,383 m | 3.16% |
| Volume | 246.0 bn units | 296.0 bn units | 2.34% |
| Realisation per unit | 10.89 US cents | 11.62 US cents | +0.80% |
| Moulded fibre share of units | 17.0% | 26.1% | — |
| EPS share of units | 15.0% | 7.9% | — |
| Scenario band, 2033 | USD 30.2 bn – 39.6 bn | — | |
How to read the split. The unit forecast is a bet on foodservice occasions and on the container holding its share of the takeaway meal; it can be checked quarterly against restaurant transaction counts and distributor case volumes. The value forecast is a bet on the substrate mix, not on price — every substrate is modelled flat. A reader who accepts the units and rejects the mix should use 2.34 per cent on both and treat the remaining 0.82 points as a regulatory outcome rather than a revenue one.
Paysage concurrentiel
Thousands of tools and no owner of the category
This is a large market with no champion, and the reason is not consolidation failure. It is that the unit of competition is a tool, not a product.
Where a beverage company buys one cup specification nationally, a foodservice chain buys a menu: a 9×9 clamshell for the burger, a 6×6 for the side, a three-compartment for the combo, a bowl for the salad, a platter for the family meal, a dessert container, a bakery dome, each in two or three sizes and often in two substrates. Multiply that by a few hundred chains and a few thousand regional operators and the tool population runs into the thousands. Every tool is a separate qualification, a separate approval, a separate changeover. Nothing about that structure rewards scale the way a cup line does.
The disclosed seats, and what they say
| Company | Disclosed segment | Latest measure | Year earlier | What it tells you |
|---|---|---|---|---|
| Graphic Packaging | Americas Paperboard Packaging | Q3 2026 operating margin 8.94% on USD 1,476 m of sales | 15.06% on USD 1,474 m | Flat revenue, operating income down 40.5% |
| Graphic Packaging | Americas Paperboard Packaging | Nine months 2026 8.40% | 14.28% | Deterioration is structural, not a quarter |
| Huhtamaki | Foodservice Packaging | H1 2026 adjusted EBIT 8.3% | 9.0% | Includes a EUR 16 m impairment for footprint optimisation |
| Novolex (with Pactiv Evergreen) | Not disclosed | Private | — | More than 250 brands and 39,000 SKUs, broadest substrate set |
| Dart Container | Not disclosed | Private | — | Scale in both plastic and moulded fibre |
Read the margins as the same story told at two companies. A business converting sheet into a container is running at eight to nine per cent operating margin where it ran at fourteen to fifteen a year earlier, and it did so on flat sales. Huhtamaki’s EUR 16 million impairment inside Foodservice is the accounting term for closing capacity that is no longer needed. Neither company lost share to a rival; both lost margin to a substrate transition they are paying for and cannot price.
What competition actually turns on
Six variables, none proprietary, and the ranking matters more than the list.
- Sheet buying. Resin and sheet are 34 per cent of realisation and globally traded. A converter buying on a formula at scale buys the same tonne cheaper than one buying spot, and the difference is larger than the entire operating margin.
- Cavitation and cycle time. The machine is bought, not invented. Two converters with the same tooling earn different margins purely on how many cavities they run and how fast the sheet heats.
- Tooling breadth. A converter who can supply the whole menu from one plant wins the account; one who can supply half of it supplies none. This is why multi-substrate houses keep winning distribution even as their margins fall.
- Freight density. Containers are 80 to 90 per cent air. A plant more than about 500 kilometres from the customer carries a structural penalty that no efficiency programme recovers.
- Lid fit and leak performance. The least discussed and most decisive. A container that fails in a delivery bag is a rejection, and re-qualification runs to quarters.
- Compliance documentation. Food-contact declarations, PFAS-free substantiation and recyclability evidence now attach per SKU. A converter running 400 items carries 400, and this cost scales with customer count rather than with volume.
The buyer is far more concentrated than the seller
Supply is fragmented across thousands of thermoformers, pulp moulders and integrated houses. Demand is not. A few dozen quick-service and fast-casual chains specify containers nationally, fix a unit price against a specification, and put volume out to a small number of qualified suppliers. Between them sits the broadline distributor, which is the actual gatekeeper for everyone who is not a national account: it takes the margin on the independent operator, decides what appears in the catalogue, and increasingly carries its own brand made by whoever will run it cheapest.
Fragmented supply selling into concentrated demand through an intermediary that owns the route to market is a margin structure. It is not the converter’s margin. And it explains the price line in Graphic Packaging’s third quarter: net sales up USD 2 million on volume and mix up 1 per cent, or USD 19 million, and price down 1 per cent, or USD 15 million, in the same quarter that input and operating cost inflation added USD 83 million to the cost line.
Why no tier-one player can exist
Three conditions create national or global champions in packaging, and this market has none of them. Feedstock is not owned: resin and pulp come from merchants and integrated mills, so nobody can secure input on terms a rival cannot match. The machine is bought, not invented: a thermoformer is a capital purchase available to any converter with a bank facility, at one and a half to two million dollars. And the customer specifies to a price against a menu, not to a system, so there is no installed base to lock in and no aftermarket annuity.
Compare that with a market that does consolidate. In in vitro diagnostics the instrument is placed and the reagent annuity follows for a decade, which is why that market has four global players. A clamshell is the opposite: a consumable bought per thousand with no captive aftermarket. Consolidation here therefore happens for distribution and substrate breadth, not for share of a product — which is precisely the logic of the Novolex and Pactiv Evergreen combination, and why the combined company’s disclosed assets are more than 250 brands and 39,000 SKUs rather than a bigger clamshell line.
The one structural advantage, and how long it lasts
Vertical integration into substrate. A converter that owns a mill or a sheet line can defend a spread through a resin cycle, and in a year when resin rose and price fell, that was the only defence available. Huhtamaki’s fibre investment and Graphic Packaging’s mill system are the two clearest examples, and both are constrained by deleveraging rather than by strategy — Graphic Packaging carried net debt of USD 5,183 million at 4.8 times at 30 September 2026 against 3.8 times at the start of the year.
Every other advantage in this market is temporary. That is not a criticism of the participants; it is the structure they operate in, and it is why the fight has moved from share of containers to share of the substrate decision. The Global Packaging Market 2026–2033 sets out the wider board and resin cycle this market inherits.
Chaîne de valeur
Value chain
Five stages sit between a resin pellet and a container full of food, and the money is not distributed evenly across them. Priced at the blended polypropylene realisation of USD 99.86 per thousand containers, this is what a hinged clamshell actually costs.
| Stage | Who | USD per 1,000 | Share of realisation | Margin character |
|---|---|---|---|---|
| Resin or sheet, 31 kg at about USD 1,100/t | Polymer producers, sheet extruders | 34.10 | 34.1% | Cyclical, globally priced, not the converter’s to set |
| Colour, additives, masterbatch | Compounders | 2.40 | 2.4% | Small, technical, occasionally the difference between a pass and a fail |
| Forming energy | Converters | 4.80 | 4.8% | Machine-hour driven |
| Direct labour | Converters | 8.20 | 8.2% | Shift pattern driven; does not flex with volume |
| Tooling amortisation | Converters | 3.60 | 3.6% | Per SKU, not per tonne — the structural cost of a chain’s menu |
| Corrugated and packaging | Converters | 8.70 | 8.7% | Volume driven, and heavier than the product it protects |
| Outbound freight | Converters, third-party logistics | 11.40 | 11.4% | Distance driven; containers ship as air |
| Scrap and quality | Converters | 4.10 | 4.1% | The quietest leak in the plant |
| Selling, general and administrative | Converters | 13.40 | 13.4% | The largest controllable line |
| Operating margin | Converters | 9.16 | 9.2% | Reconciles to the 8.3–8.9 per cent the disclosed segments report |
Cost shares are Pheonix estimates for a nine-inch polypropylene clamshell at US realisation, built from sheet price, cycle time, cavitation and observed conversion economics. They are not transaction data; no converter publishes a cost stack. The table’s purpose is not precision. It is to show that resin is a third of the price, freight is a ninth, and the converter controls neither.
What that means in dollars
Resin is USD 34.10 of every thousand containers sold, or 3.4 cents each, against a realisation of 9.99 cents. Freight and packaging together are another 20.1 cents — twice the operating margin. Everything the converter genuinely controls, from forming energy to SG&A, is a fight over 30 cents per thousand, and the discretionary part of it is smaller still, because depreciation on a machine and wages on a shift do not flex with price.
This is why the industry’s response to a halved margin is never one thing. A gram off the wall, a point off scrap, a pallet pattern that fits four more units, one line consolidated out, one distributor term renegotiated. Four savings that each look like rounding, and together they are the margin.
The fibre inversion
Now look at what happens when the substrate changes, because it explains the whole capital cycle.
| PP clamshell | Moulded fibre clamshell | |
|---|---|---|
| Unit weight | 31 g | 42 g |
| Material cost per unit | 3.41 ¢ | 3.57 ¢ |
| Realisation per unit | 9.99 ¢ | 14.10 ¢ |
| Material share of price | 34.1% | 25.3% |
| Capital per annual unit of capacity | about 3.5 ¢ | 8.5–12.8 ¢ |
| Energy per unit | Lower | Higher — water, drying, pressing |
The material cost of the two formats is almost identical — 3.41 cents against 3.57. The 41 per cent price premium for fibre is not paid for material. It is paid for capital recovery, drying energy, lower line output and the qualification work that goes with a newer process. That is a crucial distinction for anyone modelling this transition as a materials-cost story: fibre is dearer because it is more capital-intensive per unit, and it is more capital-intensive per unit because a pulp line needs more machine to make fewer containers.
Who takes the money, stage by stage
- The polymer producer takes a commodity margin on resin, which is cyclical and currently soft. It carries no specification risk on the container.
- The sheet extruder takes a conversion spread on turning pellet into roll, and is the first to feel a shift in substrate because the machine is dedicated.
- The converter takes 8 to 10 per cent operating margin, in which the entire variance of the industry sits. It carries tooling, customer qualification and working capital, and it is the party that absorbs the difference between what a fee schedule charges and what a customer will pay.
- The distributor takes a margin on every operator who is not a national account, and owns the catalogue and the credit. In the independent channel the distributor is the price-setter, not the converter.
- The operator pays 10 to 22 cents a container delivered, against a ticket that may be twelve dollars, and treats it as a rounding item until a fee schedule or a chain standard makes it a visible line.
That last point is the commercial opening for anyone selling into this market. A clamshell is about 0.2 per cent of the ticket. It becomes a management subject only when the cost of the container stops being a container cost — when a producer-responsibility fee, a recyclability grade or a chain-level substrate mandate attaches to it. The Europe PFAS-Free Food Contact Packaging Market 2026–2033 sets out the barrier half of that shift, and the Peru Thermoformed Packaging Market 2026–2033 is the clearest case of a single prohibition re-pricing a whole format inside two years.
Where the chain leaks value
- Nesting ratio. Containers ship as air. A clamshell redesigned for two millimetres more nesting is worth more than a gram of resin, and it is invisible on a unit price.
- Cavitation. A tool running 8 cavities instead of 12 on the same platen is a third of the output for the same floor space, labour and energy. Cavitation is the single largest determinant of converter cost and it is set at the design stage.
- Changeover. Every chain’s menu is a tool set. A four-hour changeover against a two-week order cycle turns a profitable account into a scheduling problem.
- Lid fit and leak. A container that leaks in a delivery bag is scrap at the customer, not at the plant, and the cost of a delivery-platform complaint is not measured in containers.
Activité d'investissement
Investment activity
The most important fact about capital in this market in 2026 is that it is moving between substrates, not into capacity. The integrated converters have stopped spending; the fibre converters have started.
| Company | Measure | 2024 | 2025 | 2026 |
|---|---|---|---|---|
| Graphic Packaging | Capital expenditure | USD 1,203 m | USD 935 m | Guided below USD 450 m |
| Adjusted cash flow | Guided USD 600–700 m against USD 169 m in 2025 | |||
| Net leverage | 3.8× at year-end 2025 | 4.8× at 30 September 2026 | ||
| Huhtamaki | Foodservice impairment | EUR 16 m, footprint optimisation | ||
The capex fall is not a loss of faith in containers. It is the arithmetic of a completed build programme meeting a debt wall, and it converts capital spending into cash flow for two or three years. In that window the only new capacity that gets built is capacity someone else pays for — and in this market, someone else is paying for fibre.
The fibre line, priced
On 2 October 2026 Pulp Moulded Products committed CAD 3.643 million, about USD 2.56 million, to a new production line and an automated pressing cell at its Keswick, Ontario plant, supported by a CAD 1.5 million contribution from FedDev Ontario. That is a small project, and it is the most useful number in this chapter, because it prices a unit of fibre capacity.
| Measure | Moulded fibre line | Thermoforming line | Cup forming line |
|---|---|---|---|
| Typical capital cost | USD 2.56 m, announced | USD 1.5–2.0 m | USD 2.0 m |
| Estimated annual output | 20–30 m units | 35–45 m units | 57.6 m units |
| Capital per annual unit | 8.5–12.8 ¢ | about 4.4–5.7 ¢ | about 3.5 ¢ |
Output estimates for the fibre and thermoforming lines are Pheonix estimates; the capital figures are announced or observed. Read the bottom row as the whole investment case. A fibre line costs more and produces fewer containers than either alternative, which is why the 41 per cent price premium in the value chain chapter is not margin — it is capital recovery, drying energy and lower line output.
The payback, per line
At a 14.10 cent realisation and the 9.2 per cent operating margin the value chain reconciles to, a fibre line producing 25 million containers a year earns about USD 324,000 a year against USD 2.56 million of capital. That is a 7.9-year payback. If realisation falls to 12.60 cents as fibre capacity arrives, the same line earns USD 290,000 and the payback extends to 8.8 years. A thermoformer at 9.99 cents on 40 million units earns USD 368,000 on USD 1.75 million — 4.8 years.
Those two numbers explain the capital cycle. Fibre only gets built where a customer contract, a subsidy or a regulatory date underwrites the payback, which is why the announcements cluster around public co-funding and around states with a ban already in force. It is not a technology problem. It is a payback problem.
Where the capacity is going
- Fibre, in North America and Europe. Dart’s Lancaster plant reaching full operational capacity in October 2026, after Mason, Michigan in 2019, is the clearest signal: a company whose core business is plastic and foam now runs wet and dry moulded fibre in the same portfolio.
- Fibre, at small scale and with public money. The Ontario project is USD 2.56 million with a 41 per cent grant contribution. That is the shape of most fibre capacity being added: sub-five-million-dollar lines, co-funded, close to a customer.
- Recycled PET sheet, upstream. rPET sheet capacity tracks bottle collection rather than container demand, and it is the input that determines whether a mono-PET container can meet a recycled-content threshold.
- Nothing in EPS. No new EPS foodservice container capacity of consequence is being announced in any jurisdiction with a statute on its books. The pool is not closing plants; it is simply not renewing them.
The consolidation trade
Novolex completed its combination with Pactiv Evergreen on 1 April 2025, in a transaction valued at approximately USD 6.7 billion including net debt, at USD 18.00 a share — a 49 per cent premium to the two-month unaffected volume weighted average price. The combined company carries more than 250 brands and 39,000 SKUs across what it describes as one of the most diverse substrate sets in the industry.
That is a substrate-breadth play, not a container-share play. Its logic is that the customer is an operator who wants one supplier across containers, cups, cutlery and bags, and that a supplier who can offer paper, moulded fibre and plastic can follow that customer whichever way a fee schedule pushes them. It is the only strategy in this market that answers the substitution question instead of betting on one side of it — and it is why the next round of consolidation is more likely to be between substrate portfolios than between competitors in the same format.
Technologie et innovation
Technology and innovation
Nothing in a clamshell is new. The machine is a heated platen and a vacuum box, the material is a commodity, and the geometry is a box with a hinge. What has changed is that the choice of substrate has become a legal decision rather than an engineering one, and that is where all the technical activity now sits.
Four formats, weighed
| Format | Unit weight | Barrier | Heat | Recycling stream | Where it wins |
|---|---|---|---|---|---|
| EPS foam | 13 g | Closed cell; inherently insulating | Hot-hold excellent | Technically recyclable; almost no collection | Cost, insulation, hot-hold time |
| Polypropylene | 31 g | Good grease and moisture resistance | Microwave safe | PP stream; household access limited | The default compliant answer for hot food |
| PET / rPET | 34 g | Excellent; clarity | Low heat tolerance | Highest-access plastic stream | Cold, deli, bakery, visible product |
| Moulded fibre | 42 g | PFAS-free chemistry required | Microwave and oven to about 200°C | Paper stream, where collected | Grease, ovenability, the complaint file |
The weight column is the one to keep. The market is migrating from a 13-gram answer to a 31-to-42-gram answer, and the consequence is not a detail: it is a 14.3 per cent increase in total container mass if the EPS pool converts to fibre, and it is why freight is 11.4 per cent of realisation and rising in the mix.
Dry moulded fibre is the technology that matters
Wet moulding is a century-old process: slurry onto a screen, vacuum, dry, press. It is cheap and it is slow, and it forces rounded geometry because a wet shell cannot hold a sharp corner. Dry moulded fibre forms an air-laid fibre web and presses it in a heated tool, which allows tighter tolerances, sharper geometry, faster cycles and — critically — the dimensional consistency a snap-fit lid needs.
That is why the capacity announcements are the tell. On 13 October 2026 Dart confirmed its Lancaster, Pennsylvania facility had reached full operational capacity producing moulded-fibre trays, containers and bowls, and stated explicitly that it runs both wet moulded fibre and next-generation dry moulded fibre. Dart has offered fibre since 2008 and began investing in domestic manufacturing in 2019 at Mason, Michigan. Its fibre products are declared grease-resistant and PFAS-free, home and commercially compostable, more than 75 per cent renewable content, and microwave or oven safe to 400°F for 30 minutes.
A converter running both processes in one plant is not making a sustainability statement. It is hedging the tooling decision, because wet and dry fibre need different tools and the customer has not yet decided which geometry it wants.
The PFAS exit is what made fibre possible, and what makes it expensive
Grease resistance in a fibre container is a harder problem than water resistance, and it used to be solved with fluorochemistry. That solution no longer exists in the United States. The FDA confirmed in February 2024 that PFAS-containing grease-proofing agents were no longer being sold into the US market, and in January 2025 gave notice that 35 food-contact notifications for those substances were no longer effective.
The replacement chemistry is a barrier layer applied as a dispersion or a film, and every route has a cost. A PFAS-free barrier adds roughly 4 to 9 per cent to the cost of a fibre container, on top of a substrate already 41 per cent dearer than polypropylene, and must be shown food-contact compliant per formulation rather than per family. This is the quiet reason fibre’s share gain runs behind its press coverage: the substrate won the argument and then had to rebuild its own performance from scratch.
Food-grade recycled feedstock is the binding constraint, and it is not fibre
For the plastic half of the market, the constraint is not machine capacity and it is not demand. It is food-grade recycled resin, and the numbers are now measurable. NAPCOR’s 2024 PET Recycling Report puts the US PET bottle recycling rate at 30.2 per cent in 2024, down from a revised 32.5 per cent in 2023 and still above the prior decade’s 29.5 per cent average, with the North American bottle collection rate at 39.2 per cent. Against that, PET thermoform recovery reached 264 million pounds in the US and Canada, up 52 per cent year on year.
Read those two figures together and the position becomes clear. Collection infrastructure was built around the bottle, not the clamshell, and the 52 per cent growth in thermoform recovery is growth off a small base: a deli container is still mostly made from virgin resin because the material that could be recycled into it is being collected somewhere else, in a different format, at a different reclaimer.
Polypropylene is worse. There is no food-grade recycled PP of consequence at commercial scale, collection of small rigid PP items is poor, and a mixed-colour container is a sortation problem before it is a recycling one. So the two halves of this market face opposite constraints: fibre is constrained by cost and barrier, plastic by feedstock. That is the real reason the substrate contest is not resolving — neither side can yet do the whole job at the incumbent’s price.
Design, where the money actually is
Three design decisions outweigh every chemistry question in this market, and none of them is visible to a buyer.
- Nesting ratio. Containers ship as air. Two millimetres more nesting per unit is worth more than a gram of resin, because freight is 11.4 per cent of realisation and resin is 34.1 per cent — but only one of them can be designed away.
- Wall thickness tolerance. Sheet gauge variation of five per cent across a roll is five per cent of the resin bill, invisibly spread across millions of units. It is the largest recoverable sum in a container plant and the hardest to see on a per-unit price.
- Mono-material construction. A container with a PE liner, a PP body and a PET label is not recyclable in any stream, whatever its substrate says. Under the recyclability performance grades arriving in Europe from 2030 that is a specification which will be priced out — and it is the specification much delivery packaging currently uses.
Risque de marché
Market risk and the scenario band
Before the risks, the data problem, because it governs how much weight any of this can carry.
There is no published global container count and no published container revenue line anywhere in the market. The figures that circulate commercially are built on incompatible definitions — some include cups and lids, some include retail trays, some quote operator spend rather than converter realisation — and they diverge by a factor of two. This report therefore states its own arithmetic, shows each step, and puts a band around the result rather than a decimal point.
The band is roughly plus or minus 12 per cent on the 2025 level. It is tighter than the band on the cup market for one reason: this market’s unit base can be anchored against operator menus and distributor case volumes, which are observable, rather than against a per-head consumption rate that has no reference. The direction is much more certain than the level, because the direction is written into twelve statutes and is visible in two sets of published segment accounts.
The three scenarios
| Scenario | Unit CAGR | 2033 units | Value CAGR | 2033 value |
|---|---|---|---|---|
| Slow | 1.6% | 279.3 bn | 2.2% | USD 31,896 m |
| Base | 2.34% | 296.0 bn | 3.16% | USD 34,383 m |
| Accelerated | 3.0% | 311.6 bn | 4.0% | USD 36,678 m |
The gap between the outer cases is USD 4,782 million on the same population and the same statutes. Nearly all of it sits in two variables — how fast EPS converts rather than merely declines, and whether fibre capacity arrives at a cost the customer will pay. Both are observable, which is the point of building the forecast this way.
What one per cent is worth
| Variable | Move | Effect on the 2033 market | What it tells you |
|---|---|---|---|
| Unit volume | ±1% | ±USD 344 m | A normal year’s variance; not a threat to the base |
| Realisation per unit | ±1% | ±USD 344 m | Identical to volume, mechanically |
| Substrate mix | Fibre 5 points lower by 2033 | about −USD 1,780 m | The mix is the forecast, not the demand |
| Growth path | One point high (4.0% value) | USD 36,678 m against 34,383 m — +USD 2,295 m | The path dominates the level |
| Base year | 2025 pool 12% lower | 2033 falls proportionally to USD 30,257 m | Why the band is stated rather than a point estimate |
Two conclusions. First, a one-point error in the growth path is nearly seven times more consequential than any plausible volume shock, so attention belongs on the path rather than the level. Second, the mix assumption is the single largest discretionary judgement in this report, worth more than the whole base-year uncertainty — which is why the falsifier list is written around it.
Four risks that can break the base case
- Fibre capacity arriving faster than cost. The base assumes fibre’s realisation falls from 14.10 to about 12.60 cents as capacity builds. If it falls to 11 cents, fibre takes share faster but adds less value, and 2033 value lands near the slow case even though units are at base. This is the most likely way for the forecast to be wrong in the interesting direction.
- The fee schedule reading mass. If any large jurisdiction writes a producer fee that reads mass as well as recyclability, the economics of the whole substitution invert: polypropylene, at 31 grams against fibre’s 42, becomes the compliant answer on the metric that costs money and the fibre share path flattens. Nothing in the current statutes does this. It is the single regulatory change that would falsify the substrate forecast without falsifying the units.
- Delivery volume going flat. Containers are levered to takeaway occasions, and takeaway was levered to the price gap between eating in and eating out. In the US, food services and drinking places ran at USD 92,906 million in September 2026, and the growth in that series has been almost entirely nominal. If occasions fall in real terms, units go with them — and unlike cups, there is no per-head consumption floor to catch them.
- A recycled-content threshold that PP cannot meet. If the 2030 recycled-content requirement reaches a polypropylene food container and food-grade recycled PP is still unavailable, PP’s 46 per cent unit share is exposed to a substitution not into fibre but into PET — a different and higher-value outcome than the base assumes.
Three falsifiers
These are the observations that would say the thesis is wrong before the market size does.
- Blended realisation per unit flat or falling for two consecutive years. The thesis is that realisation rises on mix alone. If it stops rising while the substrate mix is still shifting, the mix effect is being given away in price — which would mean the converters absorbed the regulatory transfer rather than passed it, and the value forecast is too high.
- EPS share of units above 13 per cent in 2028. The base has EPS at 15.0 per cent in 2025 falling to 7.9 by 2033. If exemptions and enforcement gaps hold it near 13 per cent in 2028, both the mix effect and the mass arithmetic in this report are overstated.
- Moulded fibre below 22 per cent of units in 2029. Fibre is the mechanism behind the whole value forecast. Capacity announcements without volume would be the signal that the payback arithmetic has beaten the regulatory case.
What to watch, by lead time
| Indicator | What it tells you | Lead time |
|---|---|---|
| Graphic Packaging’s price and volume lines, quarterly | Whether container realisation is holding as mix shifts | One quarter |
| Moulded-fibre capacity announcements with a named customer | Whether the payback is being underwritten | Two to four quarters |
| State EPR fee schedules as they are set | Whether fees read mass, recyclability, or both | One to three years |
| Food-grade recycled PP availability | Whether polypropylene’s share is exposed | Two years |
| Operator delivery volumes, quarterly | The unit base, before it reaches a converter’s order book | One quarter |
Paysage réglementaire
Regulatory landscape
This market is not being shaped by consumer preference. It is being shaped by twelve state statutes, and the fastest way to understand the forecast is to read them as a single instrument.
Twelve states, one substrate
| State | Instrument | What it prohibits | In force |
|---|---|---|---|
| California | Pub. Res. Code, EPS food service ware | Sale or distribution of EPS trays, plates, bowls, clamshells, lids and hinged containers by producers, unless a 25 per cent recycling rate is demonstrated | 1 January 2025 |
| Colorado | HB21-1162 | Retail food establishments distributing EPS containers for ready-to-eat food | 1 January 2024 |
| Delaware | 16 Del. C. ch. 30Q | Providing ready-to-eat food in foam food service packaging | 1 July 2025; penalties from 1 July 2026 |
| Maine | 38 M.R.S. §1571–1572 | Processing, preparing, selling or providing food in disposable polystyrene foam containers | 2021 |
| Maryland | Environment Code | Selling EPS food service products, and selling food in them | 1 July 2020 |
| New Jersey | P.L.2020, c.117 | Sale of foam food service products including containers, trays and clamshells | 4 May 2022 |
| New York | Environmental Conservation Law | Disposable EPS bowls, cups, trays and clamshells; packing peanuts | 2022 |
| Oregon | ORS 459A | Sale and provision of polystyrene foam food containers | 2025 |
| Rhode Island | General Laws | Food service establishments providing food in polystyrene foam | In force |
| Vermont | Stat. Ann. tit. 18 | Food and food service in polystyrene foam containers | 2020 |
| Virginia | Code of Virginia | Food service establishments providing food in polystyrene foam | 2025 |
| Washington | RCW 70A.245 | Sale and provision of EPS food service products | 2024 |
Two features of this list do more work than the count. First, the prohibitions differ in who they bind: California binds producers and attaches a recycling-rate test that has not been met, while most of the others bind food service businesses directly, and six states also restrict selling the empty container. A supplier selling into several states therefore faces not one rule but a matrix, and the strictest clause sets the specification nationally because a chain does not run two menus. Second, the exemptions are where the remaining volume sits: raw meat, poultry, fish and egg trays are carved out in several states, New Jersey’s exemption for those runs to May 2027 and Maine’s to July 2027, and hospitals, nursing homes and correctional facilities are frequently exempted. That is why the EPS pool does not go to zero on any of these dates.
The fee schedule is the instrument that matters next
Seven states now have extended producer responsibility statutes for packaging — California (SB 54), Colorado (HB 22-1355), Maine (LD 1541), Maryland (SB 901), Minnesota (HF 3911), Oregon’s Plastic Pollution and Recycling Modernization Act, and Washington (SB 5284). All of them levy a producer fee, and all of them modulate that fee by recyclability and recycled content.
Here is the contradiction this report exists to point at. A producer fee is denominated per tonne and modulated by recyclability. Banning EPS improves the recyclability grade of the average container and raises its mass by roughly two and a half times. The material statutes and the fee statutes are therefore pushing on the same object in opposite directions, and the converter is the only party that pays for both.
That is not an argument against the rules. It is an argument that a fee schedule reading only recyclability will select for the heaviest compliant container, and that a schedule reading mass and recyclability together would select a different one. It is also the mechanism behind the forecast: the mix moves because it is priced to move, and the price that moves it is not on any customer’s purchase order.
Europe: three dates and one definition
Regulation (EU) 2025/40 replaces the 1994 packaging directive and applies as a regulation, which removes the member-state variation that made the old regime uneven. Three provisions bind this market.
- 2030 — design for recycling and performance grades. Packaging must be designed for material recycling, with a grading system from 2030 and stricter requirements from 2038. A three-material container with a PE liner and a PET label cannot reach a good grade, and the grade will be priced.
- 2030 — minimum recycled content in plastic packaging, with the contact-sensitive calculation defined by implementing act. For a polypropylene clamshell this is the hardest single requirement in the regime, because food-grade recycled PP barely exists.
- 2035 — recyclable at scale. The requirement that packaging be collected, sorted and recycled at scale becomes operative. That is the provision that decides whether a container with limited household collection is compliant regardless of what it is made from.
And one definition carries more weight than the three dates. Under the single-use plastics framework, an acrylic or polymeric barrier dispersion is still a polymer. A fibre container marketed as plastic-free can therefore be a plastic-coated container in law, carrying the marking and the fee band that follow. That is why serious fibre converters specify to a fibre content threshold by weight — Huhtamaki’s lower-plastic board is specified to a minimum of 95 per cent fibre — rather than to a chemistry. As our own analysis in The Cup Is Five Products sets out, the contest is coat weight against legal definition, and the two are decided in different rooms.
Compliance cost is per SKU, not per tonne
The burden falls unevenly because it attaches to the stock-keeping unit rather than to the volume. A converter running 400 container sizes and prints carries a food-contact declaration, a migration assessment, a PFAS-free substantiation and a print approval for each; a converter running 20 carries 20. In a market where every chain wants its own menu, that is a structural cost that scales with customer count rather than with tonnes — and it is the quiet reason consolidation into distributors and broad-range suppliers keeps winning even as their margins compress.